3D-Reconstruction of a Giant Posidonia oceanica Beach Wrack (Banquette): Sizing Biomass, Carbon and Nutrient Stocks by Combining Field Data With High-Resolution UAV Photogrammetry
 Agostino Tomasello1
  Alessandro Bosman2,3*
  Geraldina Signa1,4*
  Sante Francesco Rende3
  Cristina Andolina1,4
  Giovanna Cilluffo1,4
  Federica Paola Cassetti1
  Antonio Mazzola1,4 Sebastiano Calvo1 Giovanni Randazzo5 Alfonso Scarpato3
  Salvatrice Vizzini1,4
- 1Department of Earth and Marine Sciences (DiSTeM), University of Palermo, Palermo, Italy
- 2Institute of Environmental Geology and Geoengineering, National Research Council (CNR-IGAG), Rome, Italy
- 3Department for Environmental Monitoring and Protection and Biodiversity Conservation (BIO-DIR), National Institute for Environmental Protection and Research (ISPRA), Rome, Italy
- 4National Inter-University Consortium for Marine Sciences (CoNISMa), Rome, Italy
- 5Department of Mathematics and Computer Science, Physics and Earth Sciences, University of Messina, Messina, Italy
Beach wracks are temporary accumulations of vegetal detritus that can be found along coastlines all over the world. Although beach wracks are often perceived as a nuisance for beach users, they play a crucial ecological role in carbon and nutrient connectivity across ecosystem boundaries, especially when they reach a relevant size, as in the case of the wedge-shaped seagrass accumulations called banquette. In this study, three-dimensional mapping of a giant Posidonia oceanica banquette was carried out for the first time using high-resolution UAV photogrammetry combined with field sampling and compositional and chemical analysis. The combined approach allowed a reliable estimation of the amount and spatial distribution of both vegetal biomass and sedimentary mass, as well as of total carbon, nitrogen and phosphorus content, revealing that i) banquette act as a sediment trap and represent hot spots of seagrass biomass and carbon accumulation; ii) banquette thickness, rather than the distance from the sea, influences the spatial distribution of all variables. Moreover, high-resolution digital elevation models (DEM) revealed discontinuous patterns in detritus accumulation resulting in an unknown banquette type here termed “Multiple Mega-Ridge banquette” (MMR banquette). On the one hand, this study highlighted the high potential of the UAV approach in very accurately 3D mapping and monitoring of these structures, with relevant implications for ecosystem service estimation and coastal zone management. On the other hand, it opened new questions about the role played by temporary beach wracks and, in particular, by P. oceanica banquette in the blue carbon exchange across land-ocean boundaries.
1 Introduction
Beach wracks are temporary accumulations of detached seagrasses and, to a lesser extent, macroalgae drifting along the shorelines, and they represent a significant fraction of primary production exported through waves and currents from blue carbon ecosystems (Duarte, 2017). They play a critical role in protecting the shoreline from coastal erosion (De Falco et al., 2008; Boudouresque et al., 2016). Being a temporary sink of biogenic carbon and nutrients (Mateo et al., 2003; Jiménez et al., 2017), beach wracks provide an important energy subsidy to adjoining coastal systems and dunes (Del Vecchio et al., 2013; Del Vecchio et al., 2017), supporting beach biodiversity and trophic webs (Lastra et al., 2008; Colombini et al., 2009; Beltran et al., 2020). However, in general, beach users consider these detrital accumulations a nuisance, prompting local administrators and beach managers to find sustainable solutions for their management (Mossbauer et al., 2012; Rotini et al., 2020). Because of the important implications for the connectivity between marine and terrestrial habitats, as well as coastal zone management, monitoring of beach wracks is a priority nowadays. To our knowledge, the first attempt in this direction was made along the Kenyan coast using a visual assessment technique, which required very time-consuming and demanding fieldwork (Ochieng and Erftemeijer, 1999) and produced highly uncertain outcomes, since beach wrack shapes are not comparable with standard geometric figures. At a later date, a video-monitoring and photo-shooting approach, using fixed cameras deployed on coastal beaches, was applied to seagrass wrack depositions along the German Baltic, Danish, Spanish and Italian coastlines (Mossbauer et al., 2012; Gómez-Pujol et al., 2013; Simeone et al., 2013; Pan et al., 2022). While this approach is certainly less expensive and time-consuming than a visual assessment, there are evident technical limitations, mainly related to the fixed position of the cameras.
In the last two decades, a new approach based on Unmanned Aerial Vehicles (UAVs) has been increasingly used for surveying and mapping terrestrial and coastal ecosystems. This approach bridges the gap between field assessment and traditional remote sensing while overcoming the logistic and economic constraints of both approaches (Anderson and Gaston, 2013). Briefly, the main advantages of UAVs stem from their low cost, small size, and lightweight, together with a high automation level and photographic accuracy (Remondino et al., 2011; Anderson and Gaston, 2013). UAVs fly at low altitudes even over remote and inaccessible areas (Castellanos-Galindo et al., 2019), providing rapid, cost-effective, and high-resolution topographic mapping and 3D-reconstructions (Remondino et al., 2011). These aspects make UAVs incredibly versatile and suitable for addressing many aspects of coastal zone monitoring and management, as recently reviewed by Adade et al. (2021). In more detail, the most frequent environmental UAV applications today are mapping and classification of sensitive ecosystems (e.g., Casella et al., 2017; Murfitt et al., 2017; Castellanos-Galindo et al., 2019; Tomasello et al., 2020), marine fauna (Schofield et al., 2019) and marine litter (Deidun et al., 2018), and monitoring of beach morpho-dynamics (Apostolopoulos and Nikolakopoulos, 2021 and references therein; Randazzo et al., 2021). UAVs were also used to map seagrass beach wracks by applying a two-dimensional mapping approach (Ventura et al., 2018; Pan et al., 2021), whereas, to our knowledge, three-dimensional mapping has never been carried out, although it is a necessary condition for obtaining good estimates of the volume and biomass of beach wracks, especially very large-sized ones.
Posidonia oceanica (L.) Delile, 1813 is an endemic seagrass of the Mediterranean Sea, where it plays key ecological roles and provides multiple ecosystem services (Vizzini, 2009; Campagne et al., 2014; Ondiviela et al., 2014). A large volume of seagrass biomass is seasonally detached from living plants by autumn and winter storms and reaches the coast where it may accumulate forming accumulations that vary from ephemeral and scattered small piles to much more compact structures up to several metres high (Gómez-Pujol et al., 2013; Boudouresque et al., 2016) that are known as banquette (Boudouresque and Meinesz, 1982; de Grissac, 1984). Due to a combination of hydrodynamic and geomorphological factors, sheltered beaches are particularly affected by the accumulation of seagrass litter occurring mainly from autumn to spring and characterised by marked spatial and temporal dynamics (Mateo, 2010; Simeone and De Falco, 2012; Simeone et al., 2013).
In light of the crucial ecological role played by seagrass beach wracks, as described above, and, in particular, of their function as a temporary sink/source of biogenic carbon and nutrients, we propose an innovative combined framework for estimating their size, along with biomass and nutrient bulk. More specifically, we show how the integration of high-resolution UAV photogrammetry with field sampling and laboratory analyses allows the estimation, with a high degree of accuracy, of the vegetal biomass, nutrient (carbon, nitrogen, and phosphorus) and sediment content of even very large seagrass beach wracks, such as, in this study, the largest P. oceanica banquette ever described.
2 Materials and Methods
2.1 Study Area
The study was conducted at Faro beach within the area of Capo Feto, on the westernmost coast of Sicily, located between the towns of Mazara del Vallo and Marsala (Figure 1). Faro beach is a north-south oriented beach, about 600 m long, exposed to the west sectors where seagrass litter accumulates along the shore forming a wide banquette (Figure 2A). The back dune hosts an ecologically important wide salt marsh protected by several European Community regulations (Pernice et al., 2004) while offshore, the marine coastal area hosts a large Posidonia oceanica meadow growing on matte (Di Carlo et al., 2005), which is one of the largest P. oceanica meadows in the Mediterranean Sea (Calvo et al., 2010). P. oceanica also forms shallow barrier reefs that run parallel to the coastline and trap seagrass detritus (leaves, rhizomes and roots) that is then pushed toward the beach by strong winds and waves (Maccarrone, 2010).
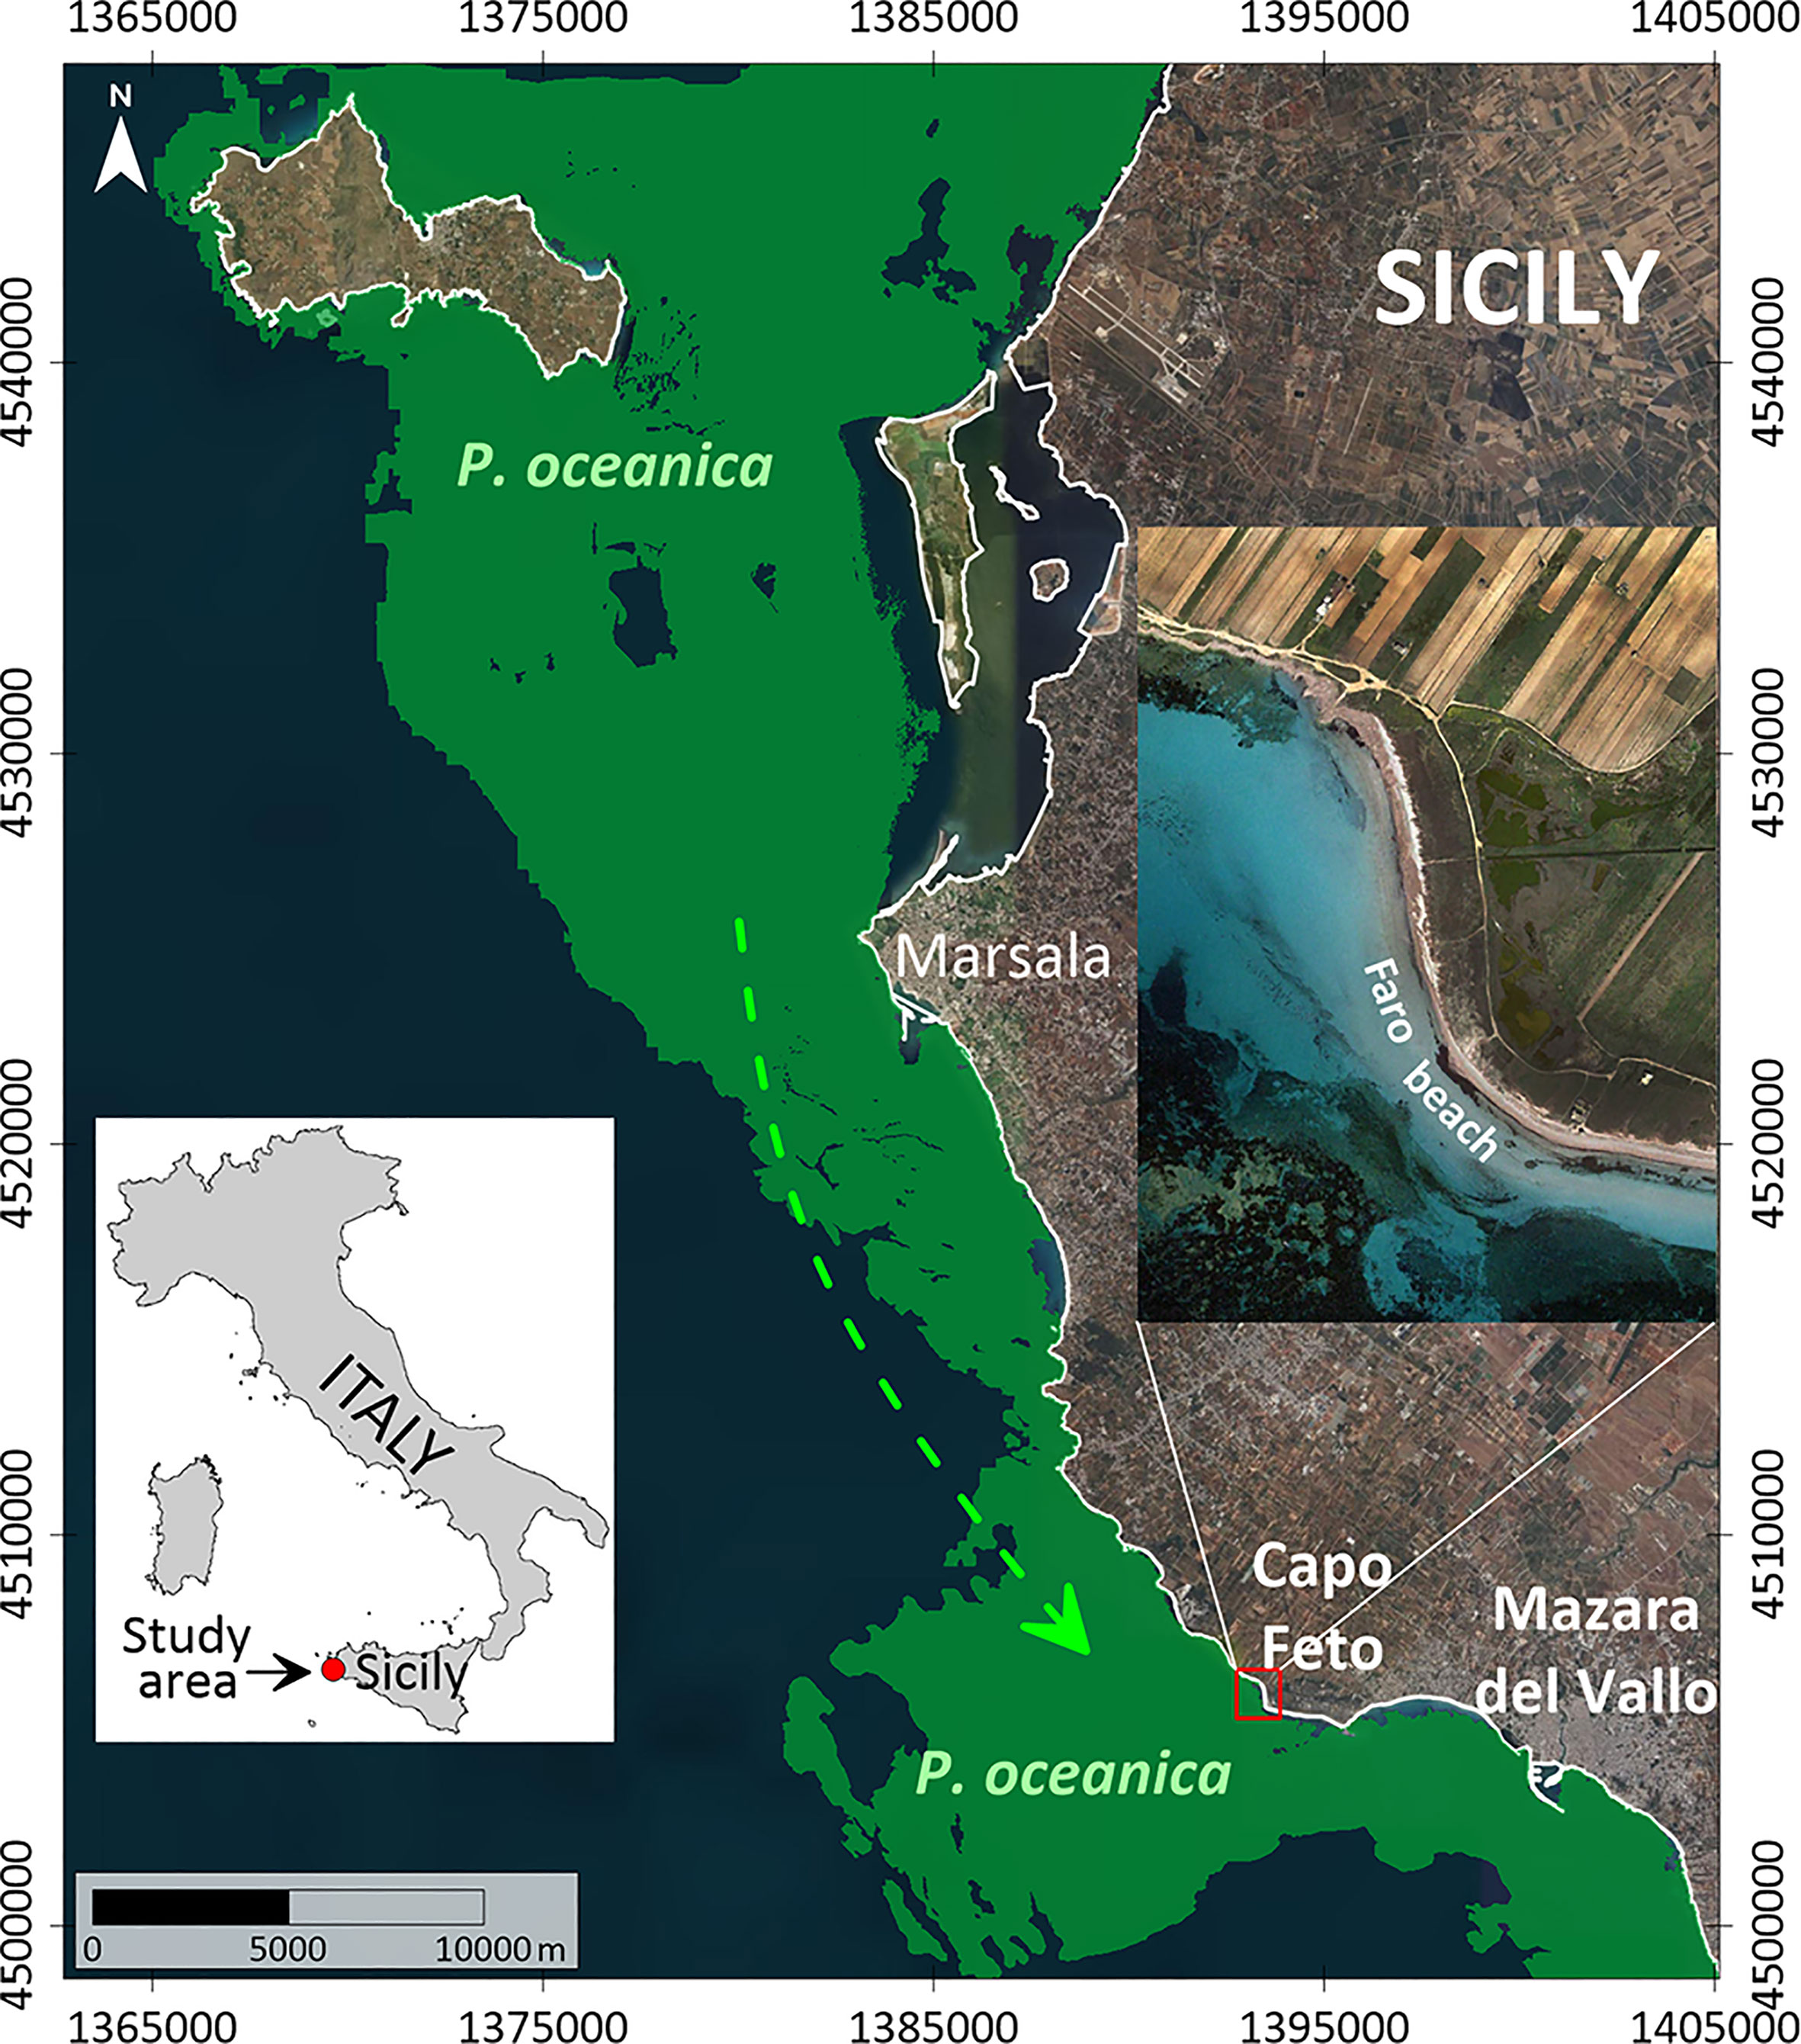
Figure 1 Location of the study area in the western sector of Sicily Island and Faro beach within the Capo Feto area. The green area shows the distribution of Posidonia oceanica, green the white arrow indicates the prevalent direction of the littoral drift.
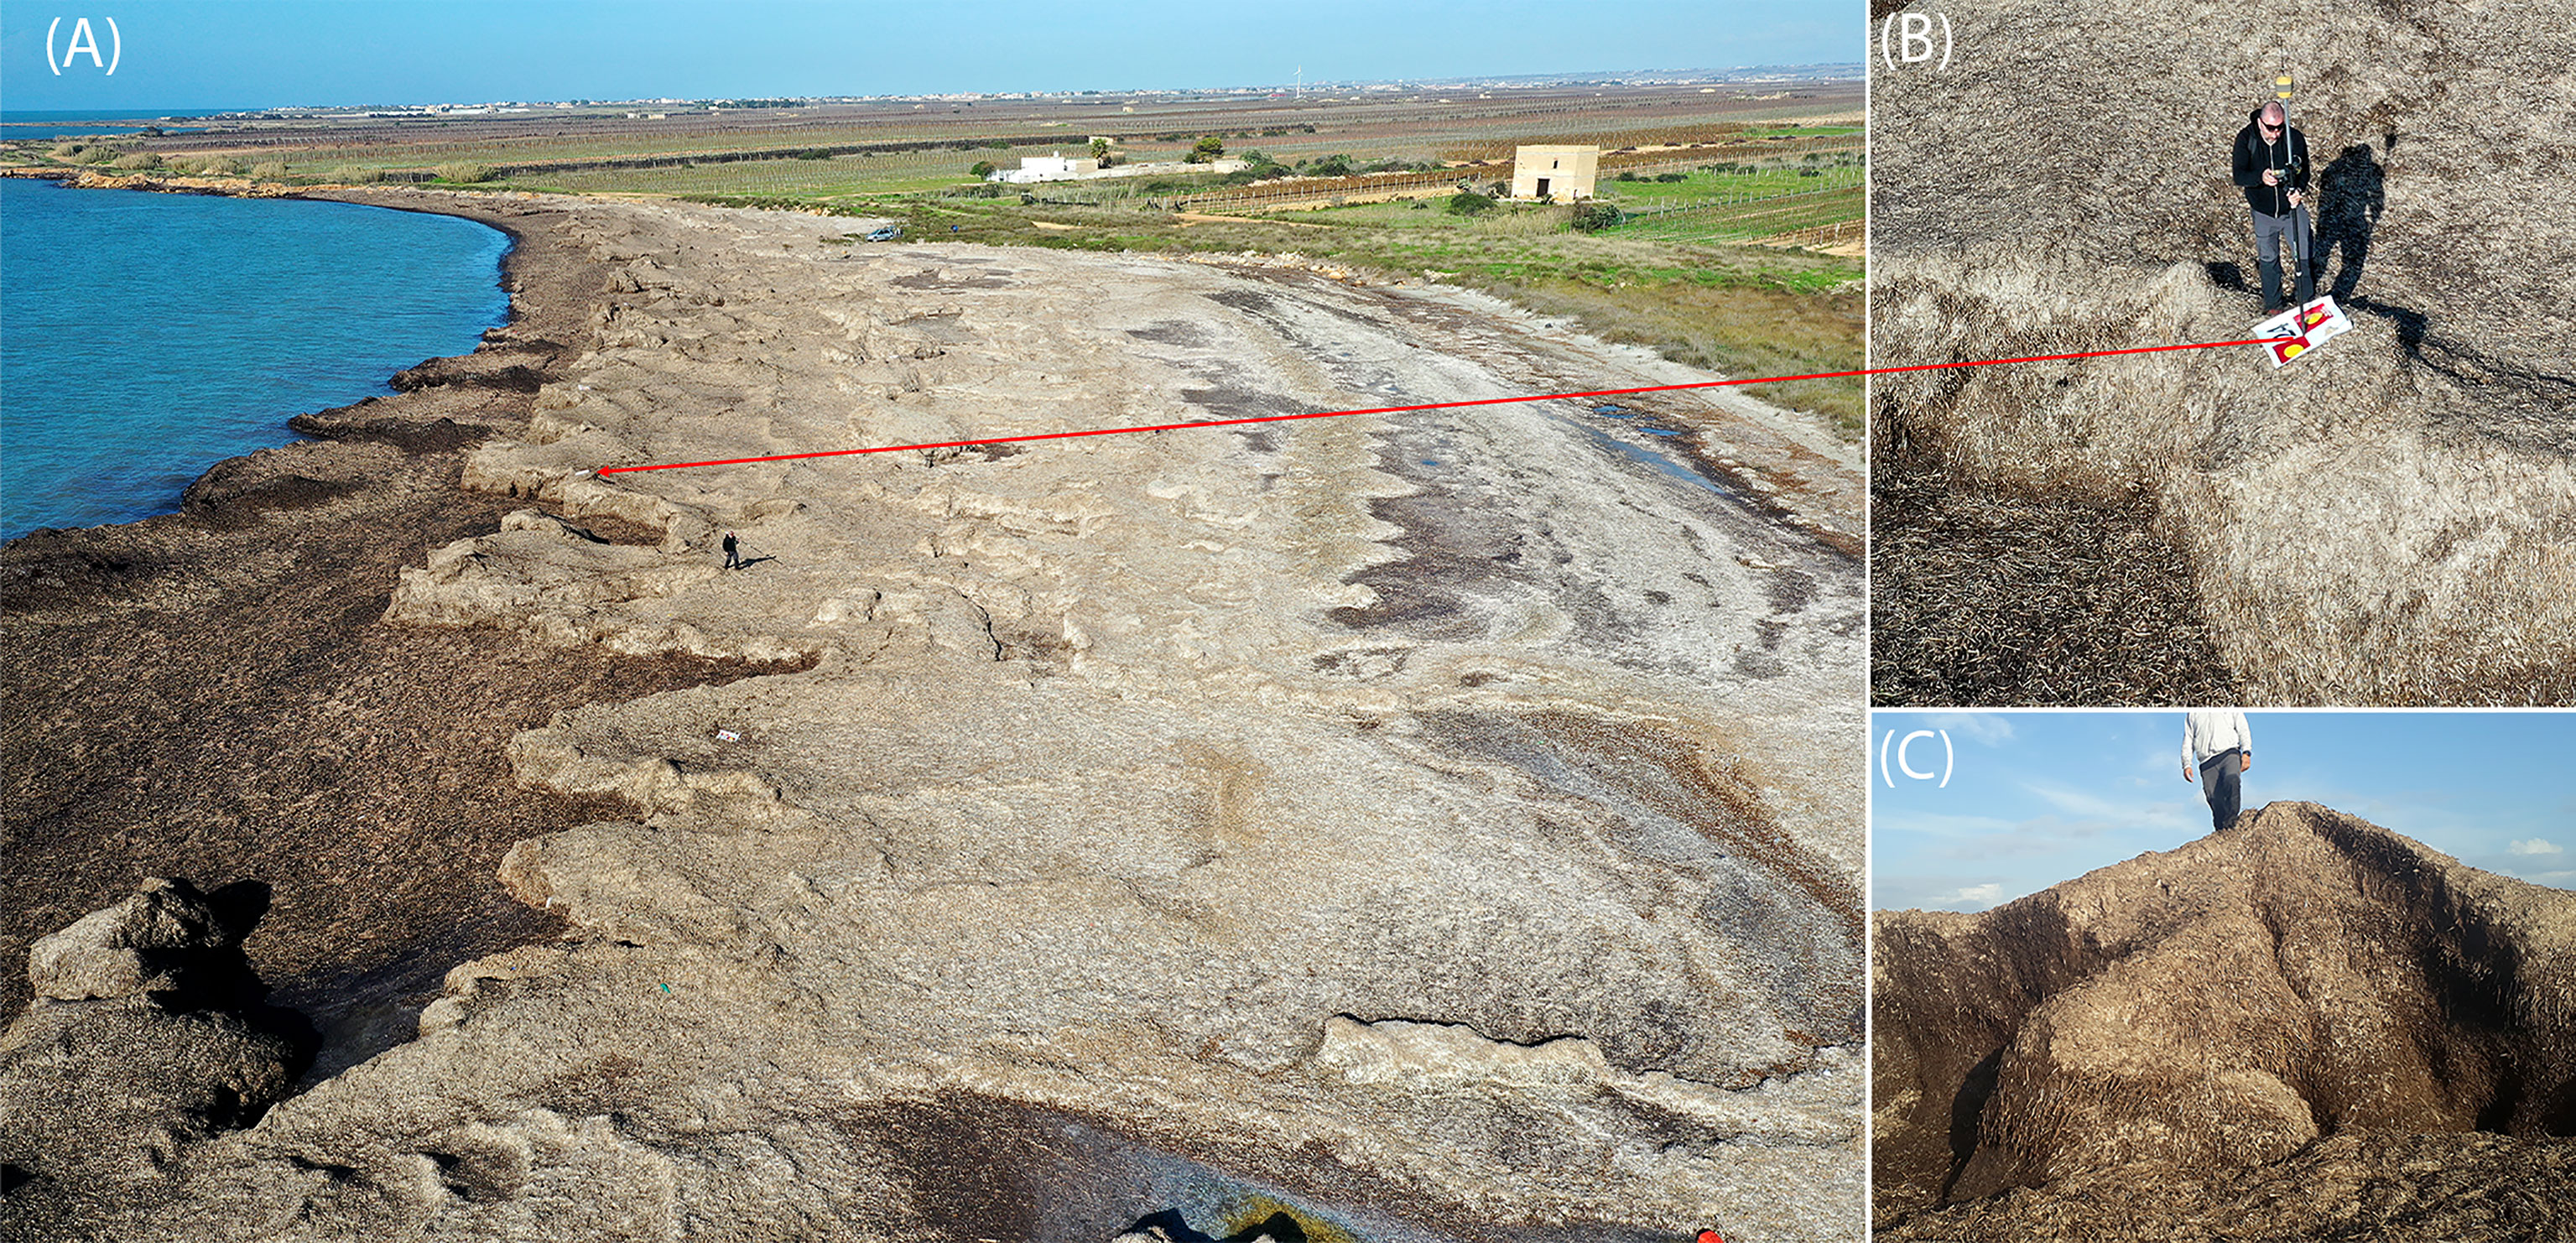
Figure 2 (A) Aerial photograph of the banquette along the coast of Faro beach in the Capo Feto area. (B) Ground control point (GCP) measurement by GNSS receiver. (C) Detail of a banquette Mega-ridge.
Dominant westerly winter winds generate high-energy waves over the shallow seagrass meadows of Capo Feto (Di Carlo et al., 2005). To describe in more detail the hydrodynamic regime in the study area, we used a hindcasting model provided by the NOAA (National Oceanic and Atmospheric Administration) (Chawla et al., 2013) and the new Climate Forecast System Reanalysis Reforecast (CFSRR) (https://polar.ncep.noaa.gov/waves/hindcasts/) of the National Center for Environmental Prediction (NCEP). The graph polar of wave climate (Supplementary Figure 1A) shows that the main storms come from the western sectors, while small storms come from the South-eastern (SE) slopes with frequencies lower than 8%. Indeed, a dominant wave climate comes predominantly from the WNW (between 280° and 300°) with maximum fetch available (Supplementary Figure 1B), open to the West (270°). This attack direction shows a general WNW - SES wave development and causes a general south-eastward littoral drift (Randazzo and Lanza, 2020).
2.2 Image Data Acquisition and Processing
2.2.1 Image Data Acquisition
An inspection of sequences of historical images from Google Earth enabled evaluation of the very high variability of the extent of seagrass litter accumulations in the area, which can range from 0 to about 100 m in width from the shoreline towards the sea. In particular, we surveyed the area both when the banquette was totally absent (here defined as pre-banquette) to collect data about the morphological structure of the beach, and when a large banquette was present (post-banquette) to calculate its magnitude. In this paper, we present data collected on 21 February 2019 and 05 December 2019, which represent the absence and presence of banquette, respectively (Figures 3A, B). To reconstruct the morphological features of the beach and the coastline before the deposition of the banquette, the first survey was conducted in three different sub-areas (Figure 3A), using a DJI Mavic 1 equipped with a camera with a frame 1/2.3 CMOS sized 12.35 Mpx sensor. The focal length was 26 mm (35 mm format equivalent) and the flight distance from the ground was 30 m, resulting in a ground sampling distance spanning from 1 cm/pixel.
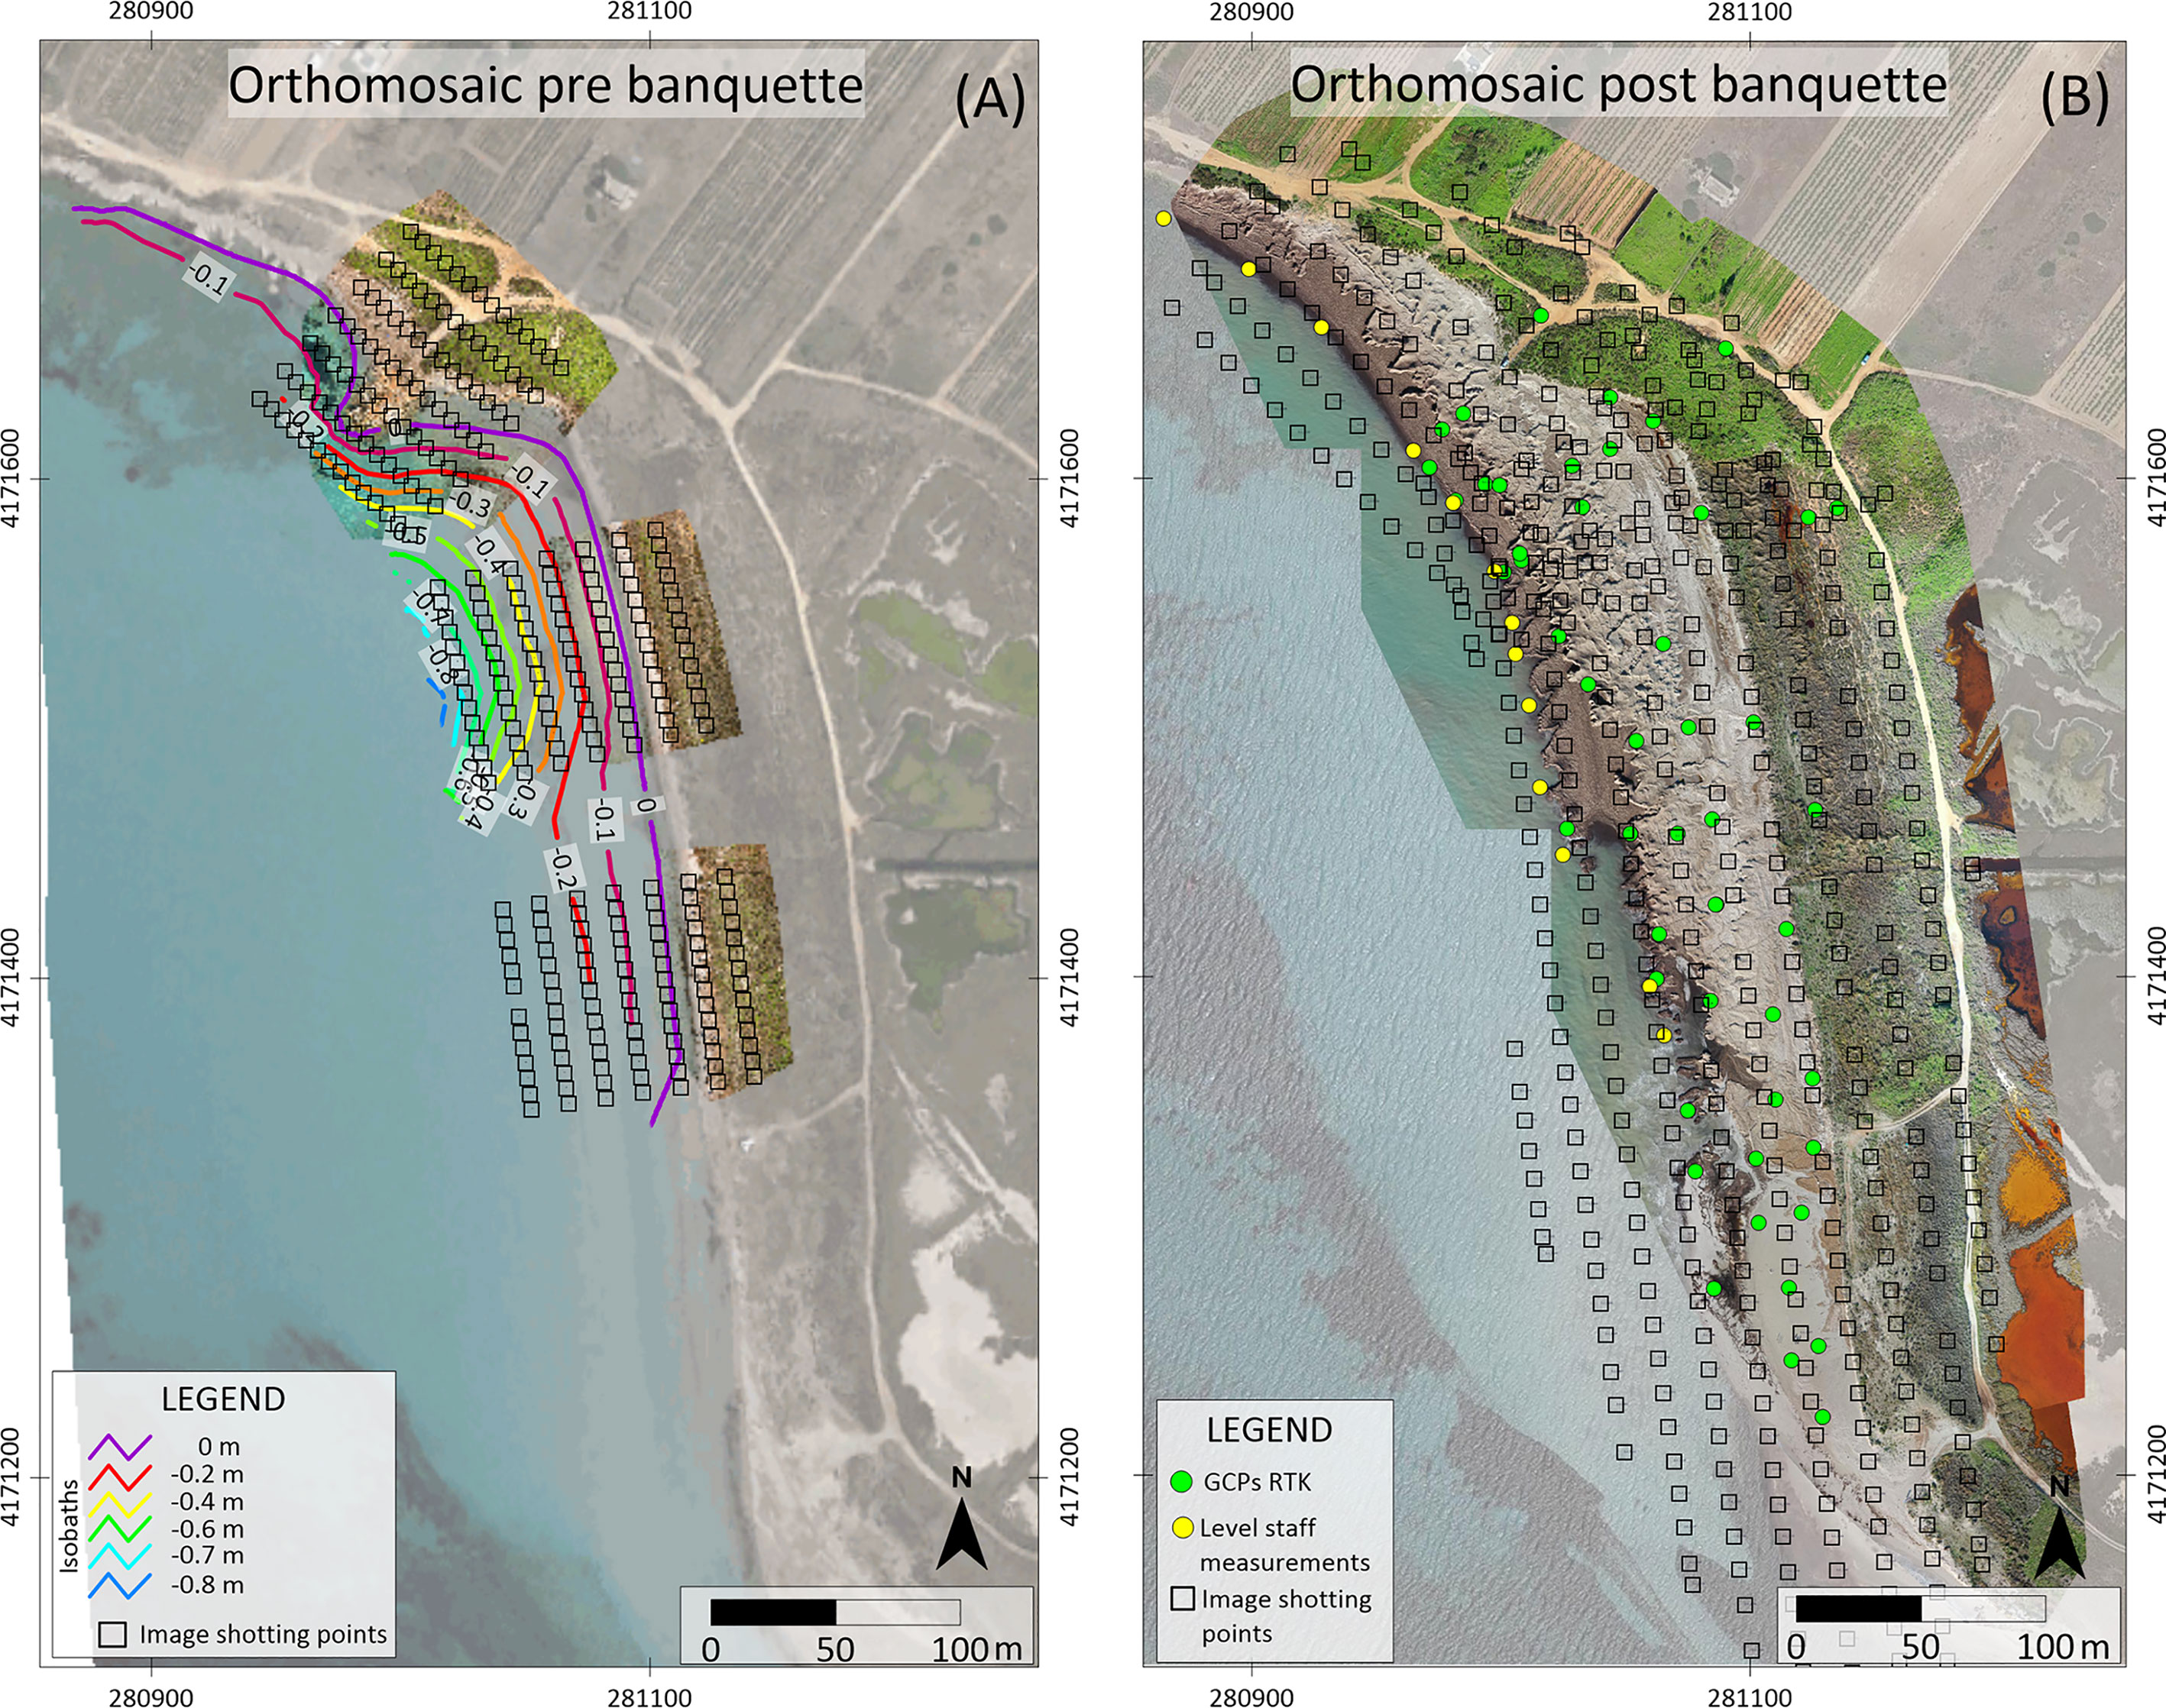
Figure 3 Photogrammetric surveys of Capo Feto headland. (A) Orthomosaic map before (21 February 2019) the deposition of the banquette and location of image shooting points and isobaths reconstructed from the measurements made using a metric rod and photogrammetric survey in very shallow water; (B) Orthomosaic map after (05 December 2019) the deposition the banquette, location of Ground Control Points and level staff measurements.
We acquired 294 photos from three flights on 21 February 2019 (Figure 3A), between 11:51 and 13:36 CET and we processed the images of the UAV surveys using photogrammetry Pix4D mapper software (see below for the processing of collected data). The area of the reconstructed surface is 22,000 m2, resulting in an average point density with equidistance of about 2 cm. For this first survey, no Global Navigation Satellite Systems (GNSS) Ground Control points (GCPs) were detected; however, the survey was corrected for the second survey (05 December 2019) using 40 homologous geo-referenced points.
To reconstruct the morphological structures of the banquette, on 05 December 2019 the second extensive survey was conducted using a DJI Mavic 2 Pro equipped with a Hasselblad Camera with 1 “full-frame 20 Mpx CMOS sensor. Focal length was 10.26 mm (corresponding to 28 mm/35 mm equivalent focal lengths) and flight distances from the ground ranged between 45 m and 46 m, resulting in a ground sampling distance spanning from 1 cm/pixel. We acquired 900 photos from three flights on 05 December 2019 between 11:51 and 13:36 CET (Figure 3B), using Pix4D Capture software. In this case, Pix4D Mapper generated a point cloud composed of 37.5 × 10⁶ vertices (Figure 3B). The area of the reconstructed surface was 113,500 m2, resulting in an average point density with equidistance of about 3 cm. For these UAV flights, a topographic survey was carried out using a GNSS receiver. We measured 46 GCPs (Figure 2B) evenly distributed along the coast both on the banquette and on the road (Figure 3B) using a GNSS HiPerHR Topcon receiver in Real Time Kinematics (RTK afterwards) with sub-centimetric accuracy, which was used for model geo referencing. We used the Sicilian GNSS TOPCON network (GPS and GLONASS) for RTK corrections with a single base located 20 km away from the survey area. Furthermore, to check the depth of the banquette below the water in the outermost part of the accumulation, we made 13 measurements with a level staff and GNSS receiver (yellow points in Figures 2C and 3B). These measurements were subsequently used to determine the maximum depth of the banquette in shallow water and the base area to be used for the estimation of volumes also below the coastline.
The alignment of the frames and their georeferencing were conducted using Pix4D mapper software, by inputting the measured coordinates of the GCPs identified along the coast. The main processing steps included: a) loading of survey frames; b) automatic key point generation at maximum frame resolution; c) import and manual assignment of GCPs (RTK) to the targets located on the ground including the banquette; d) point cloud generation considering half the frame resolution; e) generation of the Orthomosaic; f) Digital Elevation Model (DEM) reconstruction from the point cloud at 3 cm resolution (Rende et al., 2020).
Finally, the two datasets (pre- and post-banquette deposition) were compared in Global Mapper software using the LIDAR module to verify the accuracy of the elevations estimated at 10 cm. Since there was no banquette during the first survey, the difference between the two surfaces (pre- and post-banquette deposition) made it possible to estimate the total banquette volume. The analysis and interpretation of the digital cartographic data were carried out using DEMs and orthophotos at a resolution of 3 cm and 1 cm, respectively. The high-resolution gravimetric geoid of Italy ITG2009 ISG - International Service for the Geoid, was used for the transformation from ellipsoidal to orthometric elevation (https://www.isgeoid.polimi.it/Geoid/Europe/Italy).
2.2.2 Machine Learning and Image Classification
Object Base Image Analysis (OBIA) was used to discriminate the banquette from the surrounding environment. In particular, OBIA algorithms were combined with machine learning, using eCognition Developer software. The data input consisted of the orthomosaic obtained from the UAVs –integrated with RGB bands and a GSD (Ground Sample Distance) resolution of 1.5 cm. The EUNIS Habitat Classification nomenclature was used to map the banquette, according to the following four classes: 1) Facies of banks of dead leaves of Posidonia oceanica and other phanerogams (EUNIS habitat type code: A2.131); 2) Floating necromass of dead leaves (Walker et al., 2001); 3) Sand; 4) Water.
The segmentation algorithm chosen for this study is the Multi-resolution Segmentation which can create objects with as little internal heterogeneity as possible, representing significant elements of the territory. After creating the objects, 987 ground truth samples were used to train different types of classifiers available in the eCognition Developer software and classify the entire image. The results of 3 different classification algorithms were compared: Random Tree (RT), Support Vector Machine (SVM), and Kappa Nearest Neighbour (KNN). After classification, the vector of validation points was used to perform an accuracy assessment, again within eCognition Developer, which generates an error matrix. User’s and Producer’s accuracy, overall accuracy and the K index were therefore determined through 155 validation ground truth samples.
2.3 Sample Collection, Laboratory and Data Analysis
Sampling of the banquette was carried out in December 2019. To determine the structural complexity of the banquette and maximize its variation in terms of thickness and distance from the shoreline, three random transects were set perpendicularly to the coastline (Supplementary Figure 2A). At each transect, the following three stations were identified: inner edge (landward), middle point and outer edge (seaward) of the banquette. At each station, three surficial banquette samples were collected using a 20 x 20 cm frame; all material within the frame, to a depth of 20 cm, was collected using hand scissors. As the outer edge was characterised by variable and greater thickness, a further two samples were collected at increasing depth from the surface (depth differed among transects depending on the total height of the banquette) by digging horizontally from the vertical surface of the banquette to obtain cubic samples (20 cm sided) (Supplementary Figure 2A). Each sample was then stored at -20°C before analysis of i) banquette composition (density of vegetal and sediment components), ii) total organic carbon (TOC), total nitrogen (TN) and total phosphorous (TP) density.
At the laboratory, each sample was weighed whole and then divided into three sub-samples for i) determination of water content and, hence, dry weight, through oven-drying at 60°C until constant weight (i.e., 24/48h), ii) compositional analysis, and iii) chemical analysis (TOC, TN, TP).
For the compositional analysis, the vegetal components (leaves, detritus, rhizomes, roots and aegagropilae) were separated from the sediment. The sediment was further separated into sand and mud through a 63 μm mesh sieve. Each vegetal and sediment component was individually oven-dried (60°C) to constant weight. Each component was expressed both as a percentage and density (kg m-3). Moreover, the density of all components and only vegetal components were summed to obtain respectively the total density and the biomass. For chemical analysis, subsamples were freeze-dried (ALPHA 1–4 LD plus, Martin Christ) and then ground to a fine powder (micromill Retsch MM20). TOC (on previously acidified samples through HCl 2N to remove carbonates) and TN were determined through an elemental analyser (Thermo Flash EA 1112). TP was analysed using inductively coupled plasma–optical emission spectroscopy (ICP-OES; Optima 8000, PerkinElmer) after sample mineralization. TOC, TN and TP were also expressed as density (kg m-3).
Principal Component Analysis (PCA) was run based on the normalised total density, biomass, sand and mud density, as well as averaged TOC, TN and TP density to assess the differences between samples collected at different distances from the sea (inner edge, middle zone, outer edge) and depth from the banquette surface ranked according to four classes (0-20, 60-80, 100-120 and >160 cm) in order to take into account the different depth at which the samples were taken along the outer edge. In addition, after having identified, from the PCA, banquette depth as the main driver of the dataset variability, the relationship between depth and the other variables was individually tested using regression models. In particular, Linear Models (LM) were applied when the normality assumption was retained according to the Shapiro-Wilk test (Underwood, 1997); otherwise, Generalized Linear Models (GLM) were applied, since they allow the use of any distribution belonging to the Natural Exponential family (Lovison et al., 2011). Depth (cm) was used as the explanatory variable, whereas total density, biomass, sand, mud, TOC, TN and TP densities were used as response variables. PCA, and LM and GLM, were performed using PRIMER 6 v6.1.10 & PERMANOVA+ β20 (Anderson et al., 2008) and R v. 4.0.2 (R Core Team, 2018), respectively.
2.4 Mass Calculation
To calculate the total mass of the different components and nutrients in the banquette, the total volume obtained from the three-dimensional mapping (see Image Data Acquisition) was fractionated into N sub-units of columnar shape; the base of the column measured 20x20 cm, i.e., a surface (S) of 400 cm2 and the height corresponding to the maximum thickness of the banquette (Dmax) (Supplementary Figure 2B). For each sub-unit, the mass was calculated applying the formula m = da V, where da is the average density and V = S Dmax. In turn, the da of each sub-unit was estimated, using the coefficients obtained by LM and GLM (see Sample Collection, Laboratory and Data Analysis), applying the formula da = (dmin + dmax)/2, where dmin is the density at the surface corresponding to the intercept of the models and dmax is the density value estimated at the maximum thickness of the banquette (i.e. at its base) (Supplementary Figure 2B). Finally, the total mass of all the examined components was estimated by summing the mass (m) of all the sub-units. Since the relationship between sand and depth was not significant, estimates of its density were obtained from the difference between total density and biomass and mud.
3 Results
3.1 Thematic Classification
The OBIA classification allowed us to obtain the highest overall accuracy for the KNN algorithm (92.28%) with a Kappa Index of Agreement of 0.90 (Table 1). The classification obtained with the Random Tree (RT) algorithm showed an overall accuracy of 90.31% and a Kappa Index of 0.86, while the SVM algorithm showed the worst result, 60.81% and 0.49 for overall accuracy and Kappa Index, respectively (Table 1). Consequently, the KNN results were chosen for the banquette map (Figure 4 and Supplementary Figures 3A, B). According to KNN classification, the following thematic classes were covered: Facies of banks of dead leaves of Posidonia oceanica 2.18 ha, floating necromass of dead leaves 0.95 ha, sand 0.64 ha, and water surface 1.62 ha.
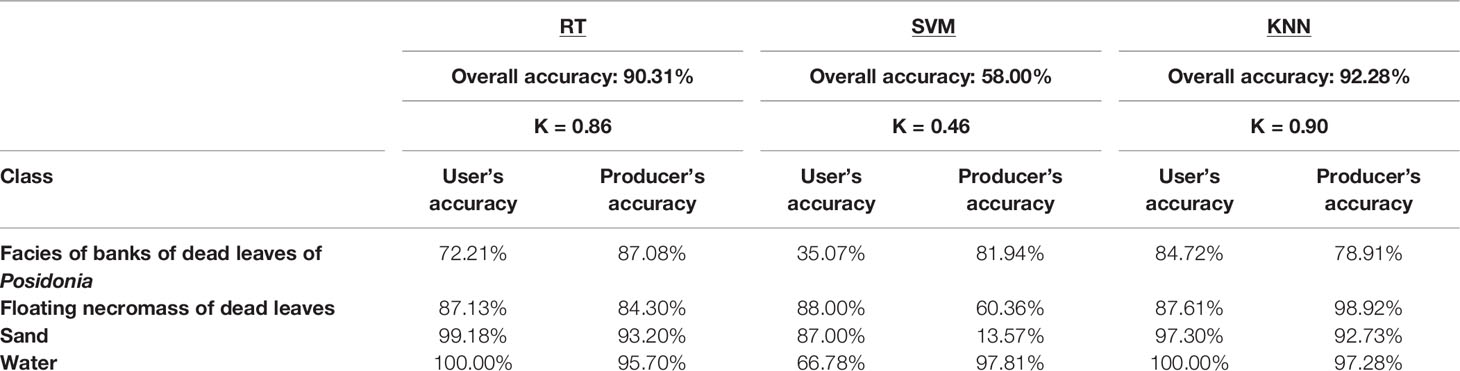
Table 1 Accuracy of the RT, SVM and KNN classification systems.
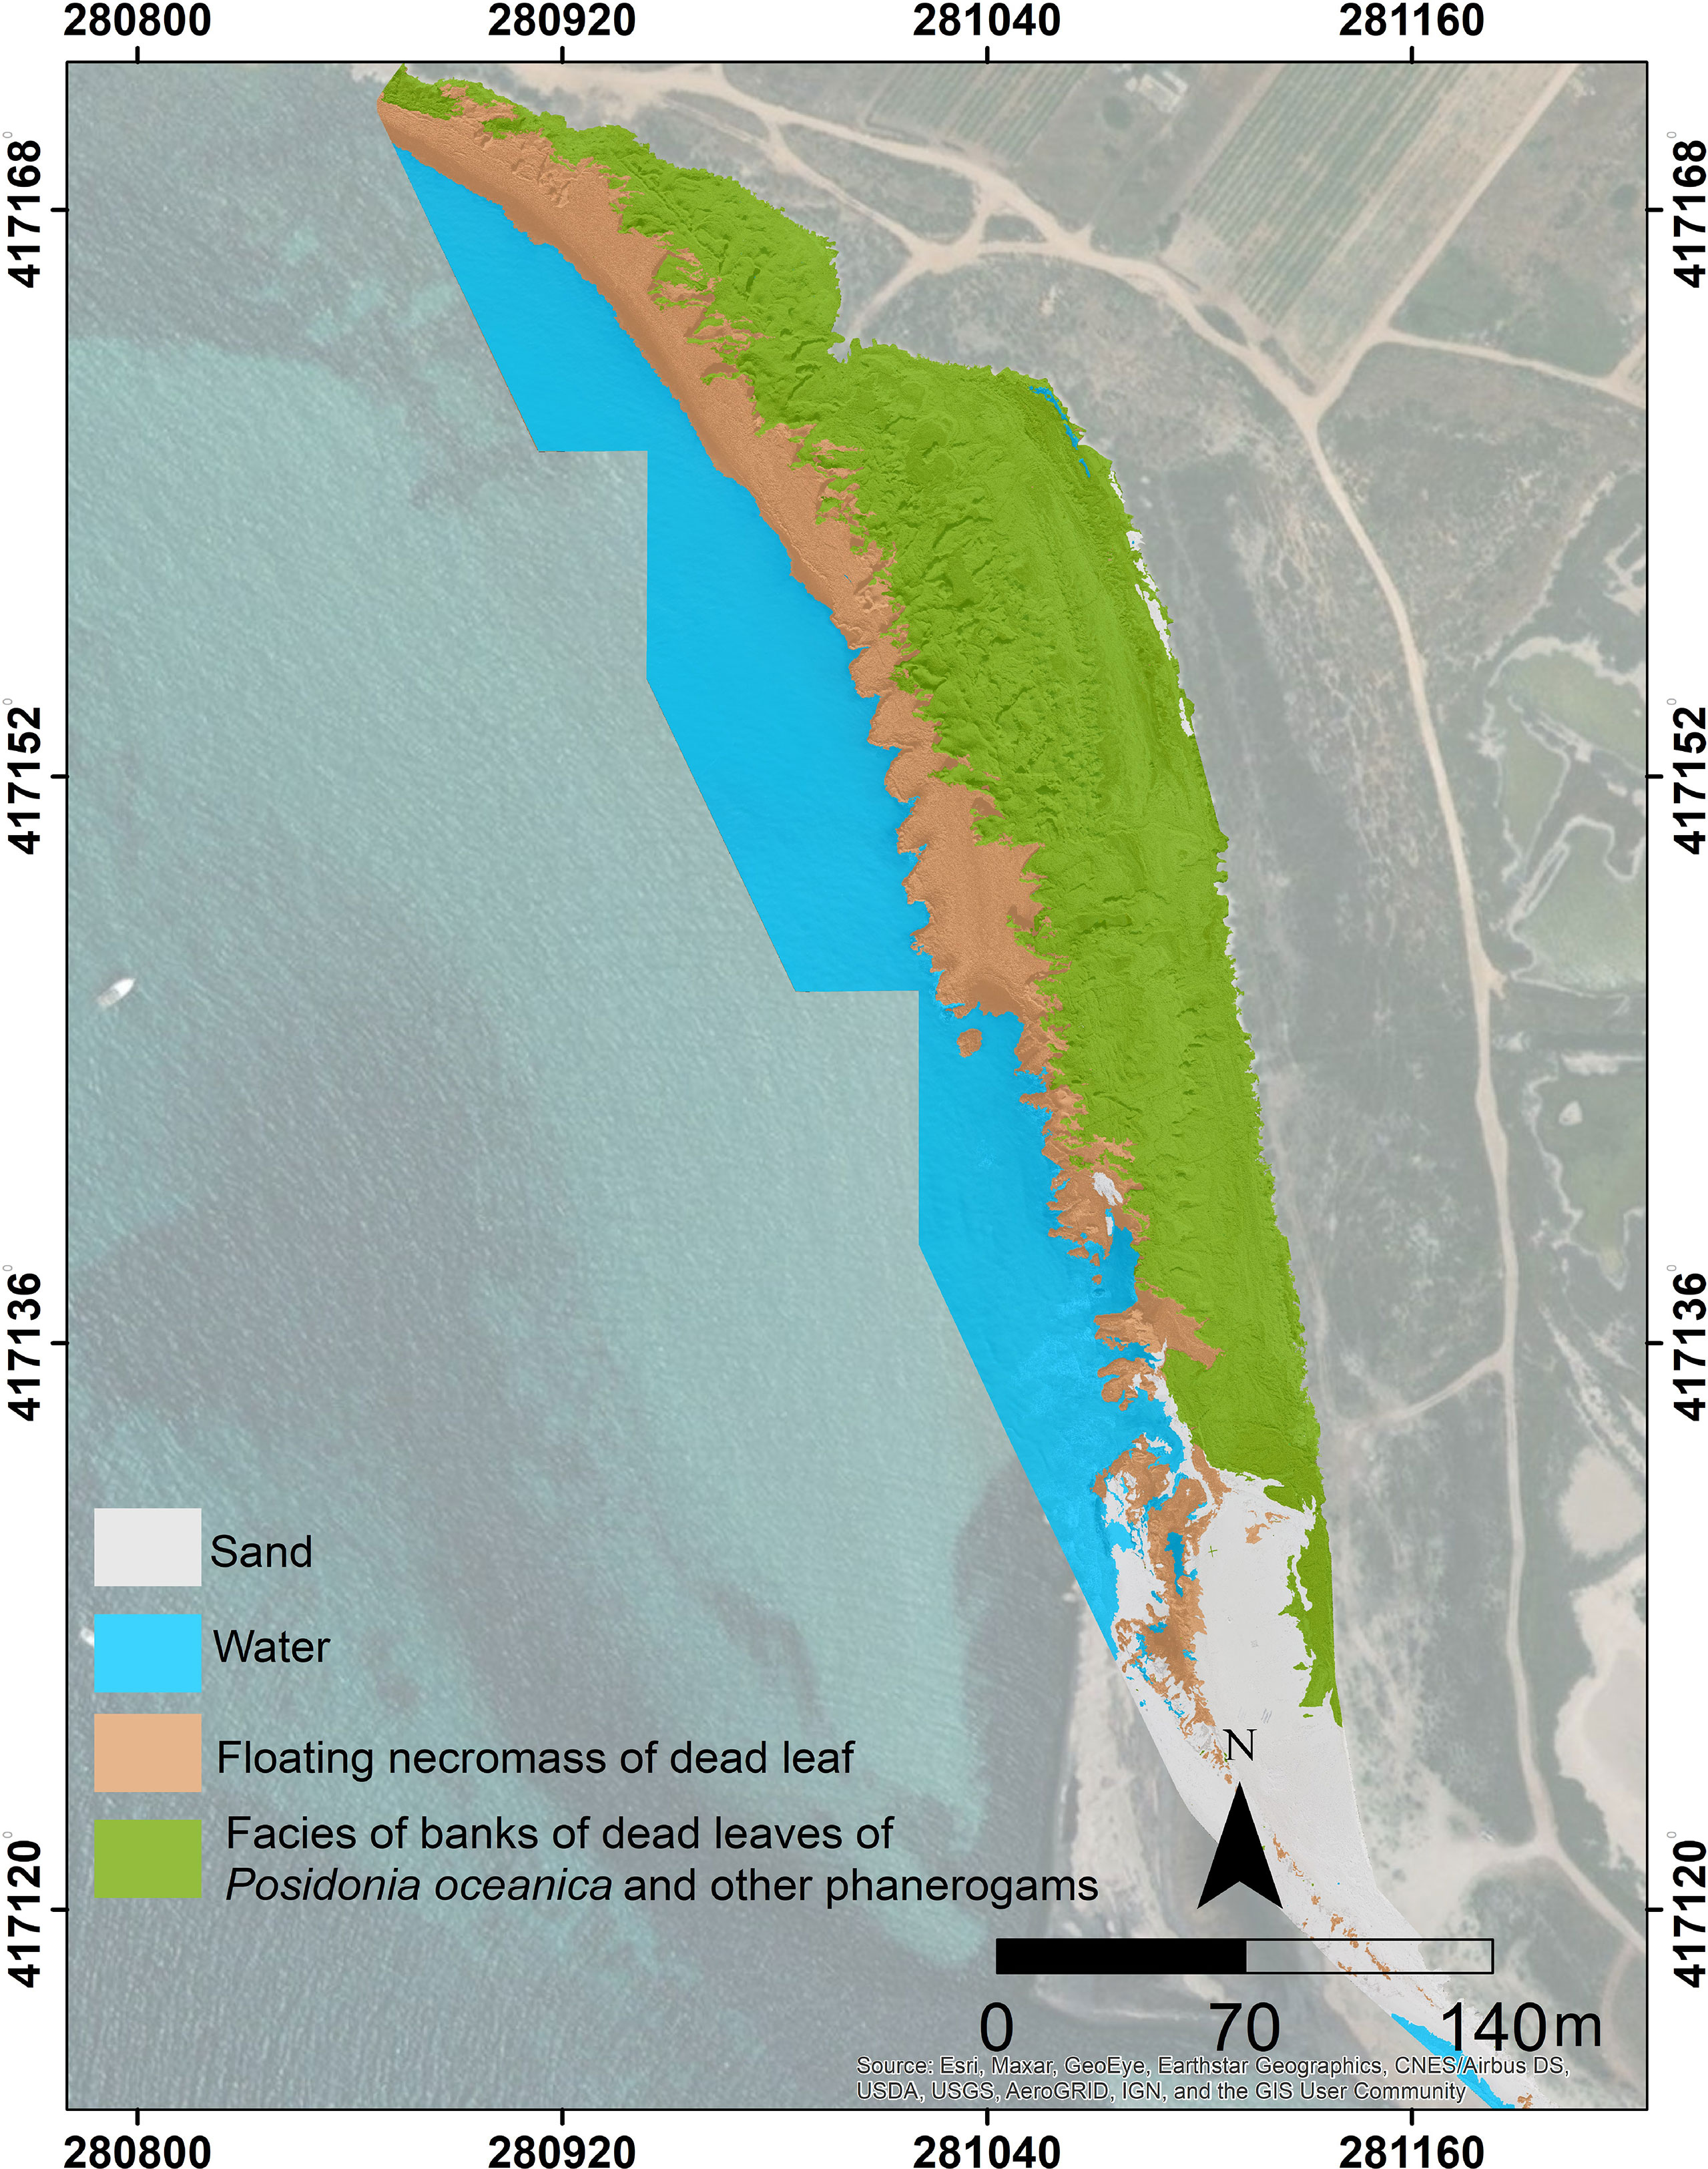
Figure 4 Object-based Image Analysis (OBIA) classification results by means of Kappa Nearest Neighbour (KNN) filter for the Capo Feto area and thematic classes.
3.2 Morphological Characterization of the Banquette
The total area covered by the banquette at the time of the survey was approximately 3.1 ha, an underestimated value due to its further extension to the North where no photogrammetric surveys were carried out. The high-resolution ground and orthomosaic DEMs obtained from the photogrammetric restitution process showed an extensive distribution of the banquette along the coast. In particular, the coastline affected by the deposition of banquette was 600 m long and ranged from 24 m to 85 m in width (Figure 5A).
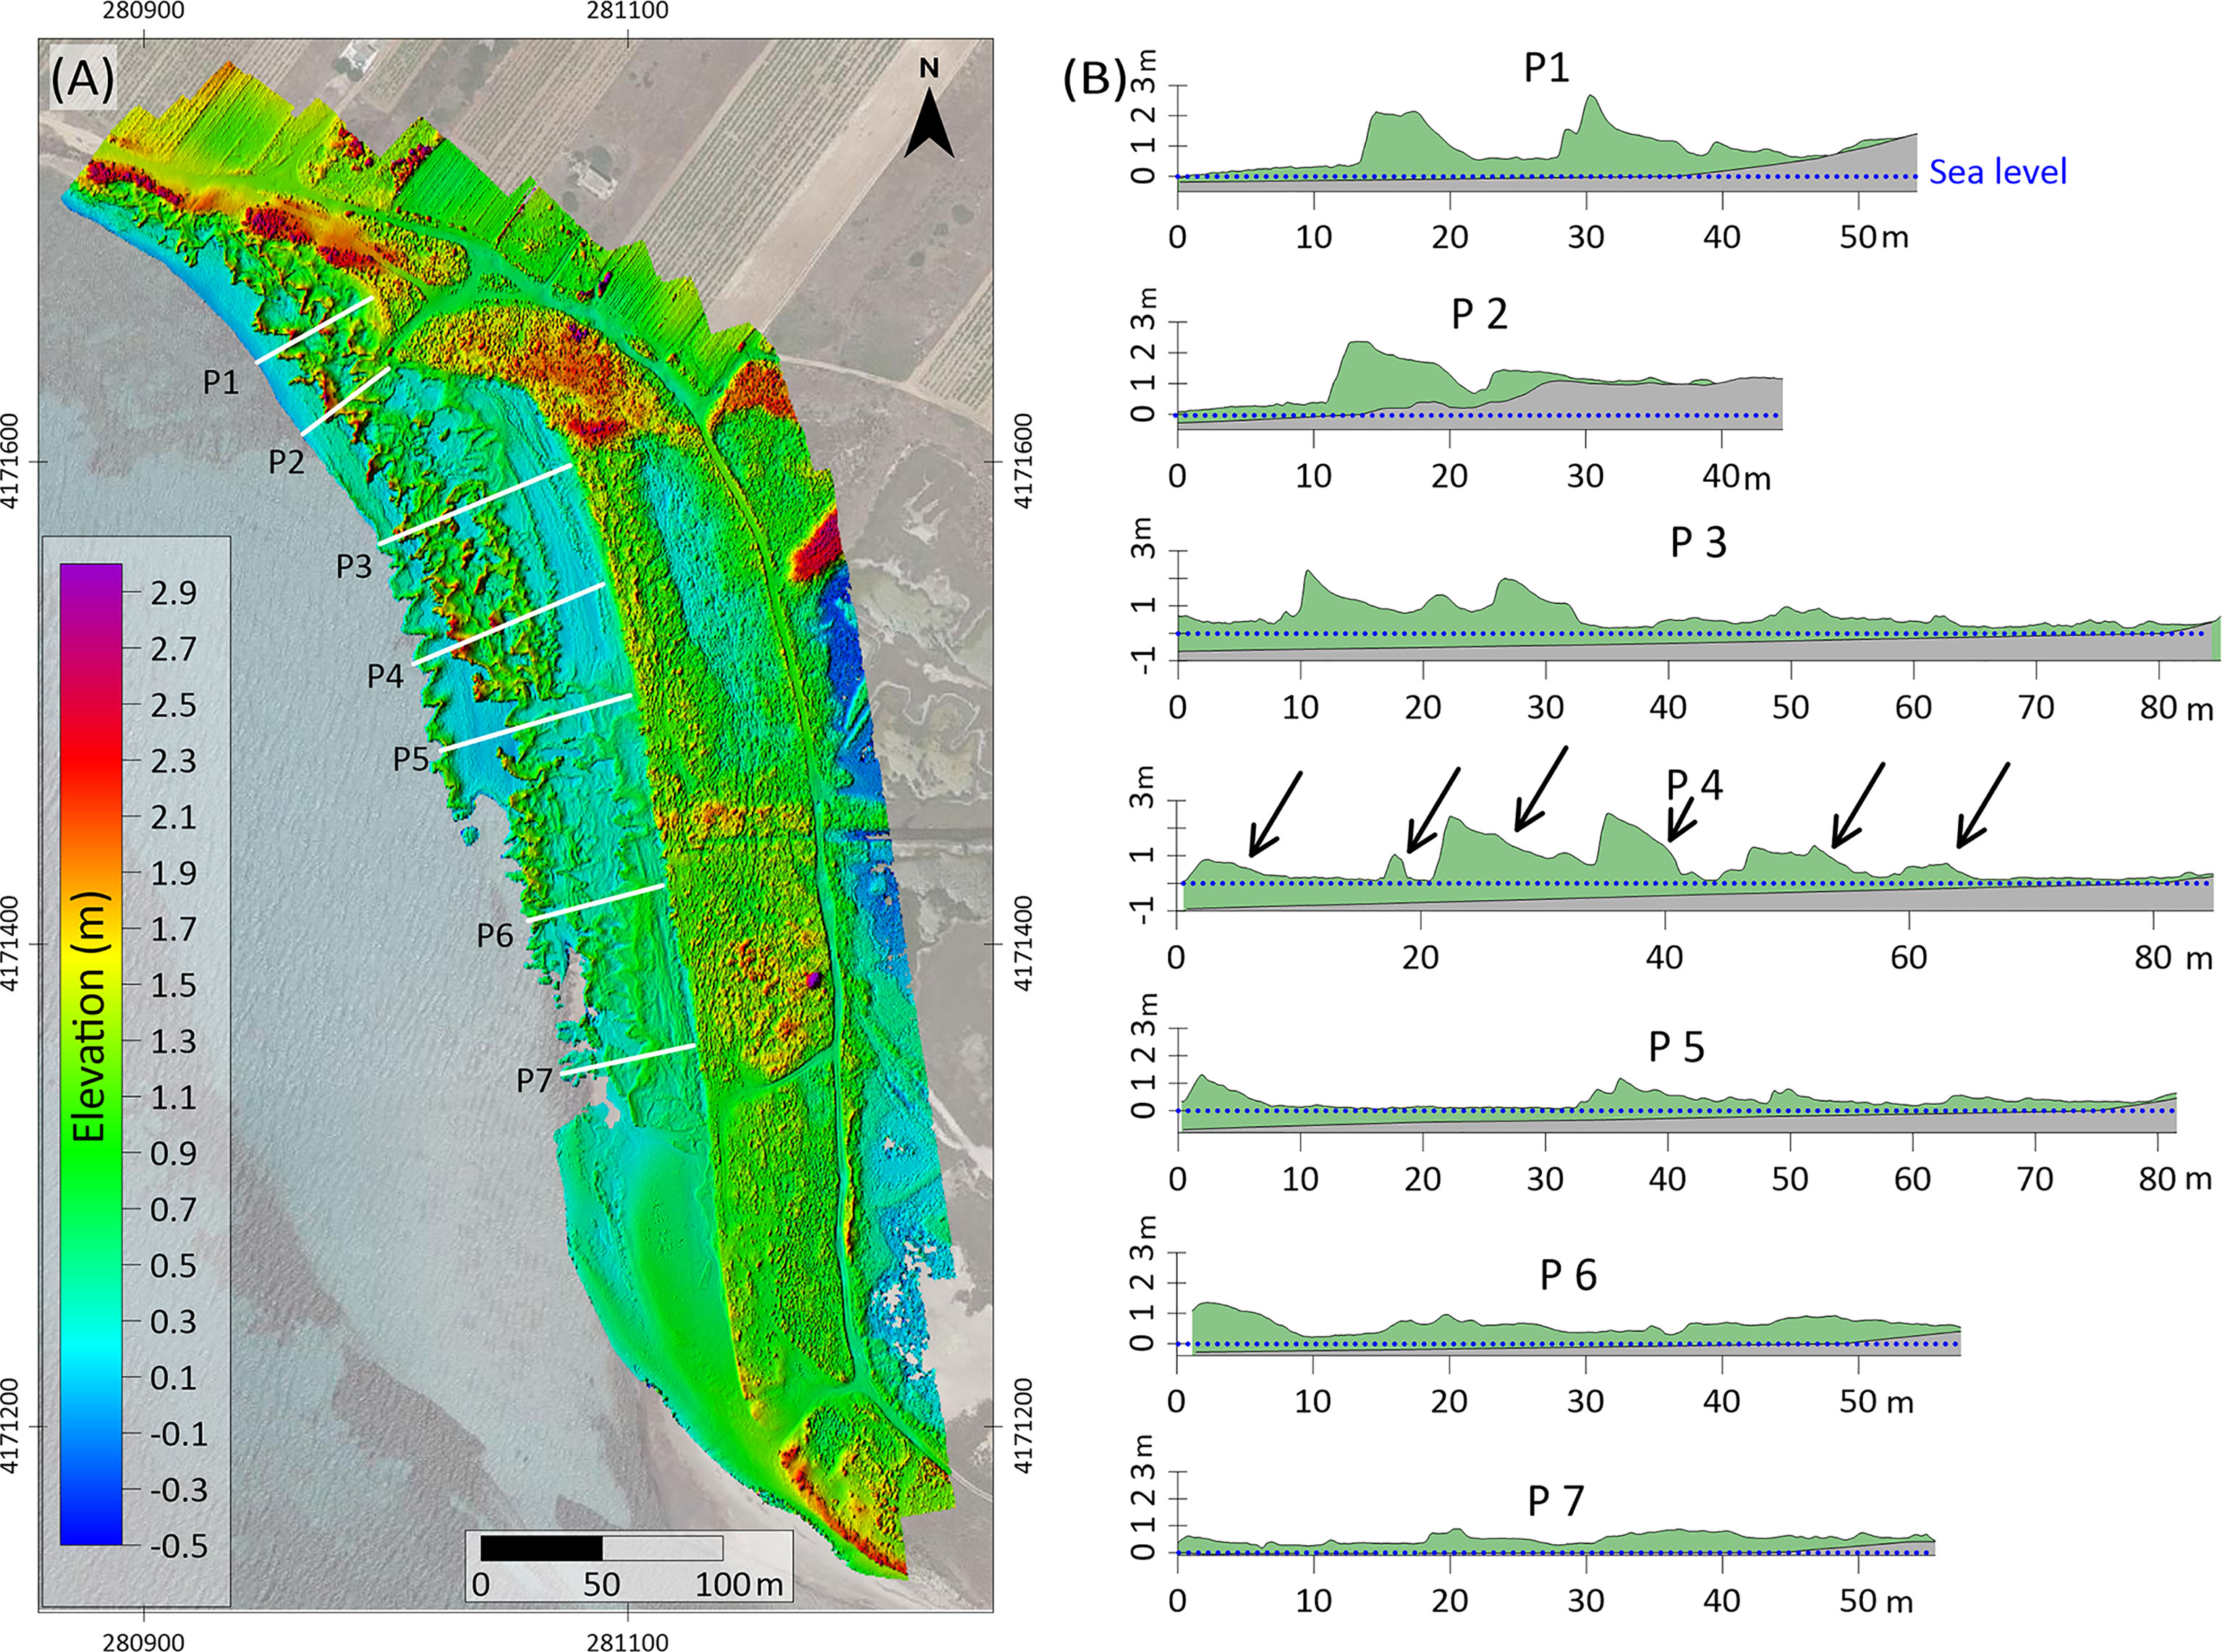
Figure 5 (A) Digital elevation model (DEM) of the surveyed area and location of 7 sections encompassing the entire banquette extension from the coastline towards the sea. (B) The profiles show the accumulation of maximum seagrass accumulation cycles (arrows up to 6) with maximum thicknesses up to 3 m. The blue dotted horizontal line is the sea level at the time of image acquisition.
The banquette was mainly concentrated in the central part of the investigated area, which corresponds to the area of maximum curvature of the coastline (see the profiles in Figure 5B). The morphology of the banquette was not uniform but characterized by numerous cusps parallel to the coastline. The DEM showed the alignment of the cusps in several series, up to 6 cycles (Figure 5B), indicating more construction phases produced by the action of storm surges, mostly coming from the western sectors (Figure 1, Supplementary Figure 1). Near the sub-flat areas, the morphologies showed relatively low slopes (0.2°-2°) with a tendency to increase up to 90° near the cusps, generating sub-vertical fronts probably caused by the erosive action of waves that gradually push leaves towards the coast and at the same time erode the base of the existing accumulated mass. The high-resolution DEM and the map of difference show variable thicknesses, with a general seaward increase of up to about 3.40 m (Figures 6A–C).
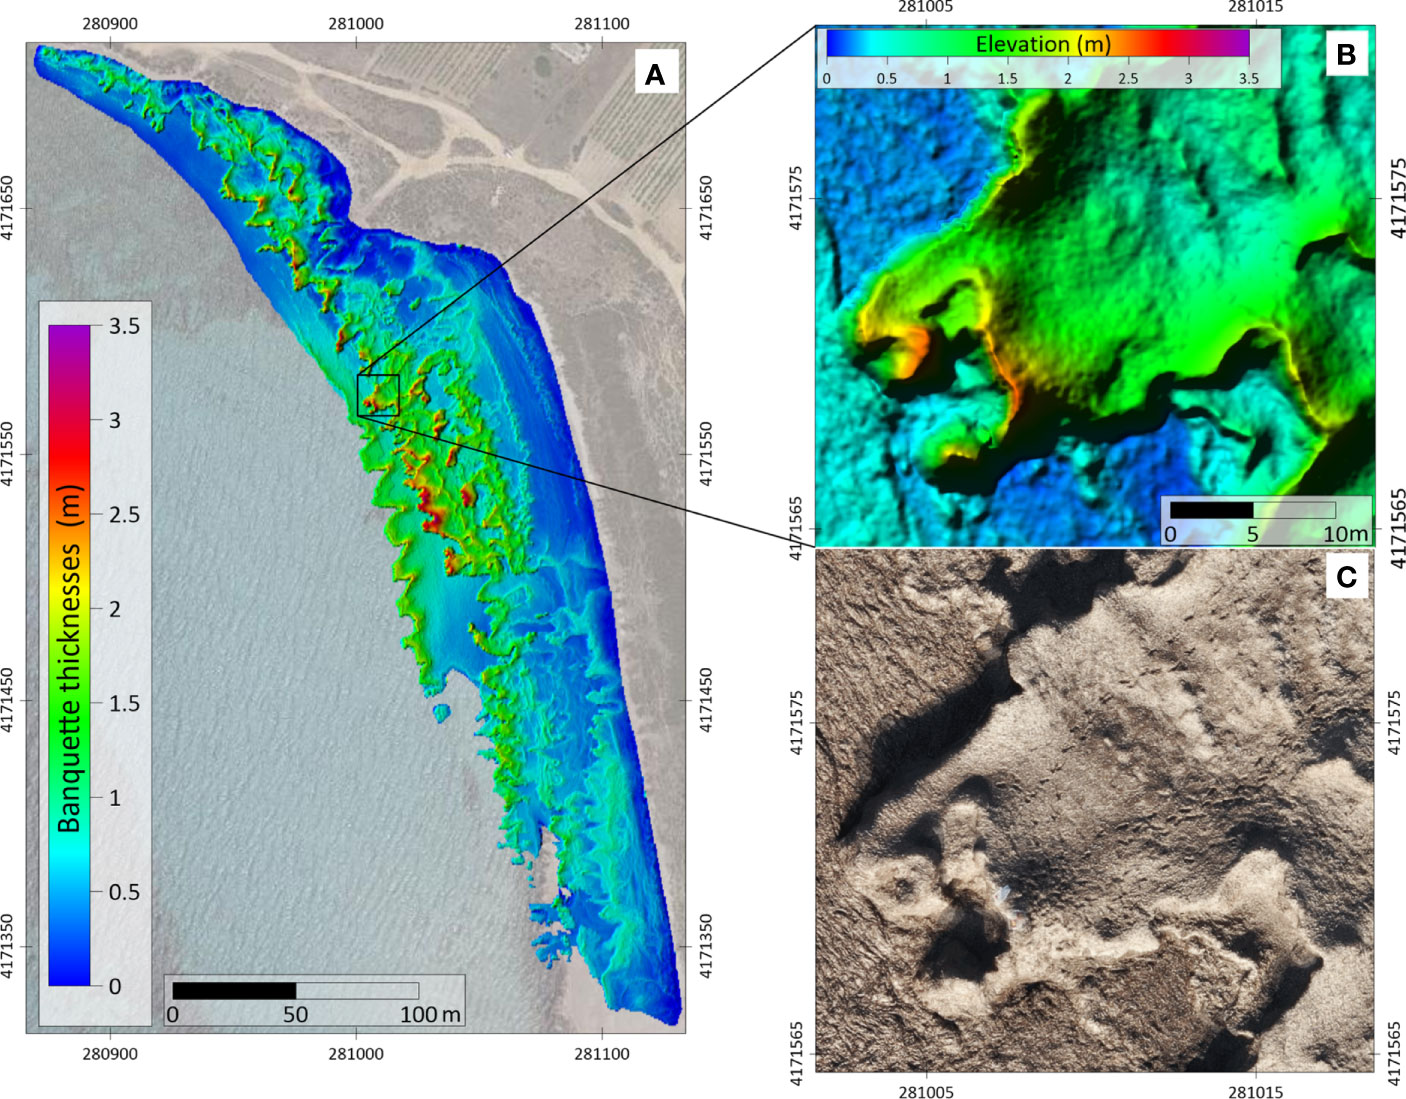
Figure 6 (A) Map of difference between pre- and post-banquette deposition DEM; (B) Detail of post-banquette deposition DEM at 6 cm resolution; (C) Detail of orthomosaic map at 3 cm resolution.
The comparison of the two DEMs (pre and post banquette deposition) allowed estimation of the overall thickness and volume of the accumulated mass. The total estimated volume of the accumulated mass (vegetal and sedimentary) was about 20,009.6 m3, while the thickness varied from a few decimetres to 3.10 m with respect to the hydrographic zero. However, if we consider the height with respect to the pre-deposition surface, the thickness increases up to 3.4 m. Overall, the greatest thickness was detected in the central sector of the deposition where there is the extension from the coast is the widest (Figure 6A).
3.3 Compositional and Chemical Characterization of the Banquette
The banquette was characterised by a clear dominance of leaf detritus (72.8 ± 12.5%, mean ± s.d.), followed by sand (10.0 ± 8.8%) and seagrass rhizomes (7.4 ± 8.1%), while aegagropilae, mud and fresh leaves were minor components (2.1 ± 3.8%, 2.0 ± 0.9% and 0.3 ± 0.4% respectively). Total density was 83.9 ± 27.4 kg m-3, of which 73.0 ± 22.3 kg m-3 were vegetal components, 9.8 ± 8.6 kg m-3 sand, and 1.7 ± 1.7 kg m-3 mud. TOC density was on average 19.35 ± 6.56 kg m-3, while much lower values were found for TN (0.42 ± 0.14 kg m-3) and TP (0.02 ± 0.01 kg m-3). The first axis of the PCA ordination explained 74.7% of the variability and revealed a clear separation of the samples according to depth, while the second axis explained 16.3% of the variability, with the total for the two axes being 90.9%. Samples collected at greater depths clustered in the right part of the graph and showed the highest values of all variables. The deepest samples (> 160 cm) were characterised by the highest sand and mud density (Figure 7).
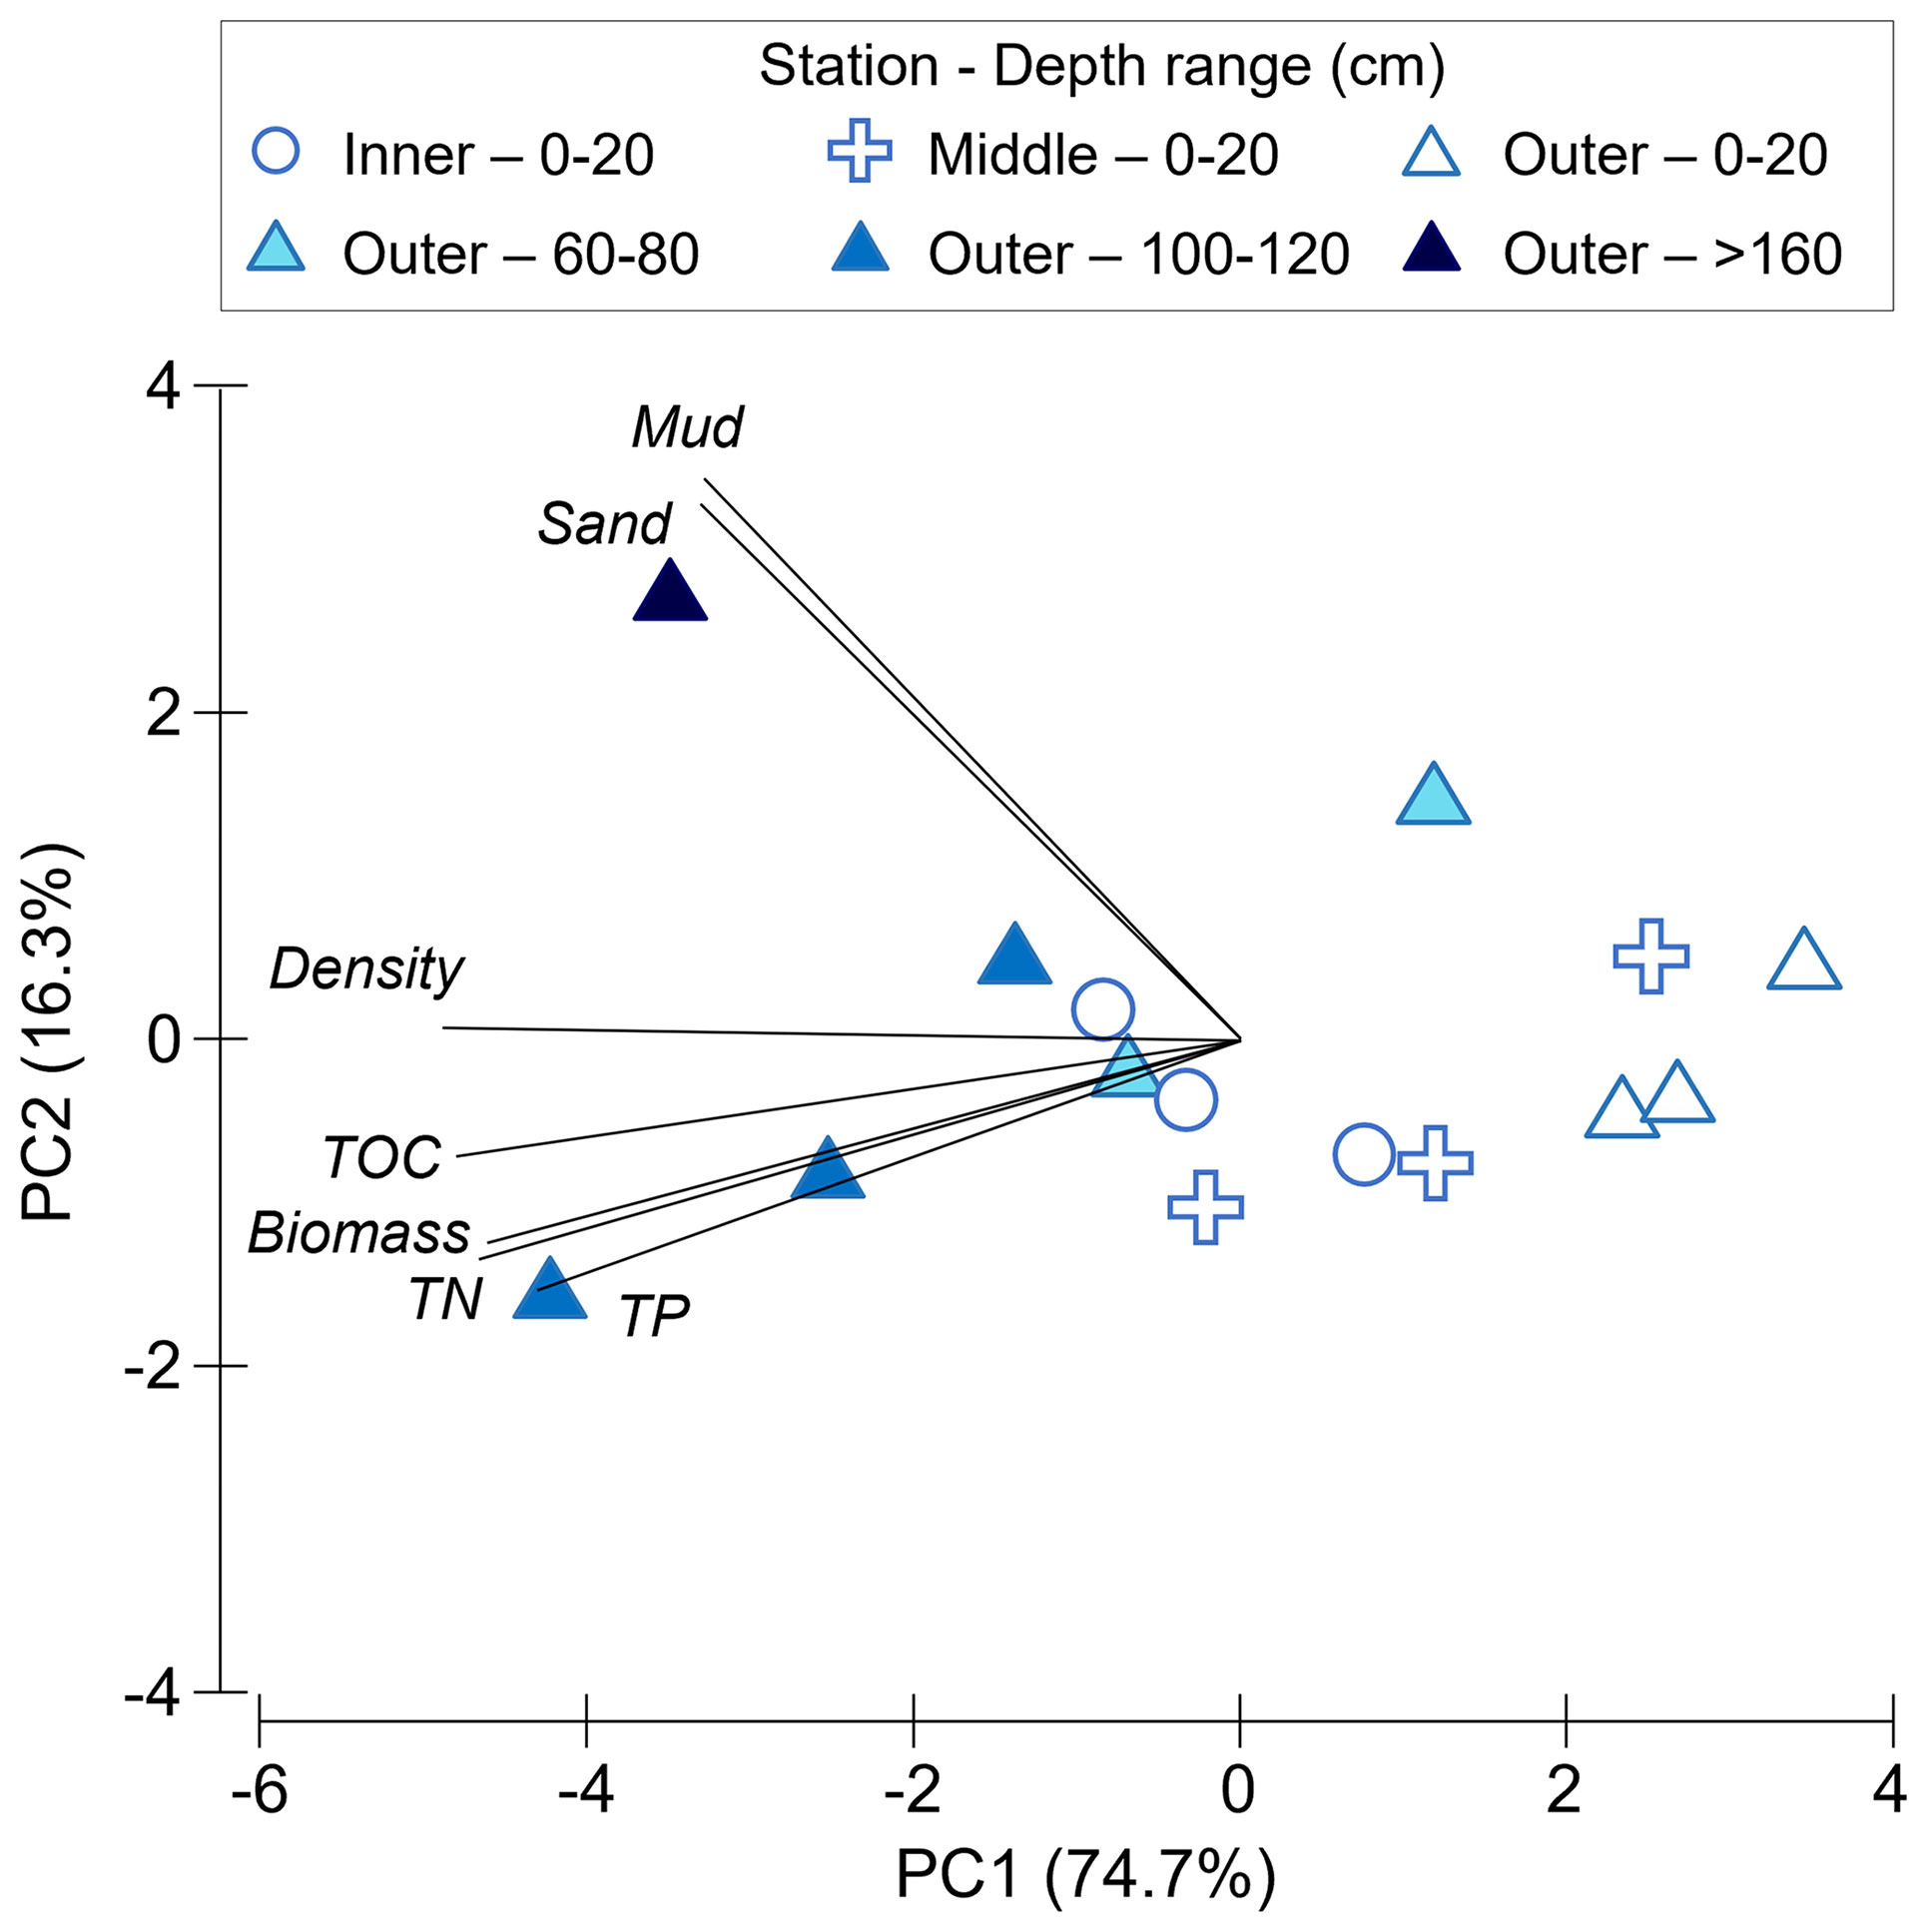
Figure 7 Principal Component Analysis (PCA) ordination performed on total density, biomass, and sand, mud, TOC (Total Organic Carbon), TN and TP density data of the samples of the banquette collected from three stations (inner edge, middle zone and outer edge) along the transects, and at different depths. Vectors are overlayed based on the Pearson correlation r > 0.5.
LM and GLM showed that all the variables considered significantly increased with increasing banquette depth (p value < 0.05) except for sand (p value > 0.05) (Table 2). The relationship between depth and total density showed the highest R2 (0.66) followed by mud and biomass (R2 = 0.57 and 0.47, respectively), indicating better goodness of fit for the regression analyses performed.
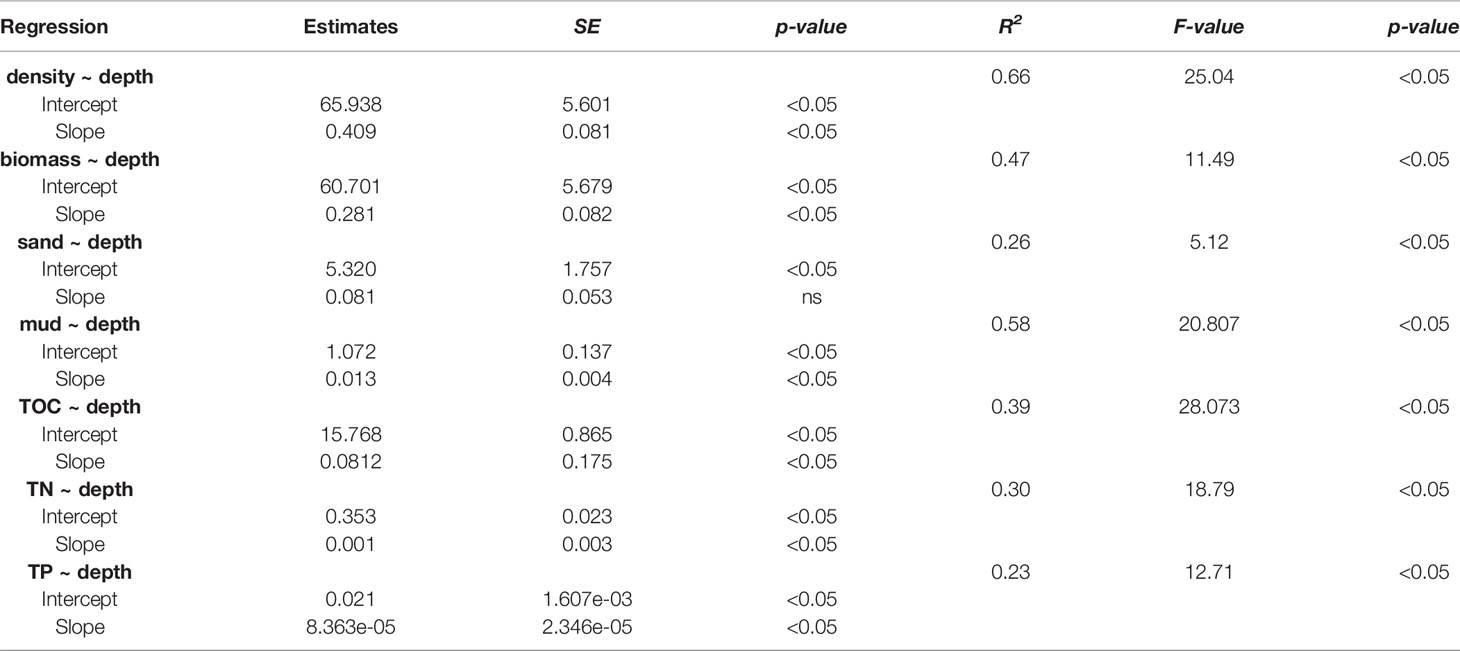
Table 2 Equation, R2, F-value and p-value of the LM and GLM performed to assess the relationship between the depth (cm) of the banquette and total density, biomass, sand, mud, TOC, TN and TP density (kg m-3).
3.4 Data Integration and Mass Calculation
Overall, almost 700,000 volumetric subunits were generated via GIS model. Their average thickness and volume were 72.7 ± 47.3 cm and 29,097 ± 18,918 cm3, respectively, totalling 20,009.6 m3 (Table 3). The distribution of maximum density estimates for each variable at the base of all sub-units (Dmax) is shown in Figure 8; the highest value was observed for total density (200 kg dw m-3). According to the calculations reported in section 2.4, the mass obtained for all the investigated variables ranged from 0.5 to 1,505.6 tons for TP and the vegetal component respectively, totalling 1,743 tons for the entire banquette.
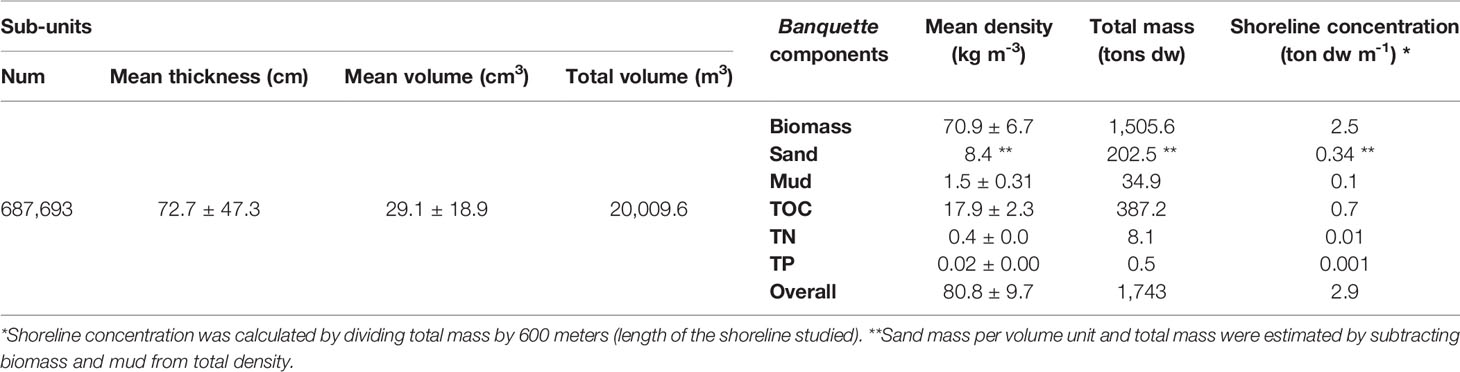
Table 3 Number (Num), mean (± s.d.) thickness and volume and total volume of the GIS generated sub-units. Biomass, sediment (sand and mud), total organic carbon, and nutrient density estimated on average for the sub-units and total values.
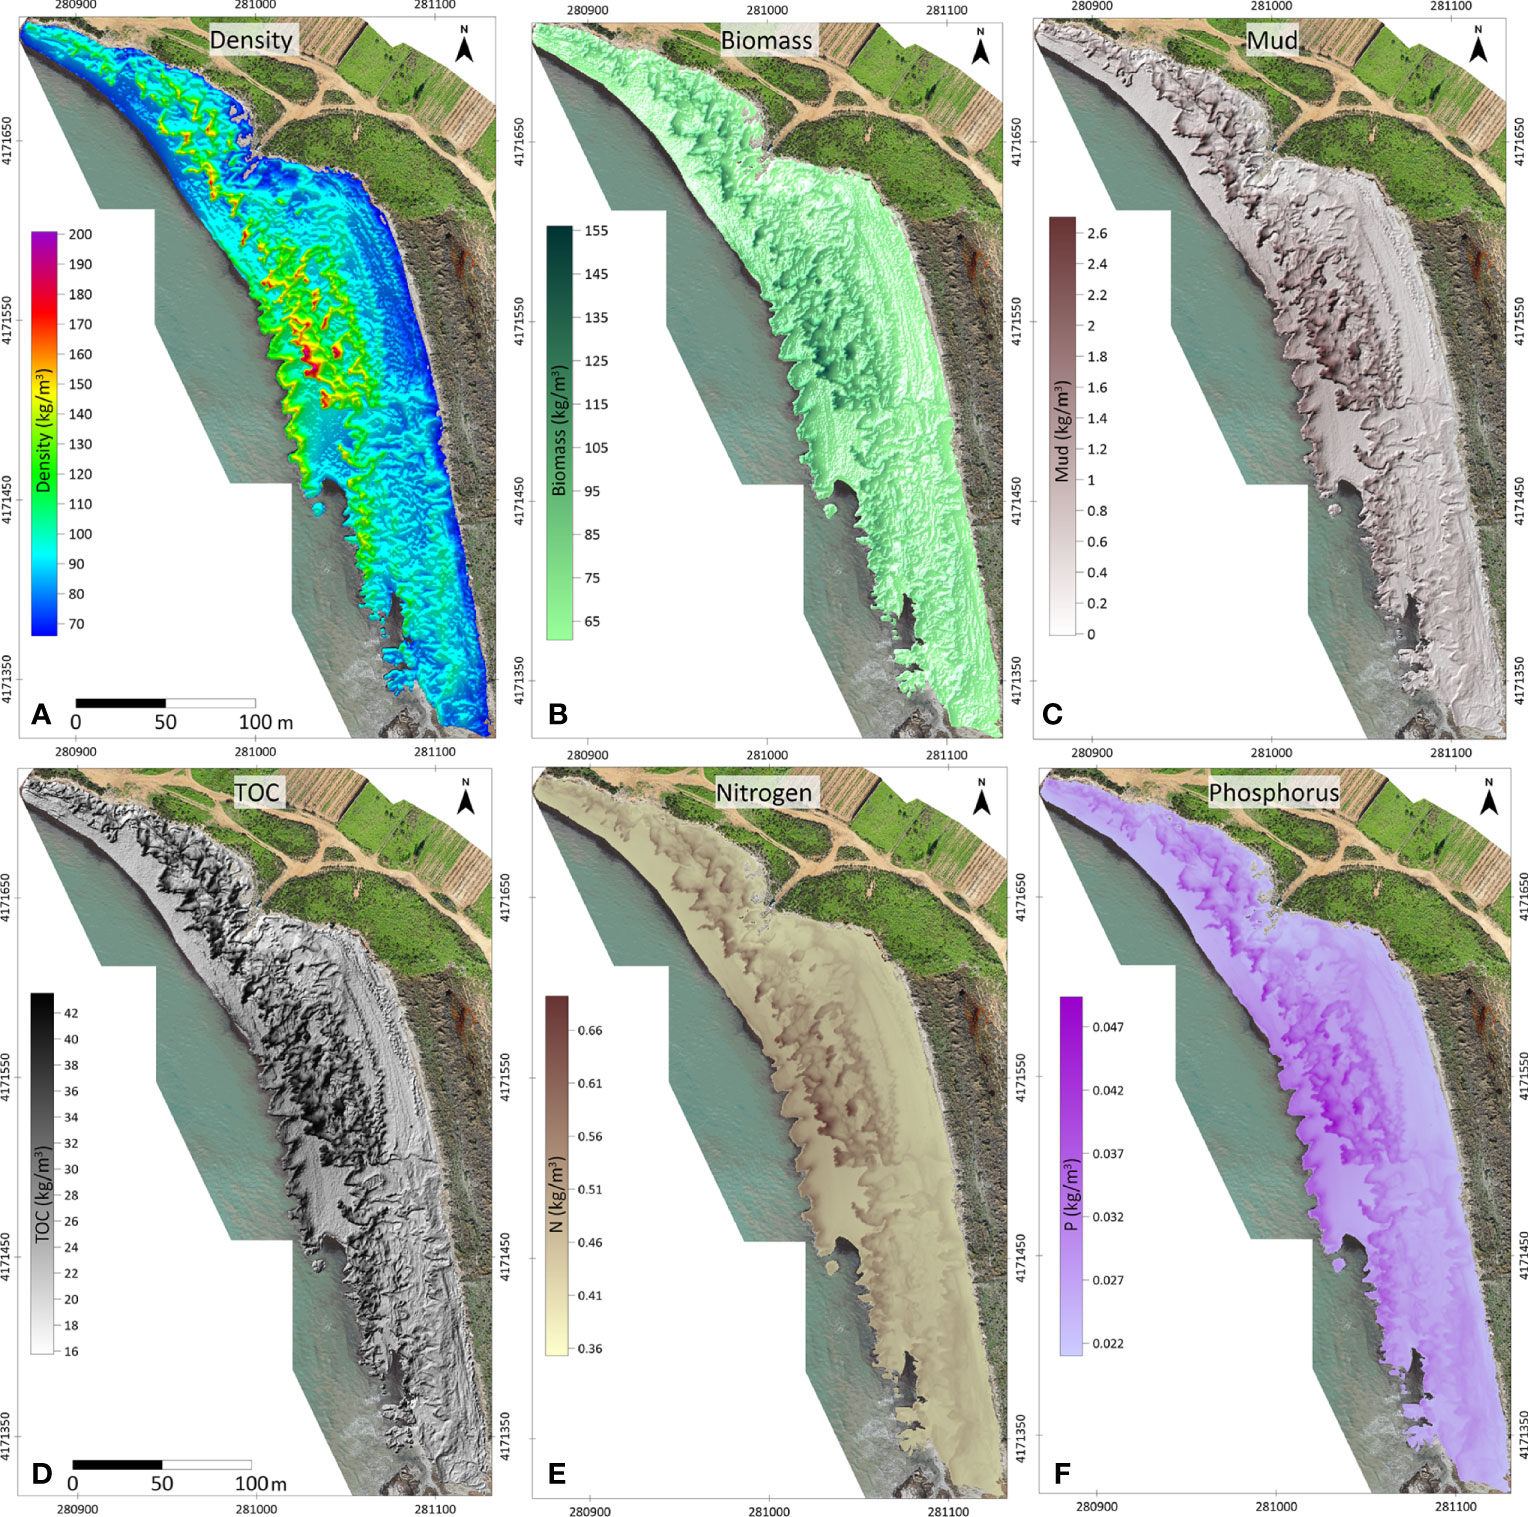
Figure 8 Distribution maps of the maximum values estimated at the base of the Capo Feto banquette for: (A) total density, (B) biomass, (C) mud density, (D) TOC (Total Organic Carbon) density, (E) TN (Total Nitrogen) density, (F) TP (Total Phosphorus) density.
4 Discussion
4.1 Banquette Mapping, Volume Estimation and Morphological Traits
The high-resolution photogrammetric method applied in this study was reliable and powerful for measuring the three-dimensional extent of Posidonia oceanica litter accumulations even when reaching abnormal size, such as described here that, to our knowledge, represents the biggest ever analysed.
The use of this rapid and non-destructive approach also allowed obtaining very accurate quantitative information on the distribution of the various morphologies present. Previous studies have shown the potential of aerophotogrammetry in identifying and mapping seagrass detritus accumulated along the coasts (Ventura et al., 2018; Pan et al., 2021), but they were limited to two-dimensional mapping. In this study, for the first time, the images taken in suitable overlapping sequence demonstrated that UAVs are a very simple and, at the same time, cheap solution able to represent not only 2D detritus distribution but also its 3D architecture at centimetre-scale. This provided the opportunity to 3D reconstruct and map the seagrass meadows and the necromass structures, beached and submerged, characterised by very complex shapes across all geometric dimensions (Rende et al., 2020; Tomasello et al., 2020).
The availability of high-resolution orthomosaics and DEMs in a georeferenced environment using OBIA (Object-Based Image Analysis) classification techniques allows rapid and effective mapping of natural and physical habitats. Mapping and comparison of validated thematic maps (2D) (Rende et al., 2022) and volume estimates (3D) obtained from OBIA classification are also essential tools for environmental monitoring of medium and large-scale areas such as those of the Capo Feto area. This first high-resolution classification (Figures 4, 5) compared with future surveys (time-lapse), will allow us to estimate the quantity of biomass and carbon accumulated or exported. The high-resolution DEM obtained for the study also allowed obtaining details of the morphologies present on the surface of the banquette, thereby permitting recognition of spatial cyclical trends in the variations of the thicknesses reached.
The analysis of these variations showed a general progressive increase in the thickness towards the sea. However, the analysis of the surface continuum in sections orthogonal to the coast allowed identification of repeated series of ridges, culminating in points of maximum height where the slope reverses interspersed with flat areas.
The entire banquette mass, especially the most seaward part, should be considered as a completely saturated floating element, which behaves like a dense fluid mass. Southward flux energy, without any confinement, tends to dissipate itself and confluence into the general littoral drift of the Physiographic Unit. Interestingly, the maximum heights of the series of ridges are located approximately in the centre-north of the beach because that is where maximum impact energy is, which then dissipates in both directions (north and south).
The “multi-ridge” nature of flat areas interspersed with giant accumulation ridges can be reasonably interpreted as the result of alternating phases of calmer seas and stormy seas respectively, responsible for an even more complex process of accumulation building than previously thought. Previous studies conducted in various regions of the Mediterranean have described the presence of typical wall delimiting seafront banquette with flat areas behind the beach (Roig Munar and Prieto, 2005; Simeone et al., 2013). However, this wall, despite being subject to continuous marine formation/erosion, has always been reported as a single structure. In fact, no explicit reference to the multiple presences of several walls running parallel to the coast had been ever made. For this reason, we propose the adoption of the term “multiple mega ridges banquette” (MMR banquette) to better identify the atypical banquette typology described in this study. Further studies will be needed to understand if and where MMR banquette occur along the Mediterranean coasts.
4.2 Compositional and Chemical Characteristics
This study showed that the large morphological variability of the banquette exerts a significant effect on the structure and compactness of the accumulation itself, with important implications for the estimation of the amount of the various components. The evident causal relationship between depth and density of the banquette components has allowed us to model their variation along the banquette vertical profile. The banquette features, in terms of compositional and chemical variables, varied along the vertical profile, while the distance from the coast was not relevant. Excluding sand, which showed a high content at the inner edge as it is more exposed to the influence of the dune system behind it (Simeone and De Falco, 2012), total mass increases from 30 to 60% per unit volume for each meter below the banquette surface. Mateo et al. (2003) also observed a sharp increase in density from the surface to the base of the banquette due to a different degree of component compactness, suggesting that this is not a site-specific feature. The weight of the leaves determines a self-crushing effect that in turn produces the progressive expulsion of both air and interstitial water from the debris matrix. Although the density estimates were obtained from statistical models applied to field data collected up to 160 cm below the surface, it should be noted that this depth coincides with the 94th percentile of the almost 700,000 sub-units of depth measures generated via DEM and are, therefore, strongly representative of the entire banquette thicknesses pool.
4.3 Data Integration for Stock Calculation Upscaling
From a methodological point of view, this study demonstrated that the thickness of the banquette is an important covariate that clearly needs to be considered for a correct estimate of the carbon and nutrient stocks present in these structures. Moreover, the approach applied is relevant not only for purely geometric calculations of volumes per se, but also for those of a physical nature, given that the banquette has the characteristics of a variable-density body due to the intrinsic characteristics described above. If the effects associated with different thicknesses are ignored, the ability to make correct estimates of their mass can change dramatically. According to the literature, great variability in banquette thickness is due to coastal morphology, hydrodynamic regime, distance and productivity of the adjacent seagrass meadows (e.g. Duong and Fairweather, 2011; Simeone and De Falco, 2012; Simeone et al., 2013; Jiménez et al., 2017). Since this is a natural phenomenon, particular attention should be paid to collection procedures in order to ensure that the depth of sampling can be determined and accounted for. We believe that the approach adopted here for studying a temporary and very unstable banquette, consisting of sampling along the sub-vertical fronts to characterize the deeper layers, represents a rapid and effective strategy and avoids more complex and time-consuming coring procedures, while reducing estimation errors relating to the compressive action induced by coring itself.
The results of the regression models incorporated in the volumetric continuum obtained by the superposition of the two DEMs, allowed sound determination of the total content of the various components throughout the study area. In more detail, the combined field and UAV photogrammetry approach revealed that banquette, although ephemeral, can accumulate huge amounts of vegetal biomass (i.e. about 1,500 tons dw) characterised by very high organic carbon and nitrogen content (i.e. about 390 and 8 tons dw, respectively). Although only smaller banquette have been studied so far, several studies have pointed out that the high biomass, carbon and nutrient accumulation makes seagrass beach wracks biochemical hotspots at the land-water interfaces (Coupland et al., 2007), critical sites involved in the coastal carbon and nutrient budget (Mateo et al., 2003; Mellbrand et al., 2011; Del Vecchio et al., 2013; Jiménez et al., 2017). The application of the approach to coastal areas with large and/or less accessible beach wracks described here will therefore clarify many still unclear aspects of their spatial and temporal dynamics and, especially if associated with flux estimates, their role in the exchange of carbon and across the land-ocean boundaries, a relevant and unexplored issue (Duarte, 2017).
The findings of this study also show that the banquette of Capo Feto traps large amounts of sand (almost 200 tons). This is of great relevance from both an ecological and management point of view. On the one hand, the sediment trapping ability of seagrass beach wracks and, especially, banquette protects beaches from coastal erosion, supports the formation of coastal dunes and prevents wind-induced sand transport (De Falco et al., 2008; Boudouresque et al., 2016). On the other hand, the widespread management practice of beach cleaning through beach wrack removal is associated with sediment subtraction that, in turn, contributes to beach erosion (De Falco et al., 2008; Mossbauer et al., 2012).
Given that the banquette studied formed within one year, it was possible to associate them with the primary production levels of the surrounding Posidonia oceanica meadow. Based on the available data, a vast meadow occupying about 8,300 ha of seabed from the surface (personal observations) to about 33 m (ROV inspections - AA.VV., 2002) is located in front of the Capo Feto coast (15,000 m long), in the middle of which lies the studied banquette. At a depth of 16 m, which corresponds to the average depth of P. oceanica in the area, total annual primary production (blades + sheaths + rhizomes) is estimated at 342.2 g dw m-2 y-1, according to the general regression reported in Pergent et al. (1997). Considering that the banquette of this study consisted mainly of leaf detritus and that leaf blades account for 79% of total primary production (Pergent-Martini et al., 2021), we estimated the overall production of this tissue equalled 22,329 tons dw y-1. Relating this value to coast length, we found that the adjacent meadow produces on average 1.5 ton dw m-1 y-1, which corresponds to slightly more than half of the value we obtained for the banquette biomass (2.5 ton dw m-1, Table 3). Assuming that the export of necromass from the seagrass meadows ranges between 10 and 55% of primary production and that shallow meadows are those most involved in the formation of beach wracks (Boudouresque et al., 2016), it follows that the banquette of Capo Feto is fed by seagrass detritus deriving also from other meadows located at greater distances, unlike the findings of Mateo et al. (2003). Leaf fall, which mainly occurs in late summer/autumn, is considered the main process responsible for carbon and nutrient loss from seagrasses (Romero et al., 2006). The TOC, N and P percentages estimated here (25.70, 0.54 and 0.03% respectively) in the Capo Feto banquette are consistent with the leaf litter nutrient content recorded by (Mateo et al., 2003; Mateo et al., 2006). Given that the export of blue carbon and nutrients from seagrass meadows toward other ecosystems follow parallel fluxes (sensu Mateo et al., 2006), the very high TOC, N and P bulk content found results from the high leaf primary production of the surrounding P. oceanica meadow conveyed at the Faro beach by the peculiar coastal morphology and hydrodynamic regime of the area. Considering that only a small portion of the banquette is thought to decompose on the beach, while most of it is exported inshore or offshore (Jiménez et al., 2017), new questions arise about the importance of such ephemeral systems as sinks/sources of organic matter, blue carbon and nutrients at regional or even global scale.
In conclusion, this study enabled us to estimate the amount and spatial distribution of both vegetal biomass and sedimentary mass, as well as blue carbon, nitrogen and phosphorus. On the one side, this study underlined the high potential of low-cost UAV surveys in 3D mapping and monitoring natural systems of high ecological importance and role, such as the “Multiple Mega-Ridge banquette”. On the other side, the combination of high-resolution photogrammetry with a field-based analytical approach opens new scenarios, allowing us to understand the spatial and temporal dynamics of banquette formation and accumulation, with relevant implications for ecosystem service estimation and coastal zone management. P. oceanica provides the crucial regulating ecosystem service “coastal erosion protection”, whose economic value of the associated goods and benefits for humans has been recently estimated as 188€/ha, corresponding to about 50% of the entire economic value of P. oceanica (Campagne et al., 2014). However, this is a cumulative value embedding the contribution of living meadows, matte and banquette ecosystem services, and therefore it is not possible to distinguish the specific contribution of the three different components. The relatively straightforward methodology proposed here for accurately estimating the size and dynamics of the banquette will facilitate filling this gap. On the other hand, although beach wracks and banquette are included among the priority habitats to be preserved and protected in the Mediterranean area, according to the Barcelona Convention (UNEP/MAP, 2017), legislation about their management is still lacking in many Mediterranean countries, including Italy (Rotini et al., 2020). Under this framework, the methodology applied in this study may represent a valid approach supporting applications of National and European laws concerning the monitoring and management of banquette (MSFD EC, 2008; MATTM, 2019) and meeting the requirements of the Integrated Coastal Zone Management of the Mediterranean (ICZM) protocols. Moreover, as many sites along the Mediterranean coasts are affected by these short-term accumulation phenomena, the adoption of such effective tool to map them would also serve to quantify the blue carbon and nutrient exchange between the emerged and submerged coasts.
Data Availability Statement
The raw data supporting the conclusions of this article will be made available by the authors, without undue reservation.
Author Contributions
AT and SV conceived, designed, and supervised data integration and interpretation. AB and SR performed data processing, mapping, and geomorphological data interpretation. GR performed the remote sensing data planning and geomorphological interpretation. GS and CA analysed and interpreted compositional and chemical data. GC performed the statistical analysis. FC performed the field data sampling and analysis. AT, SR, GR, and AS funded the study. All authors contributed to the manuscript drafting and revision. All authors read and approved the submitted version.
Funding
This study was funded by the European Regional Development Fund (INTERREG Italia–Malta) under Projects: BESS - Pocket Beach Management and Remote Surveillance System (CUP B66C18000380005), Sea Forest LIFE 17CCM/IT 000121 project and MED Dé.Co.U. Plages project.
Conflict of Interest
The authors declare that the research was conducted in the absence of any commercial or financial relationships that could be construed as a potential conflict of interest.
Publisher’s Note
All claims expressed in this article are solely those of the authors and do not necessarily represent those of their affiliated organizations, or those of the publisher, the editors and the reviewers. Any product that may be evaluated in this article, or claim that may be made by its manufacturer, is not guaranteed or endorsed by the publisher.
Acknowledgments
The authors are grateful to Andrea Savona, Vincenzo Pampalone, Mario Vitti and Francesco Gregorio for their help in cartographic surveys and image acquisition. The authors are also grateful to Simona Noè and Silvia Chemello for the sampling activities and Cecilia Doriana Tramati, Adele Elisa Aleo and Lea Castellini for the laboratory activities. The authors are grateful to two reviewers for the comments that have improved the manuscript.
Supplementary Material
The Supplementary Material for this article can be found online at: https://www.frontiersin.org/articles/10.3389/fmars.2022.903138/full#supplementary-material
References
AA.VV (2002). Mappatura Delle Praterie Di Posidonia Oceanica Lungo Le Coste Della Sicilia E Delle Isole Circostanti (Italy: Ministero dell’Ambiente – Servizio Difesa del Mare).
Adade R., Aibinu A. M., Ekumah B., Asaana J. (2021). Unmanned Aerial Vehicle (UAV) Applications in Coastal Zone Management—a Review. Environ. Monit. Assess. 193, 154. doi: 10.1007/s10661-021-08949-8
Anderson K., Gaston K. J. (2013). Lightweight Unmanned Aerial Vehicles Will Revolutionize Spatial Ecology. Front. Ecol. Environ. 11, 138–146. doi: 10.1890/120150
Anderson M. J., Gorley R. N., Clarke K. R. (2008). “PERMANOVA+ for PRIMER: Guide to Software and Statistical Methods,” in PRIMER-E (UK: Plymouth), 1–214. doi: 10.13564/j.cnki.issn.1672-9382.2013.01.010
Apostolopoulos D., Nikolakopoulos K. (2021). A Review and Meta-Analysis of Remote Sensing Data, GIS Methods, Materials and Indices Used for Monitoring the Coastline Evolution Over the Last Twenty Years. Eur. J. Remote Sens. 54, 240–265. doi: 10.1080/22797254.2021.1904293
Beltran R., Beca-Carretero P., Marbà N., Jiménez M. A., Traveset A. (2020). Spatio-Temporal Variation in Macrofauna Community Structure in Mediterranean Seagrass Wrack. Food Webs. 25, e00178. doi: 10.1016/j.fooweb.2020.e00178
Boudouresque C. F., Meinesz A. (1982). Découverte De L’herbier De Posidonie. Parc National De Port-Cros. Cahier 4, 1–80.
Boudouresque C. F., Pergent G., Pergent-Martini C., Ruitton S., Thibaut T., Verlaque M. (2016). The Necromass of the Posidonia Oceanica Seagrass Meadow: Fate, Role, Ecosystem Services and Vulnerability. Hydrobiologia 781, 25–42. doi: 10.1007/s10750-015-2333-y
Calvo S., Tomasello A., Di Maida G., Pirrotta M., Cristina Buia M., Cinelli F., et al. (2010). Seagrasses Along the Sicilian Coasts. Chem. Ecol. 26, 249–266. doi: 10.1080/02757541003636374
Campagne C. S., Salles J. M., Boissery P., Deter J. (2014). The Seagrass Posidonia Oceanica: Ecosystem Services Identification and Economic Evaluation of Goods and Benefits. Mar. pollut. Bull. 97, 391–400. doi: 10.1016/j.marpolbul.2015.05.061
Casella E., Collin A., Harris D., Ferse S., Bejarano S., Parravicini V., et al. (2017). Mapping Coral Reefs Using Consumer-Grade Drones and Structure From Motion Photogrammetry Techniques. Coral Reefs 36, 269–275. doi: 10.1007/s00338-016-1522-0
Castellanos-Galindo G. A., Casella E., Mejía-Rentería J. C., Rovere A. (2019). Habitat Mapping of Remote Coasts: Evaluating the Usefulness of Lightweight Unmanned Aerial Vehicles for Conservation and Monitoring. Biol. Conserv. 239, 108282. doi: 10.1016/j.biocon.2019.108282
Chawla A., Spindler D. M., Tolman H. L. (2013). Validation of a Thirty Year Wave Hindcast Using the Climate Forecast System Reanalysis Winds. Ocean Model. 70, 189–206. doi: 10.1016/j.ocemod.2012.07.005
Colombini I., Mateo M.Á., Serrano O., Fallaci M., Gagnarli E., Serrano L., et al. (2009). On the Role of Posidonia Oceanica Beach Wrack for Macroinvertebrates of a Tyrrhenian Sandy Shore. Acta Oecologica. 35, 32–44. doi: 10.1016/j.actao.2008.07.005
Coupland G. T., Duarte C. M., Walker D. I. (2007). High Metabolic Rates in Beach Cast Communities. Ecosystems 10, 1341–1350. doi: 10.1007/s10021-007-9102-3
De Falco G., Simeone S., Baroli M. (2008). Management of Beach-Cast Posidonia Oceanica Seagrass on the Island of Sardinia (Italy, Western Mediterranean). J. Coast. Res. 24, 69–75. doi: 10.2112/06-0800.1
de Grissac J. (1984). Effets des herbiers à Posidonia oceanica sur la dynamique marine et la sédimentologie littorale. In: Boudouresque C.F., Jeudy de Grissac A., Olivier J. (Eds.), GIS Posidonie. (Marseille, France: I-International Workshop on Posidonia oceanica bed. pp. 437–443.
Deidun A., Gauci A., Lagorio S., Galgani F. (2018). Optimising Beached Litter Monitoring Protocols Through Aerial Imagery. Mar. pollut. Bull. 131, 212–217. doi: 10.1016/j.marpolbul.2018.04.033
Del Vecchio S., Jucker T., Carboni M., Acosta A. T. R. (2017). Linking Plant Communities on Land and at Sea: The Effects of Posidonia Oceanica Wrack on the Structure of Dune Vegetation. Estuar. Coast. Shelf Sci. 184, 30–36. doi: 10.1016/j.ecss.2016.10.041
Del Vecchio S., Marbà N., Acosta A., Vignolo C., Traveset A. (2013). Effects of Posidonia Oceanica Beach-Cast on Germination, Growth and Nutrient Uptake of Coastal Dune Plants. PLoS One 8, e70607. doi: 10.1371/journal.pone.0070607
Di Carlo G., Badalamenti F., Jensen A. C., Koch E. W., Riggio S. (2005). Colonisation Process of Vegetative Fragments of Posidonia Oceanica (L.) Delile on Rubble Mounds. Mar. Biol. 147, 1261–1270. doi: 10.1007/s00227-005-0035-0
Duarte C. M. (2017). Reviews and Syntheses: Hidden Forests, the Role of Vegetated Coastal Habitats in the Ocean Carbon Budget. Biogeosciences 14, 301–310. doi: 10.5194/bg-14-301-2017
Duong H. L. S., Fairweather P. G. (2011). Effects of Sandy Beach Cusps on Wrack Accumulation, Sediment Characteristics and Macrofaunal Assemblages. Austral Ecol. 36, 733–744. doi: 10.1111/j.1442-9993.2010.02212.x
Gómez-Pujol L., Orfila A., Álvarez-Ellacuría A., Terrados J., Tintoré J. (2013). Posidonia Oceanica Beach-Cast Litter in Mediterranean Beaches: A Coastal Videomonitoring Study. J. Coast. Res. 165, 1768–1773. doi: 10.2112/si65-299.1
Jiménez M. A., Beltran R., Traveset A., Calleja M. L., Delgado-Huertas A., Marbà N. (2017). Aeolian Transport of Seagrass (Posidonia Oceanica) Beach-Cast to Terrestrial Systems. Estuar. Coast. Shelf Sci. 196, 31–44. doi: 10.1016/j.ecss.2017.06.035
Lastra M., Page H. M., Dugan J. E., Hubbard D. M., Rodil I. F. (2008). Processing of Allochthonous Macrophyte Subsidies by Sandy Beach Consumers: Estimates of Feeding Rates and Impacts on Food Resources. Mar. Biol. 154, 163–174. doi: 10.1007/s00227-008-0913-3
Lovison G., Sciandra M., Tomasello A., Calvo S. (2011). Modeling Posidonia Oceanica Growth Data: From Linear to Generalized Linear Mixed Models. Environmetrics 22, 370–382. doi: 10.1002/env.1063
Maccarrone V. (2010). Determination of the Upper Boundary of a Posidonia Meadow. Ecol. Inform. 5, 267–272. doi: 10.1016/j.ecoinf.2009.11.001
Mateo M. A. (2010). Beach-Cast Cymodocea Nodosa Along the Shore of a Semienclosed Bay: Sampling and Elements to Assess its Ecological Implications. J. Coast. Res. 26, 283–291. doi: 10.2112/08-1100.1
Mateo M. A., Cebrián J., Dunton K., Mutchler T. (2006). “Carbon Flux in Seagrass Ecosystems,” in Seagrasses: Biology, Ecology and Conservation (Dodrecht: The Nederlands: Springer), 159–162. doi: 10.1007/978-1-4020-2983-7_7
Mateo M.Á., Sánchez-Lizaso J. L., Romero J. (2003). Posidonia Oceanica “Banquettes”: A Preliminary Assessment of the Relevance for Meadow Carbon and Nutrients Budget. Estuar. Coast. Shelf Sci. 56, 85–90. doi: 10.1016/S0272-7714(02)00123-3
MATTM (2019). Circular of Ministry of the Environment and Protection of the Territory and the Sea, n. 8838/2019 “gestione degli accumuli di Posidonia oceanica” spiaggiati.
Mellbrand K., Lavery P. S., Hyndes G., Hambäck P. A. (2011). Linking Land and Sea: Different Pathways for Marine Subsidies. Ecosystems 14, 732–744. doi: 10.1007/s10021-011-9442-x
Mossbauer M., Haller I., Dahlke S., Schernewski G. (2012). Management of Stranded Eelgrass and Macroalgae Along the German Baltic Coastline. Ocean Coast. Manage. 57, 1–9. doi: 10.1016/j.ocecoaman.2011.10.012
MSFD EC (2008). Directive 2008/56/EC of the European Parliament and of the Council of 17 June 2008 Establishing a Framework for Community Action in the Field of Marine Environmental Policy (Strasbourg, France: Marine Strategy Framework Directive), 19–40.
Murfitt S. L., Allan B. M., Bellgrove A., Rattray A., Young M. A., Ierodiaconou D. (2017). Applications of Unmanned Aerial Vehicles in Intertidal Reef Monitoring. Sci. Rep. 7, 1–11. doi: 10.1038/s41598-017-10818-9
Ochieng C. A., Erftemeijer P. L. A. (1999). Accumulation of Seagrass Beach Cast Along the Kenyan Coast: A Quantitative Assessment. Aquat. Bot. 65, 221–238. doi: 10.1016/S0304-3770(99)00042-X
Ondiviela B., Losada I. J., Lara J. L., Maza M., Galván C., Bouma T. J., et al. (2014). The Role of Seagrasses in Coastal Protection in a Changing Climate. Coast. Eng. 87, 158–168. doi: 10.1016/j.coastaleng.2013.11.005
Pan Y., Ayoub N., Schneider-Kamp P., Flindt M., Holmer M. (2022). Beach Wrack Dynamics Using a Camera Trap as the Real-Time Monitoring Tool. Front. Mar. Sci. 9. doi: 10.3389/fmars.2022.813516
Pan Y., Flindt M., Schneider-Kamp P., Holmer M. (2021). Beach Wrack Mapping Using Unmanned Aerial Vehicles for Coastal Environmental Management. Ocean Coast. Manage. 213, 105843. doi: 10.1016/j.ocecoaman.2021.105843
Pergent-Martini C., Pergent G., Monnier B., Boudouresque C. F., Mori C., Valette-Sansevin A. (2021). Contribution of Posidonia Oceanica Meadows in the Context of Climate Change Mitigation in the Mediterranean Sea. Mar. Environ. Res. 172, 105454. doi: 10.1016/j.marenvres.2020.105236
Pergent G., Rico-Raimondino V., Pergent-Martini C. (1997). Fate of Primary Production in Posidonia Oceanica Meadows of the Mediterranean. Aquat. Bot. 59, 307–321. doi: 10.1016/S0304-3770(97)00052-1
Pernice G., Placenti F., Spina A. (2004). Long-Term Analysis, (1863-2002) of Environmental Change in the Capo Feto Area (Mediterranean Sea). Chem. Ecol. 20, 37–41. doi: 10.1080/02757540410001665962
Randazzo G., Lanza S. (2020). Regional Plan Against Coastal Erosion: A Conceptual Model for Sicily. Land 9, 1–14. doi: 10.3390/land9090307
Randazzo G., Italiano F., Micallef A., Tomasello A., Cassetti F. P., Zammit A., et al. (2021). WebGIS implementation for dynamic mapping and visualization of coastal geospatial data: A case study of BESS project. Appl. Sci. 11, 8233. doi:10.3390/app11178233
R Core Team (2018). R: A Language and Environment for Statistical Computing (Vienna, Austria: R Foundation for Statistical Computing). Available at: https://www.R-project.org/.
Remondino F., Barazzetti L., Nex F., Scaioni M., Sarazzi D. (2011). UAV Photogrammetry for Mapping and 3d Modeling – current status and future perspectives. Int. Arch. Photogramm. Remote Sens. Spat. Inf. Sci. XXXVIII-1/, 25–31. doi: 10.5194/isprsarchives-XXXVIII-1-C22-25-2011
Rende S. F., Bosman A., Di Mento R., Bruno F., Lagudi A., Irving A. D., et al. (2020). Ultra-High-Resolution Mapping of Posidonia Oceanica (L.) Delile Meadows Through Acoustic, Optical Data and Object-Based Image Classification. J. Mar. Sci. Eng. 8, 647. doi: 10.3390/JMSE8090647
Rende S. F., Bosman A., Menna F., Lagudi A., Bruno F., Severino U., et al. (2022). Assessing Seagrass Restoration Actions Through a Micro-Bathymetry Survey Approach (Italy, Mediterranean Sea). Water 14, 1285. doi: 10.3390/w14081285
Roig Munar F. X., Prieto J.Á.M. (2005). Efectos De La Retirada De Bermas Vegetales De Posidonia Oceanica Sobre Playas De Las Islas Baleares: Consecuencias De La Presión Turística. Investig. Geogr. 52, 40–52. doi: 10.14350/rig.30080
Romero J., Lee K. S., Pérez M., Mateo M. A., Alcoverro T. (2006). “Nutrient Dynamics in Seagrass Ecosystems,” in Seagrasses: Biology, Ecology and Conservation (Dodrecht: The Nederlands: Springer), 227–254. doi: 10.1007/978-1-4020-2983-7_9
Rotini A., Chiesa S., Manfra L., Borrello P., Piermarini R., Silvestri C., et al. (2020). Effectiveness of the “Ecological Beach” Model: Beneficial Management of Posidonia Beach Casts and Banquette. Water (Switzerland) 12, 1–16. doi: 10.3390/w12113238
Schofield G., Esteban N., Katselidis K. A., Hays G. C. (2019). Drones for Research on Sea Turtles and Other Marine Vertebrates – A Review. Biol. Conserv. 238, 108214. doi: 10.1016/j.biocon.2019.108214
Simeone S., De Falco G. (2012). Morphology and Composition of Beach-Cast Posidonia Oceanica Litter on Beaches With Different Exposures. Geomorphology 151–152, 224–233. doi: 10.1016/j.geomorph.2012.02.005
Simeone S., De Muro S., De Falco G. (2013). Seagrass Berm Deposition on a Mediterranean Embayed Beach. Estuar. Coast. Shelf Sci. 135, 171–181. doi: 10.1016/j.ecss.2013.10.007
Tomasello A., Cassetti F. P., Savona A., Pampalone V., Pirrotta M., Signa G., et al. (2020). The Use of Very High Resolution Images for Studying Posidonia Oceanica Reefs. Vie Milieu 70, 25–35.
Underwood, A. J (1997). Experiments in Ecology: Their Logical Design and Interpretation Using Analysis of Variance (UK: Cambridge University Press).
UNEP/MAP (2017). Convention for the Protection of the Marine Environment and the Coastal Region of the Mediterranean (Barcelona, Spain: Barcelona Convention) - UNEP(DEPI)/MED).
Ventura D., Bonifazi A., Gravina M. F., Belluscio A., Ardizzone G. (2018). Mapping and Classification of Ecologically Sensitive Marine Habitats Using Unmanned Aerial Vehicle (UAV) Imagery and Object-Based Image Analysis (OBIA). Remote Sens. 10, 1–23. doi: 10.3390/rs10091331
Vizzini S. (2009). Analysis of the Trophic Role of Mediterranean Seagrasses in Marine Coastal Ecosystems: A Review. Bot. Mar. 52, 383–393. doi: 10.1515/bot.2009.056
Keywords: blue carbon, nitrogen, drone, seascape, seagrass, litter, detritus, mega-ridge banquette
Citation: Tomasello A, Bosman A, Signa G, Rende SF, Andolina C, Cilluffo G, Cassetti FP, Mazzola A, Calvo S, Randazzo G, Scarpato A and Vizzini S (2022) 3D-Reconstruction of a Giant Posidonia oceanica Beach Wrack (Banquette): Sizing Biomass, Carbon and Nutrient Stocks by Combining Field Data With High-Resolution UAV Photogrammetry. Front. Mar. Sci. 9:903138. doi: 10.3389/fmars.2022.903138
Received: 23 March 2022; Accepted: 26 May 2022;
Published: 23 June 2022.
Edited by:
Monica Montefalcone, University of Genoa, ItalyReviewed by:
Joseph Anthony Borg, University of Malta, MaltaArnaldo Marín, University of Murcia, Spain
Copyright © 2022 Tomasello, Bosman, Signa, Rende, Andolina, Cilluffo, Cassetti, Mazzola, Calvo, Randazzo, Scarpato and Vizzini. This is an open-access article distributed under the terms of the Creative Commons Attribution License (CC BY). The use, distribution or reproduction in other forums is permitted, provided the original author(s) and the copyright owner(s) are credited and that the original publication in this journal is cited, in accordance with accepted academic practice. No use, distribution or reproduction is permitted which does not comply with these terms.
*Correspondence: Geraldina Signa, geraldina.signa@unipa.it; Alessandro Bosman, alessandro.bosman@cnr.it