Predicting the Effects of Climate Change on the Suitable Habitat of Japanese Spanish Mackerel (Scomberomorus niphonius) Based on the Species Distribution Model
 Tianyan Yang
 Xingyu Liu
 Zhiqiang Han
- Fishery College, Zhejiang Ocean University, Zhoushan, China
Japanese Spanish mackerel (Scomberomorus niphonius) is an important commercial fish species with a seasonal migratory habit in China. At present, no study has reported the seasonal variation of its potential suitable habitat. Therefore, we used biomod2 ensemble model to predict the potential suitable habitat of S. niphonius in different seasons through its current distribution sites and future environmental variables. Our results showed that the ensemble model had a high accuracy, with true skill statistics and receiver operator characteristic values of 0.91 and 0.98, respectively. Under the Representative Concentration Pathway (RCP) 4.5 scenario, the reduction rate of suitable habitats in summer of 2050 will be 33.2%, and those for the rest of the seasons will reach 3.5%. The reduction rate in summer of 2100 will be 43.5%, and those for the remaining seasons will reach 6.5%. In addition, this reduction rate will become more serious with the increase in emission scenario and time, especially in the RCP8.5 in which the summer reduction rate is as high as 88.9%. Habitat changes in summer show a strong temperature sensitivity. The distribution centroid of S. niphonius will shift to higher latitudes under RCP 4.5 and RCP 8.5. Depth and temperature are the two most important factors that affect the distribution of this species. The results can provide basic data for understanding the adaptability of S. niphonius to climate change and establishing an elastic ecosystem.
Introduction
The Japanese Spanish mackerel (Scomberomorus niphonius) is a large, warm-water, pelagic fish species widely distributed in the subtropical and temperate waters of Northwest Pacific Ocean. It is mainly distributed in East China Sea, Yellow Sea, and Bohai Sea and is one of the most important commercial fisheries in China (Zhu et al., 1963; Shui et al., 2009; Jiang et al., 2020). Since the 1950s, S. niphonius has been extensively exploited. In 1999, the production of S. niphonius in China, Japan, and South Korea was 5.89×10⁵t, which was the highest in history. The catch of China was maintained above 4.0×10⁵ in recent years, accounting for 80% of the total catch of the three countries (Ministry of Agriculture and Rural Affairs, 1998–2020).
Water temperature is the main driving force of S. niphonius resource variation and migration. In spring (mid-March), as the water temperature in the sea rises, S. niphonius migrates northward from East China Sea to the coast of Yellow Sea and Bohai Sea to breed. Then, it migrates southward as the water temperature drops in autumn to return to East China Sea for the winter (Liu et al., 1982). S. niphonius is highly sensitive to water temperature, and its different stages of life history reveal various adaptability requirements for water temperature; water temperature is closely related to the migration distribution of S. niphonius (Wei, 1980).
An increasing number of studies have shown that climate change has affected species composition and resource changes, habitat distribution, and migration routes (Cai et al., 2020). A study also showed that the centroid shift of fishing ground is related to surface water temperature, and the higher the water temperature, the higher the latitude of centroid distribution (Ma et al., 2021). Therefore, climate change may affect the growth, reproduction, and survival of S. niphonius by altering environmental factors. The dominant ages of S. niphonius caught in recent years have dropped from the third and second instars to the second and first instars, and the average mass has dropped by about 150 g. Other biological characteristics also indicate that although S. niphonius has a high catch, it currently faces a trend of resource decline (Zheng et al., 2014).
Species distribution models (SDMs) are tools used to predict and simulate the potential distribution and habitat preference of species based on known distribution points, environmental variables, and their relationships. They are widely used in the prediction of the distribution area of terrestrial and marine organisms (Araújo et al., 2007; Franklin, 2010). The ensemble model has extensive input objects, high accuracy, and excellent universality, making it an important tool for distribution prediction (Aguirre-Gutiérrez et al., 2013). Zhang et al. (2019) predicted the potential distribution area of Engraulis japonicusin 2050 and 2100 under Representative Concentration Pathway (RCP) 4.5 and RCP8.5 climate scenarios using biomod2, and the results showed that the distribution of E. japonicus will decrease with the passage of climate scenarios and years. Xing et al. (2021) used the ensemble model to predict the potential distribution of Chelonia mydas in different time periods and inferred their migration routes. Liu et al. (2022) predicted the potential suitable habitat of Portunus trituratus, showing the desirable and inclusive performance of the ensemble model.
As an important commercial fish species in China, seasonal variation in the distribution of S. niphonius is affected by sea temperature. Therefore, seasonal variation in the distribution of S. niphonius was analyzed using current distribution data and current and future environmental data under different climate scenarios. The results are expected to provide basic information for understanding the responses of species to climate change.
Material and Methods
Japanese Spanish Mackerel Data
Current distribution data of S. niphonius were obtained from fishery resource surveys. From 1998 to 2000, the “Beidou” fishery research vessel investigated the fishery resources in Chinese offshore waters for four seasons (Jin et al., 2006; Tang et al., 2006). The density distribution of each fishery resource was sampled by a bottom trawl with a drag speed of about 3.0 knots. A total of 295 data were collected in spring, and 299 data were obtained in summer, autumn, and winter.
Current and Future Environmental Data
Considering the biological relevance and availability of environmental layer data, the SDM used five environmental variables, namely, sea surface temperature (SST), sea surface salinity (SSS), surface current velocity (SCV), offshore distance, and depth, under RCP4.5 and RCP8.5 climate scenarios for 2050 and 2100. Current and future environmental data were obtained from Bio-Oracle (http://www.bio-oracle.org) and the global marine environment dataset (http://gmed.auckland.ac.nz) (Morley and Heusser, 1997; Basher et al., 2014). Meanwhile, in the future environmental data layer, we used the environmental data of 2050 (2040–2050) and 2100 (2090–2100) under RCP4.5 and RCP8.5 scenarios to predict the suitable habitat for future species. Temperature directly affects the physiological habits of species, and a large seasonal difference exists in the temperature in monsoon climate (Doney et al., 2012). Therefore, we selected the temperature of the hottest month in Bio-Oracle database to represent the summer temperature, the temperature of the coldest month to represent the winter temperature, and the average temperature to represent the spring and autumn temperature. Annual averages were used for other environmental variables. In addition, the spatial resolution of each variable was 5×5 arcmin (the geographical coverage area was about 9.2×9.2 km2), and the Pearson correlation coefficient was lower than 0.7, which not only ensured the resolution matching but also eliminated redundancy among variables (Zhang et al., 2019).
Ensemble Model Construction
The flow chart of the ensemble model construction is as follows (Figure 1).
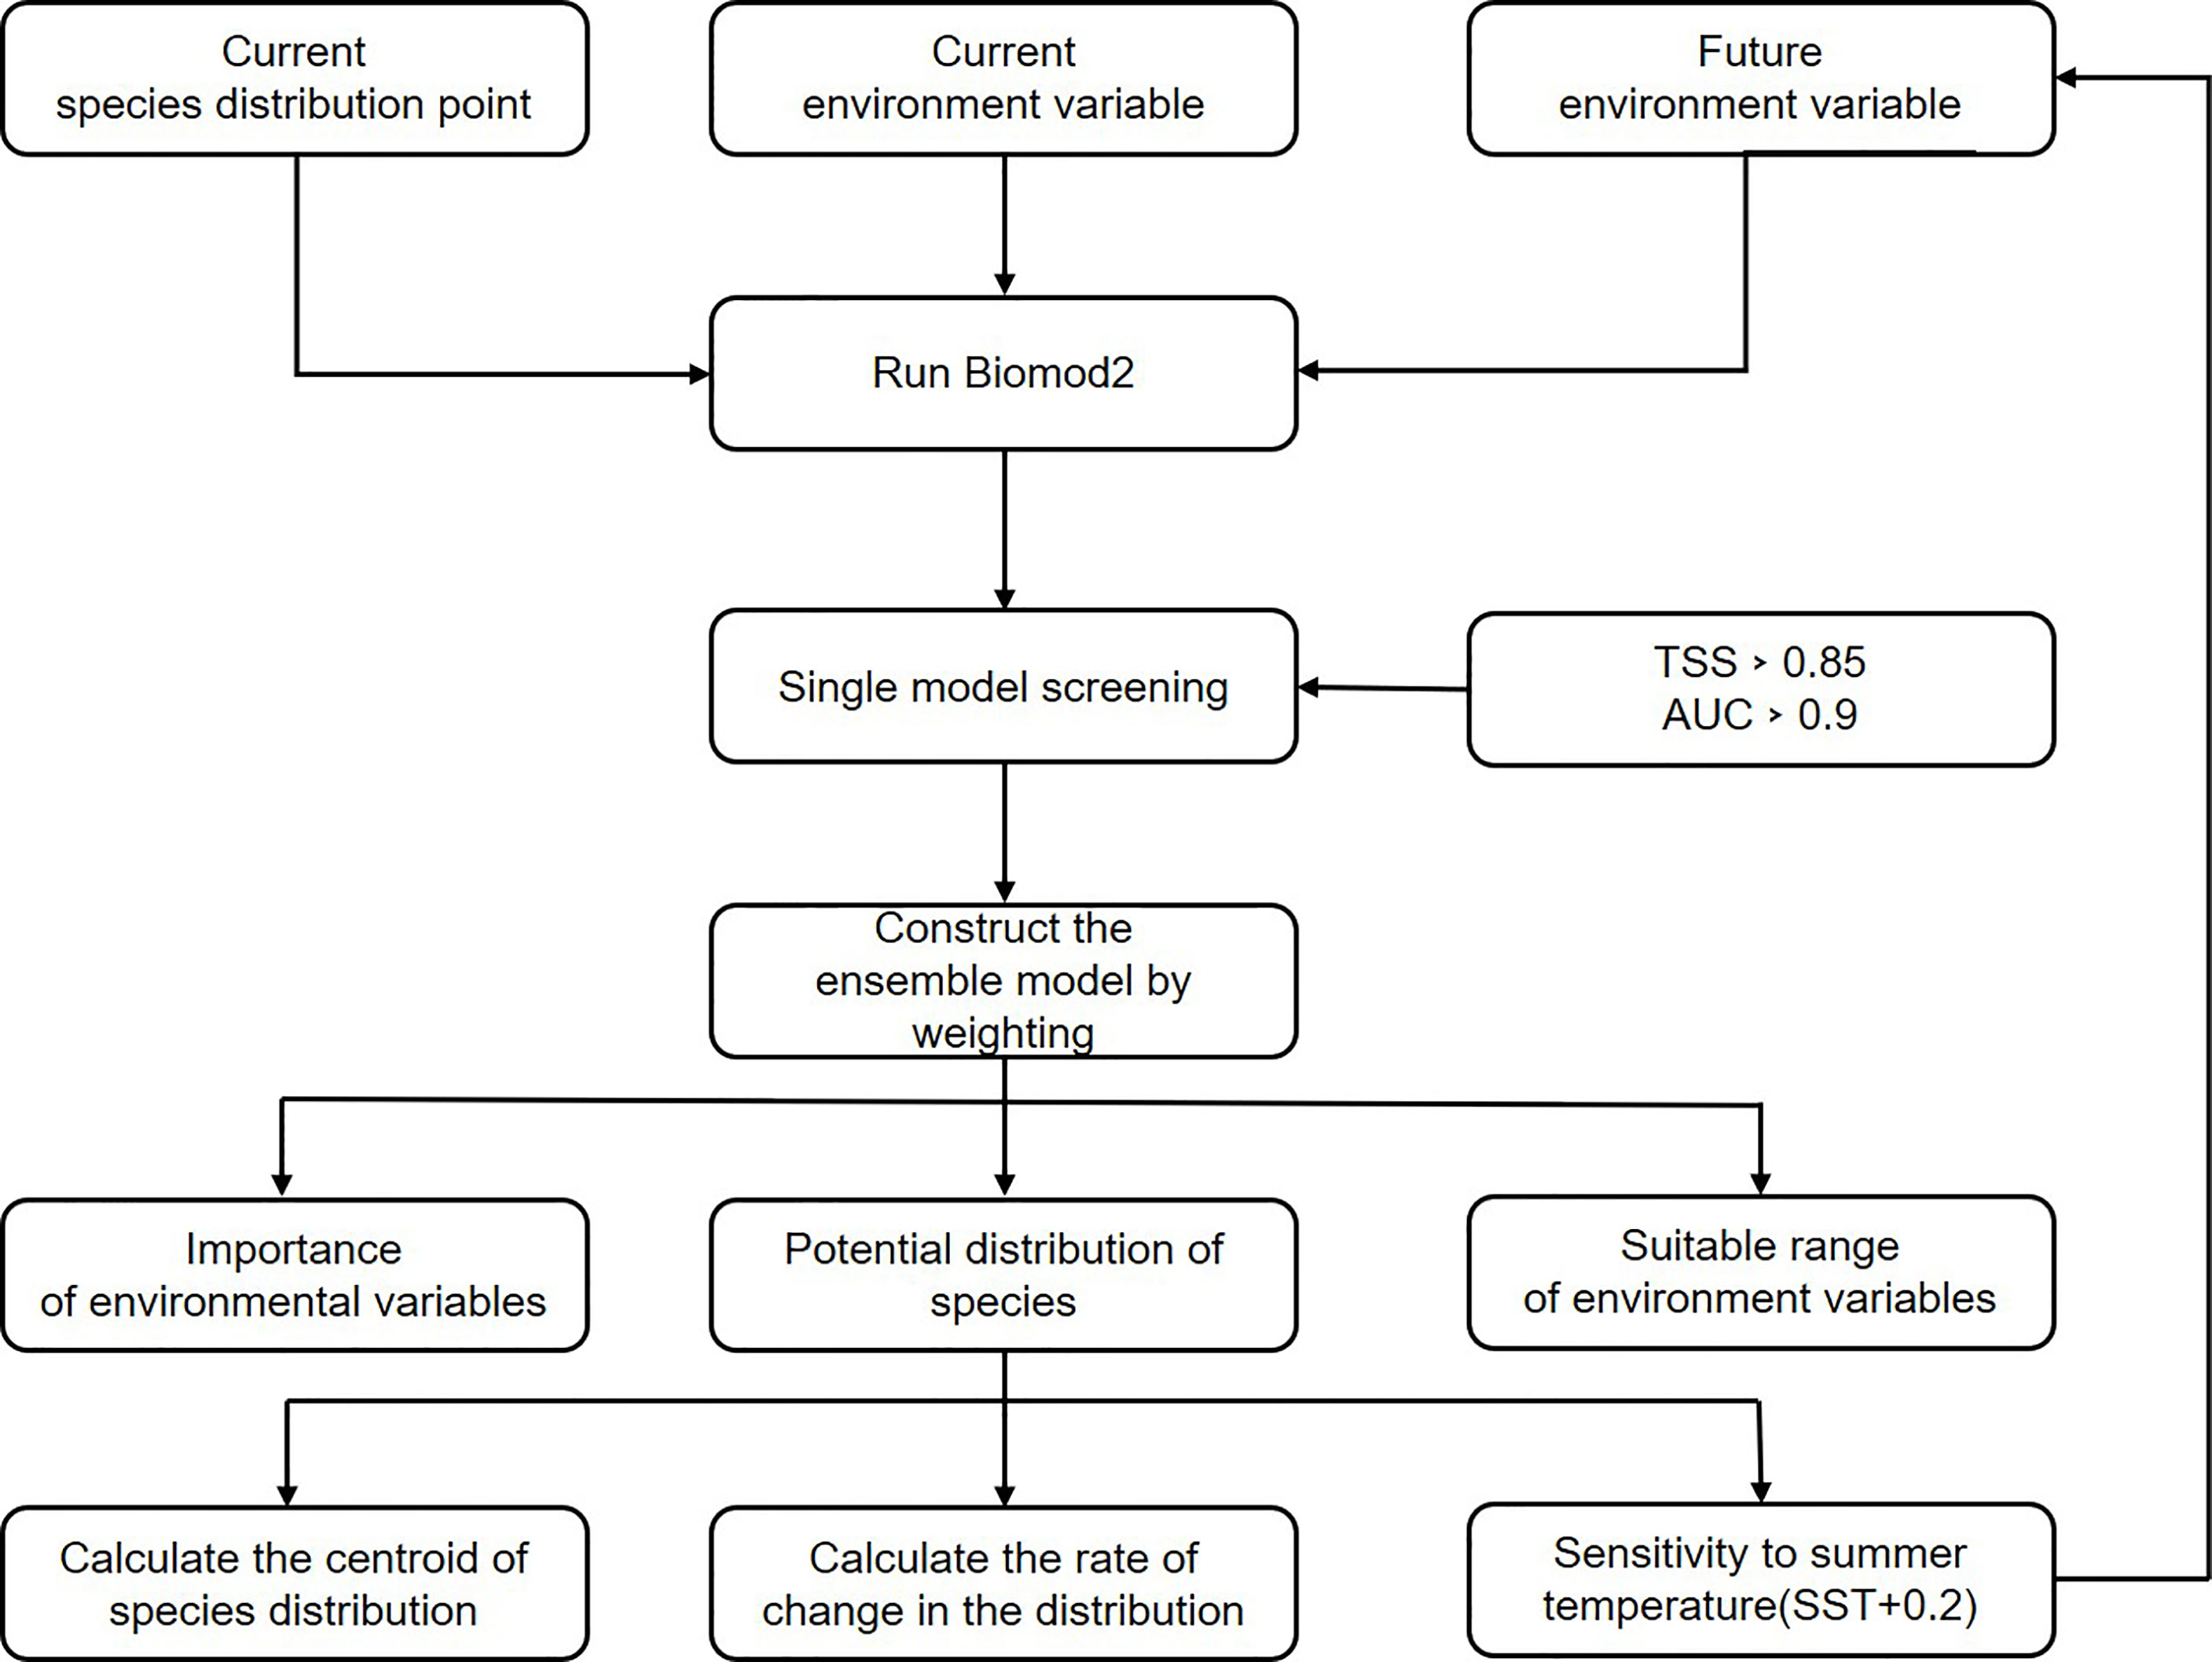
Figure 1 Flowchart for ensemble model construction (when calculating summer tempereture sensitivity, we used each summer temperature increase of 0.2oC as a new future sea surface temperature variable, all the way up to a 2oC increase.).
In this study, the weighted average method was adopted to gather nine single models in the software biomod2 to build an ensemble model. The models were generalized linear models, generalized additive model, generalized boosting model, random forest (RF), artificial neural network, classification tree analysis, surface range envelope (SRE), flexible discriminant analysis, and maximum entropy. The single model with a true skill statistics (TSS) value greater than 0.8 was selected as a weighted set to form an ensemble model. The value of each grid in the single model was then multiplied by the weight of the corresponding model and summed to obtain the result of the ensemble model. The formula of single-model weighting and ensemble model results is as follows (Zhu, 2019):
where Wj is the weight of j single-model results, rj is the TSS value of the jth single model, and h is the number of single model results when TSS is greater than 0.8.
Where yi is the habitat suitability index of the ith grid species, wj is the weight of the jth model, and xij is the value of the iTh grid in the jth model. The value range of yi is [0, 1000], and the closer yis to 1000, the better the environmental conditions of this grid for predicting species growth.)
Meanwhile, centroid changes in species distribution can be used to describe the geographical and spatial shifts of species. Therefore, we use the mean of the horizontal coordinate of species distribution data as the centroid. The formula for distribution centroid is as follows (Chen, 2014):
Where x is the latitude of the barycenter of species distribution, ci is the habitat suitability index of the ith grid, xi is the latitude of the ith species occurrence point, and n is the total number of species occurrence points.
To display the results of species distribution directly, we visualized the potential suitable habitat of species on R platform and calculated the distribution centroid and habitat reduction rate of S. niphonius. The habitat suitability index of a species translates the predicted results into a binary of 0 and 1 by defining thresholds. We tested the appropriate range of thresholds by comparing native range (Pan et al., 2020; Ohshimo et al., 2021, https://www.fishbase). When the threshold value was 0.3, the actual distribution of the species was consistent with the current distribution simulated by the model. Therefore, in this study the threshold was set as 300, that is, a value more than 300 indicates that species exist in the grid, and that less than 300 indicates the non-existence of a species. In addition, to study the temperature sensitivity of the species, we simulated the habitat change of S. niphonius when the temperature increased by 0°C–2°C in summer, using 0.2°C as a warming range.
Evaluation of Model Accuracy
Three statistical parameters, namely, Kappa statistics (Kappa), TSS, and receiver operator characteristic curve (ROC), were used to evaluate the accuracy of the combined prediction model. Kappa coefficient can be used to measure the degree of coincidence between the two labeling results, where the false positive rate is the abscissa, and the true rate is the ordinate. The AUC value represents the area of ROC, and the larger the area, the better the effect of the classifier. Therefore, the value range of AUC is [0.5–1]. When the AUC value is greater than 0.8, the model effect is great; when the AUC value is greater than 0.9, the model effect is excellent (Chu et al., 2017). The value of TSS is a combination of sensitivity and specificity indexes, and the negligence and substitution errors are considered. The value range is between [−1,1]; when the value is greater than 0.8, the fitting effect is excellent; when the value is between 0.6 and 0.8, the fitting effect is good; when the value is between 0.4 and 0.6, the fitting effect is average (Allouche et al., 2006; Piri Sahragard et al., 2018).
Result
Model Accuracy and Variables Importance
According to the results of model accuracy evaluation index, RF had the best fitting effect in single models, with TSS and AUC values of 0.90 and 0.96, respectively. The least effective was SRE, which had a TSS value of 0.75 and was not involved in the further construction of the ensemble model (Figure 2). The ensemble model has a higher performance than RF, with TSS and AUC values of 0.91 and 0.98, respectively. This finding shows that the ensemble model had a better simulation effect than the single model.
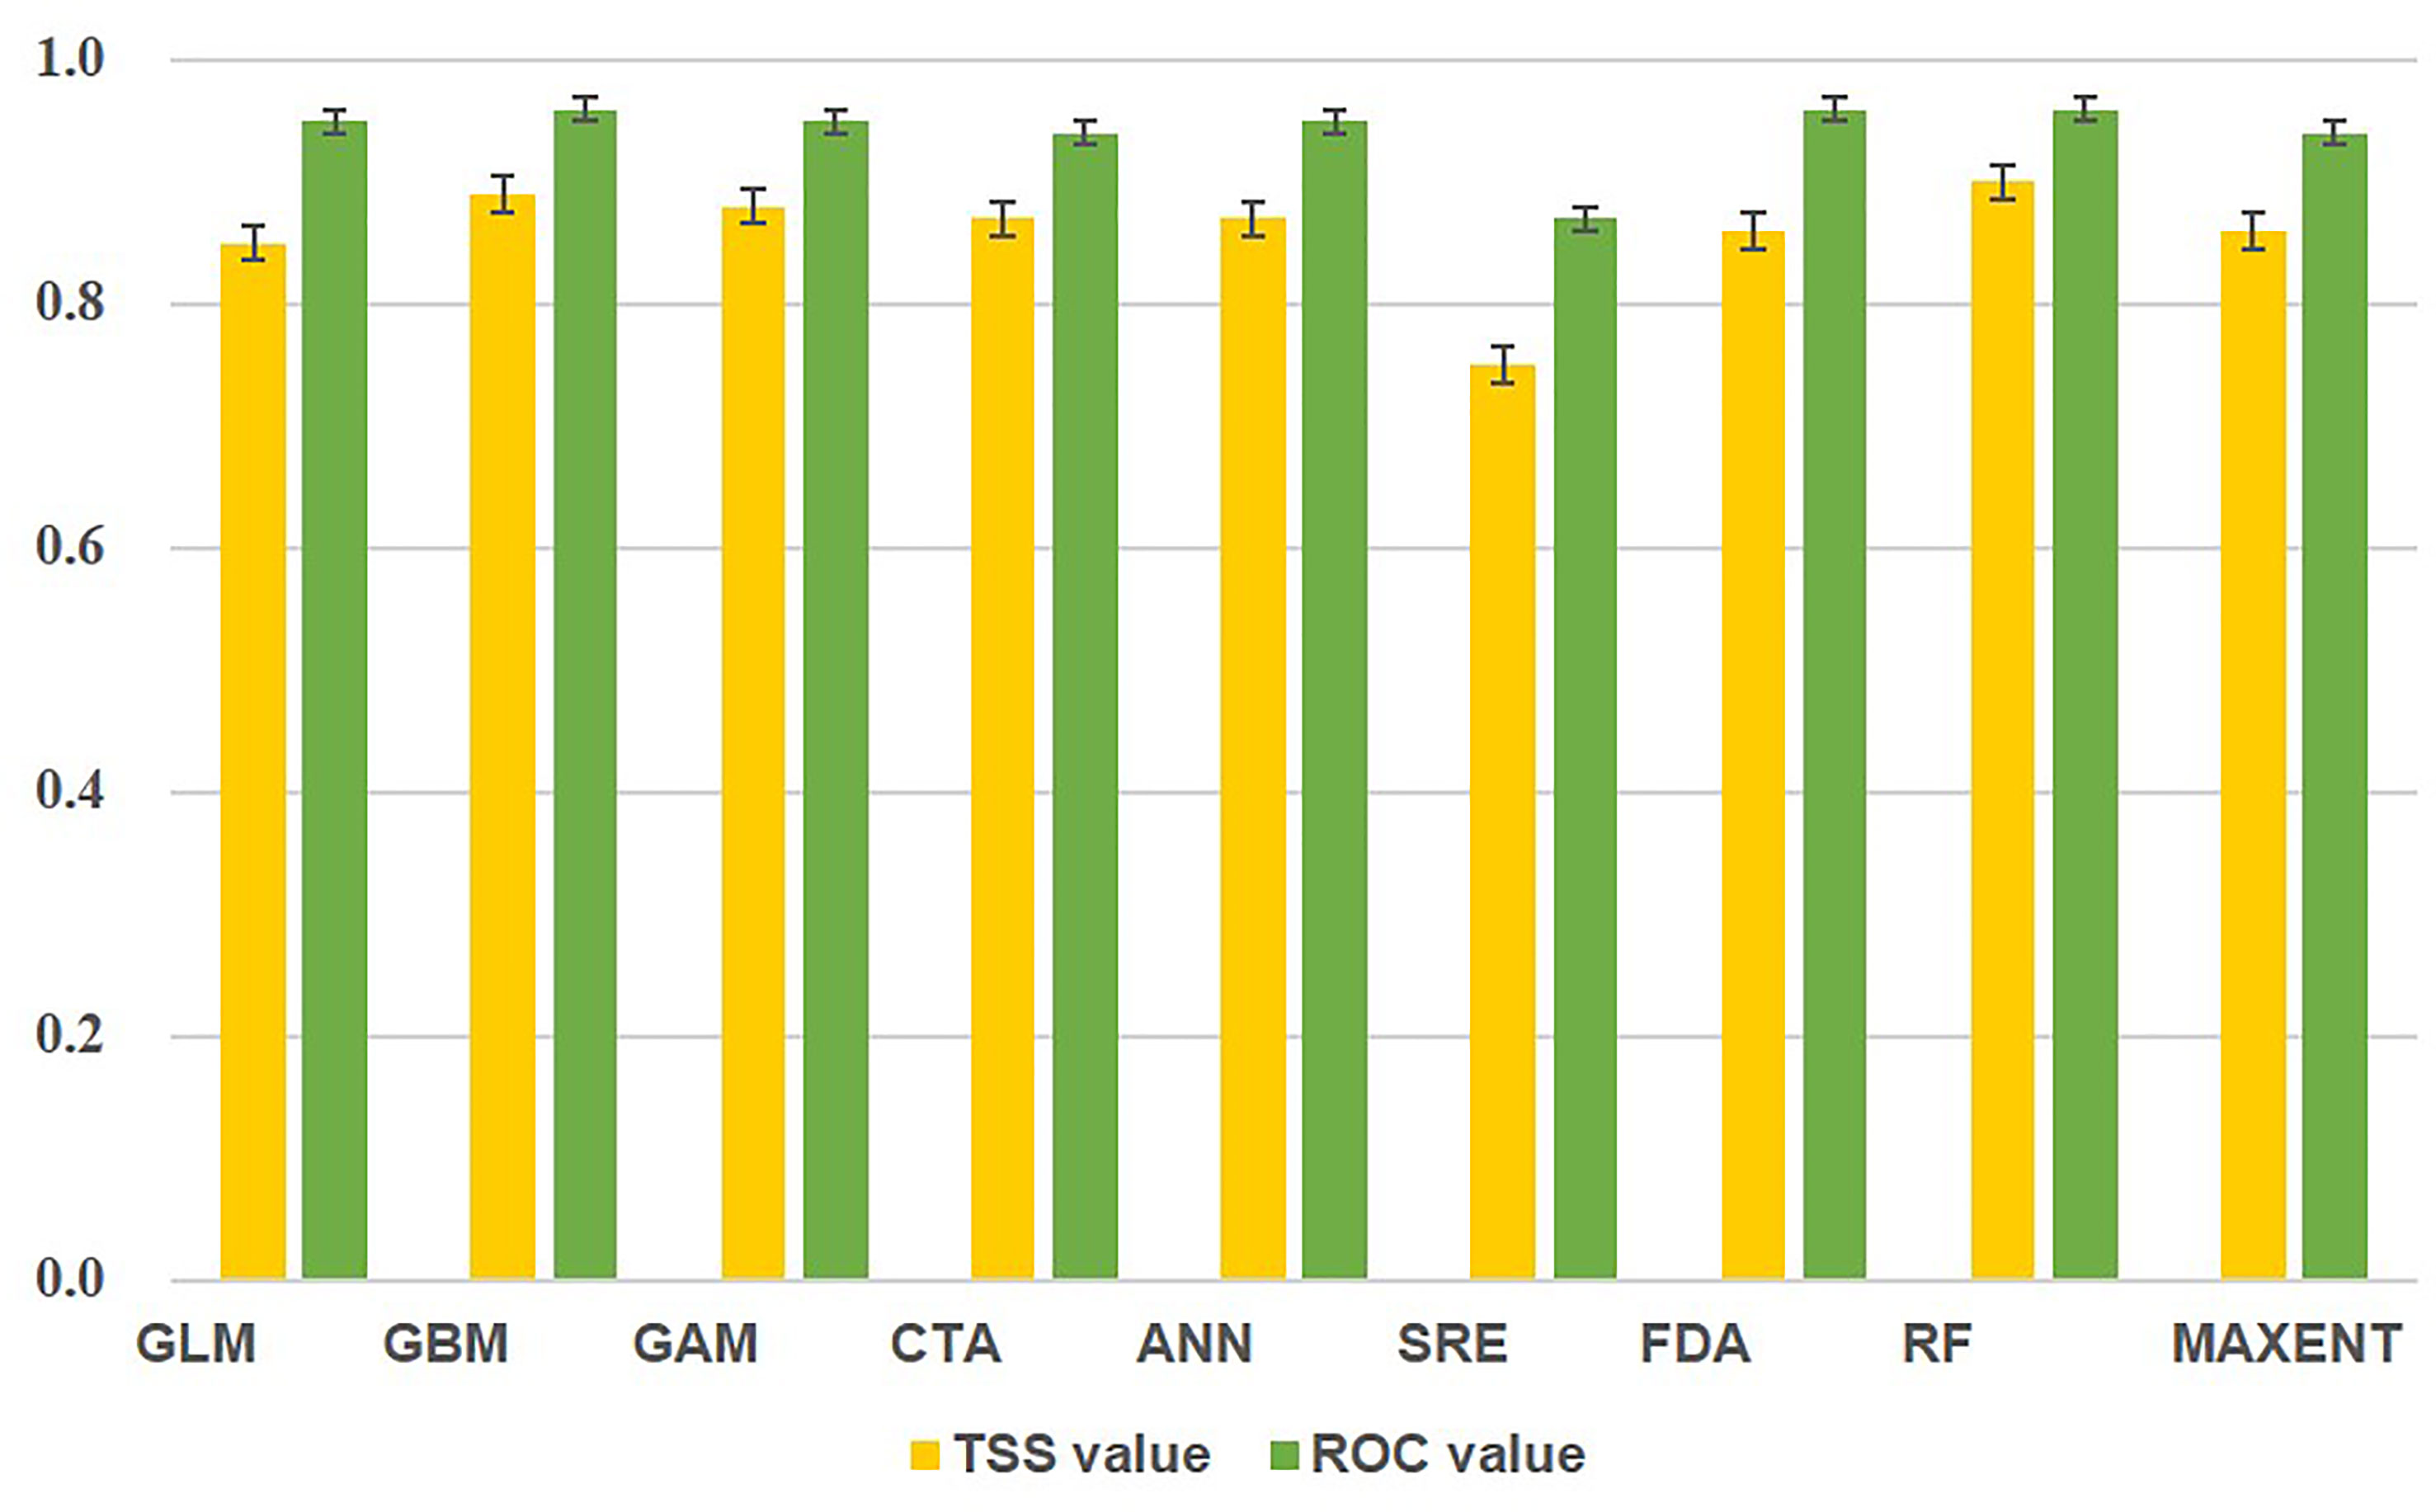
Figure 2 Model accuracy evaluation.
Table 1 shows the importance values of each environmental variable to the current distribution of S. niphonius. The largest importance was depth, followed by SST, SSS, and offshore distance, and the smallest importance was SCV. Figure 3 displays the simulation results of the optimum temperature. In spring and autumn, the optimum temperature was 14°C–23°C, 24°C–28°C in summer, and 13°C–18°C in winter.
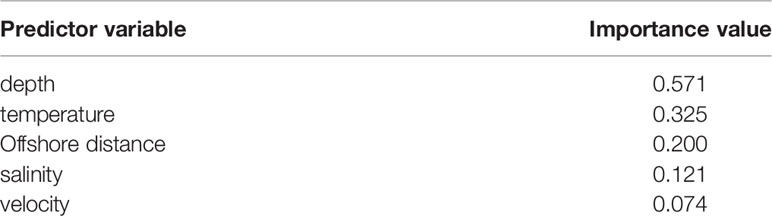
Table 1 Importance values of each environment variable .
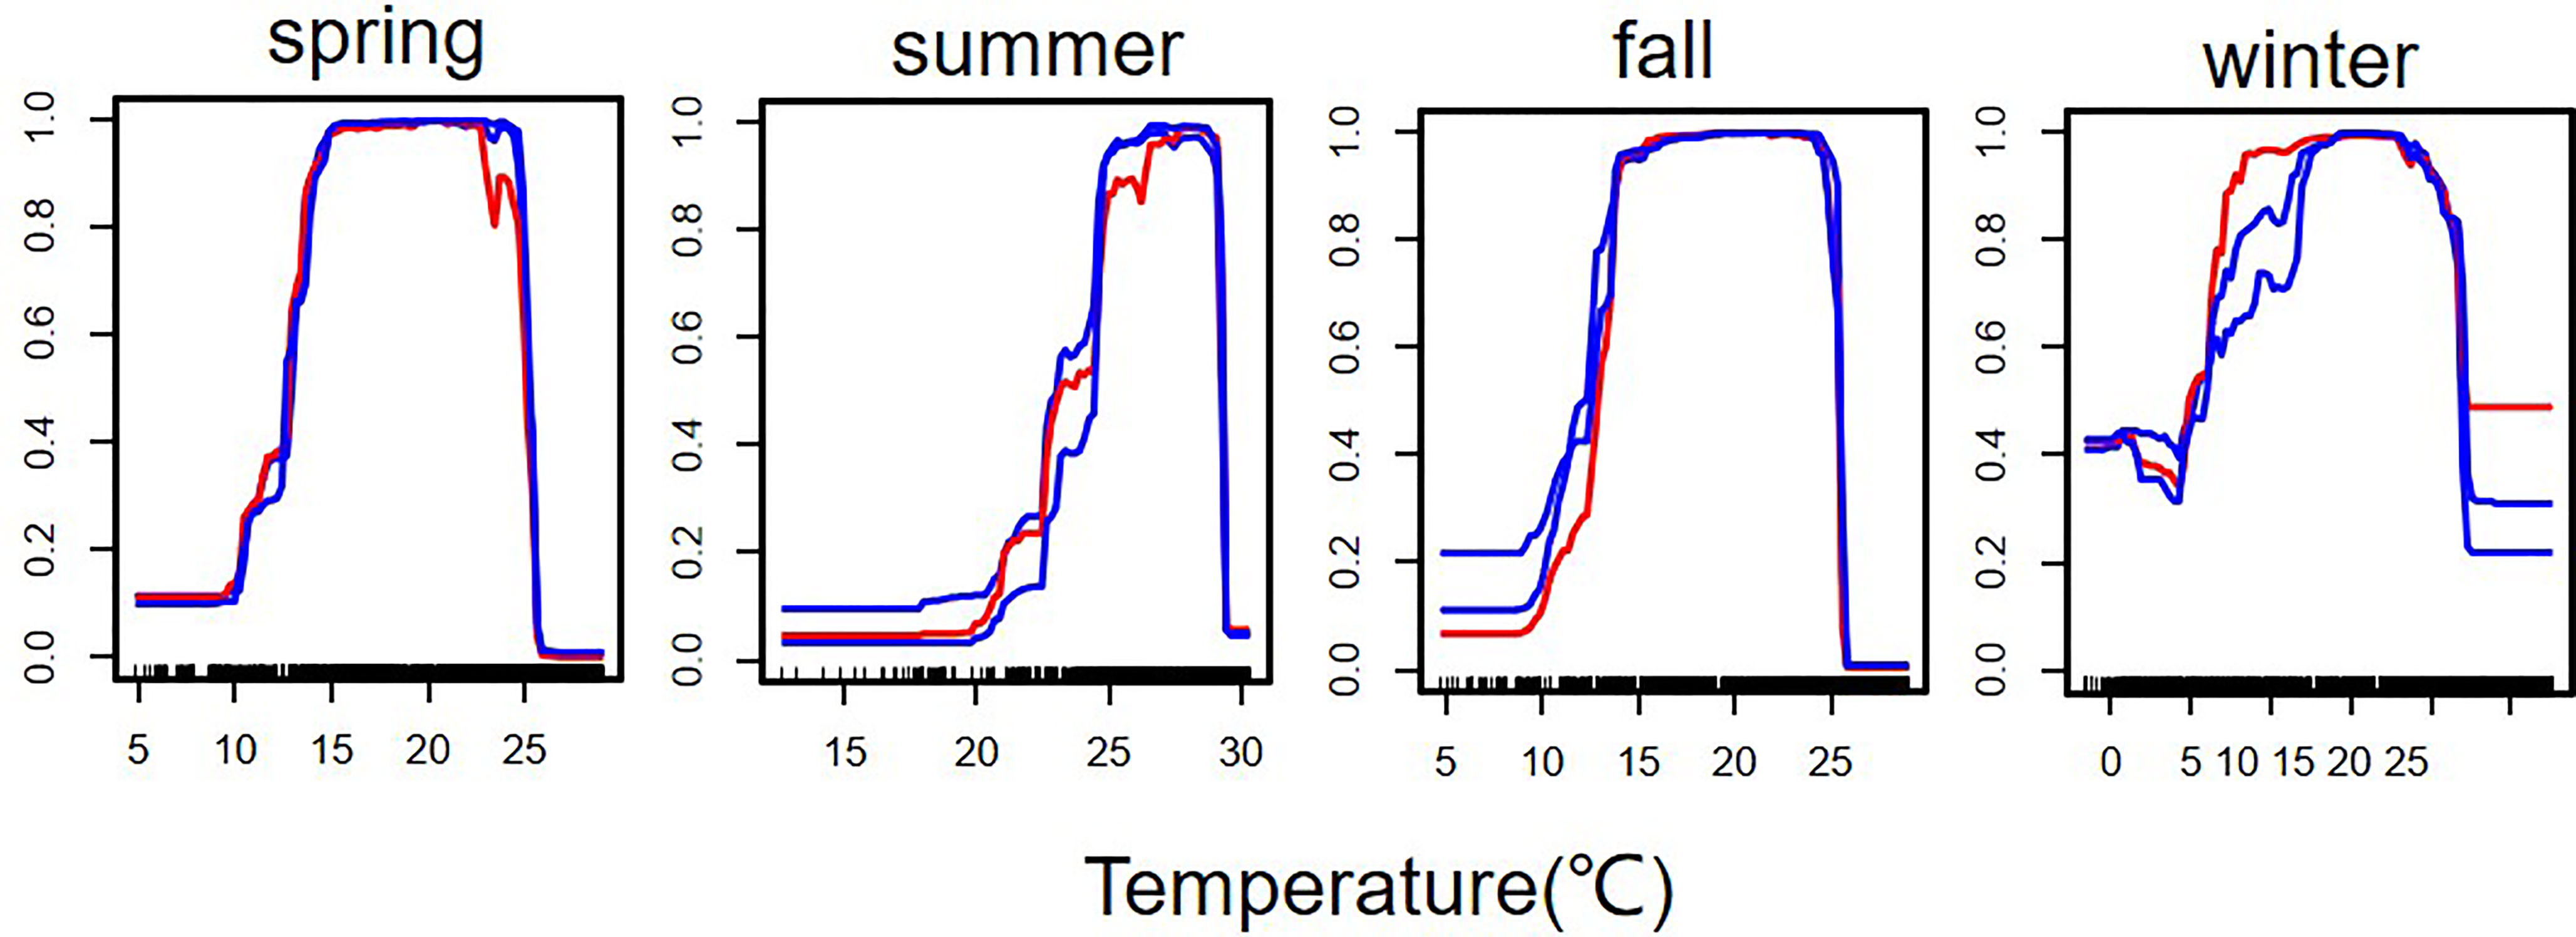
Figure 3 Response of suitable habitat of Scomberomorus niphonius to temperature. Redlines represent the results of the second (middle) run of the response curve algorithm, and blue lines show the first and third runs. Vertical lines represent temperatures on species distribution sites.
Suitable Habitats for Current and Future Species
Biomod2 ensemble model predicted the suitable habitat of S. niphonius under current and future climate scenarios. Compared with the field survey results, the distribution range of the current suitable habitat was almost the same (Figure 4), which indicates that our model has a high performance.
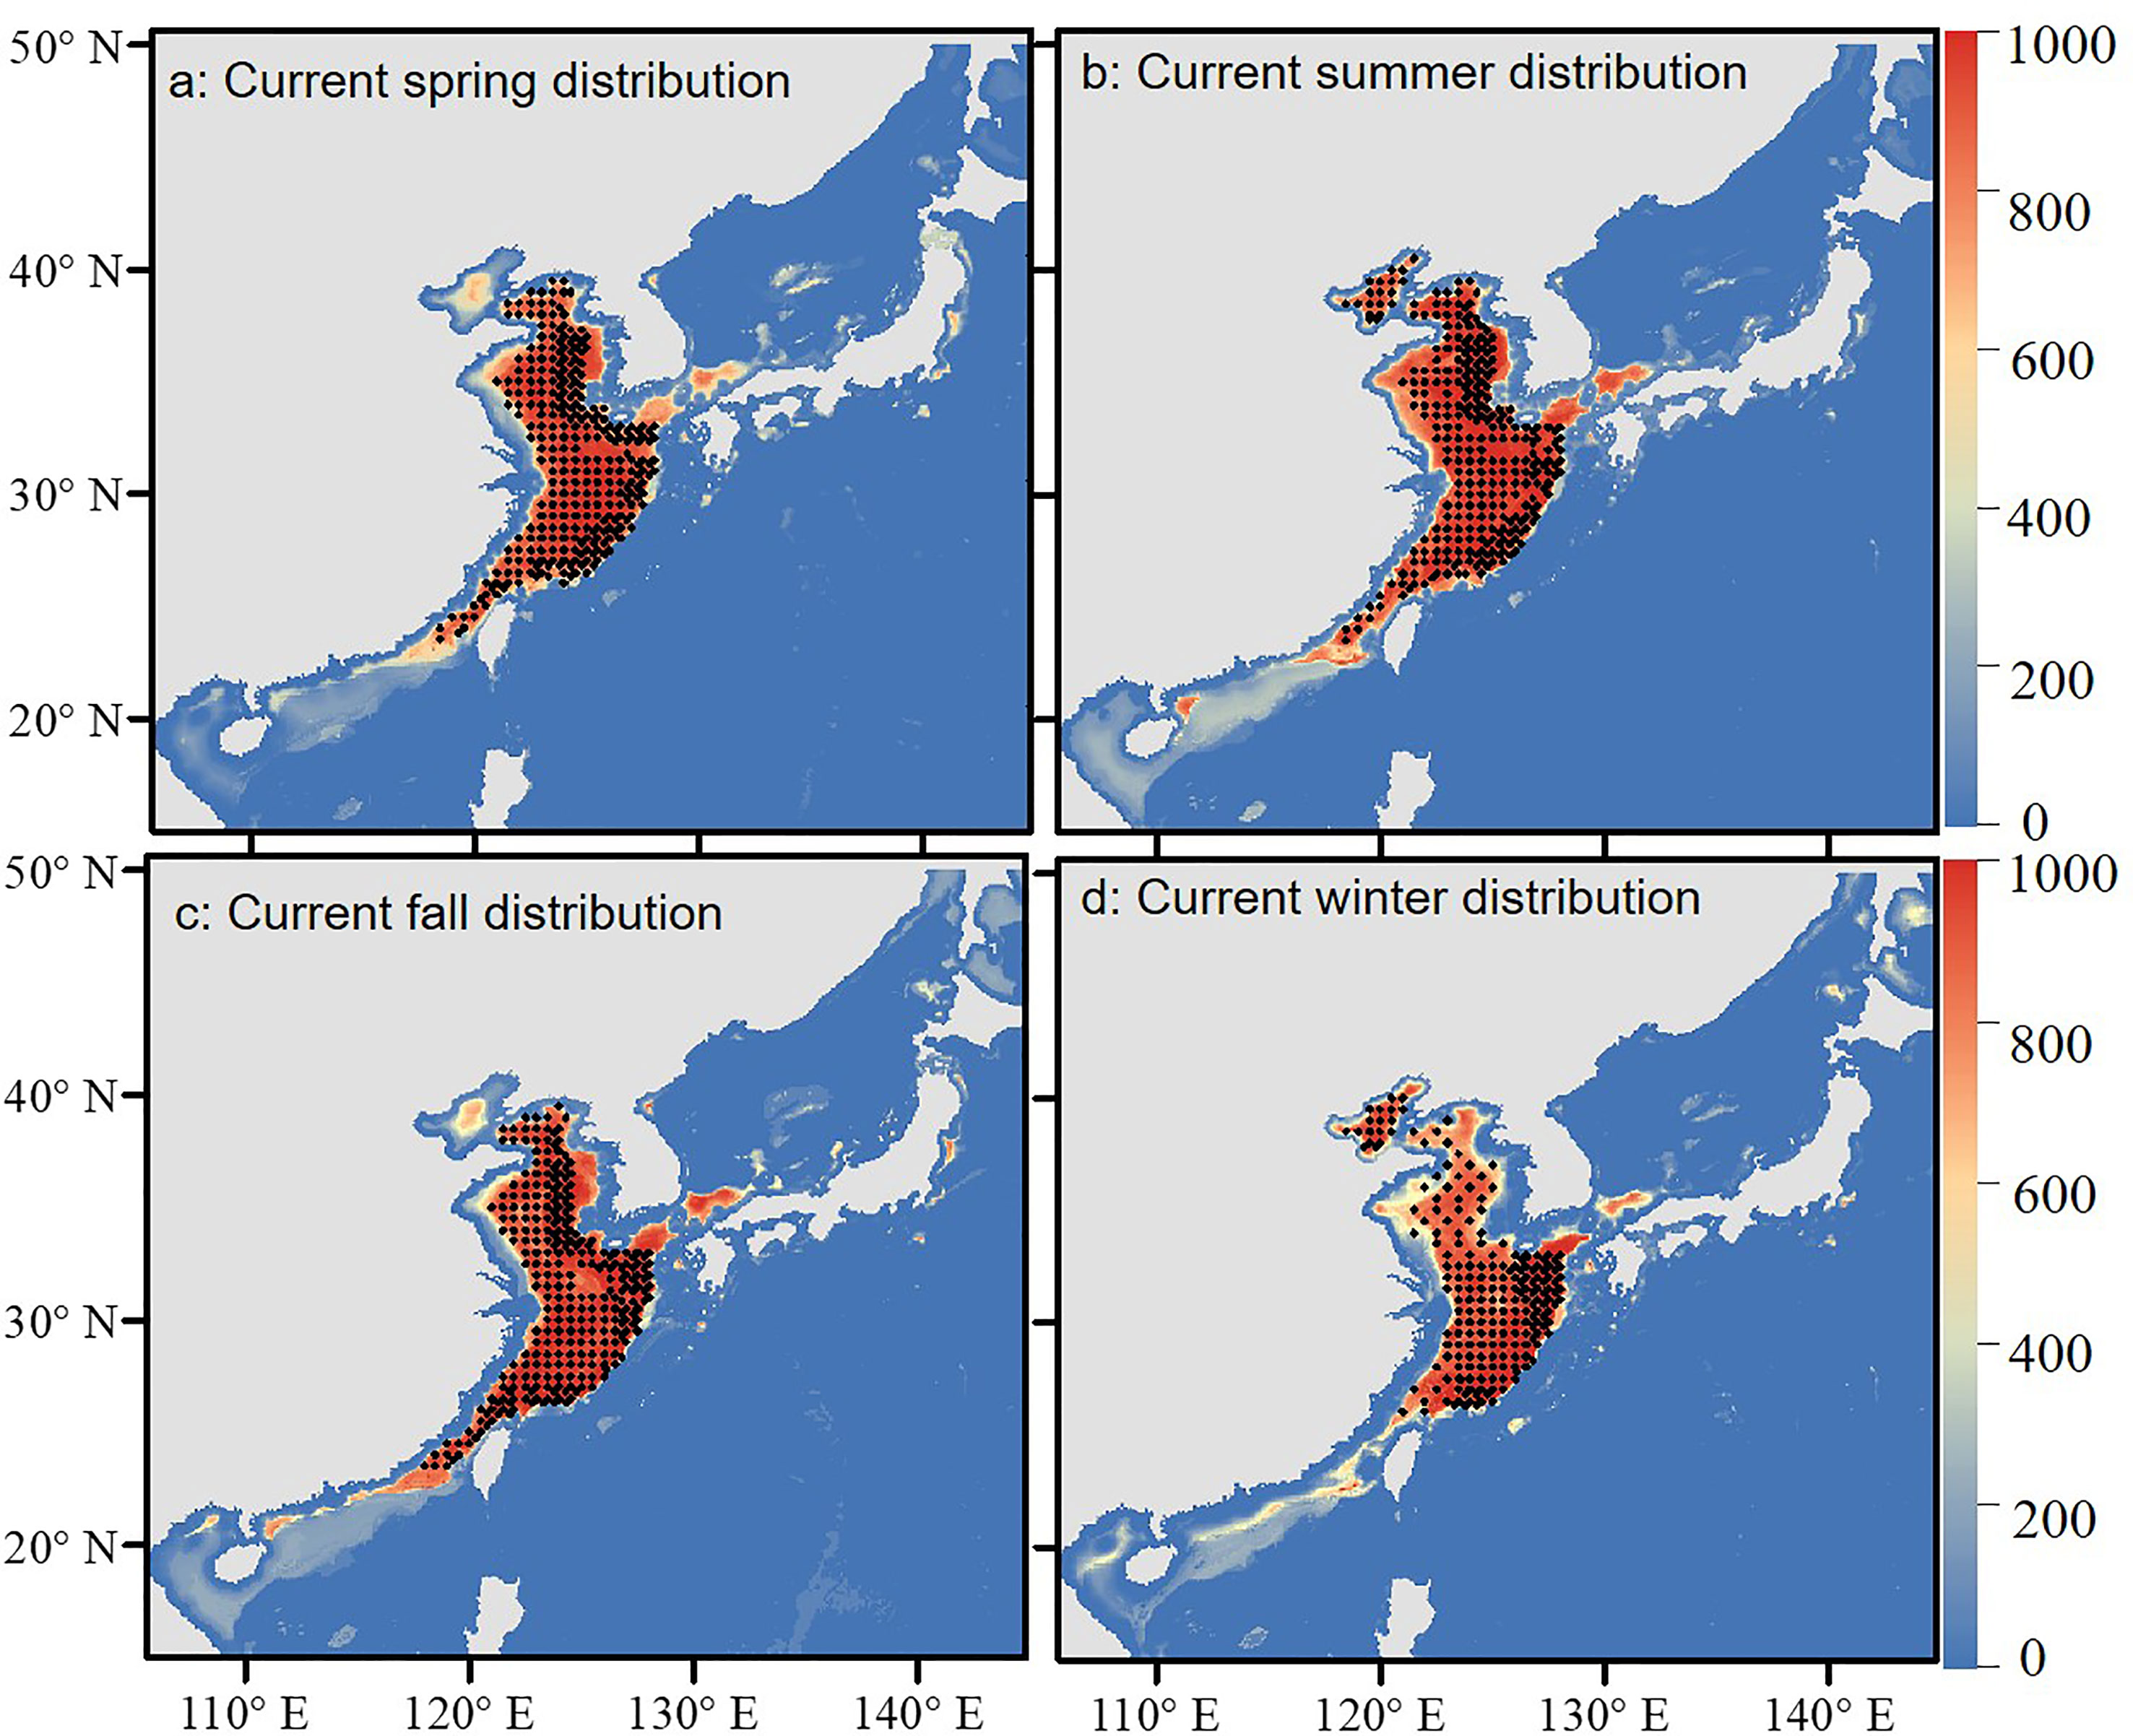
Figure 4 Current simulated habitat and actual survey sites of Scomberomorus niphonius. The color gradient indicates variation in habitat suitability (red: highest, blue: lowest). The black dots represent the actual survey sites. (A–D) represent suitable habitats in spring, summer, autumn and winter respectively.
Under future climate scenarios, the time and spatial range of suitable habitats for S. niphonius changed significantly, with a decreased trend in each season. The decreasing trend became more serious with the passage of time and climate scenarios (Figure 5 and Table 2). Under the RCP4.5 scenario, 33.3% of summer habitat will be lost in 2050, especially in southern East China Sea and South China Sea. The habitat loss rates of the other three seasons will be about 3.5% and will mainly occur in South China Sea and the eastern periphery of East China Sea, whereas an increasing trend was observed for Bohai Bay. In consideration of its life history stage and migration area in the offshores of China, the spawning grounds in Yangtze Estuary, Zhoushan offshore, Wenzhou offshore, and Guanjingyang offshore waters of East China Sea are threatened, and the wintering grounds in southern East China Sea and northern South China Sea are also affected Wang et al., 2019. In the same year, the habitat changes under RCP8.5 and RCP4.5 climate scenarios converged, but the shrinking range continuously extended northward with the high climate scenarios. Under the same climate scenario, habitat changes in 2100 and 2050 will be similar, but the degree of reduction will become more severe.
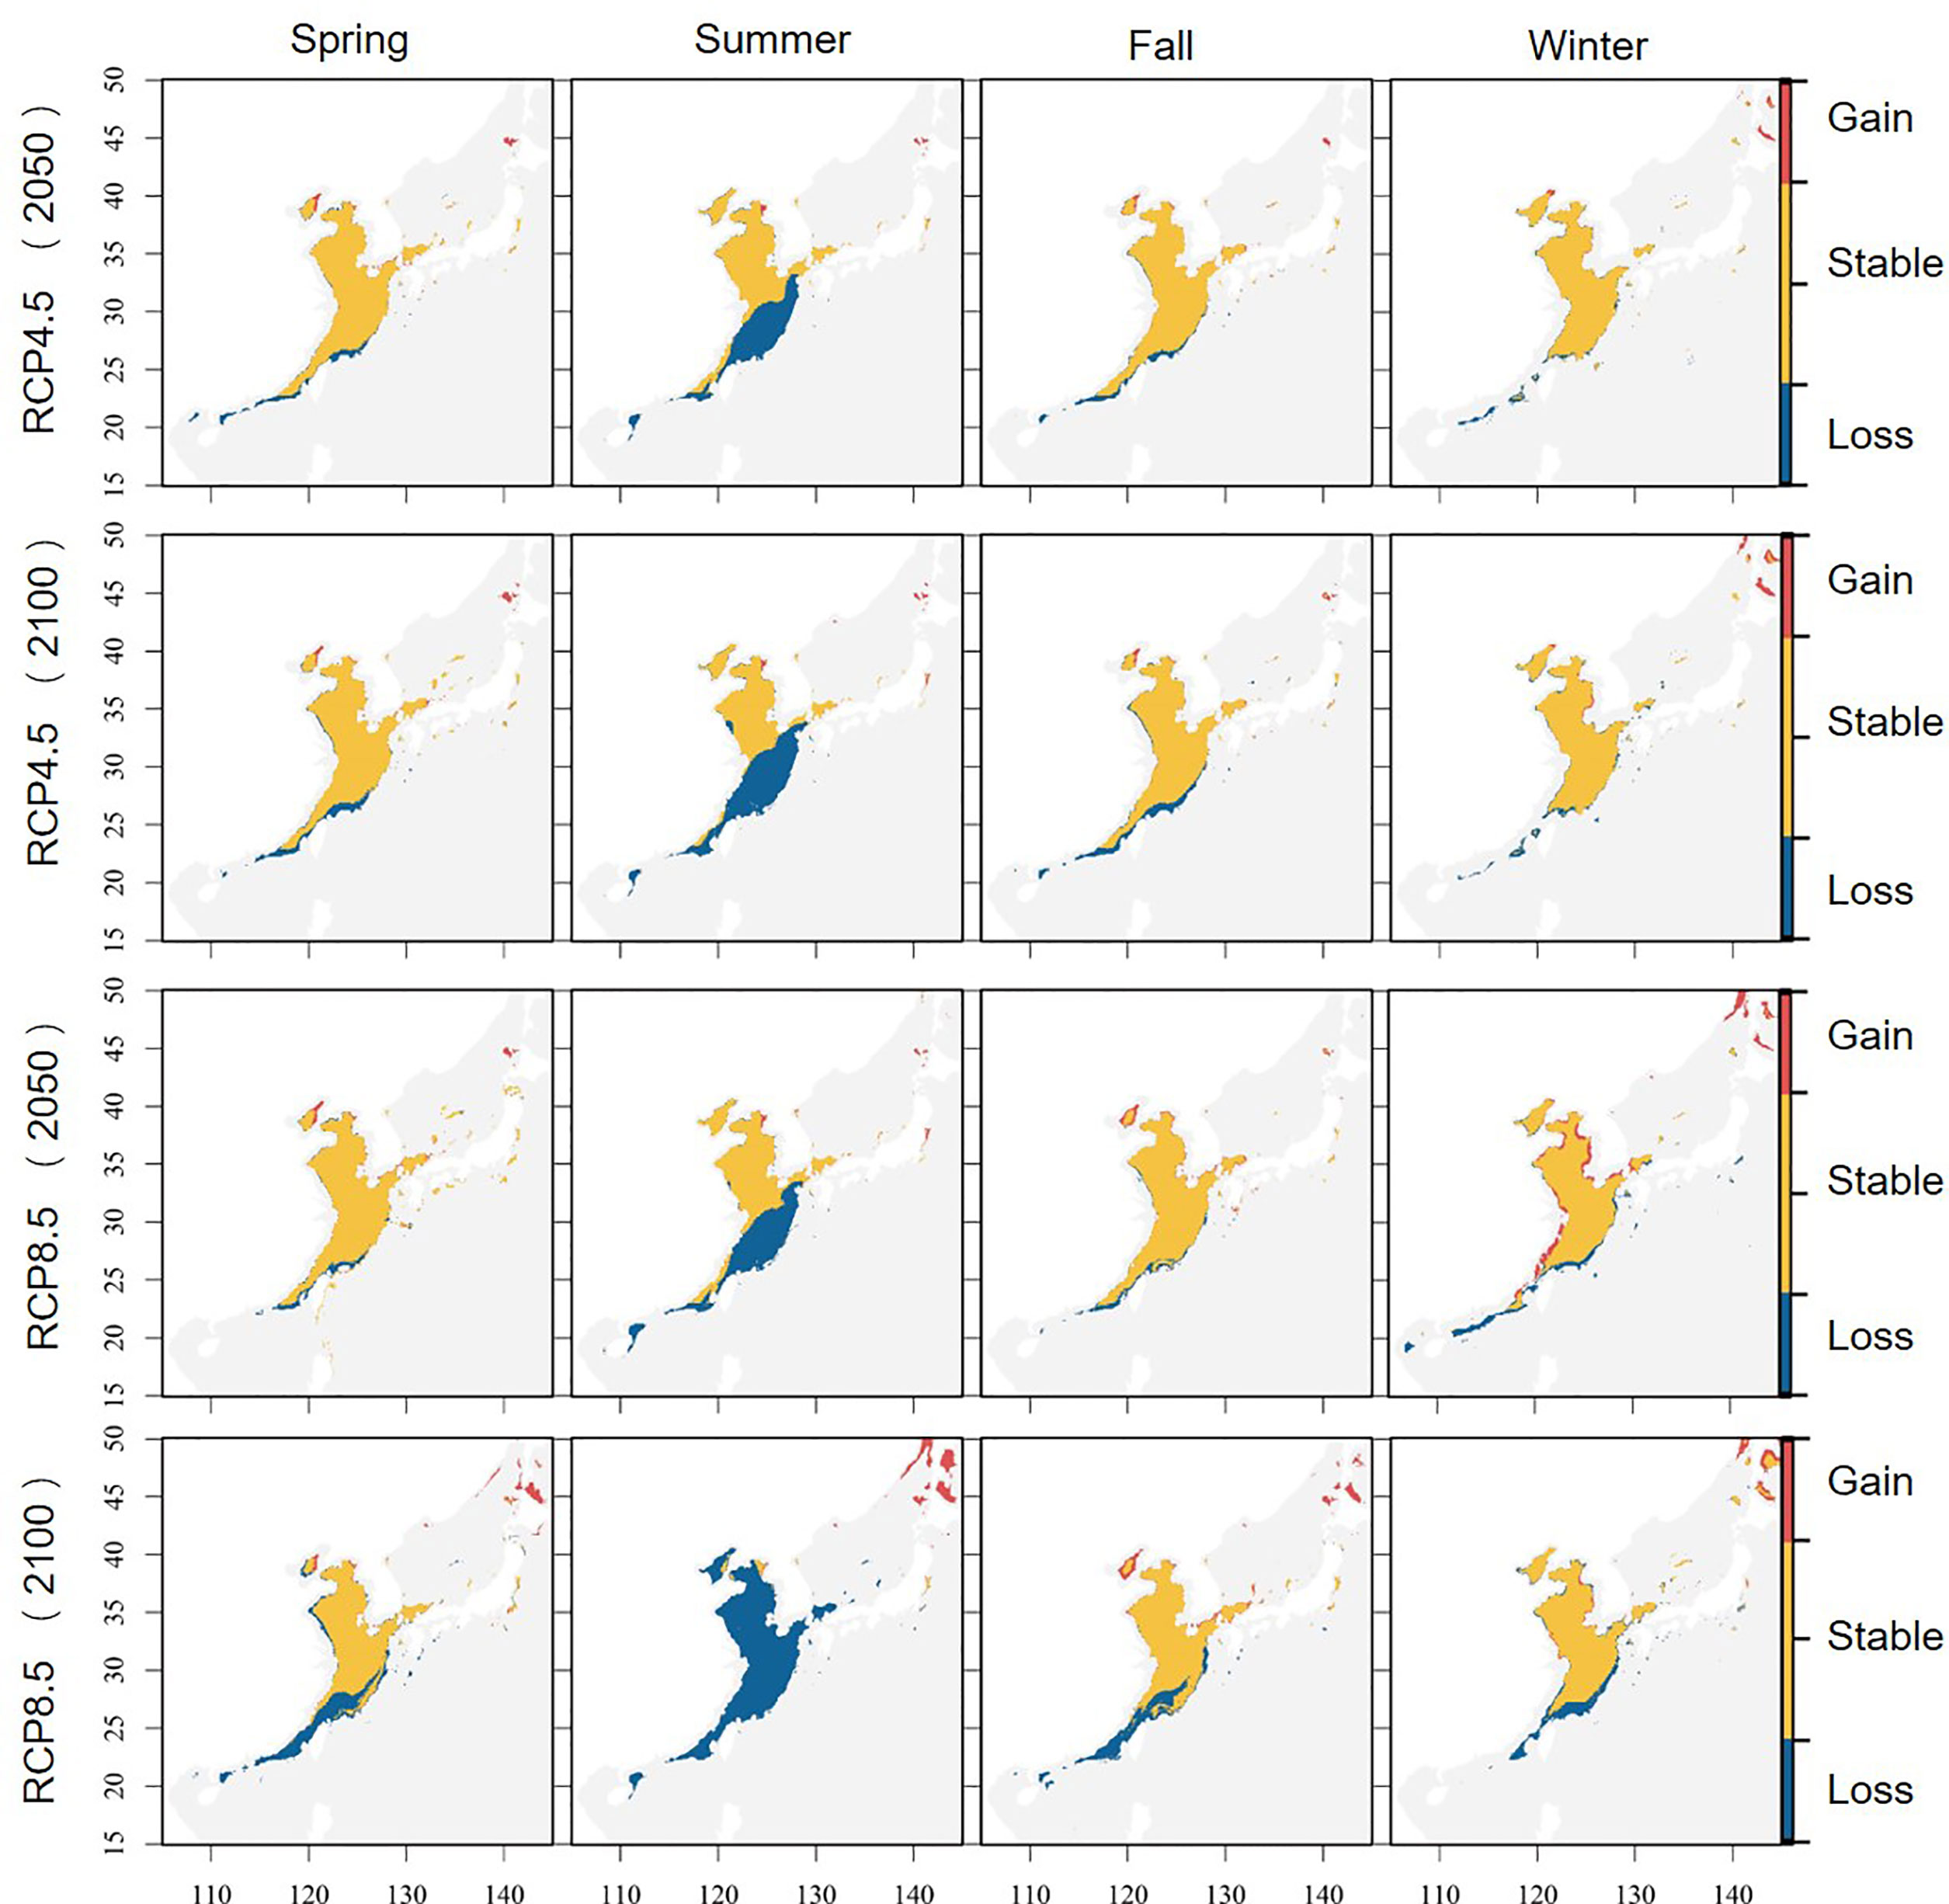
Figure 5 Changes in the potential suitable habitat of Scomberomorus niphonius . (Blue indicates that the species was suitable for survival but is unsuitable now; yellow represents previously and now suitable habitats; red means that the species that did not fit before and now shows fitness).
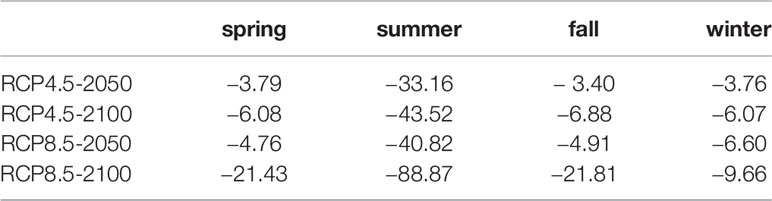
Table 2 Habitat changes of Scomberomorus niphonius under future climate scenarios.
On the whole, the shrinking trend was more evident in low latitude and near shores. The resources in the coastal area of southern East China Sea decreased remarkably, those in the coastal area of Bohai Sea increased, and those in Yellow Sea were stable. South China Sea is almost no longer suitable for the survival of this species.
Changes in the Distribution Centroid
The changes in the suitable habitat of S. niphonius caused the shift of the distribution center. In this study, the distribution center of S. niphonius shifted to the northeast (high latitude and deep sea). The centroid shifted to 0.5–2.2 latitude north in spring, 0.63–0.97 latitude north in autumn, and 0.7–2.28 latitude north in winter. However, the distribution centroid will shift from 31.95°N to 44.41°N in 2100 under the RCP8.5 scenario (Table 3).
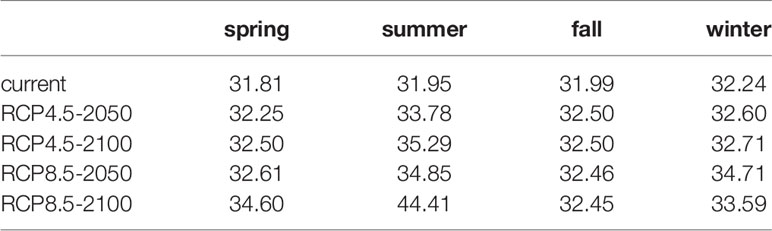
Table 3 Latitude changes in the distribution centroid of Scomberomorus niphonius under future climate scenarios.
In addition, our study on the temperature sensitivity of summer S. niphonius revealed that the reduction rate of potential suitable habitat showed an uneven decreasing trend when the temperature increased from 0.2°C to 2°C. Habitats decreased by about 8% for every 0.2°C increase in average SST. However, when the temperature increased by 0.2°C and 1.2°C, the shrinkage rate increased by about 10% and 24%, respectively (Figure 6).
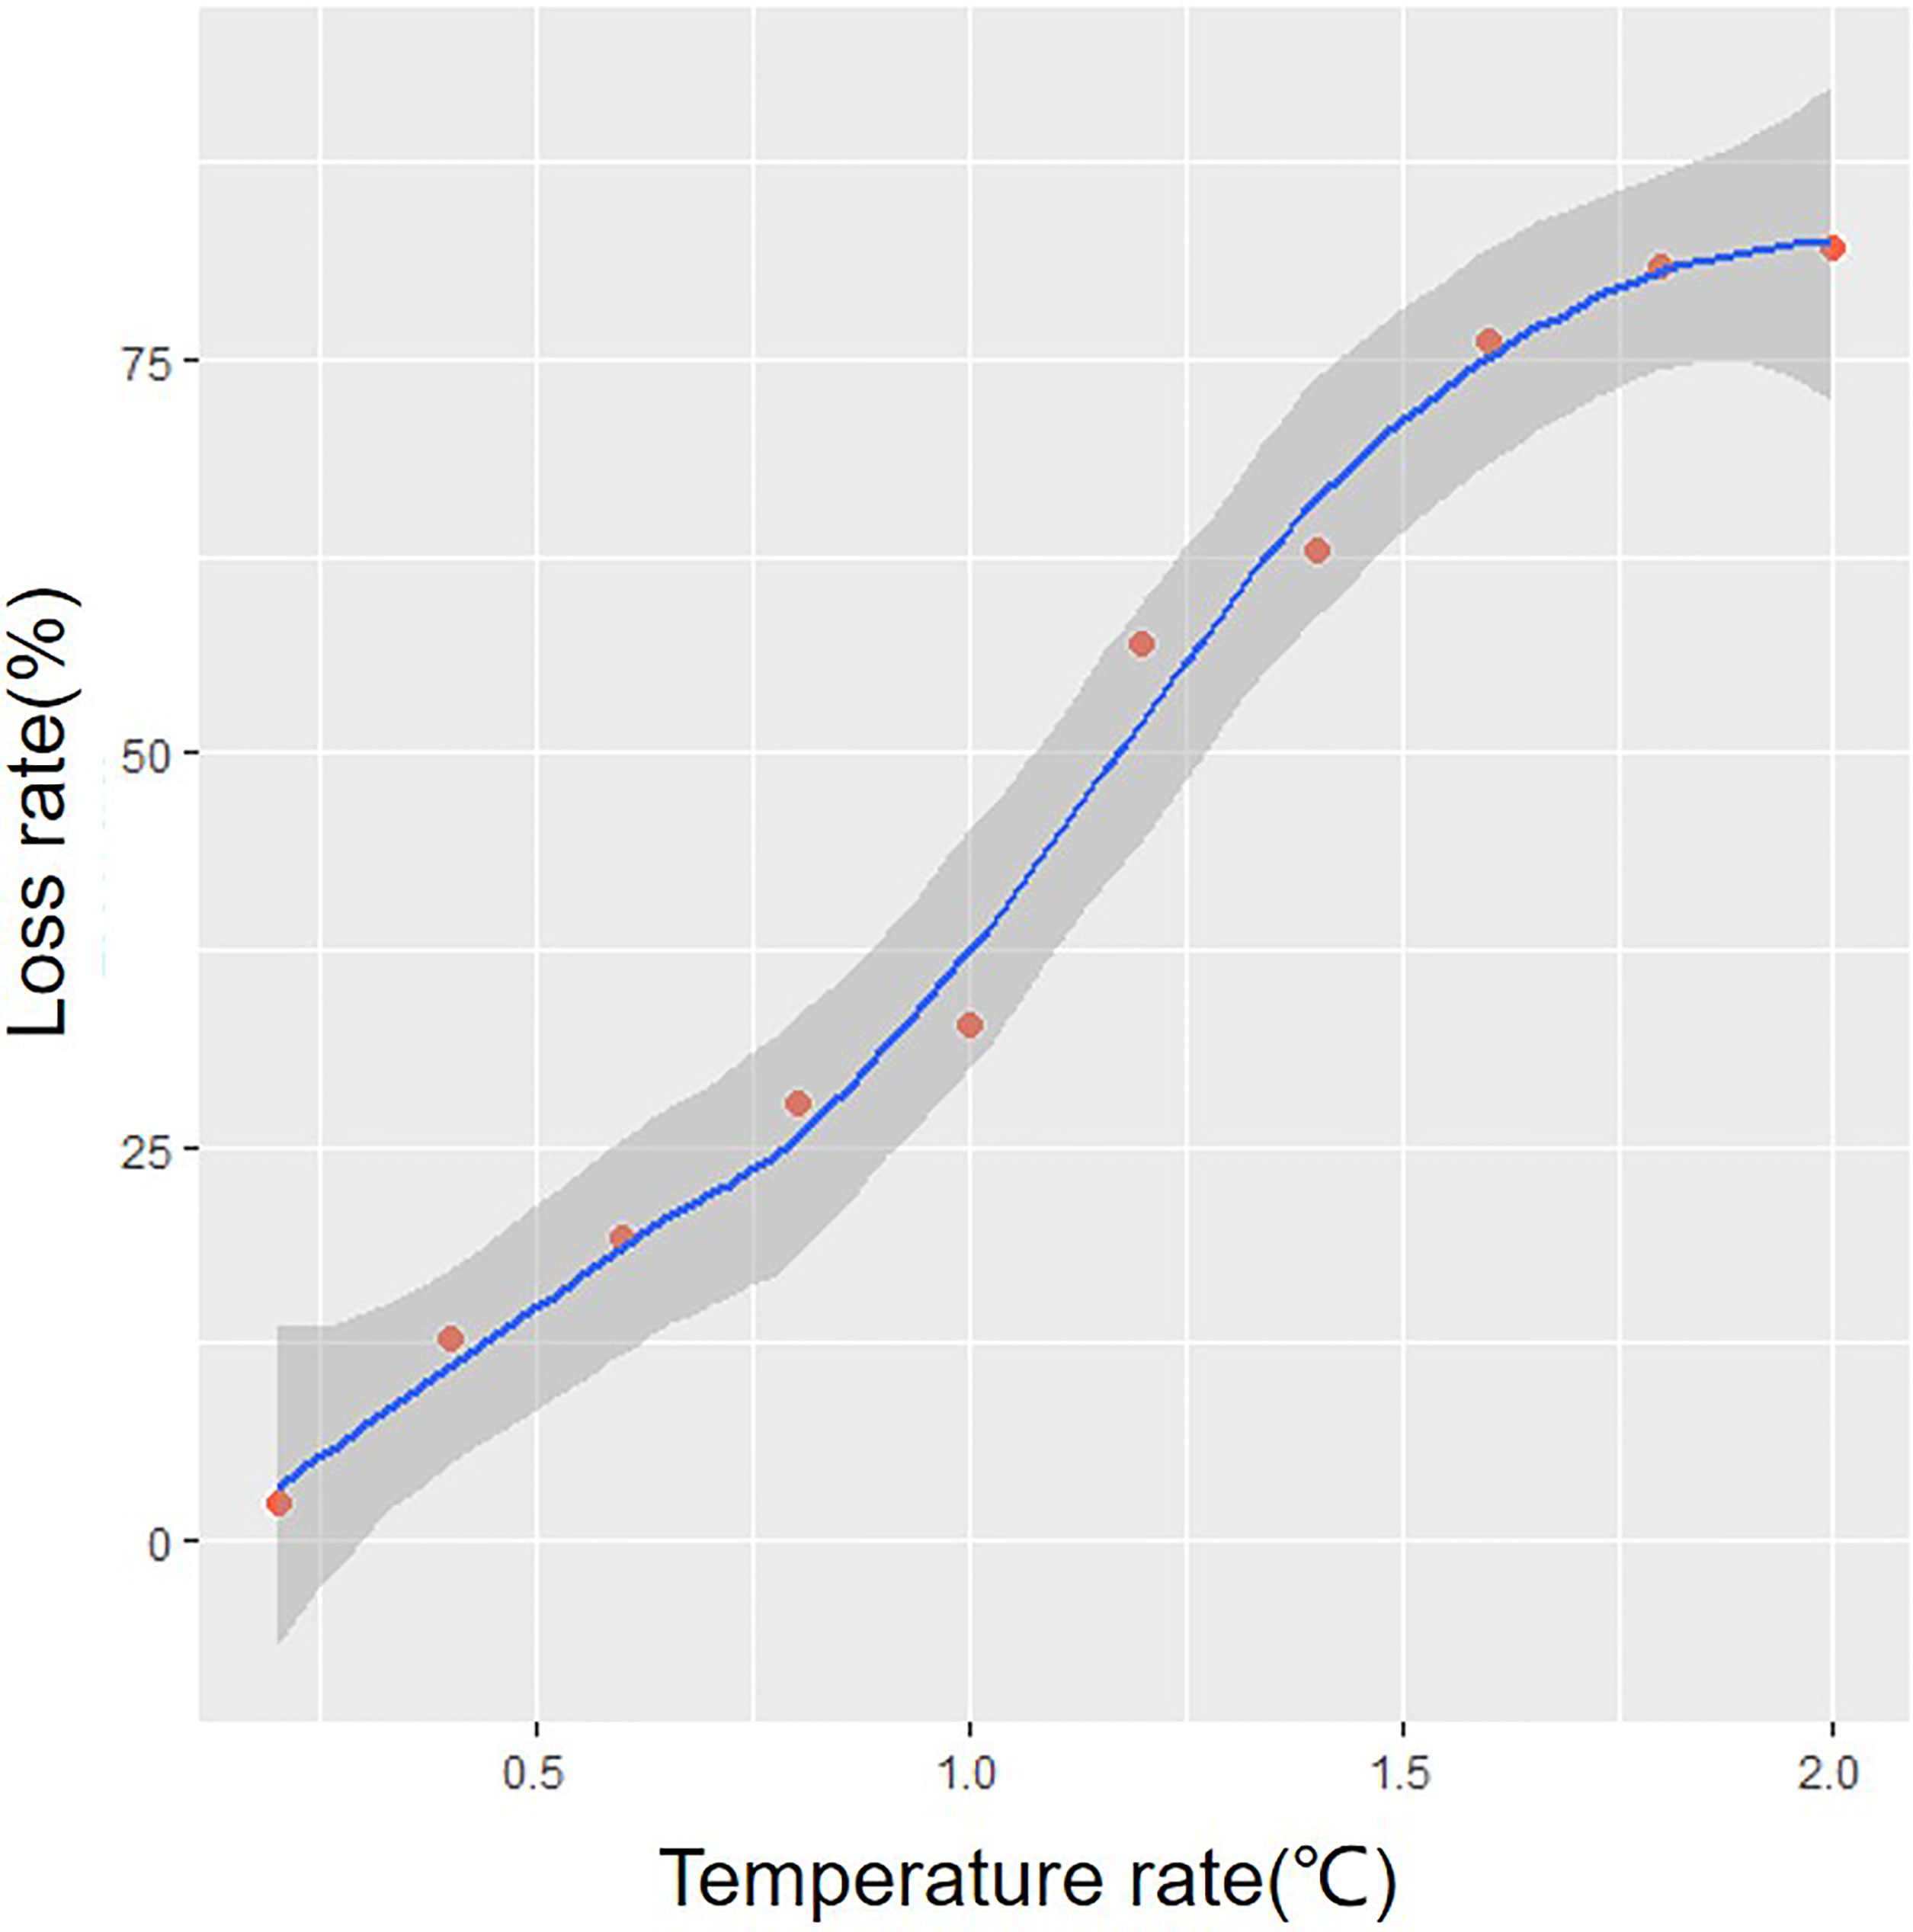
Figure 6 Reduction index of suitable habitat for Scomberomorus niphonius under uniform warming.
Discussion
Model Performance and Main Variables
SDMs are being accepted more. However, the single model selected cannot prove that it maintained an excellent performance under any input conditions Zhu, 2019). The ensemble model can solve the problem of variability between models and the variability of input conditions to a certain extent, and its multiple evaluation indexes are significantly higher than those of the optimal single model, reducing the uncertainty of the model (Thuiller et al., 2014). In this study, the predicted suitable habitat range of S. niphonius was almost consistent with the investigated distribution range, which further confirmed the performance of the ensemble model. However, given the uncertainty of the model itself and input conditions, our pursuit of model accuracy is infinite (Guo et al., 2020). For example, sampling data for S. niphonius can also take into account otoliths, molecules, interannual variation, etc. (Cao et al., 2015; Pan et al., 2019; Ma et al., 2021). Environmental factor data can also take into account correlations between feeding habits and baits, variability between groups, etc. (Lin et al., 2017; Wang et al., 2019). All these factors contribute to the accuracy of the model in the Future. In this study, five environmental climate data were selected to explore the impact of each factor on the distribution of S. niphonius. The predicted results showed that depth and temperature had the greatest influence on the distribution of the species. Previous studies have shown that the S. niphonius inhabits pelagic waters and is highly sensitive to water temperature. The species also has a preference for spawning in deeper waters, and egg abundance is strongly influenced by water depth (Wei, 1980; Zhang et al., 1985). Also as mentioned in advances in the biology of S. niphonius, the migratory distribution of this species is closely related to temperature and depth. Seasonal variations in temperature affect the spatial and temporal distribution of the species’ migrations (Qu et al., 2021).
Suitable Habitats and Temperature Sensitivity
The prediction results showed that the distribution area of S. niphonius will shrink, and the distribution center will shift to the deeper sea waters of a high latitude. A study result of monthly and annual changes in the distribution of the fishing grounds of S. niphonius in the Bohai Sea, Yellow Sea and East China Seas are similar to our study. A significant increase in temperature had a more northerly centroid for the distribution of the fishery and a slower migration rate compared to the same period in other years. In summer the centroid of gravity of the distribution was significantly more northerly (Liu, 2009). There was also a study used Generalized Additive Model (GAM) to analyze spawning data for S. niphonius in the Yellow Sea (Wan et al., 2020). They revealed that the distribution of spawning grounds may had a northerly trend in years with high sea surface temperatures (Wan et al., 2020). Similarly, it has been shown that the latitudinal variation in the centroid of the distribution of S. niphonius follows an opposite trend to that of latitude, with significant monthly and annual variation (Ma et al., 2021). In addition, it has been suggested that high sea surface temperatures may affect next-year replenishment of S. niphonius and reduce Recruitment per Spawner (RPS)Wang et al., 2019. Therefore, in a high-emission climate scenario, continuously rising temperatures will force this species to adapt or move to cooler waters to prevent extinction. Summer is generally the breeding season of S. niphonius and rising temperature may be one of the reasons for the serious decline of S. niphonius in summer and forces shift of distribution center to the north.
Monitoring Management Suggestions
In view of the risk of potentially suitable habitat loss, we proposed several recommendations for the monitoring and management of S. niphonius. The ensemble model predicted that South China Sea will almost no longer be suitable for this species, whereas Yellow and Bohai seas will provide a more suitable habitat. These areas should therefore be of concern, with the timely protection of potential habitat loss and increase areas, establishment of monitoring sites, management of the ecological environment of waters, and monitoring of population dynamics based on seasonal changes, in particular, those of blue point mackerel spawning (April–June) and feeding (August–November) season. Moreover, attention should be given to illegal fishing while maintaining the suitable habitat of S. niphonius population in East China Sea and improve the relevant fishing policy. The implementation of the management plan of “protecting in spring, banning in summer and harvesting in autumn and winter” should be continued (Qiu et al., 2007; Sun, 2009). In addition, attention should be focused on the temperature difference between estuaries and sea environment and its influence, timely forecast of fishing situation, establishment of protection areas, and active establishment of an early warning mechanism to deal with climate change.
Conclusions
Climate change affects the spatiotemporal distribution and distribution centroid of S. niphonius. Under global warming, the suitable habitat for S. niphonius will be severely lost with the passage of climate scenarios and years. It is predicted that under the RCP8.5 scenario, the habitat environment of S. niphonius from 2050 to 2100 will be more severe, especially in summer. Habitat increase in Bohai Sea, stable habitat in Yellow Sea and loss of habitat in East China Sea and South China Sea. Species distribution centroid tends to shift to higher latitudes. Habitat change leads to a redistribution of resources, which ultimately affects local fishing activities. However, our impact on species resources still needs further research. Society needs to consider adaptation measures, grasp the trend of quantitative changes in a timely manner, and do a good job in follow-up research and dynamic monitoring. Ensuring resilient ecological services are built to respond to the impacts of future climate scenarios along our coasts and the rest of the world.
Data Availability Statement
The original contributions presented in the study are included in the article/Supplementary Material. Further inquiries can be directed to the corresponding author.
Author Contributions
ZH and TY conceptualized the study and conducted the analyses. TY and ZH analyzed the data and wrote and revised the manuscript. All authors contributed to the article and approved the submitted version.
Funding
This research was funded by the National Key Research and Development Program of China (2017YFA0604904, 2017YFA0604902), Zhejiang Provincial Natural Science Foundation of China (LR21D060003), and New Talent Program for College students in Zhejiang Province (2016R411011).
Conflict of Interest
The authors declare that the research was conducted in the absence of any commercial or financial relationships that could be construed as a potential conflict of interest.
Publisher’s Note
All claims expressed in this article are solely those of the authors and do not necessarily represent those of their affiliated organizations, or those of the publisher, the editors and the reviewers. Any product that may be evaluated in this article, or claim that may be made by its manufacturer, is not guaranteed or endorsed by the publisher.
Supplementary Material
The Supplementary Material for this article can be found online at: https://www.frontiersin.org/articles/10.3389/fmars.2022.927790/full#supplementary-material
References
Aguirre-Gutiérrez J., Carvalheiro L. G., Polce C., van Loon E. E., Raes N., Reemer M., et al. (2013). Fit-for-Purpose: Species Distribution Model Performance Depends on Evaluation Criteria – Dutch Hoverflies as a Case Study. PLoS One 8(5), e63708. doi: 10.1371/journal.pone.0063708
Allouche O., Tsoar A., Kadmon R. (2006). Assessing the Accuracy of Species Distribution Models: Prevalence, Kappa and the True Skill Statistic (TSS). J. Appl. Ecol. 43 (6), 1223–1232. doi: 10.1111/j.1365-2664.2006.01214.x
Araújo M. B., New M. (2007). Ensemble Forecasting of Species Distributions. Trends Ecol. Evol. 22 (1), 42—47. doi: 10.1016/j.tree.2006.09.010
Basher Z., Bowden D. A., Costello M. J. (2014) Global Marine Environment Dataset (GMED). Version 1.0 (Rev.01.2014). Available at: http://gmed.auckland.ac.nz (Accessed 30 October 2018).
Cai R. S., Han Z. Q., Yang Z. X. (2020). Ocean Change and its Impacts, Risks and Countermeasures on Ecosystem and Human Society. Adv. Climate Change Res. 16 (2), 182–193.
Cao Y., Zhang Q., Gong Y. Y., Lv J. L., Yang X. S. (2015). Genetic Diversity of Japanese Spanish Mackerel in Coastal China Based on Mitochondrial COI Sequences. Mar. Fish. 37 (06), 485–493. doi: 10.13233/j.cnki.mar.fish.2015.06.001
Chen Y. L. (2014). Interannual Variation of Anchovy (Engraulis Japonicus) Population Characteristics and Climate Change Scenario Analysis of Overwintering Population in the Yellow Sea. Ocean. Univ. China. (1), 34–35.
Chu J. M., LI Y. F., Zhang L., Li B., Gao M. Y., Tang X. J., et al. (2017). Potential Distribution and Conservation Strategies of the Endangered Prunus Pedunculata Species. Biodiver. Sci. 25 (8), 799–806.
Doney S. C., Ruckelshaus M., Duffy J. E., Barry J. P., Chan F., English C. A., et al. (2012). Climate Change Impacts on Marine Ecosystems. Ann. Rev. Mar. Sci. 4, 11–37. doi: 10.1146/annurev-marine-041911-111611
Franklin J. (2010). Moving Beyond Static Species Distribution Models in Support of Conservation Biogeography. Diversity Distribut. 16 (3), 321–330. doi: 10.1111/j.1472-4642.2010.00641.x
Guo Y. L., Zhao Z. F., Qiao H. J., Wang R., Wei H. Y., Wang L. K., et al. (2020). Challenges and Trends of Species Distribution Models. Adv. Earth Sci. 35 (12), 1292–1305.
Jiang Y. Q., Zhang C., Ye Z. J., Xu B., Tian Y., Watanabe Y. (2020). Stock Structure Analysis of the Japanese Spanish Mackerel Scomberomorus Niphonius (Cuvier 1832) Along the China Coast Based on Truss Network. J. Ocean. Univ. China 19 (02), 446–452. doi: 10.1007/s11802-020-4233-7
Jin X. S., Cheng J. S., Qiu S. Y., Li P. J. (2006). Comprehensive Study and Evaluation of Fishery Resources in the Yellow Sea and Bohai Sea Vol. 1 (Beijing: China Ocean Press), 50–357.
Lin N., Wang Y. T., Chen Y. G., Jiang Y. Z., Yuan X. W., Li S. F., et al. (2017). Feeding Habits of the Blue-Spotted Horse Mackerel (Scomberomorus Niphonius) in Xiangshan Harbor. Chin. J. Ecol. 36 (10), 2811–2816. doi: 10.13292/j.1000-4890.201710.011
Liu R. (2009). Monthly and Interannual Variation in the Distribution of S. nNiphonius Fisheries in the Bohai, Yellow and East China Seas. Ocean. Univ. China. (12), 14–21.
Liu X. Y., Han X. L., Han Z. Q. (2022). Effects of Climate Change on the Potential Habitat Distribution of Swimming Crab (Portunus Trituberculatus) Under the Species Distribution Model. J. Oceanol. Limnol. 40 (2), 1–10. doi: 10.1007/s00343-021-1082-1
Liu C. X., ZHANG X., Yang K. W. (1982). Studies on the Growth of Blue Spot Mackerel in the Yellow Sea and Bohai Sea. Oceanol. Limnol. Sinica. 02, 170–178.
Ma Y. C., Xu B. D., Zhang C. L., Yu M. H., Xue Y., Ren Y. P., et al. (2021). Spatial-Temporal Variation and Standardization of CPUE in Double-Boat Trawling Fishery of Japanese Spanish Mackerel in the Yellow and Bohai Seas. J. Fish. Sci. Chin. 28 (04), 493–502.
Ministry of Agriculture and Rural Affairs (1998–2020a). Chinese Fishery Statistical Yearbook (Beijing: Ministry of Agriculture and Rural Affairs).
Morley J. J., Heusser L. E. (1997). Role of Orbital Forcing in East Asian Monsoon Climates During the Last 350 Kyr: Evidence From Terrestrial and Marine Climate Proxies From Core RC14-99. Paleoeanography. 12 (3), 483–493. doi: 10.1029/97PA00213
Ohshimo S., Muko S., Yoda M. (2021). Fluctuations in Distribution and Relative Abundance of Japanese Spanish Mackerel, Scomberomorus Niphonius, in the Yellow Sea, East China Sea and Sea of Japan. Reg. Stud. Mar. Sci. 48, 102057. doi: 10.1016/j.rsma.2021.102057
Pan X. D., Ye Z. J., Xu B. D., Jiang T., Yang J., Tian Y., et al. (2020). Population Connectivity in a Highly Migratory Fish, Japanese Spanish Mackerel (Scomberomorus Niphonius), Along the Chinese Coast, Implications From Otolith Chemistry. Fish. Res. 231, 105690. doi: 10.1016/j.fishres.2020.105690
Pan X. D., Zhang Z., Ye Z. J., Xu B. D., Li C. Y., Liu Y., et al. (2019). Trace Elements of Japanese Spanish Mackerel Otoliths in the Southern Yellow Sea. Fish. Sci. 43 (04), 907–916.
Piri Sahragard H., Ajorlo M., Karami P. (2018). Modeling Habitat Suitability of Range Plant Species Using Random Forest Method in Arid Mountainous Rangelands. J. Mt. Sci. 15, 2159–2171. doi: 10.1007/s11629-018-4898-1
Qiu S. Y., Li D. L., Xu B. (2007). Contribution of Chinese Fishery Management to Japanese Spanish Mackerel Resources in Yellow and Bohai Seas. Qilu. Fish. 24 (3), 39–42.
Qu J. Y., Yang G. M. M., Fang Z., Chen X. J. (2021). A Review of Research Advancement on Fisheries Biology of Japanese Spanish Mackerel (Scomberomorus Niphonius). Fish. Sci. 40 (4), 643–650.
Shui B. N., Han Z. Q., Gao T. X., Miao Z. Q., Yanagimoto T. (2009). Mitochondrial DNA Variation in the East China Sea and Yellow Sea Populations of Japanese Spanish Mackerel Scomberomorus Niphonius. Fish. Sci. 75, 593–600. doi: 10.1007/s12562-009-0083-3
Sun B. X. (2009). Status and Protection of Japanese Spanish Mackerel Resources in Yellow and Bohai Seas (Beijing: Chinese Academy of Agricultural Sciences).
Tang Q. S., Jia X. P., Zheng Y. J., et al. (2006). Marine Biological Resources and Habitat Environment in China's Exclusive Economic Zone (Beijing: Science Press).
Thuiller W., Georges D., Engler R. (2014). Biomod2: Ensemble Platform for Species Distribution Modelling.
Wang K. D., Yu H. M., Yu H. Q., Yi T. J. Y. (2019). Relationship Between Population Fluctuation and Sea Surface Temperature of Japanese Spanish Mackerel (Scomberomorus Niphonius) in Yellow and Bohai Sea. Period. Ocean. Univ. Chin. 49 (12), 31–40. doi: 10.16441/j.cnki.hdxb.20180201
Wan R., Song P. B., Li Z. G., Long X. Y. (2020). Distribution of Spawning Grounds and Environmental Characteristics of Blue-Spotted Horse Mackerel in the Yellow Sea Nearshore Area. J. Appl. Ecol. 31 (01), 275–281. doi: 10.13287/j.1001-9332.202001.032
Wei S. (1980). Relationship Between Fishery, Fishing Season and Environment of Japanese Spanish Mackerel in Yellow Sea and Bohai Sea. Trans. Oceanol. Limnol. 02, 34–40.
Xing Y. K., Wang L. L., Liu M., Zhao L. L., Kang B. (2021). Spatial Distribution and Migration Corridor Prediction of Global Green Turtle Based on Species Distribution Model. J. Fish. Sci. Chin. 28 (10), 1337–1345.
Zhang R. Z., Lu S. F., Zhao C. Y., Chen L. F., Zang Z. J., Jiang Y. W. (1985). The Eggs and Fingerlings of Chinese Offshore Fish. (Shanghai: Shanghai Science and Technology Press).
Zhang Z. X., Xu S. Y., Capinhac César, Weteringsd R., Gao T. X. (2019). Using Species Distribution Model to Predict the Impact of Climate Change on the Potential Distribution of Japanese Whiting Sillago Japonica. Ecol. Indicat. 104, 333–340. doi: 10.1016/j.ecolind.2019.05.023
Zheng Y. J., li J. S., Zhang Q. Y., et al. (2014). Advances in Biology of Important Marine Pelagic Economic Fishes in China. J. Fish. Chin. 38 (01), 149–160.
Zhu N. (2019). Simulation of Suitable Habitat Distribution of Magnolia Officinalis Based on Ensemble Model. J. Sichuan. Agric. Univ. 37 (04), 481–489. doi: 10.16036/j.issn.1000-2650.2019.04.008
Keywords: climate change, suitable habitat, Scomberomorus niphonius, species distribution, seasonal variation
Citation: Yang T, Liu X and Han Z (2022) Predicting the Effects of Climate Change on the Suitable Habitat of Japanese Spanish Mackerel (Scomberomorus niphonius) Based on the Species Distribution Model. Front. Mar. Sci. 9:927790. doi: 10.3389/fmars.2022.927790
Received: 05 May 2022; Accepted: 23 May 2022;
Published: 22 June 2022.
Edited by:
Siddhartha Pati, NatNov Bioscience Pvt Ltd, IndiaReviewed by:
Prajna Ritambhara Swain, Central Inland Fisheries Research Institute (ICAR), IndiaHassan Sheikh, University of Malaysia Terengganu, Malaysia
Copyright © 2022 Yang, Liu and Han. This is an open-access article distributed under the terms of the Creative Commons Attribution License (CC BY). The use, distribution or reproduction in other forums is permitted, provided the original author(s) and the copyright owner(s) are credited and that the original publication in this journal is cited, in accordance with accepted academic practice. No use, distribution or reproduction is permitted which does not comply with these terms.
*Correspondence: Zhiqiang Han, d6339124@163.com
†These authors have contributed equally to this work and share first authorship