


Introduction
Since the early 1900s, blast furnace slag (henceforth slag) cement has been used in a wide range of structural applications in regions such as Europe and North America (Juenger et al., Reference Juenger, Winnefeld, Provis and Ideker2011; Crossin, Reference Crossin2015; Li et al., Reference Li, Liu, Gong, Nie, Cui, Wang and Chen2016). The current European cement standard EN 197-1 covers 27 different cement types, 9 of which contain slag as the main component in proportions from 6 to 95 wt%. In the Netherlands, cement with about 65 to 70 wt% of slag (typically designated as CEM III/B) has a market share of about 60% (Bijen, Reference Bijen1996) and it has been used in reinforced concrete structures successfully for nearly a century.
The chemical composition of slag varies depending on the composition of iron ore, fluxing stone, and impurity of the coke fed into the furnace (Özbay et al., Reference Özbay, Erdemir and Durmuş2016; Sajid et al., Reference Sajid, Bai, Aamir, You, Yan and Lv2019). Normally, owing to its lower density, molten slag floats on top of molten iron liquid in the furnace upon combining lime, silica, alumina, and magnesia and could be identified as a CaO−SiO2−Al2O3−MgO system. It should be noted that the chemical composition of slag has varied significantly over the decades according to the industrial reports (Chesner et al., Reference Chesner, Collins, MacKay and Emery2002; FEhS, 2016). This change is likely due to, among other things, the use of iron-rich ore or pellet (Chauhan, Reference Chauhan2020; Li et al., Reference Li, Pan, Zhu, Guo, Shi, Chou and Xu2020), the global raw materials and fuel trade and the change of blast furnace management. Any changes in the composition of the burner or the furnace passage are expected to affect the composition of blast furnace slag produced.
A better understanding of the chemical composition of slag grains in a well-performing aged concrete could be useful in designing and predicting the service life of modern slag-rich concrete. Moreover, there are claims in the industry that problems related to surface durability issues partially arise due to the change of slag quality in recent years (Özbay et al., Reference Özbay, Erdemir and Durmuş2016). According to a group of professionals, while slag concrete produced in the past is still performing well, some of the new structures produced using comparable binders in the last decade have been showing performance issues just after a number of service years. Although there could be numerous reasons for the observed inferior performance, there is a consensus that the contemporary slag composition is likely to be the source of problems after discussion with industry experts. Because this claim is based purely on observations and experience, it needs scientific evidence to be considered valid which was the main motivation of this research. Therefore, the authors aimed to characterize unhydrated slag grains from different concrete structures representing different time periods, so that a snapshot of the compositional variation of slag during the past years could be identified.
Attempts to obtain chemical compositions of slag used in older concrete are often unsuccessful possibly because the archives of QC reports are generally discarded after a number of years. Available bulk material analysis techniques, such as X-ray fluorescence spectrometry (XRF) and inductively coupled plasma-mass spectrometry (ICP-MS)—both of which are widely used for raw material characterization—are not the most favorable techniques for characterizing unhydrated slag grains due to high interference from other phases in concrete. On the other hand, energy-dispersive X-ray spectroscopy (EDS) stands out as a favorable technique as EDS allows semiquantitative and quantitative elemental analysis at a high spatial resolution. With this technique, characteristic X-rays released upon electron–solid interaction in a small volume captured, analyzed, and identified (Reed, Reference Reed2005; Goldstein, Reference Goldstein2012; Goldstein et al., Reference Goldstein, Newbury, Michael, Ritchie, Scott and Joy2017). Standard-based quantitative EDS microanalysis is preferred over standardless analysis when higher absolute accuracy of the individual element percentages is desired (Newbury & Ritchie, Reference Newbury and Ritchie2013, Reference Newbury and Ritchie2015a, Reference Newbury and Ritchie2015b). Because the quantification of unknowns is based on using matrix corrections and standard compounds under the monitored beam conditions, the elemental analysis total is never artificially normalized to 100% as it is done in standardless microanalysis. It should be noted that the accuracy of the electron microanalysis depends on several experimental parameters including chemical composition and homogeneity of the compounds used as microanalysis standards, beam current, accelerating voltage, working distance, and take-off angle (Newbury & Ritchie, Reference Newbury and Ritchie2013; Goldstein et al., Reference Goldstein, Newbury, Michael, Ritchie, Scott and Joy2018). Quantitative EDS microanalysis together with Scanning Electron Microscope (SEM)-Back Scattered Electron (BSE) imaging has been used successfully in cementitious materials research (Harrisson et al., Reference Harrisson, Taylor and Winter1985; Mouret et al., Reference Mouret, Bascoul and Escadeillas1999; Famy et al., Reference Famy, Brough and Taylor2003; Sorbier et al., Reference Sorbier, Rosenberg and Merlet2004), especially in durability-related characterization; most of which attempted to quantify the chloride content in cement paste matrices (Koleva et al., Reference Koleva, Hu, Fraaij, Stroeven, Boshkov and De Wit2006; Jaffer & Hansson, Reference Jaffer and Hansson2009; Çopuroğlu, Reference Çopuroğlu2013; Jakobsen, Reference Jakobsen2013; Pacheco et al., Reference Pacheco, Çopuroǧlu and Polder2013; Pacheco & Çopuroğlu, Reference Pacheco and Çopuroğlu2016).
In this paper, the authors explore the feasibility of using EDS microanalysis as a tool for quantitative measurement of the chemical composition of unhydrated slag used in existing field concretes.
Materials and Methodology
Sample Information
Seven slag concrete samples were collected from randomly chosen locations in the Netherlands. A brief description of the samples is given in Table 1. Samples of different service life were investigated as the authors aimed to take a snapshot of the compositional variation of slags used in different periods during the past years. It should be noted that it is plausible to assume that the Portland cements clinkers that were blended together with slag did also show variations with respect to chemical composition and fineness.
Table 1. Descriptive Information of the Slag Concrete Samples Studied.

Quantitative EDS Microanalysis
To verify the accuracy of the standard-based method (a.k.a. quantitative EDS microanalysis), five reference slags (S1 to S5) with known chemical compositions were blended with CEM I 42.5 N (manufactured by ENCI B.V.). These five reference slags were synthesized in the laboratory with commercial slag (provided by Ecocem Benelux B.V., the Netherlands) and AR (analytical reagent, provided by Honeywell Research Chemicals, Germany) CaO, MgO, SiO2, Al2O3 according to different compositional design targets. The raw materials were melted in an Al2O3 crucible at 1,550°C in an oven for 3 h (heated from room temperature to 1,550°C at 10°C/min and maintained at 1,550°C for 3 h). Then, the molten liquid was water quenched to obtain the glassy slag.
Using the produced binders, the slag cement pastes were cast, sealed, and cured in the laboratory at 20 ± 3°C for 3 months. The slag to cement ratio was 7:3 by mass and the water to binder ratio was 0.40. Bulk compositions of reference slags as determined by standard-based XRF are presented in Table 2. At the end of the curing, chemical compositions of these five reference slags were determined using quantitative (standard-based) and semiquantitative (standardless) EDS microanalysis on randomly selected unhydrated slag particles, and the results were compared with the original bulk slag composition that were detected by XRF correspondingly. For standardless EDS microanalysis, the results were generated using the internal standards of the X-ray microanalysis software.
Table 2. Bulk Compositions (wt%) of Reference Slags as Determined by XRF.
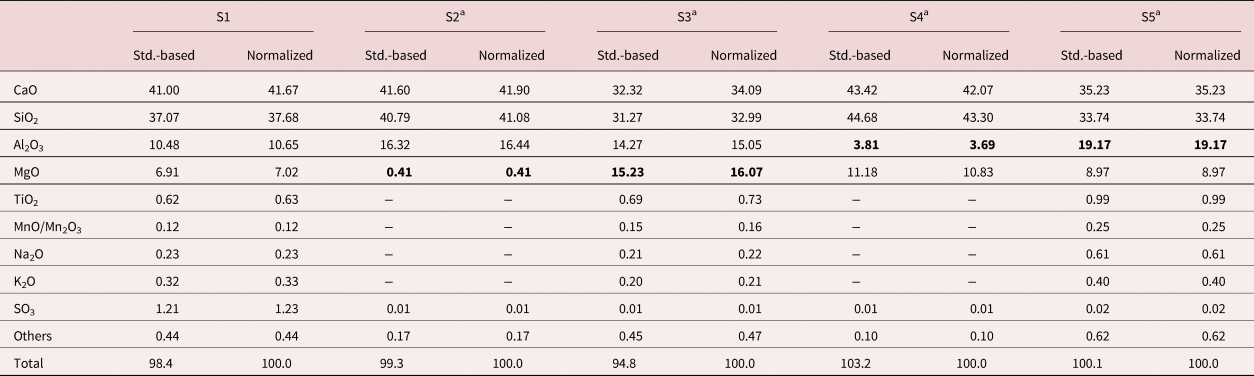
a Reference slag S2 and S3 with different MgO contents, and S4 and S5 with different Al2O3 contents were chosen to be able to verify the standard-based method for different oxide levels, especially for minor constituents.
Sample Preparation for Microanalysis
Paste samples of approximately 6 mm in height were cut and immersed in isopropanol solution for 1 week to stop hydration. Afterward, the samples were dried at 40°C oven for 1 h, and then impregnated with low-viscosity epoxy resin. Once cured, the excess epoxy was removed from the sample surfaces by grinding and polishing operations; i.e., with #180, #220, #320, #800, and #1,200 SiC grinding paper cooled with pure ethanol sequentially (For paste samples, it is recommended to start from #320.), and polished by 9, 3, 1, and 0.25 μm diamond paste in turn. After each step, the samples were immersed briefly in an ultrasonic bath filled with 99.9% ethanol for cleaning. Finally, the well-polished samples were carbon coated in a Leica EM CED 030 carbon evaporator to a thickness of about 10 nm.
Instrumental Parameters
For the microanalysis, an FEI QUANTA FEG 650 ESEM (Thermo Fisher Scientific) equipped with a solid-state EDS detector was used in a high vacuum chamber condition. The detector used was a silicon drift detector (SDD) with a NORVAR window with a resolution of 126.7 eV for the Mn Kα line at 10 kV accelerating voltage. All microanalysis was carried out at a working distance of 10 mm and an accelerating voltage of 10 kV, respectively. The take-off angle of the detector was 35.3°.
During the analysis, an electron beam current of approximately 1.2 nA was measured regularly by means of a picoammeter and a Faraday cup. The X-ray collection time was set to 60 live-seconds per analysis in order to obtain acceptable statistics without introducing excessive thermal damage on the sample. X-ray spectra of the microanalysis standards were collected under stable beam conditions, defined as less than 5% variation in beam current over 60 live-seconds per analysis. Around 30 randomly chosen points per sample were investigated in order to increase the representability and reliability. Each point analysis was performed exclusively on an unhydrated slag particle.
Electron–Slag Interaction Volume
The electron–slag interaction volume (in Figure 1) was estimated by Monte Carlo simulation using CASINO software version 2.48 (https://www.gel.usherbrooke.ca/casino/), assuming a density of 2.95 g/cm3 for slag as an input parameter at 10 kV accelerating voltage, similar to the work in Pacheco et al. (Reference Pacheco, Çopuroǧlu and Polder2013) and Pacheco & Çopuroğlu (Reference Pacheco and Çopuroğlu2016).

Fig. 1. Monte Carlo simulation of the penetration of 200 electrons accelerated at 10 kV into a hypothetical slag particle.
Figure 1 illustrates the maximum penetration depth of electron trajectories, i.e., ~1.2 μm into a hypothetical slag particle. The lateral dimension was close to the depth of interaction volume assuming a 10 nm diameter beam (Goldstein et al., Reference Goldstein, Newbury, Michael, Ritchie, Scott and Joy2017), and thus, an interaction volume of ~1.5 μm3 was determined by the simulation. Considering the typical diameter of the analyzed slag grains were around 10–20 μm, choosing analysis spots sufficiently far from the grain perimeter ensured collection of X-rays that were representative and free from interference from the surrounding matrix. The microanalysis results were reported in wt% of the slag particles, representing the interaction volume, i.e., the portion of material from which X-rays were generated and analyzed by the detector.
Microanalysis Standards
The compounds selected as quantitative microanalysis standards were obtained from a commercial mineral standard mount (see Table 3, MINM25-53 Serial BW from Astimex Scientific Ltd.).
Table 3. Compounds Employed as Standards for Quantitative EDS Microanalysis.

a It was noticed that the signal/noise ratio was too weak to identify the amount of aluminum when using albite as standard in some cases during the quantification. Therefore, the EDS spectra of pure aluminum were also employed here to increase the signal/noise ratio.
Because the current study focuses on four major elements, i.e., Ca, Si, Al, and Mg, and a number of trace elements, i.e., Ti, Mn, K, Na, and S of slag, only the eight minerals shown in Table 3 were employed.
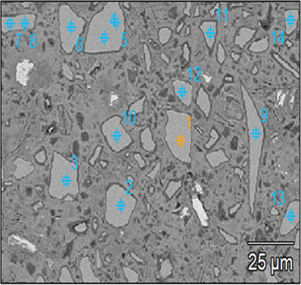
Figure 2 presents the essential steps in the quantitative EDS microanalysis routine from a to d. As an example, a representative BSE micrograph of slag S3 cement paste was acquired for Figure 2a. Subsequently, several points targeted at the unhydrated slag particles were chosen for electron bombardment as displayed in Figure 2b. It should be noted that the points were chosen close to the grain center on the relatively large particles, in order to avoid interference from the surrounding matrix. Figure 2c displays a typical EDS microanalysis spectrum of an unhydrated slag grain in (b). It contains seven main X-ray peaks as labeled; the carbon (C) signal is mainly due to the carbon coating. Here, the user-defined threshold (minimum energy cutoff) was set to 200 eV in order to include oxygen (O) which is present in all EDS spectra (In this paper, we quantified oxygen stoichiometrically.). The calibration to the reference standard mount was modeled with the NIST DTSA-II Microscopium software (Newbury & Ritchie, Reference Newbury and Ritchie2015a, Reference Newbury and Ritchie2015b). The peaks from unknown spectra were quantified using a k-ratio fitting routine with the known compositions of standards spectra. A typical residual spectrum was rendered in Figure 2d. We assumed that the analysis was completed with acceptable accuracy, as no unassigned minor peak was left, and the residual count was sufficiently low.

Fig. 2. The basic routine for quantitative EDS microanalysis. (a) A representative BSE micrograph of slag S3 cement paste; (b) several points targeted at unhydrated slag grains; (c) EDS spectra of an unreacted slag grain extracted from a single point microanalysis; and (d) a typical residual spectra after standard-based quantification.
Results
Reference Slag Compositions in Hardened Cement Paste
A statistical summary of the EDS microanalysis of the reference slags (S1 to S5) was computed and exported as shown in Table 4. The results include the mean value of each metal oxide and the standard deviation of the corresponding data set. The relative deviation (RD) between the values determined by quantitative and semiquantitative EDS microanalysis (RD1), as well as quantitative EDS microanalysis and XRF analysis (RD2) are reported in Table 5. Overall, the microanalysis provided acceptable quantification accuracy regarding the four main metal oxides contents (CaO, SiO2, Al2O3, and MgO) of slag considering that RD was less than 5%. The relatively large deviation and uncertainty of the amounts of the trace elements, among different methods (see Table 5), Ti, Mn, and S in particular, can be attributed to the following reasons: (1) EDS microanalysis is based on individual point or interaction volume, and it is different from XRF measurement which measures the bulk composition. (2) The amounts of trace elements of slag are quite low, some of which are even close to the detection limit. Therefore, a minor fluctuation in noise can lead to a high relative deviation. Wavelength-dispersive X-ray spectrometry (WDS) can be recommended due to its relatively high spectral resolution, by a factor of ten or more, if the trace element is the main target for research. (3) In addition, it is very likely that trace elements are distributed unevenly within the slag grains (Blotevogel et al., Reference Blotevogel, Steger, Hart, Doussang, Kaknics, Poirier, Bornhöft, Deubener, Patapy and Cyr2021).
Table 4. Chemical Composition (wt%) of Five Reference Slags Based on Quantitative (Std.-based) and Semiquantitative (Standardless) EDS Microanalysis.

Table 5. The Relative Deviation Between the Values Based on Quantitative EDS Microanalysis and Semiquantitative EDS Microanalysis, as well as Quantitative EDS Microanalysis and XRF Analysis.

a Relative deviation 1 (RD1) was used to describe the discrepancy of values determined by quantitative EDS microanalysis and semiquantitative EDS microanalysis, defined as  $= \vert {{\rm std}. \hbox{-}{\rm based}-{\rm standardless}} \vert /{\rm std}. \hbox{-}{\rm based}$; Relative deviation 2 (RD2) was used to describe the discrepancy of values determined by quantitative EDS microanalysis and quantitative XRF result, defined as =|EDS − XRF|/EDS.
Figure 3 shows a box plot based on the quantitative microanalysis results of the four main metal oxide contents in the reference slag samples. Each plot corresponds to a single metal oxide mass percentage. Results showed that a few points fell outside the box and the whisker ends, which indicates sporadic compositional imperfections. On the other hand, the slender boxes do imply a relatively homogeneous composition.

Fig. 3. Box plots of four main metal oxide contents of slag samples based on standard-based EDS microanalysis. (a) CaO, (b) SiO2, (c) Al2O3, (d) MgO. The small hollow box indicates the mean value, the horizontal line inside the box the median, the lower and upper ends of the box the first and third quartile, respectively, and the two whiskers connected with the box by a vertical line indicate the minimum and maximum limits, and solid rhombus indicates the outliers.
Unhydrated Slag Composition in Hardened Field Concrete
Upon verifying the suitability of the microanalysis standards on the reference samples, the same methodology was applied on the field concrete specimens. The oxide compositions of the unhydrated slag grains were determined and listed in Table 6 and the statistical variation of the main oxides is summarized in Figure 4. The analytical total was a slightly higher total compared to the ideal 98–102% range, although it can be considered acceptable considering the heterogeneity of the slag grains compared to pure compounds. Furthermore, the microanalysis results lead to the following observations:
(1) The results of sample A, which was dated back to 1940s, display comparably large scatter reflected by the size of the box plot.
(2) As for samples B to F, the change in slag chemistry is insignificant; however, elevated in CaO and SiO2 contents are found in slag used for sample G, opposite to that of Al2O3 and MgO.
(3) In addition to the main metal oxide slag grains (CaO−SiO2−Al2O3−MgO), sulfur tends to be the next important element when mass percentage is considered.

Fig. 4. Box plot of four main metal oxide contents of slag in field concrete samples as quantified by EDS microanalysis. (a) CaO, (b) SiO2, (c) Al2O3, (d) MgO.
Table 6. Chemical Composition (in wt%) of Slag in Hardened Concrete Samples Based on Quantitative and Semiquantitative EDS Microanalysis.

Heterogeneity in a Single Slag Particle
Within a single slag particle, some elements showed an affinity for the small droplets of metallic iron. These elements were partitioned between the metallic and the glassy phases of slag, leading to the formation of heterogeneous slag grains with uneven element distribution (Blotevogel et al., Reference Blotevogel, Ehrenberg, Steger, Doussang, Kaknics, Patapy and Cyr2020). Moreover, higher amounts of metallic phases lead to lower glass contents due to the partitioning. In enriched slag grains with heavy metallic oxides such as TiO2 and MnO, heterogeneity is more apparent (Blotevogel et al., Reference Blotevogel, Steger, Hart, Doussang, Kaknics, Poirier, Bornhöft, Deubener, Patapy and Cyr2021). This phenomenon may increase the standard deviation of microanalysis results, therefore more analysis is needed to get a good estimate.
Five reference slags S1 to S5 were almost entirely amorphous based on X-ray diffraction characterization with low amounts of heavy metal oxides, e.g., TiO2 and MnO. Therefore, significant heterogeneity was not expected in these slag grains. The homogeneity of slag grains was then evaluated with EDS point analysis for confirmation. Two relatively large slag particles were selected from S3 and S5 reference slag pastes, respectively, on which around ten spot analysis points were chosen as shown in Figure 5. A statistical summary of the chemical compositions regarding the four main metal oxide contents is shown in Table 7. Compared with the results displayed in Table 4, the standard deviation of points within a single slag grain decreases significantly, and the extremely low coefficient of variation (Table 7) further proves that these two slags were highly homogeneous, and there was negligible heterogeneity.

Fig. 5. Two large slag particles chosen from reference slag (a) S3 and (b) S5 pastes, respectively.
Table 7. Chemical Composition (wt%) of Slag Determined by Quantitative EDS Microanalysis on Single Large Slag Grain (mean value ± standard deviation) and the Corresponding Coefficient of Variation (CV).

Discussion
Remarks on the EDS Microanalysis Methodologies
As mentioned in Newbury & Ritchie (Reference Newbury and Ritchie2013), a significantly large number of EDS microanalysis results are generated using commercial “standardless” routines instead of employing the k-ratio/matrix corrections protocols using microanalytical standards. Relying on the internal standards only leads to normalization of the detected composition, which could be highly erroneous for hydrated compounds. Because the standardless routine normalizes the mass percentage total of all constituents to exactly 100%, critical information will be lost, and analyst cannot estimate whether or not the points selected on slag grains were accurately characterized; this is reflected by the results shown in Table 6. An evident difference was observed regarding the mass percentages of four main metal oxides in slag between standard-based and standardless microanalysis. Meanwhile, a much lower standard deviation is obtained for most metal oxides calculated from standard-based microanalysis. Outliers with extremely low or higher analytical total can be removed from the data set, which decreases the standard deviation considerably. Also, the analyst would be wise to further investigate the source of error, e.g., instrumental parameters or the presence of an omitted component in slag (Newbury et al., Reference Newbury, Swyt and Myklebust1995).
As for the relatively large analytical total range in the present paper compared to the convention (98–102%), it could be explained by the following reasons: (1) The porosity of slag grain is related to its bulk density, chemical composition, granulation method, etc. It was found that the average density of wet granulated blast furnace slag was ~2.9 g/cm³ and its total porosity was around 5–10% by volume (Ehgrenberg, Reference Ehgrenberg2006). These pores in slag grain may result in errors on both excitation (Z) and absorption (A) corrections during quantitative microanalysis. Electron interaction in a porous matrix even led to different backscattering coefficients compared to crystalline materials (Poirier & Gauvin, Reference Poirier and Gauvin2011), and analytical totals decreased with increasing local porosity (Kjellsen et al., Reference Kjellsen, Wallevik and Fjällberg1998). (2) Differences in matrix correction factors between slag grain and standard minerals. Commonly, available rock-forming minerals do not resemble slag grain in terms of structure and composition. Thus, the selection of standards for each element of slag leads to variation in analytical total due to the matrix effect between the standard minerals and slag grain. Therefore, it is suggested that calibration studies should be carried out with available microanalysis standards in the future.
Sulfur and Titanium in Slag
The sulfur (S) in slag comes from iron pyrite (used as raw material) and coke for fuel. During quenching, it will be released in the form of H2S with water vapor and the residual sulfur can be found as sulfide in slag. As revealed in Table 6, besides the main metal oxides of slag grains (CaO−SiO2−Al2O3−MgO), sulfur tends to be the most important minor constituent when mass percentage is considered. It varies around 2–4 wt% in slags used in field concretes. European Standard EN 15167-1 requires that the sulfide and sulfate contents in slag should be ≤ 2.0 and 2.5%, respectively. However, the standard did not specify how to measure sulfide and sulfate contents in slag.
During the quantitative EDS microanalysis, anhydrite was used as a microanalytical standard, and sulfate (SO3) was assumed to be the oxide form existing in slag, therefore in order to generate the oxide table, three oxygen atoms were assigned to one sulfur atom, stoichiometrically. Conversely, part or even most of sulfur exists in the form of sulfide (S2−) in slag, which could not be distinguished by the analysis. This is the same for XRF analysis, both of which are based on X-ray characterization. Therefore, the sulfur content based on XRF or EDS analysis should not be considered accurate.
European Standard EN 196-2 recommends to ignite slag in an oxidizing atmosphere at 950 ± 50°C to ensure the oxidation of sulfide, and then to determine its amount. However, the oxidation of any iron or manganese may influence the result. ICP-Ion chromatography (IC) appears to be an alternative method, which has been used to analyze slag paste in order to determine the amounts of different forms of sulfur (S2−, S2O32−, and SO42−) (Glasser et al., Reference Glasser, Luke, Angus and Research1988; Gruskovnjak et al., Reference Gruskovnjak, Lothenbach, Holzer, Figi and Winnefeld2006; Lothenbach et al., Reference Lothenbach, Le Saout, Haha, Figi, Wieland and Research2012). Based on the affinity to ion exchanger, this method can separate almost all charged ions (Ninfa et al., Reference Ninfa, Ballou and Benore2009). Therefore, if sulfur content is the main concern of research, we recommend to combine these methods together and find the one or one of best availability.
As for trace element Ti, TiO2 content in slag is commonly found less than 1 wt% and regarded as noncritical (Ehgrenberg, Reference Ehgrenberg2006). There is no specific requirement regarding the amount of TiO2 in slag in EN 15167-1. Some studies found that if the TiO2 content exceeds a critical limit, which is about 1 wt%, it results in a more or less pronounced reduction in the strength of the cements produced with this slag (Demoulian et al., Reference Demoulian, Gourdin, Hawthorn and Vernet1980; Blotevogel et al., Reference Blotevogel, Steger, Hart, Doussang, Kaknics, Poirier, Bornhöft, Deubener, Patapy and Cyr2021; Le Cornec et al., Reference Le Cornec, Galoisy, Izoret, Cormier, Trcera and Calas2021). In the present research, the amount of Ti varies around 1–2 wt% when quantifying it in reference slag pastes and field slag concrete samples. However, a large relative deviation was found among different characterization methods. It is partially arising from the accelerating voltage of 10 kV employed here, and thus, a lower overvoltage ratio is obtained for Ti compared to other elements. In addition, it is challenging for concentration characterization as a trace element in slag. Therefore, WDS at higher accelerating voltage is recommended to determine the amount of TiO2 in slag due to its relatively higher spectral resolution by a factor of ten or more, unless its heterogeneously distributed in the particles as trace constituent.
Chemical Composition of Slag Used in the Industry
Since blast furnaces used to be found in the vicinity of iron ore and/or coal deposits, and the chemical composition of blast furnace slag was strongly connected to the raw material compositions (dependent on the location/geology), it is no surprise that slag chemistry varies over a wide range across locations. Additionally, different blast furnace management and metallurgical technology may further change the composition of slag. All these reasons inevitably lead to variations of slag products throughout the world. Table 8 shows significant discrepancies with regards to the chemical composition of blast furnace slag examples in an international comparison. The range of the basicity (CaO + MgO)/SiO2 varies remarkably, which is an indication of considerable difference for the latent hydraulic property of slag.
Table 8. Typical Chemical Composition (wt%) of Blast Furnace Slag in Europe, North America, Australia, and Netherlands Based on the Present Research.

Next to the geographical variations, slag compositions have been observed to vary in a single location over time, as reported in Ehgrenberg (Reference Ehgrenberg2006). Our findings also revealed that an evident increase in CaO and SiO2 contents is found in slag used for sample G (2015). Moreover, a survey on the recent publications (2019–2021) highlights a trend for consistent production of lime-rich and magnesium-poor slag in cement manufacturing, which appears to be especially distinct across Europe (Alonso et al., Reference Alonso, Gascó, Morales, Suárez-Navarro, Zamorano and Puertas2019; Ukpata et al., Reference Ukpata, Basheer and Black2019; Blotevogel et al., Reference Blotevogel, Ehrenberg, Steger, Doussang, Kaknics, Patapy and Cyr2020; Dai et al., Reference Dai, Aydin, Yardimci, Qiang, Lesage and De Schutter2021; Kiiashko et al., Reference Kiiashko, Chaouche and Frouin2021), North America (Burciaga-Díaz, Reference Burciaga-Díaz2019; Wang et al., Reference Wang, McCaslin and White2020; Sakr & Bassuoni, Reference Sakr and Bassuoni2021), and Australia (Samarakoon et al., Reference Samarakoon, Ranjith, Duan and De Silva2020). The lime and magnesia in slag originate from the flux added into the blast furnace. The trend mentioned earlier indicates an increasing amount of limestone use over dolomite as the flux. It appears that the trend of producing Ca-rich/Mg-poor slag arose partly due to the need for compensating decreased viscosity of molten slag at melting point. According to Mußgnug (Reference Mußgnug1942), Jiang et al. (Reference Jiang, Wang, Guo, Chen and Zheng2016), and Shen et al. (Reference Shen, Hu, Zheng, Jiang, Gao, Han and Long2020), for example, for a blast furnace slag with a CaO/SiO2 mass ratio a little higher than 1, a MgO content between 6.2 and6.6 wt% and a Al2O3 content at around 14 wt% is optimal to produce slag that melts easily. No doubt this trend deserves more attention both from industry and academia. It was already found that CaO and MgO in slag basically had a positive effect on slag reactivity, whereas SiO2 had a negative influence (Taylor, Reference Taylor1997; Barnes & Bensted, Reference Barnes and Bensted2002; Itoh, Reference Itoh2004; Haha et al., Reference Haha, Lothenbach, Le Saout and Winnefeld2011; Bernal et al., Reference Bernal, San Nicolas, Myers, de Gutiérrez, Puertas, van Deventer and Provis2014). However, according to the authors’ knowledge, few researches went deep into the correlation between slag chemistry and durability property of slag-containing paste, e.g., carbonation, chloride, and sulfate attack. Therefore, related research should be performed when slag is used as a primary supplementary cementitious material (SCM).
Conclusion
This paper explored the potential to use EDS microanalysis as a tool for quantitative measurement of the chemical composition of unhydrated slag grains in existing concretes. Our results showed that EDS microanalysis provides reliable quantification regarding the four main metal oxides contents (CaO, SiO2, Al2O3, and MgO) of slag. Other main conclusions drawn were as follows:
• For samples B to F, the change in slag chemistry is insignificant; however, an evident increasing in CaO and SiO2 contents is found in slag used for sample G, opposite to that of Al2O3 and MgO. Also, this is consistent with a recent trend has been observed that only lime-rich and low-magnesium slag is used for slag cement production. Similar research should be extended to other regions where slag is used as a primary SCM.
• For sulfur and titanium, a large relative deviation was found among different characterization methods when determining their concentrations, which was related to the heterogeneity of slag particle and oxidation state on sulfur. Therefore, a higher resolution technique such as WDS should be considered when these elements are of concern.
Acknowledgments
China Scholarship Council (the Grant Number 201808320456) and BAM Infraconsult B.V. are gratefully acknowledged for their financial support. Authors thank Arjan Thijssen (Microlab, TU Delft) for his technical support. Anna Alberda van Ekenstein and Bart Hendrix (Microlab, TU Delft) shared the samples collected from field for investigation, and authors would also like to thank them. René Albers (Ecocem Benelux B.V.) is gratefully acknowledged for providing commercial slags.


 Open access