 Xianshu Kong1†
 Qian Zhang1†Xuemei Wu1Tianning Zou1Jiajun Duan1Shujie Song2Jianyun Nie1Chu Tao1Mi Tang2Maohua Wang3Jieya Zou1Yu Xie4
 Zhenhui Li4*
 Zhen Li1*
- 1Third Department of the Breast Surgery, The Third Affiliated Hospital of Kunming Medical University, Yunnan Cancer Hospital, Yunnan Cancer Center, Kunming, China
- 2Department of Pathology, The Third Affiliated Hospital of Kunming Medical University, Yunnan Cancer Hospital, Yunnan Cancer Center, Kunming, China
- 3First Department of the Breast Surgery, The Third Affiliated Hospital of Kunming Medical University, Yunnan Cancer Hospital, Yunnan Cancer Center, Kunming, China
- 4Department of Radiology, The Third Affiliated Hospital of Kunming Medical University, Yunnan Cancer Hospital, Yunnan Cancer Center, Kunming, China
Neoadjuvant chemotherapy (NAC) is increasingly widely used in breast cancer treatment, and accurate evaluation of its response provides essential information for treatment and prognosis. Thus, the imaging tools used to quantify the disease response are critical in evaluating and managing patients treated with NAC. We discussed the recent progress, advantages, and disadvantages of common imaging methods in assessing the efficacy of NAC for breast cancer.
1 Introduction
The World Health Organization International Agency for Research on Cancer (IARC) released the world’s latest cancer burden data in 2020. New breast cancer cases reached 2.26 million in 2020, replacing lung cancer as the world’s most extensive cancer. In 2020, the number of new breast cancer cases in China was about 420,000, and the death toll reached 120,000 (1), placing a heavy burden on society. Therefore, research on the diagnosis and treatment of breast cancer has significant value.
In clinical practice, early breast cancer lesions can be directly treated by surgical resection, but for breast cancer with large primary foci or early metastasis, direct surgical resection cannot achieve the best therapeutic effect. NAC, one of the standard treatments for most breast cancers, refers to a systemic chemotherapy administered prior to the local treatment modality for primary tumors. It can lower the clinical stages of tumors, to facilitate breast conservation and render inoperable tumors operable (2). In recent years, NAC has attracted extensive attention. Although patients with breast cancer respond to NAC, significant differences exist. For instance, patients at the same stage and with the same molecular typing may show different responses to the same NAC. Study (3) shows that 10%~35% of patients are still insensitive to NAC, and disease progression can occur during treatment. Therefore, it is of great importance to timely and accurately evaluate the efficacy of NAC for breast cancer. During NAC, early evaluation of its efficacy is helpful for the clinical assessment of patients’ sensitivity to chemotherapy drugs, to guide subsequent precise drug use (4). In addition, NAC can reduce the burden of the primary tumor and achieve pathologic complete response (pCR) of axillary lymph node metastasis in more than half of patients (5). Thus, the possibility of axillary preservation is improved, and problems, such as upper limb edema, pain, and limited shoulder joint movement caused by the axillary lymph node dissection, are avoided (6). Therefore, accurate evaluation of the efficacy of NAC is critical to achieving individualized treatment of breast cancer.
The first stage of NAC process is patient selection. Ideally, not all the patients requiring adjuvant chemotherapy should receive NAC. The American Society of Clinical Oncology (ASCO), National Comprehensive Cancer Network (NCCN), Chinese Society of Clinical Oncology (CSCO), and other guidelines have recommended the selection of an intention-to-treat population. “Based on the actual clinical needs, and guided by the therapeutic purpose” is an important clinical practice NAC candidate selection principle (7). Figure 1 shows the specific screening process of NAC candidates in Yunnan Cancer Hospital.
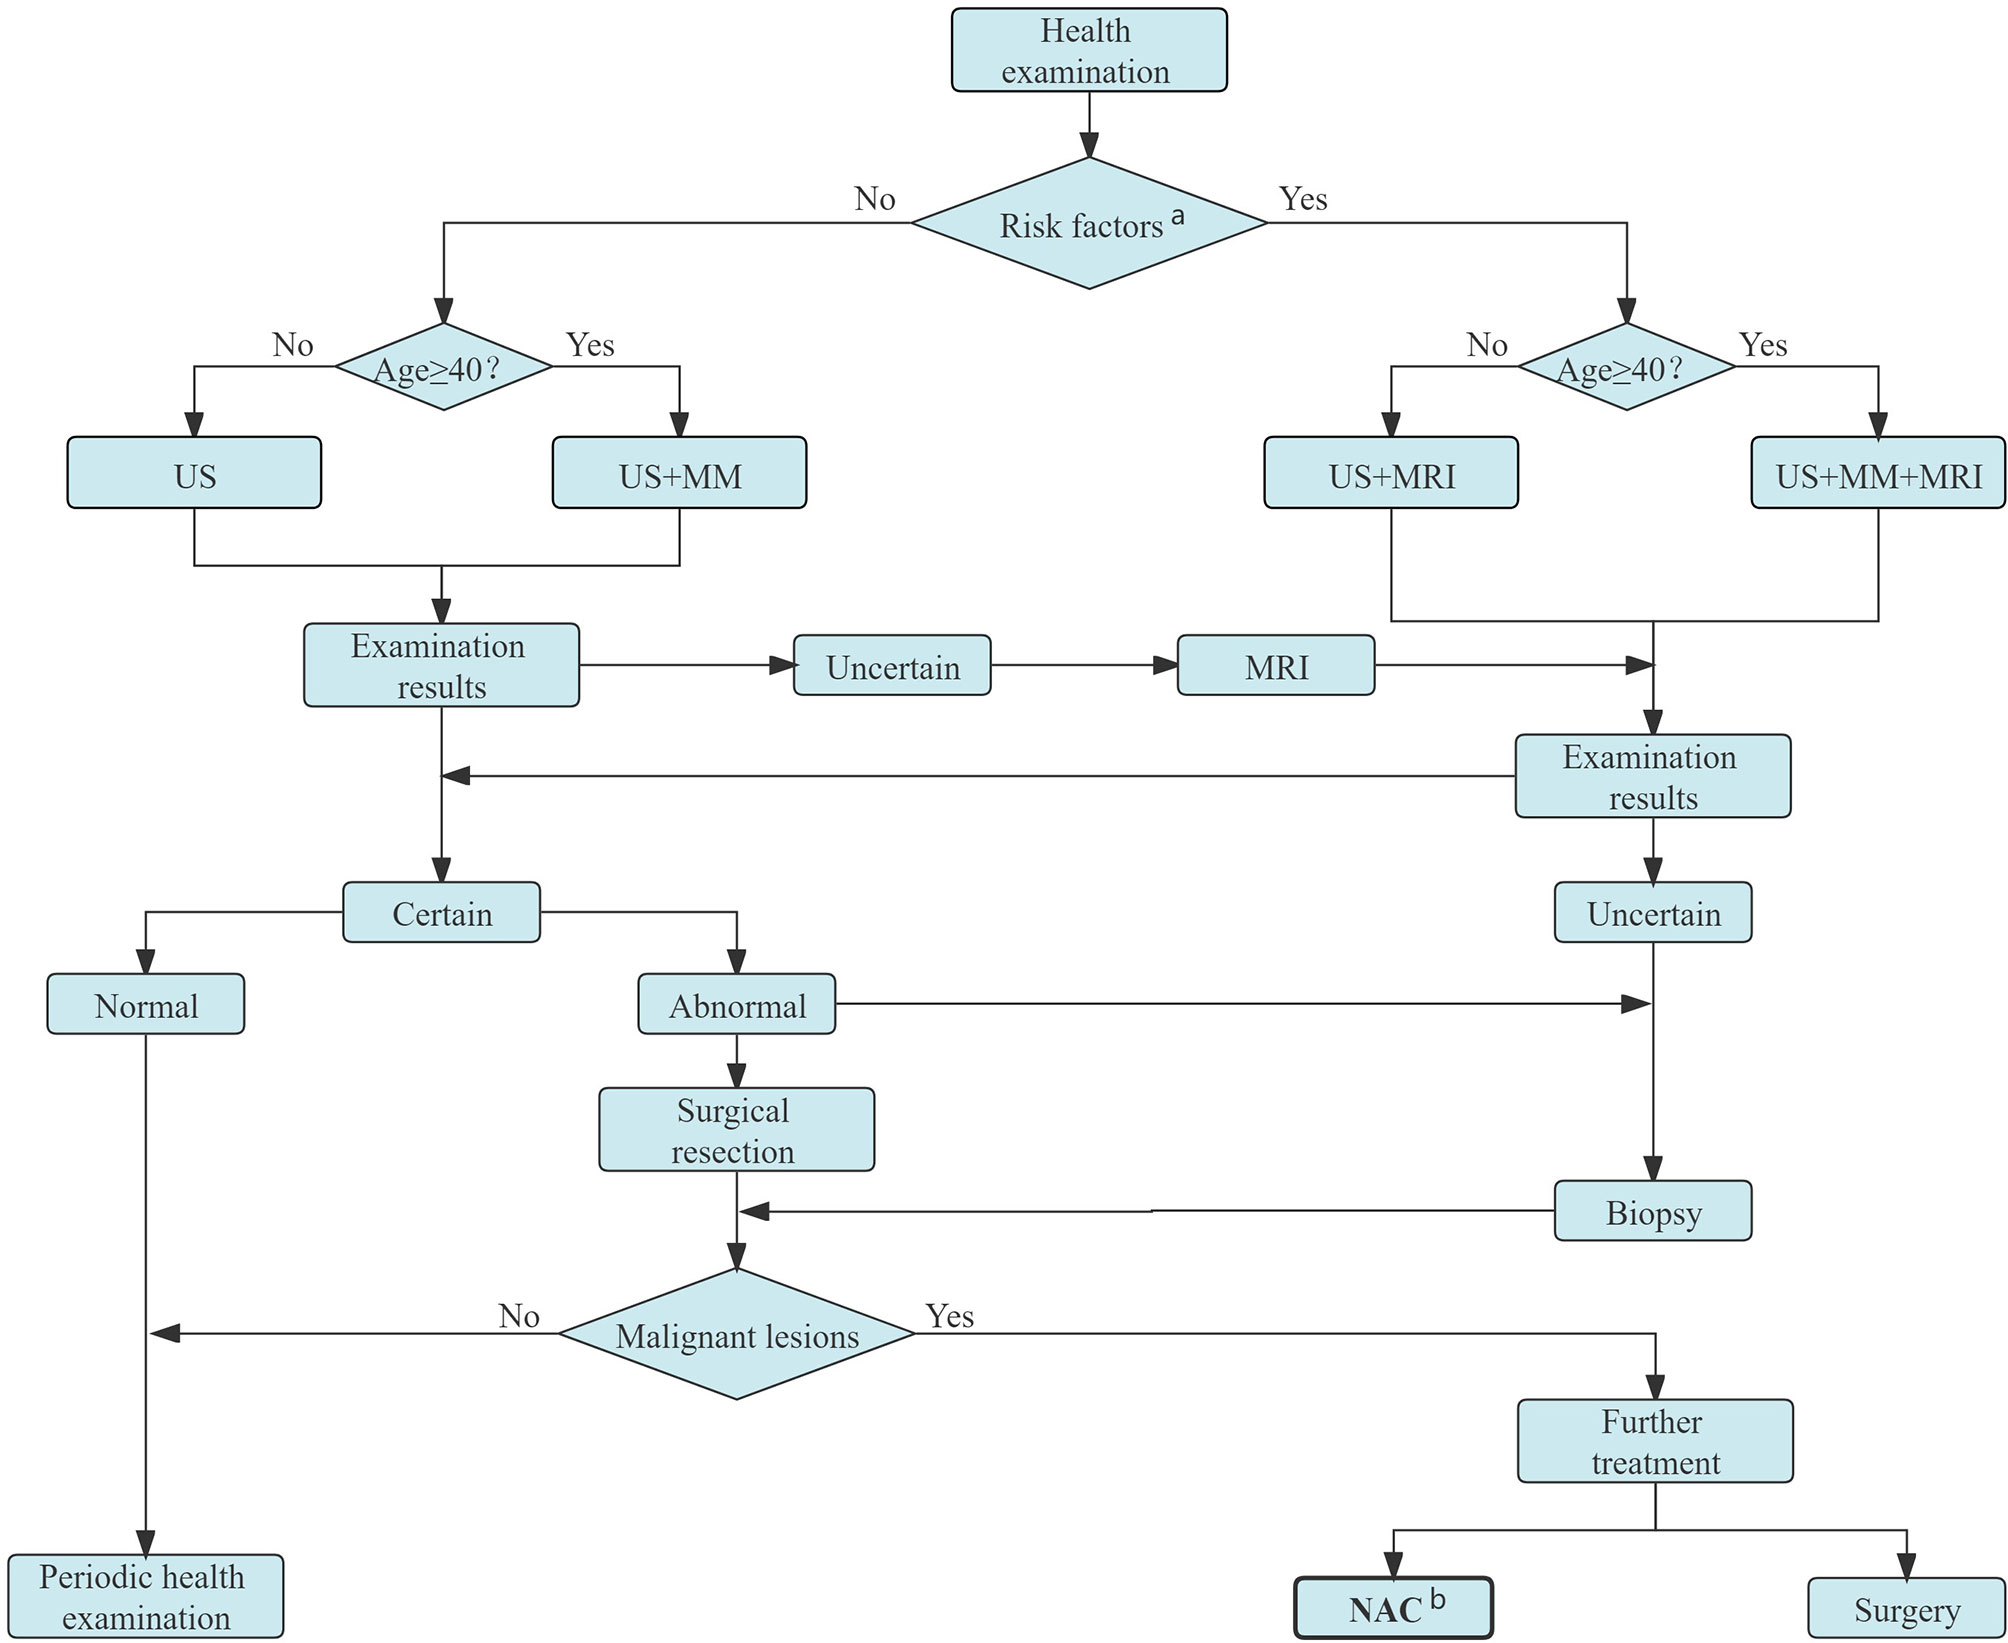
Figure 1 Candidates for NAC screening process in Yunnan Cancer Hospital. a Persons with obvious genetic tendency of breast cancer, history of LCIS or ductal or lobular dysplasia, or who experienced chest radiation before age 30. b Candidates for NAC: patients with inoperable breast cancer (IBC, bulky or matted cN2 axillary nodes, cN3 nodal disease, cT4 tumors), NAC is preferred for those with inoperable breast cancer (HER2-positive disease and TNBC if cT≥2 or cN≥1, large primary tumor relative to breast size in a patient who desires breast conservation, cN+ disease is likely to become cN0 with preoperative systemic therapy) and patients in whom definitive surgery may be delayed. US, ultrasound; MM, mammography; MRI, magnetic resonance imaging; NAC, neoadjuvant chemotherapy; LCIS, lobular carcinoma in situ; IBC, inflammatory breast cancer; HER2, human epidermal growth factor receptor 2.
On the entry of the candidates into the NAC process, the NAC efficacy needs to be evaluated. The current methods used to assess the efficacy of NAC in breast cancer include clinical manifestations, laboratory examinations (8), imaging, pathology, and molecular examination (9). Current clinical examination mainly relies on doctors’ palpation to measure the size of the mass before and after NAC, to evaluate changes in the size. However, some problems may exist: subjective measurement and doctors’ evaluation inaccuracy, failure to differentiate tumor residue after chemotherapy from fibrosis or necrosis caused by chemotherapy, difficult perception of deeper and smaller lesions, and a high dependency on the doctors’ clinical experience.
As the gold standard for evaluating tumor response after chemotherapy, through pathological examination, changes, degeneration, necrosis, and tumor cell disappearance after chemotherapy, can be observed directly with high diagnostic accuracy. In particular, patients who achieved pCR after NAC have a better prognosis. A study (10) revealed that the degree of pathological reaction after NAC is closely related to the patients’ prognosis. Therefore, it is important to accurately evaluate and report pathological reactions after NAC. The WHO Classification of Breast Tumor Pathology and Genetics (2012 edition) lists eight assessment systems but does not explicitly recommend them (11). Currently, the commonly used pathological evaluation systems of NAC include Miller-Payne (MP) system, Residual Cancer Burden (RCB) system, Chevallier system, Sataloff system, and the AJCC ypTNM installment. Most of these evaluation systems classify post-chemotherapy reactions into pCR and non-pCR. Non-pCR patients are further categorize using different assessment systems by degree of response. The MP system is commonly used in the pathology departments in China (12), it compares the coarse needle biopsy specimen before chemotherapy with the surgical specimen after chemotherapy, and mainly evaluates the cell richness of residual tumor (which is divided into five grades) after NAC. However, as an invasive examination, pathologic examination is not actively applied in the treatment process. It must be performed after surgery; thus, the outcome of the efficacy evaluation is obtained late, and the sensitivity of the tumor to chemotherapy cannot be timely assessed. Therefore, it is difficult to adjust the treatment schedule in time, resulting in the best time for adjustment easily missed.
Imaging, as one of the most important methods to evaluate the efficacy, has the advantage of being non-invasive and can be used throughout the whole process of breast cancer treatment, including a pre-treatment baseline image to determine the scope of the lesion, treatment efficacy evaluation during NAC, and post-treatment residual lesion evaluation. Imaging examination can not only objectively be used to evaluate the efficacy of NAC, but also provides an important basis for clinicians to choose an appropriate surgical approach and determine patients’ prognosis. At present, the commonly used clinical imaging evaluation methods include mammography, ultrasound, magnetic resonance imaging (MRI), and positron emission tomography CT (PET-CT). Figure 2 shows the imaging evaluation process of NAC efficacy for breast cancer in Yunnan Cancer Hospital.
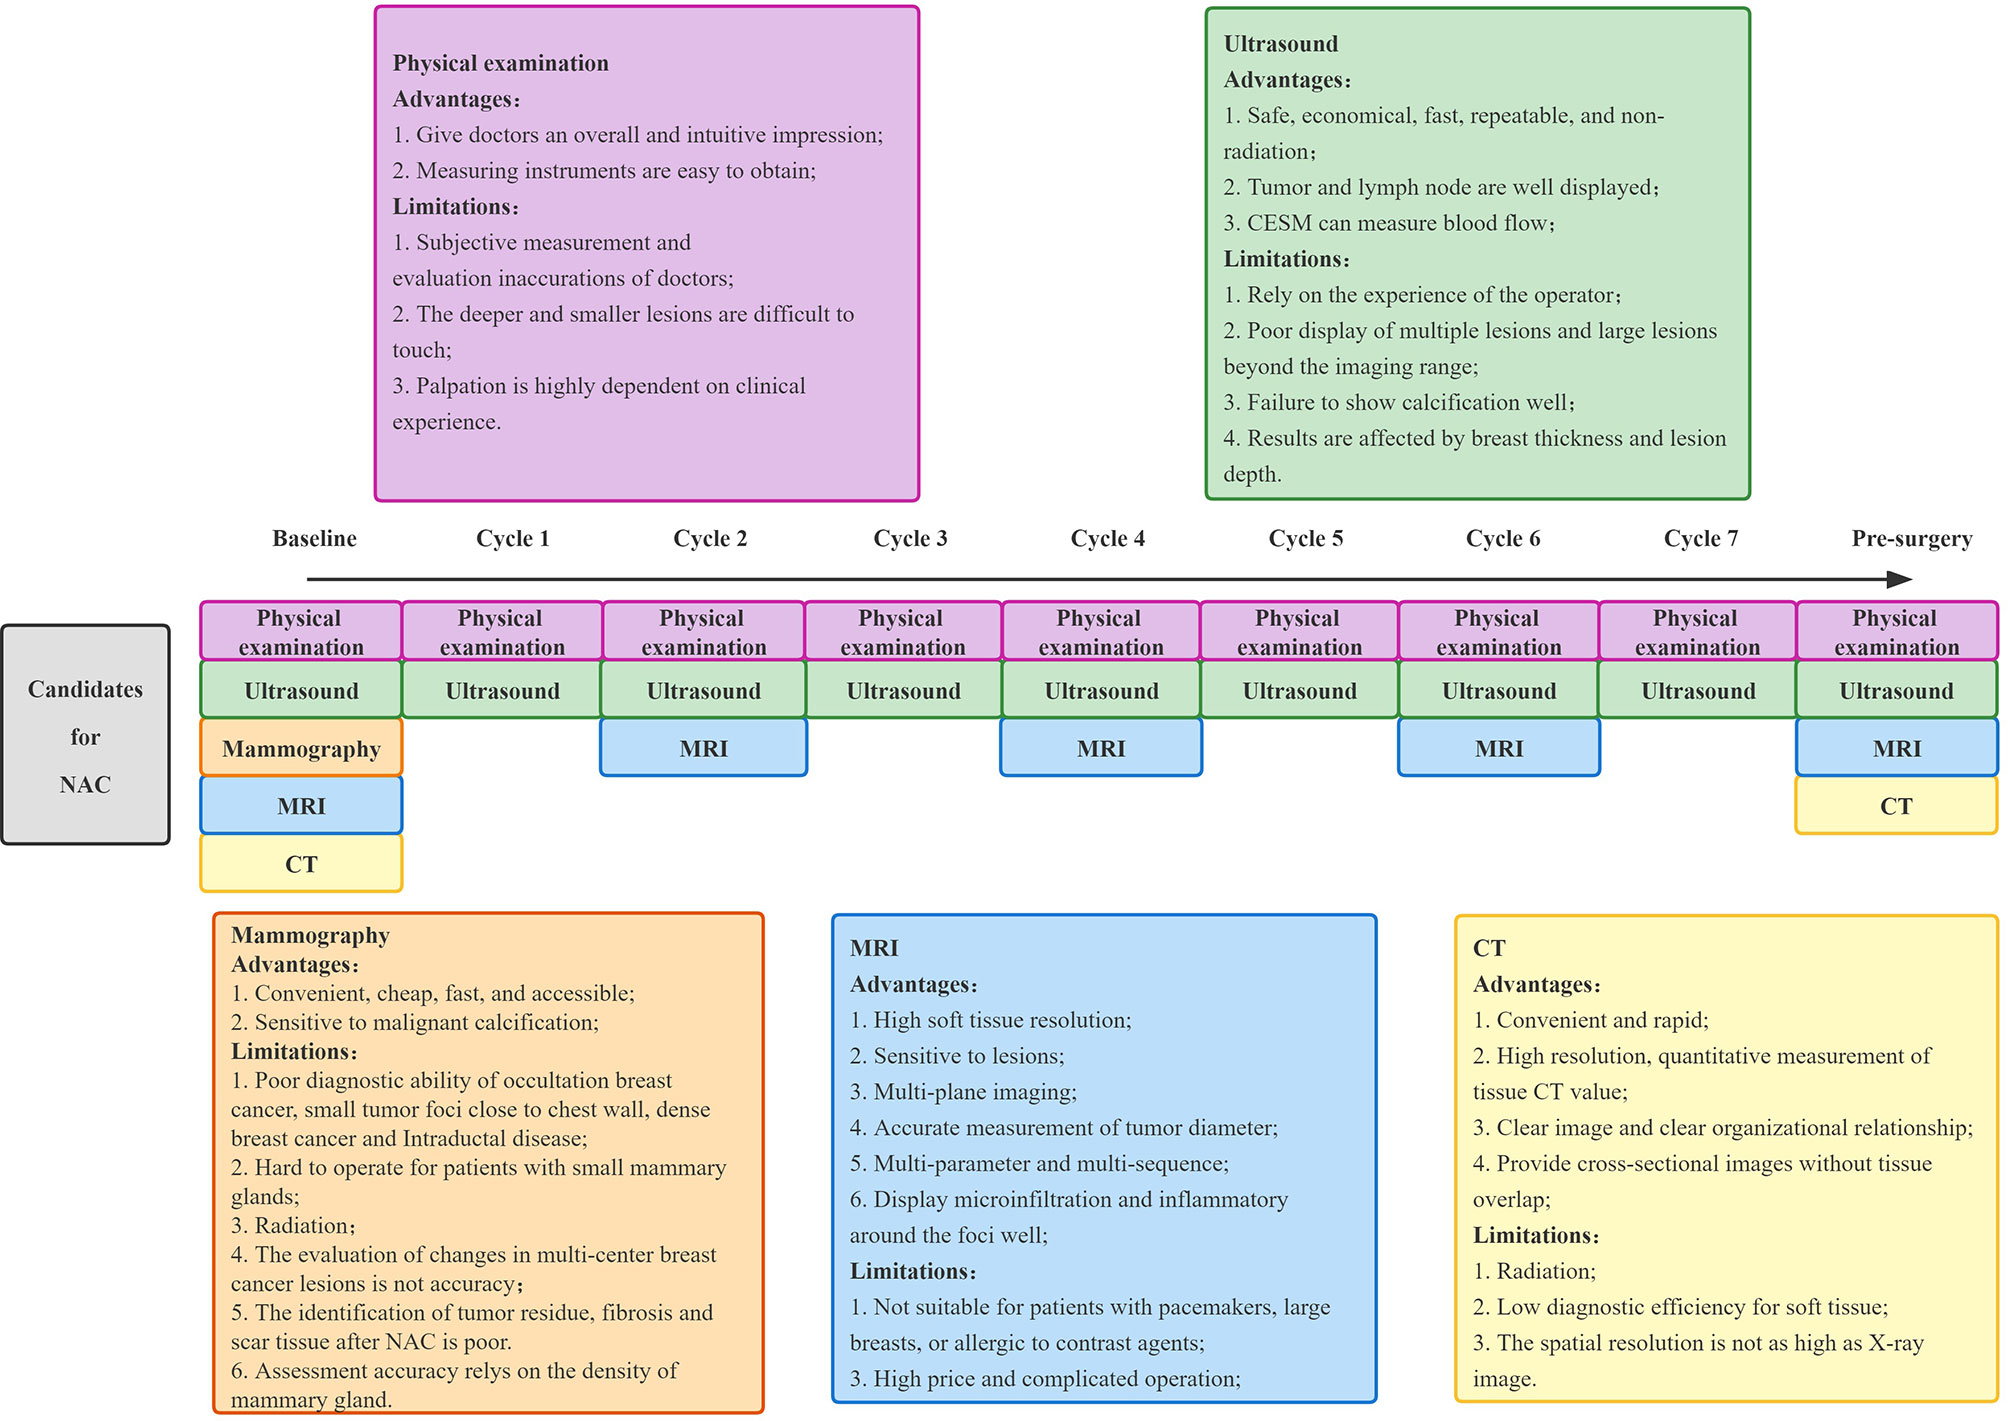
Figure 2 The model of imaging technology to assess the efficacy of NAC for breast cancer in Yunnan Cancer Hospital. NAC, neoadjuvant chemotherapy; MRI, magnetic resonance imaging; CT, computed tomography.
Nevertheless, there is no unified guideline for the imaging evaluation of NAC response, and in recent times, the efficacy evaluation is mainly based on changes in tumor size, changes in the degree of ultrasound or MRI enhancement, and the form of tumor regression. Currently, the Response Evaluation Criteria in Solid Tumors (RECIST) 1.1 (13) remains the most used clinical evaluation criteria. This is done by measuring the change in the longest diameter of the lesion before and after NAC to evaluate efficacy, with a focus on the observance of change in the longest diameter of the lesion. For multifocal lesions, a comparison of the sum of the longest diameter measurements of all lesions should be included. Tumor remission after treatment is categorized as remission or no remission according to RECIST criteria. Remission included: 1) complete remission (CR) or no tumor residue; 2) partial response (PR), which was when the longest diameter of the tumor decreased by >30%. No remission included: 1) disease progression (PD), which was when the maximum diameter of the tumor increased by >20% or a new lesion appeared; 2) stable disease (SD), when the tumor size changes are between those of partial remission and progression. However, there are some limitations of RECIST 1.1. Tumor regression can be divided into centripetal (when the tumor size decreases significantly) and non-centripetal regression (when its size does not change significantly), RECIST 1.1 is not suitable for the efficacy evaluation of non-centripetal regression tumor. Moreover, RECIST 1.1 is far from being adequate for evaluating NAC efficacy of breast cancer based on tumor diameter only. There is still no guideline or standard to guide the selection of important evaluation indicators such as functional magnetic resonance and three-dimensional US, which needs to be further improved.
There are different imaging methods suitable for evaluating NAC efficacy in different stages of breast cancer, and each imaging method also has its own area of emphasis for evaluating efficacy in breast cancer of different molecular types. It is crucial for clinicians to familiarize themselves with the progress, advantages, and disadvantages of these imaging methods in evaluating NAC efficacy. Currently, several studies, reviews, and meta-analyses exist on imaging assessment of NAC. To this end, this article reviews the value and recent progress of imaging in evaluating NAC efficacy for breast cancer based on the study of a large number of relevant literature.
2 Evaluation of the Efficacy of Mammography on NAC in Breast Cancer
2.1 Mammography
Mammography evaluation shows signs of tumor lesion calcification disappearance and burr shortening or disappearance after breast cancer NAC. However, the above features have low accuracy in evaluating the efficacy of NAC. The evaluation of efficacy after NAC by mammography is mainly based on changes in tumor size and density. Two retrospective studies (6, 14) showed poor consistency between mammography measurement and pathological results after NAC, with a moderate level of consistency correlation coefficient (CCC) at only 0.52-0.58. Therefore, most experts consider mammography to be unsuitable for the evaluation of NAC efficacy. In addition, a recent prospective study (15) compared the size of tumors evaluated by mammography, ultrasound, and tomosynthesis after NAC, and reported the sensitivity, specificity, positive predictive value (PPV), and negative predictive value (NPV) of mammography as 0.65, 0.81, 0.52, and 0.88, respectively. The agreement rate between mammography and pathological assessment in pCR was only 43%. Thus, although mammography is highly specific in detecting tumors, it misestimates the tumor size in about half of patients.
Although mammography can describe malignant calcification well, microcalcification is not reliable evidence of the persistence of residual tumors. A previous study (16) shows that residual microcalcification after NAC is not always related to a residual tumor burden. Residual microcalcification can represent both the residual tumor and necrotic tumor cell products after treatment. When calcification persists after NAC, compared with mammography, the size on MRI is more consistent with the pathological results (17). Feliciano et al. (18) suggested that, although not all residual microcalcification on mammography after NAC reflect residual tumor and 44.8% of residual microcalcification is unrelated to the residual tumor, all microcalcification in the tumor should be completely excised.
In conclusion, mammography has certain limitations in assessing the efficacy of NAC in breast cancer: 1) it is unable to accurately determine the changes of multicenter breast cancer lesions; 2) it has X-ray radiation and cannot be used to examine frequently; 3) it is not suitable for the identification of tumor residue, fibrosis, and scar tissue after NAC; and 4) residual microcalcification after NAC is often overestimated. Therefore, The American College of Radiology recommended mammography, ultrasound, and MRI as the highest grade (grade 9) at baseline (pre-NAC), while MRI was still recommended at grade 9 during and after treatment; however, ultrasound and mammography were reduced to grade 8 and grade 7, respectively (19).
2.2 Contrast-Enhanced Spectral Mammography (CESM)
CESM, an examination combined with contrast agents based on conventional mammography, is a new mammary gland imaging technique used to obtain low energy and subtraction images after post-processing them through rapid high and low energy dual exposure, after intravenous injection of contrast agents. It can show abnormal vascular proliferation in tumor tissues, thus significantly reducing the false positive and false negative rates and improves the sensitivity and accuracy of detection (20, 21).
MRI is currently the most recommended imaging for efficacy assessment during NAC. One study (22) compared the performance of CESM and MRI in evaluating the tumor response to NAC treatment at different stages and showed different consistency of CESM and MRI in measuring the size of lesions at different treatment stages. The consistency of the measurement of the lesion size before, during, and after NAC was 0.96, 0.94, and 0.76, respectively, and both of CESM and MRI were prone to underestimating the residual lesions. However, in another retrospective study, Patel et al. (23) compared the mean residual tumor size measured by CESM and MRI in 65 patients on NAC, using surgical pathology results as a reference standard. The residual lesion size measured by CESM and MRI was found to correlate well with the pathology results (r of 0.77 and 0.80, respectively), and the mean residual lesion measured on both was -1~1 cm different from the pathological results. Similarly, Barra et al. (24) also proved that CESM can be used to evaluate residual tumor size after NAC, with good correlation and consistency with pathological results. A previous prospective study involving 21 breast cancer patients (25) evaluated CESM in predicting tumor response to NAC; the specificity, sensitivity, NPV, and PPV of 91%, 40%, 80%, and 62.5%, respectively, show good efficacy of CESM in predicting tumor response after NAC. However, the sample size in this study is relatively small, and further large-sample studies are needed to confirm the reasons for the low CESM sensitivity. CESM also performed well in predicting pCR early after NAC. Xing et al. (26) retrospectively quantified the enhancement intensity of CESM in 111 patients by calculating the percentage of grey value reduction percentages (ΔCGV). The results showed statistically significant differences in ΔCGV between the pCR and non-pCR groups, indicating that ΔCGV obtained based on CESM images can be used as a quantitative indicator for early prediction of pCR after NAC.
The results of previous studies suggest that CESM can be used to assess the efficacy of NAC and has good application in predicting pCR early after NAC. Due to the shorter examination time of CESM, better patient tolerance, and lower price, CESM has a broader prospect in the evaluation of the pathological response of breast cancer to NAC. However, the technique requires multiple breast images in different positions after contrast injection; hence, its use is limited in patients with contrast agent allergies. In addition, more extensive studies are necessary to better understand the efficacy evaluation of NAC for different molecular subtypes of breast cancer, exploration of tumor regression patterns, assessment of efficacy after NAC for tumors containing calcified foci, and assessment of CESM radiomics.
3 Evaluation of the Efficacy of Ultrasound on NAC in Breast Cancer
Ultrasound is a safe, fast, reproducible, and economical imaging evaluation method. Conventional ultrasound can describe the size, morphology, and boundary of tumors. Ultrasound imaging technology can further evaluate the tumor volume, internal blood vessels, and other subtle structures, as well as the softness and hardness of the tumor (27). The China Anti-Cancer Association Breast Cancer Guidelines strongly recommend that ultrasound be used regularly to reassess the tumor’s treatment response after every two NAC cycles (28). Therefore, ultrasonography has a place in the evaluation of the efficacy of neoadjuvant therapy. Because ultrasound is reproducible, cheap, and non-invasive, it is now more widely used in China.
3.1 Ultrasound
3.1.1 Two-Dimensional Ultrasound, Color Doppler Ultrasound
Two-dimensional ultrasound can reflect the size, morphology, boundary, and other information of breast lesions and show the structure and morphology of lymph nodes well (27). However, it is greatly influenced by the operating doctor and cannot accurately distinguish between tumor and normal gland tissue. Hence, the two-dimensional ultrasound is unable to accurately monitoring the size change in response to NAC, and its specificity in assessing the NAC response is low. It is not recommended for NAC efficacy evaluation.
Tumor vascular distribution is an alternative indicator of tumor burden. In addition to evaluating tumor size and morphology, color Doppler ultrasound can also be used to evaluate tumor vascular distribution through a variety of parameters that compare tumor changes before and after chemotherapy, to assess the response to chemotherapy (Figure 3). Chemotherapeutic drugs can destroy the neovascularization of tumors through the blood circulation, thereby reducing the pressure of tumors on the surrounding tissues, and hence, the hemodynamic changes can be used as an indicator to assess the efficacy of treatment (29). A study (30) using color Doppler ultrasound measured the sizes of tumors after NAC and compared them to histopathological results. The study found that the sensitivity, specificity, PPV, and NPV were 91.7%, 38.5%, 57.9%, and 83.3%, respectively. It showed that Doppler ultrasound has high sensitivity and can accurately reflect the efficacy of NAC in breast cancer. In recent years, with the development of color Doppler ultrasound technology and the improvement of diagnostic technology, it has become one of the most widely used methods to evaluate NAC efficacy. However, when chemotherapeutic drugs act on the tumor vasculature and inflammatory changes occur in the surrounding tissues, the vasculature may become narrowed and occluded, and in this case, the measurement results will be affected. Therefore, the application of color Doppler is somewhat limited.
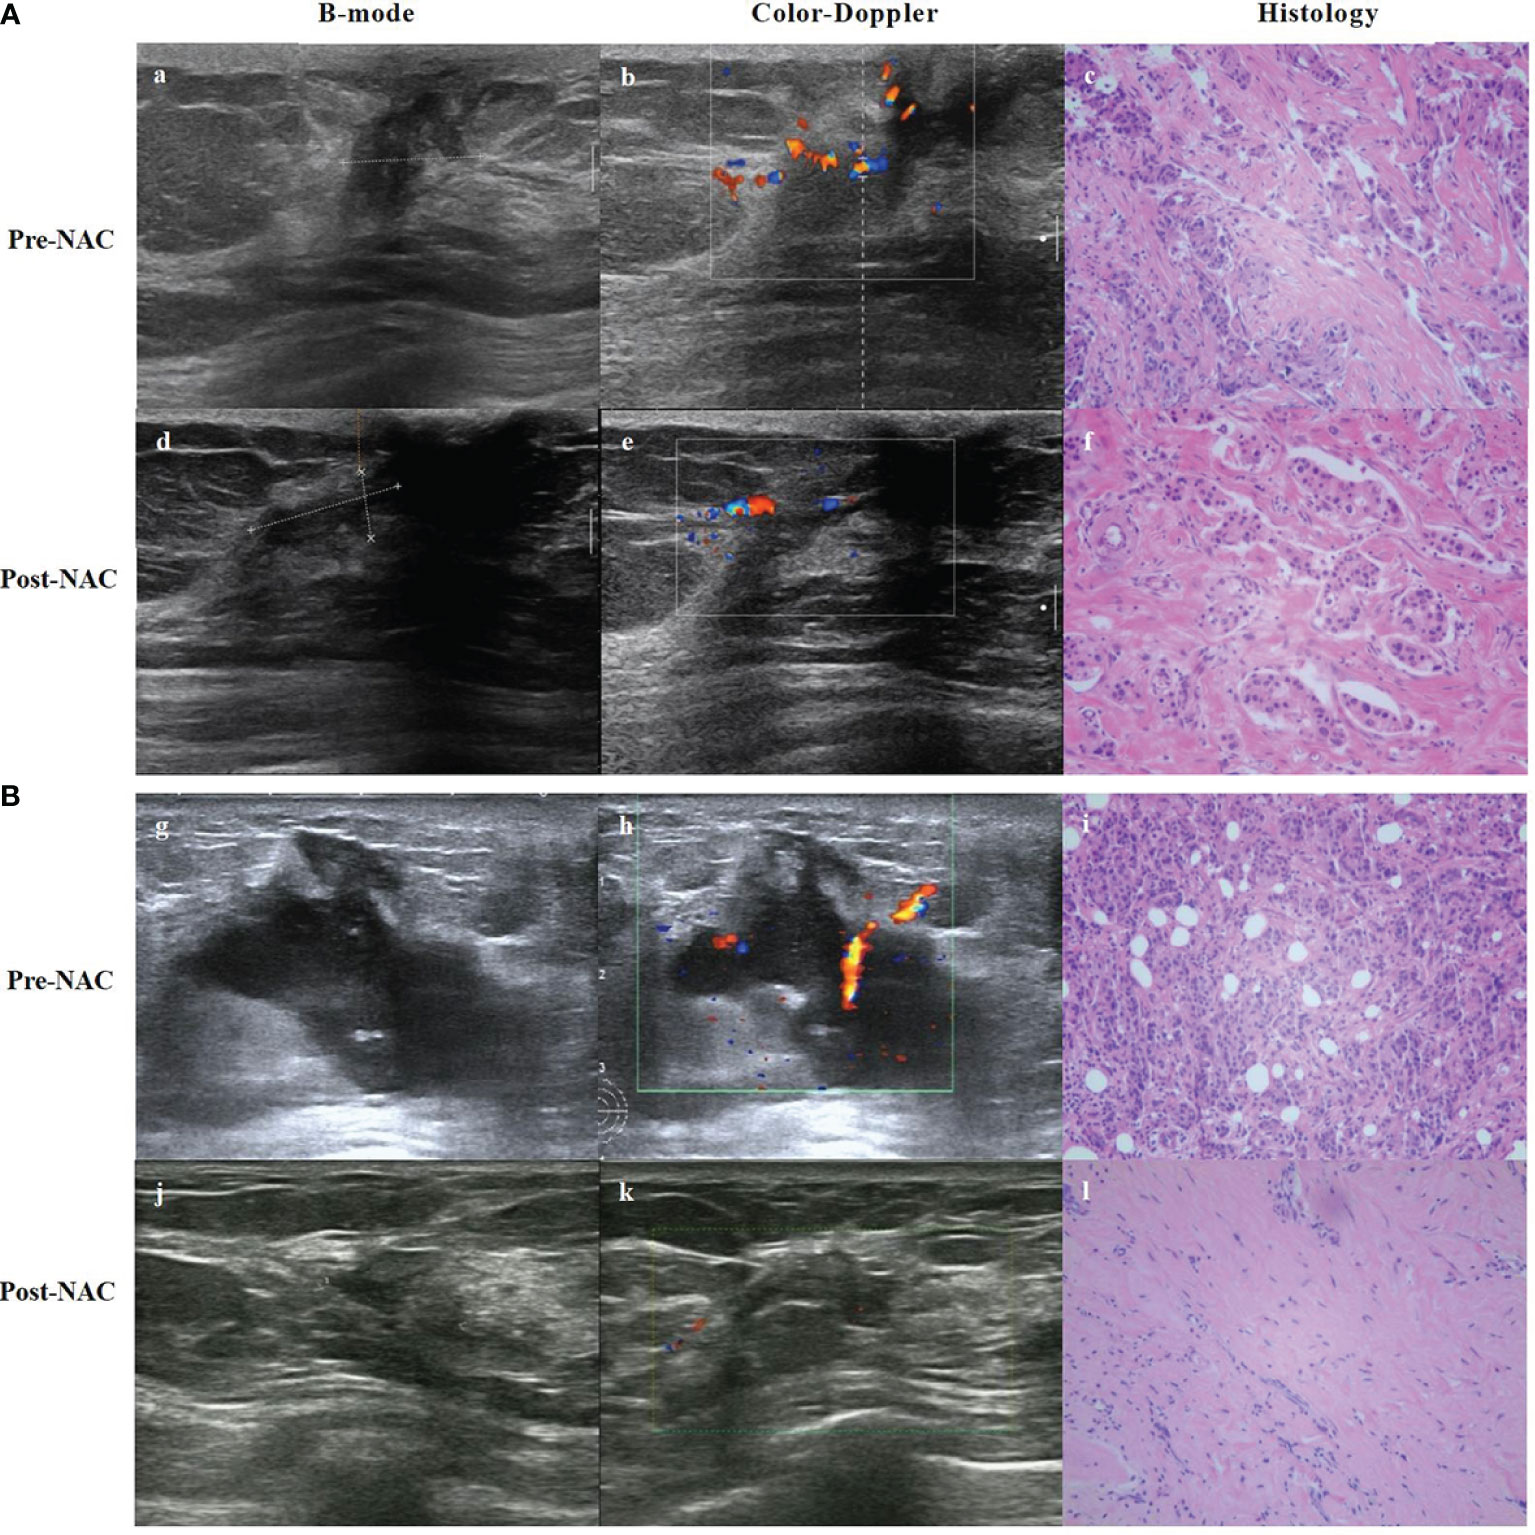
Figure 3 B-mode, Color-Doppler ultrasound and histology from a partial responder (A) and complete responder (B) before start of NAC (Pre-) and after 8 course of NAC (Post-). (A) (a) B-mode ultrasound: the tumor was hypoechoic. (b) Color-Doppler ultrasound: moderate peripheral vascular signals. (c) Microscopic image of core-needle biopsy. After 8 course of NAC. (d) B-mode ultrasound: the echogenicity increased. (e) Color-Doppler ultrasound: less residual vascularization compared to baseline. (f) Microscopic image after NAC shows residual tumor cells, but reduced compared to baseline. (B) (g) B-mode ultrasound: the tumor was hypoechoic. (h) Color-Doppler ultrasound: moderate intralesional and perilesional vascularization. (i) Microscopic image of core-needle biopsy. After 8 course of NAC. (j) B-mode ultrasound: the echogenicity increased and tumor volume decreased. (k) Color-Doppler ultrasound: almost no vascular spots. (l) Microscopic image after NAC presents visible stromal tissue, no visible tumor cells.
3.1.2 Contrast-Enhanced Ultrasound Technology (CEUS)
CEUS, a purely blood pool imaging technique, detects micro-vessels to show the neovascularization of breast tumors and the perfusion pattern of blood flow, to obtain contrast-enhanced images. It shows the morphology and distribution of lesions and blood vessels clearly (29). CEUS can be used to evaluate the mode of lesion enhancement, and to quantitatively evaluate some indicators by generating time-intensity curves, such as rise time, mean passage time, time to peak, peak intensity, and area under the curve (AUC). Although it is most intuitive and straight forward to assess the efficacy of breast cancer after NAC by measuring changes in the size of the lesions, there are limits in measurements, using this method; this is because of the operator’s subjective assessment and because the masses do not all show centripetal retractions after NAC. Thus, the relative change rate of the size of contrast parameters is of important clinical significance.
Changes in tumor blood vessels after NAC precede morphological changes, so the difference in blood perfusion is critical for NAC efficacy evaluation (29). Especially for localized liquefaction necrosis of the tumor, CEUS has a higher accuracy in assessing the mass size compared to a two-dimensional ultrasound. A study (31) has shown that CEUS can be used to assess the clinical response of tumors to NAC, and the sensitivity and specificity of predicting pCR after NAC were 95.7% and 77.5%, respectively. Other studies concluded that CEUS is similar to MRI in predicting pCR and has a higher correlation with pathological examination in evaluating the size of residual lesions, even higher than that of MRI (32, 33). Huang et al. (34) also identified CEUS as a potential tool for predicting NAC response in locally advanced breast cancer patients. Compared with other molecular subtypes, triple-negative and HER2+/ER- subtypes responded better to NAC. Notably, breast cancer is highly heterogeneous, and the same NAC regimen may produce different responses for different molecular subtypes. Therefore, it is urgent to study the correlation between clinical/biological indicators and CEUS parameters.
In summary, CEUS, as a cutting-edge research field, has good clinical application in assessing the efficacy of NAC for breast cancer patients who cannot undergo dynamic contrast-enhanced MRI (DCE-MRI) or require multiple evaluations; it can measure the maximum diameter of lesions after NAC more accurately than conventional ultrasound and is in good agreement with histopathological results. However, large sample multi-center studies are needed to further explore more sensitive indicators of NAC response. The limitation of CEUS in clinical practice is the poor visualization of multiple lesions and large lesions beyond the imaging range.
3.1.3 Automated Breast Volume Scanner (ABVS)
ABVS uses the advantages of multi-plane remodeling to create a three-dimensional ultrasound imaging of the breast tissue. It can better reflect the growth mode of breast tumors and the relationship with the surrounding tissues through automatic, full-volume, and coronal scanning of the breast (35). Since it is automatically scanned and digitally stored, it relies less on physician operations compared to traditional ultrasound, and the examined images can be reviewed (36). Using the ABVS, multiple masses can also be examined at once and shown in the same view, overcoming the limitations of conventional ultrasound (35). At present, the superiority of ABVS in identifying benign and malignant breast tumors has been recognized (37). Further studies explored its utility in predicting the efficacy of patients with NAC to provide a better basis for further clinical diagnosis and treatment.
A Chinese study (38) first explored the use of ABVS to predict pathological outcomes after four cycles of NAC by assessing the proportional changes in primary tumors measured after two NAC cycles. The results suggest ABVS as a valuable tool for the early assessment of pCR after NAC. However, it is less reliable in predicting adverse pathological outcomes (Miller-Payne grades 1 to 3). Another study (39) compared the efficacy of ABVS and MRI in assessing tumor response; the two had a reasonable correlation for differences in the longest tumor diameter measurements (CCC 0.73). Regardless, ABVS has higher patient satisfaction, indicating it can effectively be used to monitor patients during NAC. However, Park et al. (40) compared the accuracy of mammography, digital breast tomography (DBT), ABVS, and MRI in assessing the degree of tumor residual after NAC. The results showed that ABVS had the lowest reliability in predicting residual tumor size and pCR and tended to underestimate residual tumors. This suggests that ABVS may not be sensitive enough to distinguish chemotherapy-induced fibrosis and hypoechoic tumors after NAC. The differences in the above trial results may be due to tumor heterogeneity, variability of pathological size assessment, or differences in study design; moreover, retrospective studies may lead to bias due to incomplete data. Therefore, we must interpret these results rationally. More prospective studies and larger case series are required to explore ABVS in assessing the efficacy of tumor NAC.
3.2 Ultrasound Elastography
The tumor tissue changes complicatedly during the treatment, including cell degeneration, necrosis, liquefaction, slow proliferation rate, tissue fibrosis, and focal tissue hardness. Pathological biopsy after NAC showed that patients with ineffective (or effective) treatment had higher (or lower) cancer cell density, resulting in changes in the elastic coefficient before and after NAC. Therefore, ultrasound elastography can be used to evaluate the efficacy of NAC (41). In recent years, ultrasound elastography has been widely used in the evaluation of NAC, while strain elastography (SE) and shear wave elastography (SWE) are commonly used for breast cancer. SE enables qualitative and quantitative analyses of tissue softness and hardness to evaluate NAC efficacy, by comparing the elastic score and strain rate ratio before and after NAC. SWE reflects the efficacy of NAC for breast cancer by measuring the value of tissue elasticity, that is, the absolute value of Young’s modulus (42).
Studies in other countries (43, 44) found that the sensitivity and specificity of assessing tumor changes by SE after two treatment cycles were 83.3% – 84% and 80% – 85%, respectively. It is shown that SE can predict the NAC response of locally advanced breast cancer within two weeks of treatment with high sensitivity and specificity. Furthermore, the elastic changes in the tumor response to NAC can be used as an early response marker in the treatment process. A prospective study by Jing et al. (45) used SWE for the first time to predict the response of breast cancer patients to NAC. The relative change of tumor stiffness after two NAC cycles was significantly associated with the pathological response of postoperative specimens, with sensitivity and specificity of 72.9% and 85.7%, respectively. This indicates that the change in tumor stiffness is a handy predictive parameter for judging the efficacy of NAC for breast cancer; thus, SWE can be used as an effective method to guide NAC. Lee et al. (46) confirmed that the diagnostic efficacy of ultrasound combined with SWE for NAC was almost similar to that of MRI (P>0.05), and the elastic value of the residual tumor tissue after NAC was up to a maximum of 116 ± 74.1 kPa, which is much higher than that of non-residual tumor tissue (26.4 ± 21.0 kPa). Ma et al. (42) compared the diagnostic performance of SE and SWE in predicting the NAC response in breast cancer; the results showed similar diagnostic performance in the early prediction of NAC response. Regardless, SWE is superior to SE in the early prediction of NAC resistance. Ultrasound elastography also has certain value in predicting pCR of tumors. A comparative study comparing SWE and MRI (47) showed that the ability of pCR prediction (when the reduction in the average lesion hardness was combined with tumor diameter on conventional ultrasound) was close to that of MRI, with AUC of 0.92 and 0.96, respectively. However, there is a need for further studies on the combination of elastography and other evaluation methods, and its detection efficiency in tumors of different phenotypes (48). Although elastography technology has high diagnostic efficiency in assessing the efficacy of NAC, there are no reports of changes in breast cancer treatment strategies based on elastography evaluation results.
One study showed breast thickness and lesion depth as important factors affecting the quality of elastography images (41). In addition, the uneven internal hardness (caused by the liquefaction and necrosis of the mass) and higher hardness (caused by fibrosis or hyaline degeneration) of the original lesions after NAC can affect the measurement results. The operator’s experience and knowledge also have a significant influence on the measurement results. Sufficient compression and precise positioning of the tumor region must be ensured (44). Therefore, the application has some limitations, and further improvements are needed in the future. In addition, results from the evaluation of elastography compared to other imaging modalities are lacking.
3.3 Quantitative Ultrasound (QUS) and Diffused Optical Tomography With Ultrasound (OPTI-MUS)
QUS utilizes changes in the acoustic properties of tissues to reflect changes in their microstructure. It works by scanning the breast tumors using a clinical ultrasound system; then, the ultrasound radio frequency (RF) data within the tumor regions of interest were retained and displayed as a frequency spectrum using a fast Fourier transform (FFT). The analysis of the power spectrum leads to various features like spectral slope (SS), spectral intercept (SI) at 0 MHz, mid-band fit (MBF), average scatterer diameter (ASD), average acoustic concentration (AAC), attenuation coefficient estimate (ACE), and spacing among scatterers (SAS) (49). Its parameters reflect both the elastic and microstructural properties of the tissue. Its simple operation, low cost, and non-requirement of an exogenous contrast agent gave the technique partial attention. In a preliminary clinical study (50), two parameters of QUS were used to determine the pathological response of patients with locally advanced breast cancer after NAC treatment. The sensitivity and specificity in the first and fourth cycles were 77% vs. 86%, and 83% vs. 100%, respectively. Thus, it can be used for early detection of tumor response to NAC. Sannachi et al. (49) used a combination of QUS parameters, texture, and molecular characteristics to monitor the response to NAC treatment. In the first, fourth, and eighth week after treatment, the accuracy of this combination for predicting treatment response was 78%, 86%, and 83%, respectively. However, the accuracy of QUS parameter prediction, only, at these three-time points is less than 60%. There are few studies on QUS predicting breast tumor response after NAC treatment, and the existing research are insufficient. Based on current preliminary studies on the objective results, more extensive prospective studies are necessary to clarify the evaluation effectiveness of QUS in NAC.
OPTI-MUS is a new imaging technology that combines conventional ultrasound and diffused optical tomography through specific technological means. Diffused optical tomography uses the diffuse scattering effect of tissue on the multi-wavelength laser to complete the three-dimensional imaging of tissue physiological information. Measuring the total hemoglobin (HBT), deoxyhemoglobin (HBO2), and other parameters in each section of the tumor region indirectly reflects the tumor angiogenesis activity to evaluate the efficacy of NAC at the molecular level (51). OPTI-MUS is associated with NAC response (52–54). Tran et al. (55) obtained ultrasound and OPTI-MUS data related to the start of NAC at 0, 1, 4, and 8 weeks, and before surgery, respectively. The results showed that individual QUS and OPTI-MUS parameters, including the SI, HBO2, and HBT were significant markers for response after one week of treatment (p < 0.01). Multivariate combinations increased the sensitivity, specificity, and AUC. QUS and OPTI-MUS are both non-invasive and relatively economical, rapid examinations. However, challenges, such as errors in the diagnosis of small and superficial tumors, persist; thus, its application in monitoring the efficacy of NAC in combination with other imaging examinations should be further researched.
4 Evaluation of the Efficacy of MRI on NAC in Breast Cancer
There are various diagnostic modalities to assess the efficacy of breast cancer after NAC. Although many studies have tried to determine the best imaging method in evaluating the efficacy of NAC, no consensus has been reached. To date, MRI is the most used accurate imaging method to assess the extent of tumor residual after NAC (56). Moreover, breast MRI multiparametric imaging can quantify and visualize multiple functional processes simultaneously at the cellular and molecular levels. This clarifies the therapeutic response of breast cancer and assesses the response efficacy of NAC earlier, for timely clinical adjustment of treatment regimens.
4.1 The Conventional MRI
MRI has high soft-tissue resolution and can effectively distinguish residual tumors from post-chemotherapy fibrotic or necrotic tissue. The therapeutic effect can be judged mainly by morphology and by measuring the change in the maximum diameter of the lesion. Therefore, to some extent, MRI can reflect the actual size of the mass. The length and diameter measurements were also based on RECIST 1.1 efficacy assessment criteria, and tumor responses were classified as either responsive (CR and PR) or non-responsive (SD and PD). The presence or absence of residual lesions after NAC of breast cancer, accurate size measurement, and accurate pCR prediction directly affect the adjustment of treatment plan and the choice of surgical approach in clinical practice. Compared with mammography, ultrasound, or clinical palpation, lesion size measured by MRI has a higher correlation with pathological examination. A prospective ultrasound trial (57) enrolled 174 patients with invasive breast cancer who were treated with NAC. Preoperative measurements of all lesions were assessed by mammography, clinical examination, and MRI, to detect the correlation between the accuracy of pathologic CR and final pathologic size. Ultimately, they found that clinical examination often underestimated residual tumor size. In contrast, mammography tended to overestimate, and MRI appeared to reflect the size of residual lesions more accurately, consistent with previous results. Therefore, MRI is still the most accurate method to measure the maximum diameter of NAC when considering the efficacy assessment after NAC only. The accuracy of MRI measurement of residual lesions in different molecular subtypes of breast cancer is, in that order, best in triple negative and HER2 over-expression (58, 59), while underestimation of lesions is common in the Luminal type (58–60). The PPV and NPV for predicting pCR were both highest in triple-negative breast cancers, while PPV in HER2 over-expressed breast cancers was second only to triple-negative breast cancers.
Post-NAC MRI shows two main types of tumor shrinkage: concentric and nested or dendritic shrinkage (61). It can accurately evaluate concentric shrinkage, but the conventional MRI has limited value in assessing tumors with nested or dendritic shrinkage. It is split into many small pieces and pathologically shows multicentric and discontinuous residual tumors (62).
4.2 Dynamic Contrast-Enhanced MRI (DCE-MRI)
DCE-MRI is highly sensitive to changes in tumor presence and angiogenesis. It is most used for semi-quantitative analysis parameters to assess NAC efficacy in breast cancer, including the early intensification rate, time to peak, maximum intensification rate, and apparent diffusion coefficient, reflecting tissue vascular density and vascular permeability. It has further been demonstrated that some quantitative parameters, such as volume transfer constant (Ktrans), rate constant (Kep), and extracellular space volume ratio (Ve), can be used for early prediction of breast cancer response to NAC (35). DCE-MRI curve changes can also be used to evaluate the efficacy of NAC for breast cancer. Generally, time-signal intensity curve (TIC) morphology is divided into type I (slow and continuous enhancement type); II (platform type); and III (clearance type). When the curve shape changes from low to high grade (e.g. from type II to III) after treatment, it indicates that the tumor is more aggressive and chemotherapy is ineffective. On the contrary, when it decreases, it suggests that the treatment is effective. However, at present, there is no unified standard for the quantitative index and threshold value of using DCE-MRI to assess the efficacy of NAC.
The correlation between pathological tumor diameter after NAC and DCE-MRI tumor diameter was reported to be closer than that of palpation or ultrasound (63). Furthermore, tumors with nested or dendritic shrinkage after NAC can be evaluated for efficacy with DCE-MRI or quantitative diffusion-weighted MRI (DWI-MRI) (64, 65). A meta-analysis (66) that included 18 studies (969 breast cancer patients) showed that DCE-MRI has a combined sensitivity and specificity of 0.80 and 0.84, respectively. DCE-MRI has a higher sensitivity for early prediction of response to breast cancer, compared with assessment of tumor response after NAC completion. It is an effective method for the dynamic monitoring of NAC efficacy and can also predict the pCR response of breast cancer after NAC. DCE-MRI was recommended to evaluate the efficacy of NAC in the RECIST guidelines (35). Other studies (67, 68) showed that semi-quantitative and quantitative analyses based on DCE-MRI had certain value in early prediction of NAC efficacy. In a study on quantitative DCE-MRI assessment of NAC efficacy for breast cancer, Li et al. (69) noted that the changes in quantitative parameters, Ktrans and Kep, which reflect blood perfusion and infiltration, showed statistically significant differences between the pCR and non-pCR groups after two cycles of NAC; with subsequent similar conclusions in another study (70). In the early stages of NAC, the diagnostic efficacy of combining semi-quantitative and quantitative DCE-MRI parameters may be higher. Changes in the maximum tumor diameter in the advanced enhancement stage of DCE-MRI can be used to better evaluate the tumor’s sensitivity to chemotherapy drugs. When the maximum tumor diameter is reduced by < 25%, there is a high possibility of malignant tissue residual, while in patients with pCR monitored by DCE-MRI, the tumor diameter is reduced by > 45% (71). Therefore, during NAC treatment, changes in tumor diameter and Ktrans and Kep parameters in DCE-MRI images, can be used as imaging indicators to evaluate the degree of tumor remission, thus providing more useful information for the formulating surgical plans. Fukuda et al. (72) evaluated the extent of tumor remission in DCE-MRI after NAC by imaging and performed a consistency test between imaging diagnosis results and pathological findings. They reported an accuracy of up to 88.7%, with a higher accuracy of 93.2% and 90.9% for Luminal and triple negative breast cancer, respectively, and a lower accuracy of HER2 over-expression breast cancer.
Obviously, according to current data, pCR prediction by imaging does not yet meet clinical expectations, and patients are still not exempt from surgery by virtue of a negative DCE-MRI result. However, MRI is still the most accurate method to evaluate residual tumor and predict pCR among all imaging evaluation methods. Limitations in the use of DCE-MRI are the lack of standardization of the DCE protocol and the possible overestimation due to necrosis, inflammation, fibrosis, or scar tissue caused by chemotherapy. At the same time, the antivascular effect of certain chemotherapeutic drugs and the presence of ductal carcinoma in situ (DCIS) may be underestimated due to poor imaging (31). Factors such as high cost, use of contrast agents, and selectivity for patients further limit its use (73).
4.3 Diffusion-Weighted Imaging (DWI)
Although DCE-MRI is currently a reliable technique for assessing NAC response, there are still difficulties in using it to predict postoperative pCR (74). DWI is used to evaluate NAC efficacy by probing the diffusion capacity of water molecules in living tissues, i.e., measuring apparent diffusion coefficient (ADC) values and performing quantitative analysis. It is, thus sensitive to cell density, membrane integrity, and tissue microstructure (75). Therefore, DWI may provide complementary information for predicting chemotherapy response.
An increasing ADC values in the early stages of NAC in breast cancer is an important indicator to assess the final chemotherapy outcome of the tumor. After the second cycle of NAC, ADC values showed statistically significant differences between the pCR and non-pCR groups (76). According to Iwasa (77), the increasing tumor ADC values at the end of the first cycle of NAC was also closely related to the final pathological remission tumor degree, with an AUC of receiver operating characteristic (ROC) for predicting pCR of 0.9. It is suggested that DWI can be used to evaluate the efficacy after the first cycle of treatment, which may prolong the time to adjust clinical protocols. In 2018, a prospective multicenter trial in the ultrasound (75) recruited 138 breast cancer patients to determine whether changes in ADC could predict pCR after NAC. It reported that parameters of DWI were more predictive of post-NAC pCR after 12 weeks of treatment, relative to the baseline characteristics [AUC:0.72, 95% CI:0.61-0.83]. The same conclusion was reached in another study (78).
Changes in ADC values correlate with the molecular subtypes of breast cancer. Further studies by Richard (79) and Bufi (80) on different molecular subtypes of breast cancer suggest that ADC value could be used as a predictor of efficacy before NAC in triple-negative type and over-expressed HER2 type breast cancer. However, in Luminal type breast cancer, there was no significant difference in tumor ADC value before NAC among different pathological response groups. Liu et al. (81) analyzed the ADC values of 176 patients with different molecular subtypes of breast cancer before and after NAC, and found that only the triple-negative breast cancer had significant difference in ADC values between the pCR and non-pCR groups before NAC; whereas, other molecular subtypes had no significant difference. There were significant differences in ADC values between pCR and non-pCR groups in each subtype of breast cancer after NAC. This conclusion indicates that due to the existence of multiple subtypes of breast cancer, the final efficacy evaluated by ADC value before NAC is limited to triple negative breast cancer and HER2 over-expressed breast cancer (82).
Although studies have shown that DWI can predict NAC response, its limitations include high sensitivity to movement, and thus, it is subject to motion artifacts due to respiratory and cardiac motions, poor spatial resolution, and difficulty in assessing certain breast cancer subtypes, such as invasive lobular carcinoma (83). Therefore, in the evaluation of residual tumors, it should not just be used as a single indicator to assess whether the tumor has achieved CR, if possible; but to combine multiple indicators such as tumor diameter reduction and increasing ADC value, for a comprehensive assessment of the tumor.
4.3.1 Intravoxel Incoherent Motion Imaging (IVIM)
IVIM is a new DWI-based technique that separates the micro-perfusion effect of capillaries in tissues from the diffusion effect of water molecules to obtain the diffusion coefficient of water molecules alone (D), the pseudo-diffusion coefficient due to microcirculatory diffusion (D*), and the perfusion fraction (f), which may have a good potential for predicting NAC effects. Several studies have confirmed the potential value of the IVIM model in monitoring chemotherapy response in a variety of malignancies, such as liver cancer (84), head and neck tumors (85), and nasopharyngeal carcinoma (86); however, its studies on the efficacy of NAC in breast cancer are less available. Studies (87, 88) concluded that the parameters of IVIM had a good predictive performance for the pathological response. They observed that patients with higher baseline f values, higher on-treatment D values, and lower on-treatment f values responded better to NAC. Patients in the pCR group showed more significant changes in D and f values than in the non-pCR group. Changes in D values after two cycles of NAC treatment had a good predictive performance for differentiating between pCR and non-pCR. Another study (89) found no significant changes in D* and f values before and after NAC and concluded that they did not predict tumor response. In conclusion, more studies are needed to explore IVIM in assessing the response to NAC. In addition, molecular subtypes of breast cancer are associated with different IVIM parameters. Kim et al. (90) found that low tissue diffusion was primarily detected in tumors with high Ki-67 and Luminal B.
IVIM model has the possibility of increasing ADC value to predict NAC efficacy. However, few studies exist on the application of IVIM model in the efficacy evaluation and prediction of NAC in breast cancer, and further research and confirmation are still needed. IVIM parameters are affected by many factors including respiration collection method, fitting method, and tumor heterogeneity (91–93), resulting in poor repeatability.
4.3.2 Diffusion Tensor Imaging (DTI)
DTI is considered an extension of DWI, which characterizes water motion by measuring it in six or more directions. DTI quantifies two parameters: mean diffusion coefficient (MD) and fractional anisotropy (FA). MD is an estimate of mean anisotropy, and FA reflects the degree of anisotropy (94). Although the early percentage change in tumor FA correlated weakly with pCR, the significant correlation with pathologic tumor volume suggests that this metric warrants further evaluation (95). Furman et al. (96) demonstrated the ability of DTI to monitor breast cancer response to NAC. It found that DTI monitors changes in diffusion tensor parameters during NAC with similar efficiency to DCE; the final pathological assessment had good agreement. Moreover, DTI provided an accurate percentage change in size when measuring changes in tumor volume rather than estimating within a wide range. Currently, DCE is the primary MRI method for assessing breast cancer response to NAC. However, DTI has significant advantages over DCE, such as no contrast injection and relatively short examination duration. Since DCE and DTI have similar capabilities in quantitatively assessing tumor size changes and residual tumor size (95), further large-scale studies of DTI should be performed to verify whether it can be used specifically for monitoring and evaluating the response to NAC.
4.3.3 Diffusion Kurtosis Imaging (DKI)
DKI is a new MRI method to depict the diffusion of non-Gaussian water molecules in tissues. DWI is based on the assumption of the homogeneity of the microenvironment, and considers that the diffusion distribution of water molecules obeys Gaussian distribution (97). In fact, in living tissue, DWI is influenced by Brownian incoherent motion, microperfusion, and blood flow in a non-Gaussian model (98). DKI measured the tissue diffusion deviation from the Gaussian model. The ADC value corrected by the non-Gaussian distribution is called the average diffusion rate (MD). The smaller the MD value is, the more limited the diffusion motion of water molecules (94). DKI makes up for the deficiency regarding that DWI and DTI techniques cannot show the actual diffusion degree of water molecules (DKI affects the decay at high b-values). In recent years, DKI has been preliminarily applied to evaluate the efficacy of NAC in cancers [including rectal cancer (99), nasopharyngeal cancer (100), and bladder cancer (101)]. The limitation lies in the fact that the parameters are not as accurate as those of IVIM model, including the inability to distinguish between the non-Gaussian increase due to limited dispersion and multi-component confounding. Currently, there are few studies on the application of DKI parameters in the evaluation of NAC response for breast cancer. Still, preliminary results show that compared with DWI, DKI has significantly higher sensitivity and specificity in the assessment of breast cancer diagnosis and NAC efficacy (94).
4.4 Proton Magnetic Resonance Spectroscopy (1H-MRS)
The levels of choline (Cho) and its metabolites reflect the level of cellular metabolism, which is mainly involved in cell membrane transport and diffusion functions. As an active metabolite, the concentration of free Cho in normal tissues is low, and the increase in Cho level reflects an increase in cell membrane synthesis or cell proliferation. Cho peaks are significantly elevated in malignant regions, so Cho complexes are usually considered as markers of malignancy (102). 1H-MRS is used to assess the therapeutic effect of total choline (tCho) in malignant tumors by measuring the changes in its concentration. After effective treatment with NAC, tumor cells are damaged and their density decreases, thus the tCho peak on the MRS spectrum subsequently reduces.
In an earlier study, Jagannathan et al. (103) demonstrated that 1H-MRS helped in assessing the response of breast cancer to NAC. However, they used qualitative observations rather than the quantitative determination of tCho concentration to monitor tumor changes. Subsequently, several studies (104, 105) have determined the reduction in choline signal after one cycle of chemotherapy to be more sensitive than DWI-MRI in predicting pathological response. According to Bolan et al. (106), significant total choline concentration reductions were found as early as 24 hours after the initiation of chemotherapy. Furthermore, changes in tCho signal measured by MRS may provide an early indicator of treatment response than changes in size.
Due to the objective technical difficulties of 1H-MRS, it is currently less used. The main limitations are: 1) the low choline detection rate currently observed; 2) as the lesions shrink, less tumor tissue can be measured, especially since small lesions less than 1 cm are difficult to quantify in tCho; and 3) the relatively low sensitivity of 1H-MRS compared to MRI (107, 108).
Because of the limitations of various MRI methods and because some studies are still at the initial stages, for now, the conventional MRI, DCE-MRI, and DWI can provide more objective and comprehensive clinical information. The perfusion and diffusion MRI, which reflect the functional and molecular levels, could become important methods of imaging assessment in the future because of their quantifiable evaluation, and have also been gradually used in clinical practice (Figure 4). It is worth mentioning that most of the existing studies have not carefully staged breast cancer, which is why some of their results show discrepancies, especially regarding the assessment of the efficacy of the early stages of NAC. It is known that different subtypes of breast cancer respond differently to NAC; therefore, the results may be different if different proportions of patients with different molecular typing are included.
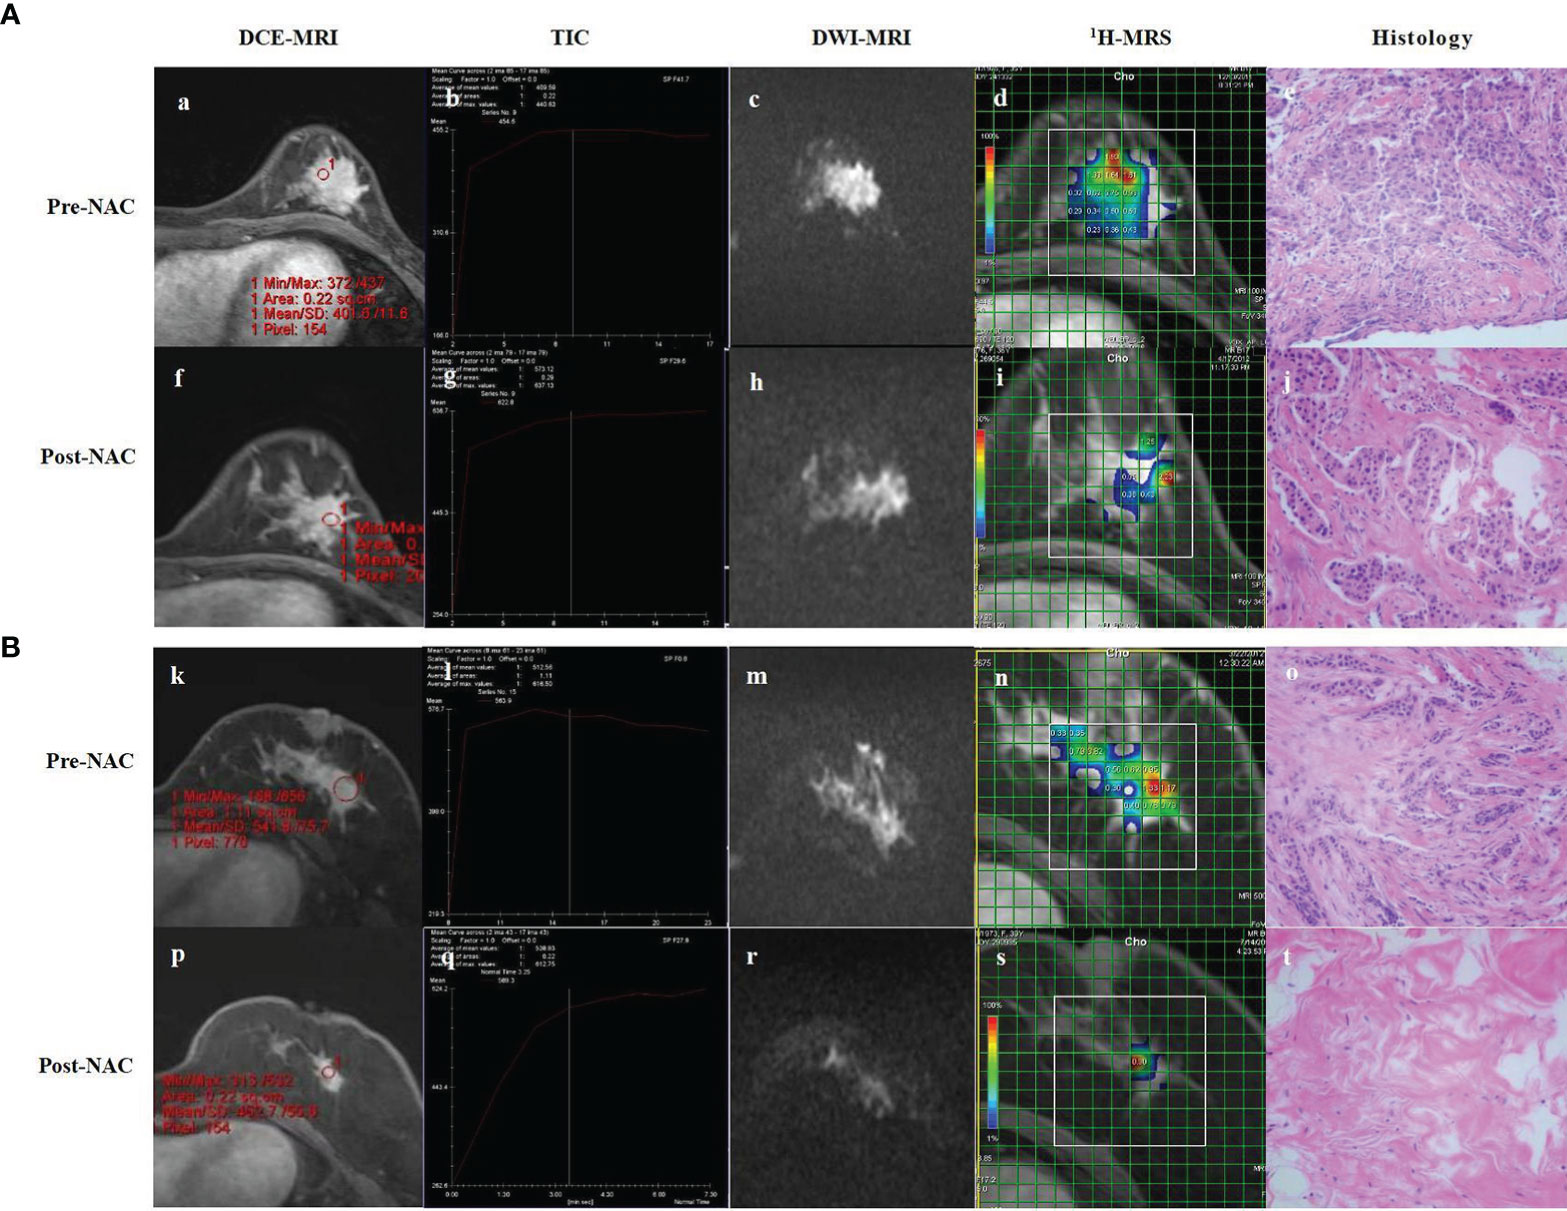
Figure 4 DCE-MRI, TIC, DWI-MRI, 1H-MRS and histology of partial responder (A) and complete responder (B) before start of NAC (Pre-NAC) and after 8 course of NAC (Post-NAC). (A) (a) DCE-MRI: the tumor was marked enhancement and irregular margins. (b) TIC : Fast Inflow - Platform Type. (c) DWI-MRI: the ADC value was 0.73 x 10⁻³ mm2/s. (d) 1H-MRS: high Cho levels. (e) Microscopic image of core-needle biopsy. After 8 course of NAC. (f) DCE-MRI: the mass shows a concentric shrinkage pattern. It is suggestive of partial response. (g) TIC : Fast Inflow - Platform Type. (h) DWI-MRI: the ADC value was 0.96 x 10⁻³ mm2/s. (i) 1H-MRS: lower Cho levels compared to baseline. (j) Microscopic image after NAC shows residual tumor cells, but reduced compared to baseline. (B) (k) DCE-MRI: the tumor was marked enhancement and irregular margins. (l) TIC : Fast Inflow - Platform Type. (m) DCE-MRI: The ADC value was 0.83 x 10⁻³ mm2/s. (n) 1H-MRS: high Cho levels. (o) Microscopic image of core-needle biopsy. After 8 course of NAC. (p) DCE-MRI: significant reduction of the mass compared to baseline. (q) TIC : Rapid Inflow - Inflow Type. (r) DCE-MRI: the ADC value was 1.39 x 10⁻³ mm2/s. (s) 1H-MRS: significant shrinkage of the tumor and a significant decrease of Cho levels. (t) Microscopic image after NAC shows lymphocyte and stromal tissue, no visible tumor cells. DCE-MRI, dynamic contrast-enhanced MRI; TIC, time-signal intensity curve; DWI-MRI¸ quantitative diffusion-weighted imaging MRI; 1H-MRS, 1H-magnetic resonance spectroscopy; NAC, neoadjuvant chemotherapy; ADC, apparent diffusion coefficient; Cho, choline.
5 Evaluation of the Effect of PET-CT on NAC in Breast Cancer
Malignant tumors can show a high uptake of tracers because of their relatively high metabolic rate. PET-CT mainly reflects the metabolism of tissues and organs based on tracers, and reflects the changes of tumor physiological functions before and after NAC at the molecular level, which can overcome the limitations of anatomical imaging, such as MRI (109). Its effectiveness in assessing the effect of chemotherapy in breast cancer patients has been reported. Liu et al. (110) conducted a meta-analysis of six original articles (382 cases). They showed the combined sensitivity and specificity of PET-CT of 86% and 72%, respectively. Furthermore, those of MRI were 65% and 88%, respectively, suggesting that PET-CT has a higher sensitivity and lower specificity in evaluating the efficacy of NAC for breast cancer. Another meta-analysis involving 13 original studies (111) similarly compared MRI and PET-CT performance in predicting NAC efficacy, showing a combined PET-CT sensitivity and specificity of 77% and 78%, and that of MRI of 77% and 78%, respectively. This study concluded that MRI was more sensitive, and PET-CT more specific; completely contrary to the findings of previous studies. Another large sample meta-analysis that compared the performance of MRI and PET-CT in predicting the efficacy of NAC found that the timing of examination had an impact on the accuracy of both assessments. The diagnostic specificity of PET-CT was higher than that of MRI during NAC (69% vs. 42%), while the MRI sensitivity was higher after NAC (88% vs. 57%), suggesting that MRI could better assess residual tumor after treatment, while PET-CT could better assess the response during treatment (112).
The most used determination method for PET-CT is the measurement of the maximum standardized uptake value (SUVmax), which serves the purpose of early monitoring and assessment of NAC by comparing SUVmax changes before and after chemotherapy. A study added its contribution to the early screening of chemotherapy non-responders, based on a 45% decrease in SUV after the first cycle as a threshold, and a treatment non-responsive NPV of approximately 90% (113). Studies (114, 115) showed significantly correlated SUVmax of tumors with their pCR results after NAC, suggesting SUVmax as a valuable prognostic indicator. Another study (116) showed that for HER2 over-expressed breast cancer, SUVmax at the second cycle of NAC is the best indicator to evaluate efficacy. There is growing evidence that the use of PET-CT to assess metabolic response has prognostic effect on breast cancer patients treated with NAC.
PET-CT is helpful for tumor diagnosis and prognosis assessment. It has high accuracy and can be used in the early evaluation of NAC efficacy in breast cancer. Still, the specificity of PET-CT in the efficacy assessment of NAC is low; NAC is a continuous process that requires multiple tests, and the cost of PET-CT and the use of radionuclides limits its clinical application. Therefore, PET-CT has no absolute advantages over MRI. Consequently, it is not used much in clinical practice to evaluate the efficacy of NAC.
6 Evaluation of the Effect of NAC in Breast Cancer by Radiomics
The concept of radiomics was first proposed by one American scholar (117) in 2010 and further improved by Dutch scholar (118) in 2012. It refers to the high-throughput extraction of a large amount of information from images (CT, MRI, PET-CT, etc.) to achieve tumor segmentation, feature extraction, and model establishment; to carry out deeper mining, prediction, and analysis; and to assist imaging physicians to make the most accurate diagnosis. Currently, radiomics based on different imaging technologies such as ultrasound, mammography and MRI have been gradually applied to the differential diagnosis and prognostic analysis of breast cancer (119–121). In recent years, there have been increasing number of studies on the application of imaging omics to evaluate the efficacy of NAC for breast cancer, with several studies confirming its effectiveness. Among them, Quiaoit et al. (122) showed that imaging omics had advantages in predicting pCR after NAC for breast cancer, compared with traditional single imaging technology. Compared with single imaging assessment, imaging omics is an important emerging technology with systematic, comprehensive, and highly predictive advantages. In future, its superiority in evaluating the efficacy of NAC for breast cancer should be demonstrated.
MRI radiomics is the most commonly used technique. A recent study involving four centers (74) showed that the multi-sequence MRI model combined with T2WI, DWI, and DCE-MRI scan sequences before treatment had a higher predictive pCR ability than the single-sequence model (AUC=0.79). The predictive ability of the model for pCR in three different pathological subtypes of hormone receptor-positive, HER2 over-expressing, triple negative breast cancer, performed well in a cohort of four study centers. Another study showed a significant advantage of multivariate modeling of MRI for predicting pCR in the triple negative and HER2 positive groups before NAC (123). Radiomics combined ultrasound and PET-CT has greater potential for investigation, and recent finding showed that some radiomics features of PET and ultrasound can be considered as potential predictors of pCR (115). With the development of artificial intelligence and big data platforms, the automatic identification of breast lesions, the establishment of a multimodal intelligent and integrated diagnostic system, and the exploration of clinical mechanisms with radiomics will be gradually reflected in the clinical studies in the end.
7 Conclusion
In summary, various imaging methods are used to evaluate the efficacy of NAC for breast cancer in clinical practice. The value of some of the new imaging techniques has not been thoroughly studied; thus, it is not suitable for clinical application at present. With the emergence and development of new imaging techniques, we believe that certain models may exhibit high sensitivity and specificity for specific tumor subtypes. Thus, imaging evaluation is likely to become increasingly individualized. The value of mammography, ultrasound, MRI, and PET-CT in evaluating NAC in breast cancer was discussed in this paper. Additional details on the references included in this paper can be found in Table 1. However, breast cancer’s occurrence, development, and sensitivity to chemotherapeutic drugs are continuous, dynamic, and complex. A single imaging examination cannot provide a good evaluation of efficacy in the entire process of NAC. Therefore, in clinical treatment, we should be clearly aware of the pros and cons of various imaging methods and adopt a comprehensive method for evaluating the efficacy of NAC for breast cancer. This is expected to achieve an early, objective, and accurate assessment of efficacy, and provide a basis of decision for the precise treatment of breast cancer, ultimately improving the overall survival of breast cancer patients.
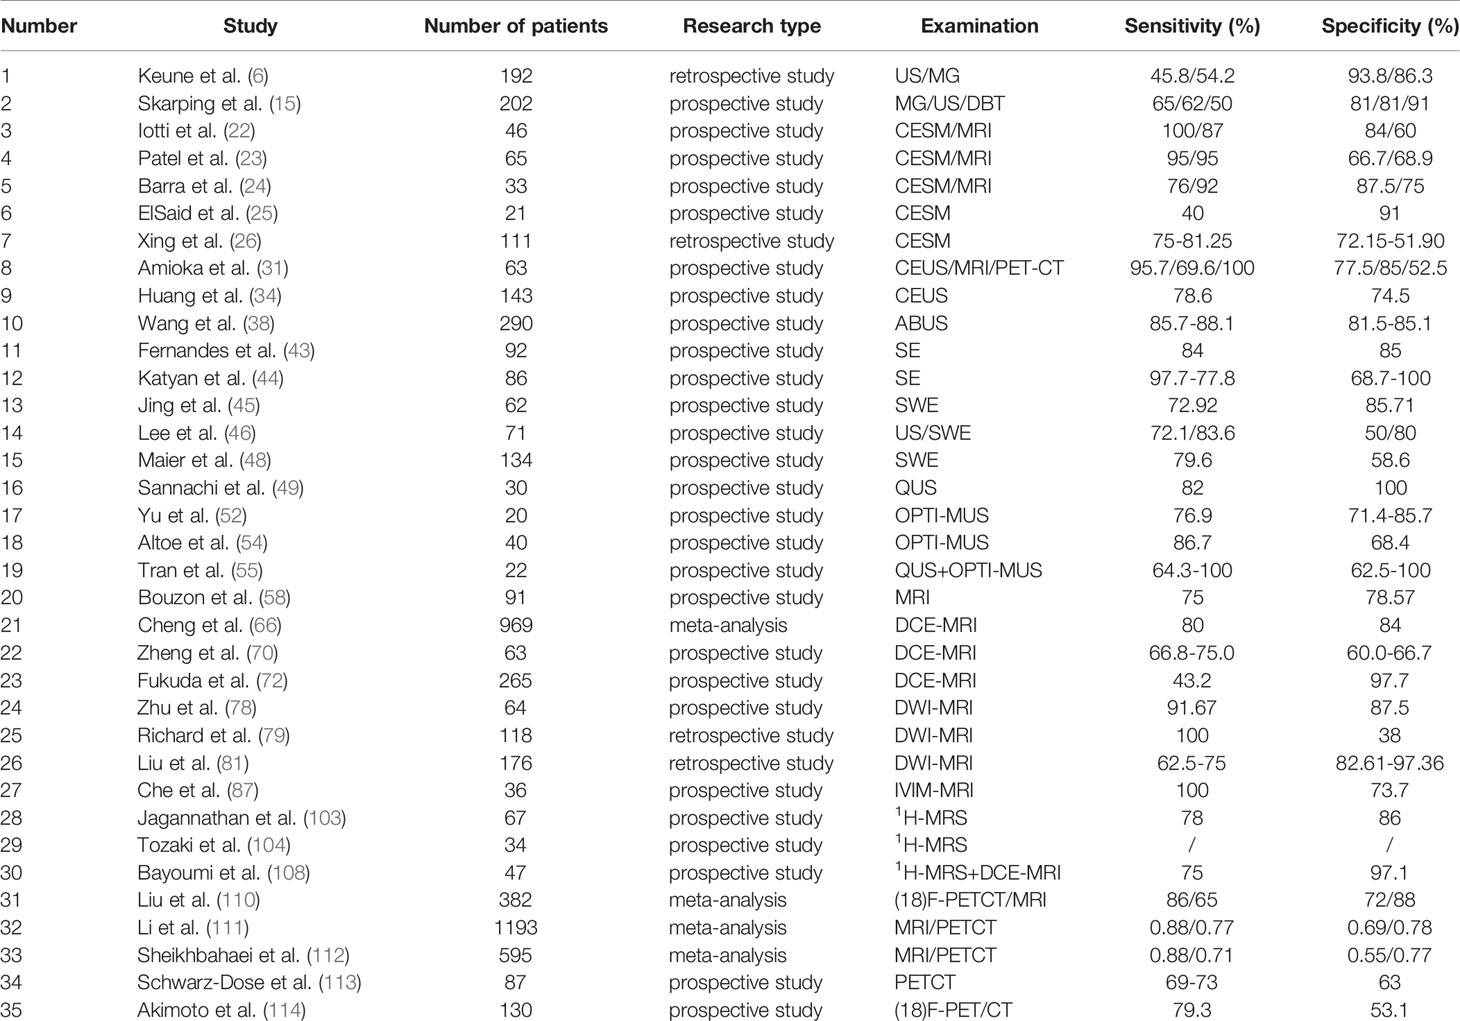
Table 1A Studies on the efficacy of various imaging techniques for breast cancer NAC (References to this article) (A) Studies on the efficacy of various imaging techniques on breast cancer NAC (evaluation index: Sensitivity, Specificity).
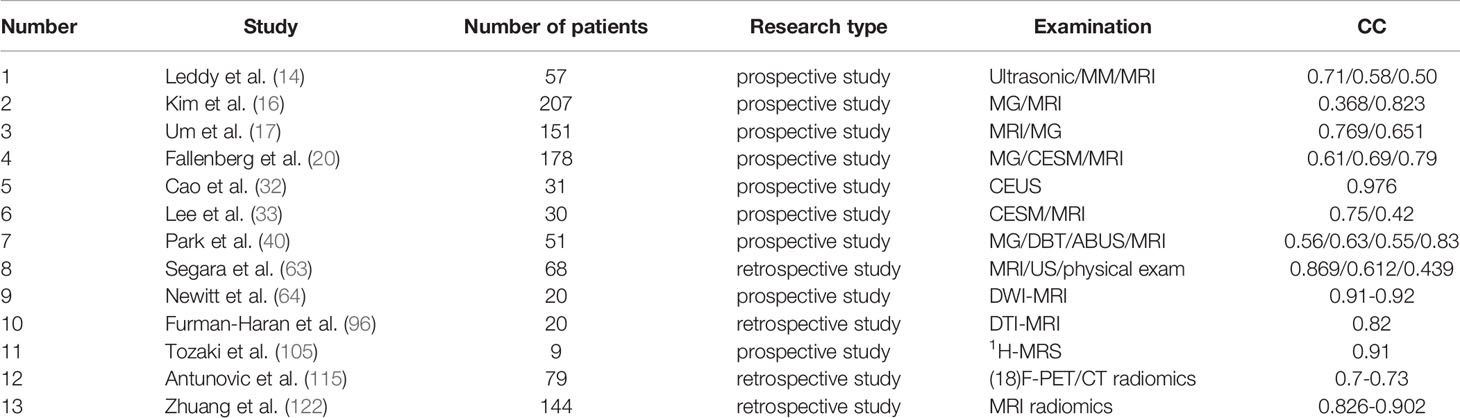
Table 1B Studies on the efficacy of various imaging techniques for breast cancer NAC (References to this article) (B) Studies on the efficacy of various imaging techniques on breast cancer NAC [evaluation index: correlation coefficient (CC)].
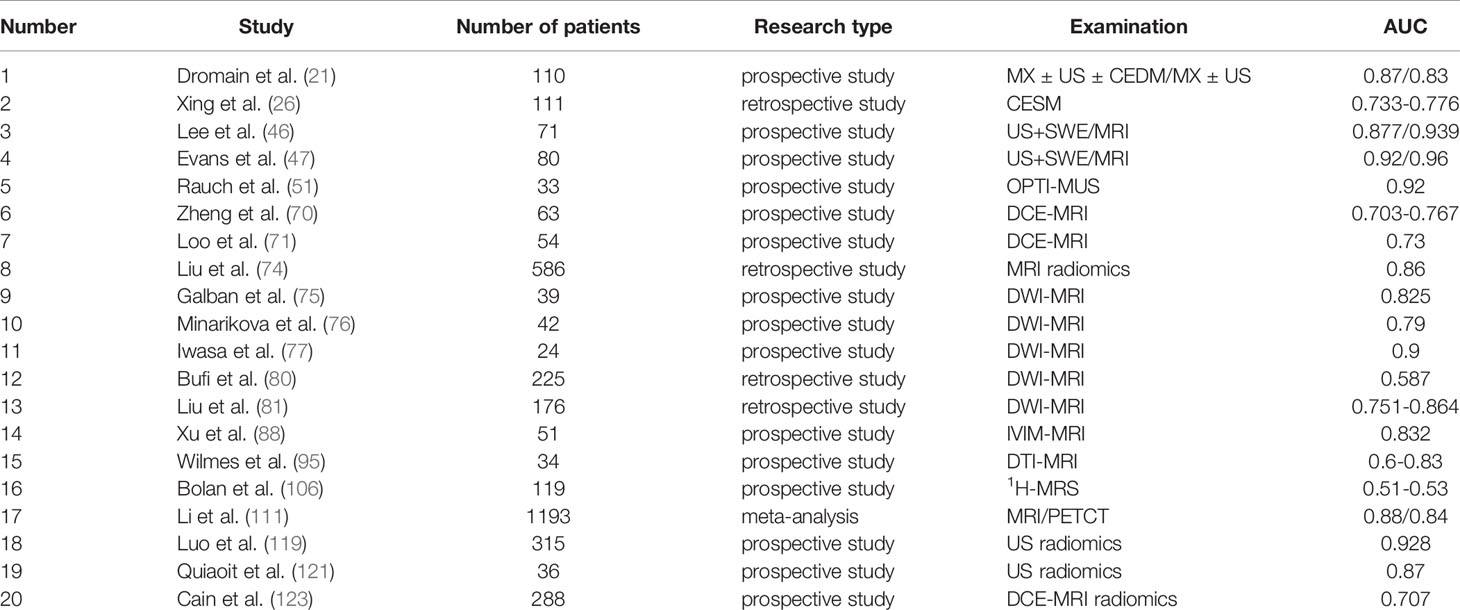
Table 1C Studies on the efficacy of various imaging techniques for breast cancer NAC (References to this article) (C) Studies on the efficacy of various imaging techniques on NAC in breast cancer (evaluation index: AUC).
Author Contributions
XK and QZ equally contributed to the manuscript. XK and QZ reviewed the literature, and wrote the manuscript. XW, TZ, JD, SS and JN contributed to developing the manuscript,and drafting and revising the text, tables, and figure. CT, MT, MW, JZ and YX revised the manuscript. ZHL and ZL designed and revised the manuscript.
Funding
This study was supported by grants from the National Nature Science Foundation of China (No.82060481); the Outstanding Youth Science Foundation of Yunnan Basic Research Project (202101AW070001); the Yunnan Applied Basic Research Projects (No.202001AT070046); the Yunnan Province technology innovation talent training object project (No. 202105AD160014); and the Graduate Innovation Fund project of Kunming Medical University (No. 2021S252).
Conflict of Interest
The authors declare that the research was conducted in the absence of any commercial or financial relationships that could be construed as a potential conflict of interest.
Publisher’s Note
All claims expressed in this article are solely those of the authors and do not necessarily represent those of their affiliated organizations, or those of the publisher, the editors and the reviewers. Any product that may be evaluated in this article, or claim that may be made by its manufacturer, is not guaranteed or endorsed by the publisher.
Abbreviations
NAC, neoadjuvant chemotherapy; pCR, pathological complete responses; US, ultrasound; MRI, magnetic resonance imaging; PET-CT, positron emission tomography CT; CR, complete remission; PR, partial response; PD, disease progression; SD, stable disease; CCC, consistency correlation coefficient; PPV, positive predictive value; NPV, negative predictive value; CESM, contrast-enhanced spectral mammography; ΔCGV, grey value reduction percentages; CEUS, contrast-enhanced ultrasound; ABVS, automated breast volume scanner; DBT, digital breast tomosynthesis; SE, Strain elastography; SWE, shear wave elastography; AUC, area under curve; QUS, quantitative ultrasound; OPTI-MUS, diffused optical tomography with ultrasound; RF, radio frequency; FFT, fast Fourier transform; SS, spectral slope; SI, spectral intercept; MBF, mid-band fit; ASD, average scatterer diameter; AAC, average acoustic concentration; ACE, attenuation coefficient estimate; SAS, spacing among scatterers; HBT, total hemoglobin; HBO2, deoxyhemoglobin; DCE-MRI, dynamic contrast-enhanced MRI; TIC, time-signal intensity curve; DCIS, ductal carcinoma in situ; DWI-MRI¸ quantitative diffusion-weighted imaging MRI; ROC, receiver operating characteristic; CI, confidence interval; ADC, apparent diffusion coefficient; IVIM, quantitative Intravoxel incoherent motion; 1H-MRS¸1H-magnetic resonance spectroscopy; tCho, total choline; DTI, diffusion tensor imaging; DKI, diffusion kurtosis imaging.
References
1. Sung H, Ferlay J, Siegel RL, Laversanne M, Soerjomataram I, Jemal A, et al. Global Cancer Statistics 2020: GLOBOCAN Estimates of Incidence and Mortality Worldwide for 36 Cancers in 185 Countries. CA Cancer J Clin (2021) 71(3):209–49. doi: 10.3322/caac.21660
2. Tyagi NK, Dhesy-Thind S. Clinical Practice Guidelines in Breast Cancer. Curr Oncol (2018) 25(Suppl 1):S151–S60. doi: 10.3747/co.25.3729
3. Caudle AS, Gonzalez-Angulo AM, Hunt KK, Liu P, Pusztai L, Symmans WF, et al. Predictors of Tumor Progression During Neoadjuvant Chemotherapy in Breast Cancer. J Clin Oncol (2010) 28(11):1821–8. doi: 10.1200/JCO.2009.25.3286
4. Shien T, Iwata H. Adjuvant and Neoadjuvant Therapy for Breast Cancer. Jpn J Clin Oncol (2020) 50(3):225–9. doi: 10.1093/jjco/hyz213
5. Kim R, Chang JM, Lee HB, Lee SH, Kim SY, Kim ES, et al. Predicting Axillary Response to Neoadjuvant Chemotherapy: Breast MRI and US in Patients With Node-Positive Breast Cancer. Radiology (2019) 293(1):49–57. doi: 10.1148/radiol.2019190014
6. Keune JD, Jeffe DB, Schootman M, Hoffman A, Gillanders WE, Aft RL. Accuracy of Ultrasonography and Mammography in Predicting Pathologic Response After Neoadjuvant Chemotherapy for Breast Cancer. Am J Surg (2010) 199(4):477–84. doi: 10.1016/j.amjsurg.2009.03.012
7. Shao Z, Wu J, Jiang Z, Cao X, Zha X, Chen D, et al. Expert Consensus on Neoadjuvant Treatment of Breast Cancer in China (2022 Edition). Chin J Cancer (2022) 32(01):80–9. doi: 10.19401/j.cnki.1007-3639.2022.01.011%WCNKI
8. Denkert C, von Minckwitz G, Darb-Esfahani S, Lederer B, Heppner BI, Weber KE, et al. Tumour-Infiltrating Lymphocytes and Prognosis in Different Subtypes of Breast Cancer: A Pooled Analysis of 3771 Patients Treated With Neoadjuvant Therapy. Lancet Oncol (2018) 19(1):40–50. doi: 10.1016/S1470-2045(17)30904-X
9. Liu S, Wang H, Li J, Zhang J, Wu J, Li Y, et al. FZR1 as a Novel Biomarker for Breast Cancer Neoadjuvant Chemotherapy Prediction. Cell Death Dis (2020) 11(9):804. doi: 10.1038/s41419-020-03004-9
10. Kong X, Moran MS, Zhang N, Haffty B, Yang Q. Meta-Analysis Confirms Achieving Pathological Complete Response After Neoadjuvant Chemotherapy Predicts Favourable Prognosis for Breast Cancer Patients. Eur J Cancer (2011) 47(14):2084–90. doi: 10.1016/j.ejca.2011.06.014
11. Lakhani SR, Ellis IO, Schnitt SJ, Schnitt PH, Schnitt MJ, WHO. Classification of Tumours of the Breast[M]. 4th ed. Lyon: IARC Press (2012).
12. Members of Breast Cancer Expert Panelon Consensus 2020. Expert Consensus on the Pathological Diagnosis of Neoadjuvant Treatment of Breast Cancer (2020 edition). Chin J Pathol (2020) (04):296–304. doi: 10.3760/cma.j.cn112151-20200102-00007
13. Eisenhauer EA, Therasse P, Bogaerts J, Schwartz LH, Sargent D, Ford R, et al. New Response Evaluation Criteria in Solid Tumours: Revised RECIST Guideline (Version 1.1). Eur J Cancer (2009) 45(2):228–47. doi: 10.1016/j.ejca.2008.10.026
14. Leddy R, Irshad A, Metcalfe A, Mabalam P, Abid A, Ackerman S, et al. Comparative Accuracy of Preoperative Tumor Size Assessment on Mammography, Sonography, and MRI: Is the Accuracy Affected by Breast Density or Cancer Subtype? J Clin Ultrasound (2016) 44(1):17–25. doi: 10.1002/jcu.22290
15. Skarping I, Fornvik D, Heide-Jorgensen U, Ryden L, Zackrisson S, Borgquist S. Neoadjuvant Breast Cancer Treatment Response; Tumor Size Evaluation Through Different Conventional Imaging Modalities in the NeoDense Study. Acta Oncol (2020) 59(12):1528–37. doi: 10.1080/0284186X.2020.1830167
16. Kim YS, Chang JM, Moon HG, Lee J, Shin SU, Moon WK. Residual Mammographic Microcalcifications and Enhancing Lesions on MRI After Neoadjuvant Systemic Chemotherapy for Locally Advanced Breast Cancer: Correlation With Histopathologic Residual Tumor Size. Ann Surg Oncol (2016) 23(4):1135–42. doi: 10.1245/s10434-015-4993-2
17. Um E, Kang JW, Lee S, Kim HJ, Yoon TI, Sohn G, et al. Comparing Accuracy of Mammography and Magnetic Resonance Imaging for Residual Calcified Lesions in Breast Cancer Patients Undergoing Neoadjuvant Systemic Therapy. Clin Breast Cancer (2018) 18(5):e1087–91. doi: 10.1016/j.clbc.2018.03.011
18. Feliciano Y, Mamtani A, Morrow M, Stempel MM, Patil S, Jochelson MS. Do Calcifications Seen on Mammography After Neoadjuvant Chemotherapy for Breast Cancer Always Need to Be Excised? Ann Surg Oncol (2017) 24(6):1492–8. doi: 10.1245/s10434-016-5741-y
19. Expert Panel on Breast I, Slanetz PJ, Moy L, Baron P, diFlorio RM, Green ED, et al. ACR Appropriateness Criteria[(R)] Monitoring Response to Neoadjuvant Systemic Therapy for Breast Cancer. J Am Coll Radiol (2017) 14(11S):S462–75. doi: 10.1016/j.jacr.2017.08.037
20. Fallenberg EM, Schmitzberger FF, Amer H, Ingold-Heppner B, Balleyguier C, Diekmann F, et al. Contrast-Enhanced Spectral Mammography vs. Mammography and MRI - Clinical Performance in a Multi-Reader Evaluation. Eur Radiol (2017) 27(7):2752–64. doi: 10.1007/s00330-016-4650-6
21. Dromain C, Thibault F, Diekmann F, Fallenberg EM, Jong RA, Koomen M, et al. Dual-Energy Contrast-Enhanced Digital Mammography: Initial Clinical Results of a Multireader, Multicase Study. Breast Cancer Res (2012) 14(3):R94. doi: 10.1186/bcr3210
22. Iotti V, Ravaioli S, Vacondio R, Coriani C, Caffarri S, Sghedoni R, et al. Contrast-Enhanced Spectral Mammography in Neoadjuvant Chemotherapy Monitoring: A Comparison With Breast Magnetic Resonance Imaging. Breast Cancer Res (2017) 19(1):106. doi: 10.1186/s13058-017-0899-1
23. Patel BK, Hilal T, Covington M, Zhang N, Kosiorek HE, Lobbes M, et al. Contrast-Enhanced Spectral Mammography Is Comparable to MRI in the Assessment of Residual Breast Cancer Following Neoadjuvant Systemic Therapy. Ann Surg Oncol (2018) 25(5):1350–6. doi: 10.1245/s10434-018-6413-x
24. Barra FR, de Souza FF, Camelo R, Ribeiro ACO, Farage L. Accuracy of Contrast-Enhanced Spectral Mammography for Estimating Residual Tumor Size After Neoadjuvant Chemotherapy in Patients With Breast Cancer: A Feasibility Study. Radiol Bras (2017) 50(4):224–30. doi: 10.1590/0100-3984.2016-0029
25. ElSaid NAE, Mahmoud HGM, Salama A, Nabil M, ElDesouky ED. Role of Contrast Enhanced Spectral Mammography in Predicting Pathological Response of Locally Advanced Breast Cancer Post Neo-Adjuvant Chemotherapy. Egyptian J Radiol Nucl Med (2017) 48(2):519–27. doi: 10.1016/j.ejrnm.2017.03.022
26. Xing D, Mao N, Dong J, Ma H, Chen Q, Lv Y. Quantitative Analysis of Contrast Enhanced Spectral Mammography Grey Value for Early Prediction of Pathological Response of Breast Cancer to Neoadjuvant Chemotherapy. Sci Rep (2021) 11(1):5892. doi: 10.1038/s41598-021-85353-9
27. Hayashi M, Yamamoto Y, Iwase H. Clinical Imaging for the Prediction of Neoadjuvant Chemotherapy Response in Breast Cancer. Chin Clin Oncol (2020) 9(3):31. doi: 10.21037/cco-20-15
28. Chinese Anti-Cancer Association. Experts Consensus of Breast Cancer Neoadjuvant Therapy in China (Version 2019). China Oncol (2019) 29:390e400. doi: 10.19401/j.cnki.1007-3639.2019.05.009
29. Dietrich CF, Averkiou M, Nielsen MB, Barr RG, Burns PN, Calliada F, et al. How to Perform Contrast-Enhanced Ultrasound (CEUS). Ultrasound Int Open (2018) 4(1):E2–E15. doi: 10.1055/s-0043-123931
30. Kumar A, Srivastava V, Singh S, Shukla RC. Color Doppler Ultrasonography for Treatment Response Prediction and Evaluation in Breast Cancer. Future Oncol (2010) 6(8):1265–78. doi: 10.2217/fon.10.93
31. Amioka A, Masumoto N, Gouda N, Kajitani K, Shigematsu H, Emi A, et al. Ability of Contrast-Enhanced Ultrasonography to Determine Clinical Responses of Breast Cancer to Neoadjuvant Chemotherapy. Jpn J Clin Oncol (2016) 46(4):303–9. doi: 10.1093/jjco/hyv215
32. Cao X, Xue J, Zhao B. Potential Application Value of Contrast-Enhanced Ultrasound in Neoadjuvant Chemotherapy of Breast Cancer. Ultrasound Med Biol (2012) 38(12):2065–71. doi: 10.1016/j.ultrasmedbio.2012.07.027
33. Lee SC, Grant E, Sheth P, Garcia AA, Desai B, Ji L, et al. Accuracy of Contrast-Enhanced Ultrasound Compared With Magnetic Resonance Imaging in Assessing the Tumor Response After Neoadjuvant Chemotherapy for Breast Cancer. J Ultrasound Med (2017) 36(5):901–11. doi: 10.7863/ultra.16.05060
34. Huang Y, Le J, Miao A, Zhi W, Wang F, Chen Y, et al. Prediction of Treatment Responses to Neoadjuvant Chemotherapy in Breast Cancer Using Contrast-Enhanced Ultrasound. Gland Surg (2021) 10(4):1280–90. doi: 10.21037/gs-20-836
35. D'Angelo A, Orlandi A, Bufi E, Mercogliano S, Belli P, Manfredi R. Automated Breast Volume Scanner (ABVS) Compared to Handheld Ultrasound (HHUS) and Contrast-Enhanced Magnetic Resonance Imaging (CE-MRI) in the Early Assessment of Breast Cancer During Neoadjuvant Chemotherapy: An Emerging Role to Monitoring Tumor Response? Radiol Med (2021) 126(4):517–26. doi: 10.1007/s11547-020-01319-3
36. Rella R, Belli P, Giuliani M, Bufi E, Carlino G, Rinaldi P, et al. Automated Breast Ultrasonography (ABUS) in the Screening and Diagnostic Setting: Indications and Practical Use. Acad Radiol (2018) 25(11):1457–70. doi: 10.1016/j.acra.2018.02.014
37. Vourtsis A. Three-Dimensional Automated Breast Ultrasound: Technical Aspects and First Results. Diagn Interv Imaging (2019) 100(10):579–92. doi: 10.1016/j.diii.2019.03.012
38. Wang X, Huo L, He Y, Fan Z, Wang T, Xie Y, et al. Early Prediction of Pathological Outcomes to Neoadjuvant Chemotherapy in Breast Cancer Patients Using Automated Breast Ultrasound. Chin J Cancer Res (2016) 28(5):478–85. doi: 10.21147/j.issn.1000-9604.2016.05.02
39. van Egdom LSE, Lagendijk M, Heijkoop EHM, Koning AHJ, van Deurzen CHM, Jager A, et al. Three-Dimensional Ultrasonography of the Breast; An Adequate Replacement for MRI in Neoadjuvant Chemotherapy Tumour Response Evaluation? - RESPONDER Trial. Eur J Radiol (2018) 104:94–100. doi: 10.1016/j.ejrad.2018.05.005
40. Park J, Chae EY, Cha JH, Shin HJ, Choi WJ, Choi YW, et al. Comparison of Mammography, Digital Breast Tomosynthesis, Automated Breast Ultrasound, Magnetic Resonance Imaging in Evaluation of Residual Tumor After Neoadjuvant Chemotherapy. Eur J Radiol (2018) 108:261–8. doi: 10.1016/j.ejrad.2018.09.032
41. Barr RG. Sonographic Breast Elastography: A Primer. J Ultrasound Med (2012) 31(5):773–83. doi: 10.7863/jum.2012.31.5.773
42. Ma Y, Zhang S, Li J, Li J, Kang Y, Ren W. Comparison of Strain and Shear-Wave Ultrasounic Elastography in Predicting the Pathological Response to Neoadjuvant Chemotherapy in Breast Cancers. Eur Radiol (2017) 27(6):2282–91. doi: 10.1007/s00330-016-4619-5
43. Fernandes J, Sannachi L, Tran WT, Koven A, Watkins E, Hadizad F, et al. Monitoring Breast Cancer Response to Neoadjuvant Chemotherapy Using Ultrasound Strain Elastography. Transl Oncol (2019) 12(9):1177–84. doi: 10.1016/j.tranon.2019.05.004
44. Katyan AMM, Mani C, Mandal AK. Strain Wave Elastography in Response Assessment to Neoadjuvant Chemotherapy in Patients With Locally Advanced Breast Cancer. Br J Radiol (2019) 92:20180515. doi: 10.1259/bjr.20180515
45. Jing H, Cheng W, Li ZY, Ying L, Wang QC, Wu T, et al. Early Evaluation of Relative Changes in Tumor Stiffness by Shear Wave Elastography Predicts the Response to Neoadjuvant Chemotherapy in Patients With Breast Cancer. J Ultrasound Med (2016) 35(8):1619–27. doi: 10.7863/ultra.15.08052
46. Lee SH, Chang JM, Han W, Moon HG, Koo HR, Gweon HM, et al. Shear-Wave Elastography for the Detection of Residual Breast Cancer After Neoadjuvant Chemotherapy. Ann Surg Oncol (2015) 22(Suppl 3):S376–84. doi: 10.1245/s10434-015-4828-1
47. Evans A, Whelehan P, Thompson A, Purdie C, Jordan L, Macaskill J, et al. Identification of Pathological Complete Response After Neoadjuvant Chemotherapy for Breast Cancer: Comparison of Greyscale Ultrasound, Shear Wave Elastography, and MRI. Clin Radiol (2018) 73(10):910.e1– e6. doi: 10.1016/j.crad.2018.05.030
48. Maier AM, Heil J, Harcos A, Sinn HP, Rauch G, Uhlmann L, et al. Prediction of Pathological Complete Response in Breast Cancer Patients During Neoadjuvant Chemotherapy: Is Shear Wave Elastography a Useful Tool in Clinical Routine? Eur J Radiol (2020) 128:109025. doi: 10.1016/j.ejrad.2020.109025
49. Sannachi L, Tadayyon H, Sadeghi-Naini A, Tran W, Gandhi S, Wright F, et al. Non-Invasive Evaluation of Breast Cancer Response to Chemotherapy Using Quantitative Ultrasonic Backscatter Parameters. Med Image Anal (2015) 20(1):224–36. doi: 10.1016/j.media.2014.11.009
50. Sannachi L, Gangeh M, Tadayyon H, Sadeghi-Naini A, Gandhi S, Wright FC, et al. Response Monitoring of Breast Cancer Patients Receiving Neoadjuvant Chemotherapy Using Quantitative Ultrasound, Texture, and Molecular Features. PloS One (2018) 13(1):e0189634. doi: 10.1371/journal.pone.0189634
51. Rauch GM, Adrada BE, Kuerer HM, van la Parra RF, Leung JW, Yang WT. Multimodality Imaging for Evaluating Response to Neoadjuvant Chemotherapy in Breast Cancer. AJR Am J Roentgenol (2017) 208(2):290–9. doi: 10.2214/AJR.16.17223
52. Yu YH, Zhu X, Mo QG, Cui Y. Prediction of Neoadjuvant Chemotherapy Response Using Diffuse Optical Spectroscopy in Breast Cancer. Clin Transl Oncol (2018) 20(4):524–33. doi: 10.1007/s12094-017-1745-8
53. Cochran JM, Busch DR, Leproux A, Zhang Z, O'Sullivan TD, Cerussi AE, et al. Tissue Oxygen Saturation Predicts Response to Breast Cancer Neoadjuvant Chemotherapy Within 10 Days of Treatment. J BioMed Opt (2018) 24(2):1–11. doi: 10.1117/1.JBO.24.2.021202
54. Altoe ML, Kalinsky K, Marone A, Kim HK, Guo H, Hibshoosh H, et al. Changes in Diffuse Optical Tomography Images During Early Stages of Neoadjuvant Chemotherapy Correlate With Tumor Response in Different Breast Cancer Subtypes. Clin Cancer Res (2021) 27(7):1949–57. doi: 10.1158/1078-0432.CCR-20-1108
55. Tran WT, Childs C, Chin L, Slodkowska E, Sannachi L, Tadayyon H, et al. Multiparametric Monitoring of Chemotherapy Treatment Response in Locally Advanced Breast Cancer Using Quantitative Ultrasound and Diffuse Optical Spectroscopy. Oncotarget (2016) 7(15):19762–80. doi: 10.18632/oncotarget.7844
56. Choi WJ, Kim HH, Cha JH, Shin HJ, Chae EY. Comparison of Pathologic Response Evaluation Systems After Neoadjuvant Chemotherapy in Breast Cancers: Correlation With Computer-Aided Diagnosis of MRI Features. AJR Am J Roentgenol (2019) 213(4):944–52. doi: 10.2214/AJR.18.21016
57. Scheel JR, Kim E, Partridge SC, Lehman CD, Rosen MA, Bernreuter WK, et al. MRI, Clinical Examination, and Mammography for Preoperative Assessment of Residual Disease and Pathologic Complete Response After Neoadjuvant Chemotherapy for Breast Cancer: ACRIN 6657 Trial. AJR Am J Roentgenol (2018) 210(6):1376–85. doi: 10.2214/AJR.17.18323
58. Bouzon A, Acea B, Soler R, Iglesias A, Santiago P, Mosquera J, et al. Diagnostic Accuracy of MRI to Evaluate Tumour Response and Residual Tumour Size After Neoadjuvant Chemotherapy in Breast Cancer Patients. Radiol Oncol (2016) 50(1):73–9. doi: 10.1515/raon-2016-0007
59. Kaise H, Shimizu F, Akazawa K, Hasegawa Y, Horiguchi J, Miura D, et al. Prediction of Pathological Response to Neoadjuvant Chemotherapy in Breast Cancer Patients by Imaging. J Surg Res (2018) 225:175–80. doi: 10.1016/j.jss.2017.12.002
60. Bouzon A, Iglesias A, Acea B, Mosquera C, Santiago P, Mosquera J. Evaluation of MRI Accuracy After Primary Systemic Therapy in Breast Cancer Patients Considering Tumor Biology: Optimizing the Surgical Planning. Radiol Oncol (2019) 53(2):171–7. doi: 10.2478/raon-2019-0023
61. Li M, Xu B, Shao Y, Liu H, Du B, Yuan J. Magnetic Resonance Imaging Patterns of Tumor Regression in Breast Cancer Patients After Neo-Adjuvant Chemotherapy, and an Analysis of the Influencing Factors. Breast J (2017) 23(6):656–62. doi: 10.1111/tbj.12811
62. Wang H, Mao X. Evaluation of the Efficacy of Neoadjuvant Chemotherapy for Breast Cancer. Drug Des Devel Ther (2020) 14:2423–33. doi: 10.2147/DDDT.S253961
63. Segara D, Krop IE, Garber JE, Winer E, Harris L, Bellon JR, et al. Does MRI Predict Pathologic Tumor Response in Women With Breast Cancer Undergoing Preoperative Chemotherapy? J Surg Oncol (2007) 96(6):474–80. doi: 10.1002/jso.20856
64. Newitt DC, Zhang Z, Gibbs JE, Partridge SC, Chenevert TL, Rosen MA, et al. Test-Retest Repeatability and Reproducibility of ADC Measures by Breast DWI: Results From the ACRIN 6698 Trial. J Magn Reson Imaging (2019) 49(6):1617–28. doi: 10.1002/jmri.26539
65. Tahmassebi A, Wengert GJ, Helbich TH, Bago-Horvath Z, Alaei S, Bartsch R, et al. Impact of Machine Learning With Multiparametric Magnetic Resonance Imaging of the Breast for Early Prediction of Response to Neoadjuvant Chemotherapy and Survival Outcomes in Breast Cancer Patients. Invest Radiol (2019) 54(2):110–7. doi: 10.1097/RLI.0000000000000518
66. Cheng Q, Huang J, Liang J, Ma M, Ye K, Shi C, et al. The Diagnostic Performance of DCE-MRI in Evaluating the Pathological Response to Neoadjuvant Chemotherapy in Breast Cancer: A Meta-Analysis. Front Oncol (2020) 10:93. doi: 10.3389/fonc.2020.00093
67. Pickles MD, Lowry M, Manton DJ, Turnbull LW. Prognostic Value of DCE-MRI in Breast Cancer Patients Undergoing Neoadjuvant Chemotherapy: A Comparison With Traditional Survival Indicators. Eur Radiol (2015) 25(4):1097–106. doi: 10.1007/s00330-014-3502-5
68. Tudorica A, Oh KY, Chui SY, Roy N, Troxell ML, Naik A, et al. Early Prediction and Evaluation of Breast Cancer Response to Neoadjuvant Chemotherapy Using Quantitative DCE-MRI. Transl Oncol (2016) 9(1):8–17. doi: 10.1016/j.tranon.2015.11.016
69. LI M, Gu Y, Peng W, Mao J. Application of Quantitative Dynamic Enhanced Magnetic Resonance to Assess the Efficacy of Neoadjuvant Chemotherapy in Breast Cancer. China Oncol (2016) 26(07):623–8. doi: 10.19401/j.cnki.1007-3639.2016.07.010%WCNKI
70. Zheng D, Yue Q, Ren W, Liu M, Zhang X, Lin H, et al. Early Responses Assessment of Neoadjuvant Chemotherapy in Nasopharyngeal Carcinoma by Serial Dynamic Contrast-Enhanced MR Imaging. Magn Reson Imaging (2017) 35:125–31. doi: 10.1016/j.mri.2016.08.011
71. Loo CE, Teertstra HJ, Rodenhuis S, van de Vijver MJ, Hannemann J, Muller SH, et al. Dynamic Contrast-Enhanced MRI for Prediction of Breast Cancer Response to Neoadjuvant Chemotherapy: Initial Results. AJR Am J Roentgenol (2008) 191(5):1331–8. doi: 10.2214/AJR.07.3567
72. Fukuda T, Horii R, Gomi N, Miyagi Y, Takahashi S, Ito Y, et al. Accuracy of Magnetic Resonance Imaging for Predicting Pathological Complete Response of Breast Cancer After Neoadjuvant Chemotherapy: Association With Breast Cancer Subtype. Springerplus (2016) 5:152. doi: 10.1186/s40064-016-1800-x
73. D'Angelo A, Rinaldi P, Belli P, D'Amico R, Carlino G, Grippo C, et al. Usefulness of Automated Breast Volume Scanner (ABVS) for Monitoring Tumor Response to Neoadjuvant Treatment in Breast Cancer Patients: Preliminary Results. Eur Rev Med Pharmacol Sci (2019) 23(1):225–31. doi: 10.26355/eurrev_201901_16768
74. Liu Z, Li Z, Qu J, Zhang R, Zhou X, Li L, et al. Radiomics of Multiparametric MRI for Pretreatment Prediction of Pathologic Complete Response to Neoadjuvant Chemotherapy in Breast Cancer: A Multicenter Study. Clin Cancer Res (2019) 25(12):3538–47. doi: 10.1158/1078-0432.CCR-18-3190
75. Galban CJ, Ma B, Malyarenko D, Pickles MD, Heist K, Henry NL, et al. Multi-Site Clinical Evaluation of DW-MRI as a Treatment Response Metric for Breast Cancer Patients Undergoing Neoadjuvant Chemotherapy. PloS One (2015) 10(3):e0122151. doi: 10.1371/journal.pone.0122151
76. Minarikova L, Bogner W, Pinker K, Valkovic L, Zaric O, Bago-Horvath Z, et al. Investigating the Prediction Value of Multiparametric Magnetic Resonance Imaging at 3 T in Response to Neoadjuvant Chemotherapy in Breast Cancer. Eur Radiol (2017) 27(5):1901–11. doi: 10.1007/s00330-016-4565-2
77. Iwasa H, Kubota K, Hamada N, Nogami M, Nishioka A. Early Prediction of Response to Neoadjuvant Chemotherapy in Patients With Breast Cancer Using Diffusion-Weighted Imaging and Gray-Scale Ultrasonography. Oncol Rep (2014) 31(4):1555–60. doi: 10.3892/or.2014.3025
78. Zhu Z, Jiang M. The Value of WB-DWI in the Assessment of the Efficacy of Preoperative Chemotherapy in Breast Cancer Patients. J Chin Oncol (2016) 22(06):443–7. doi: 10.11735/j.issn.1671-170X.2016.06.B002
79. Richard R, Thomassin I, Chapellier M, Scemama A, de Cremoux P, Varna M, et al. Diffusion-Weighted MRI in Pretreatment Prediction of Response to Neoadjuvant Chemotherapy in Patients With Breast Cancer. Eur Radiol (2013) 23(9):2420–31. doi: 10.1007/s00330-013-2850-x
80. Bufi E, Belli P, Costantini M, Cipriani A, Di Matteo M, Bonatesta A, et al. Role of the Apparent Diffusion Coefficient in the Prediction of Response to Neoadjuvant Chemotherapy in Patients With Locally Advanced Breast Cancer. Clin Breast Cancer (2015) 15(5):370–80. doi: 10.1016/j.clbc.2015.02.002
81. Liu S, Ren R, Chen Z, Wang Y, Fan T, Li C, et al. Diffusion-Weighted Imaging in Assessing Pathological Response of Tumor in Breast Cancer Subtype to Neoadjuvant Chemotherapy. J Magn Reson Imaging (2015) 42(3):779–87. doi: 10.1002/jmri.24843
82. Xiong F, Gong L. Advances in the Use of Different Techniques of MRI in the Evaluation of Neoadjuvant Chemotherapy for Breast Cancer. J China Clinic Med Imaging (2017) 28(02):145–7. doi: 10.3969/j.issn.1008-1062.2017.02.019
83. Dialani V, Chadashvili T, Slanetz PJ. Role of Imaging in Neoadjuvant Therapy for Breast Cancer. Ann Surg Oncol (2015) 22(5):1416–24. doi: 10.1245/s10434-015-4403-9
84. Lewin M, Fartoux L, Vignaud A, Arrive L, Menu Y, Rosmorduc O. The Diffusion-Weighted Imaging Perfusion Fraction F Is a Potential Marker of Sorafenib Treatment in Advanced Hepatocellular Carcinoma: A Pilot Study. Eur Radiol (2011) 21(2):281–90. doi: 10.1007/s00330-010-1914-4
85. Hauser T, Essig M, Jensen A, Gerigk L, Laun FB, Munter M, et al. Characterization and Therapy Monitoring of Head and Neck Carcinomas Using Diffusion-Imaging-Based Intravoxel Incoherent Motion Parameters-Preliminary Results. Neuroradiology (2013) 55(5):527–36. doi: 10.1007/s00234-013-1154-9
86. Xiao Y, Pan J, Chen Y, Chen Y, He Z, Zheng X. Intravoxel Incoherent Motion-Magnetic Resonance Imaging as an Early Predictor of Treatment Response to Neoadjuvant Chemotherapy in Locoregionally Advanced Nasopharyngeal Carcinoma. Med (Baltimore) (2015) 94(24):e973. doi: 10.1097/MD.0000000000000973
87. Che S, Zhao X, Ou Y, Li J, Wang M, Wu B, et al. Role of the Intravoxel Incoherent Motion Diffusion Weighted Imaging in the Pre-Treatment Prediction and Early Response Monitoring to Neoadjuvant Chemotherapy in Locally Advanced Breast Cancer. Med (Baltimore) (2016) 95(4):e2420. doi: 10.1097/MD.0000000000002420
88. Xu Q, Xu Y, Sun H, Chan Q, Shi K, Song A, et al. Quantitative Intravoxel Incoherent Motion Parameters Derived From Whole-Tumor Volume for Assessing Pathological Complete Response to Neoadjuvant Chemotherapy in Locally Advanced Rectal Cancer. J Magn Reson Imaging (2018) 48(1):248–58. doi: 10.1002/jmri.25931
89. Kim Y, Kim SH, Lee HW, Song BJ, Kang BJ, Lee A, et al. Intravoxel Incoherent Motion Diffusion-Weighted MRI for Predicting Response to Neoadjuvant Chemotherapy in Breast Cancer. Magn Reson Imaging (2018) 48:27–33. doi: 10.1016/j.mri.2017.12.018
90. Kim Y, Ko K, Kim D, Min C, Kim SG, Joo J, et al. Intravoxel Incoherent Motion Diffusion-Weighted MR Imaging of Breast Cancer: Association With Histopathological Features and Subtypes. Br J Radiol (2016) 89(1063):20160140. doi: 10.1259/bjr.20160140
91. Lee Y, Lee SS, Kim N, Kim E, Kim YJ, Yun SC, et al. Intravoxel Incoherent Motion Diffusion-Weighted MR Imaging of the Liver: Effect of Triggering Methods on Regional Variability and Measurement Repeatability of Quantitative Parameters. Radiology (2015) 274(2):405–15. doi: 10.1148/radiol.14140759
92. Andreou A, Koh DM, Collins DJ, Blackledge M, Wallace T, Leach MO, et al. Measurement Reproducibility of Perfusion Fraction and Pseudodiffusion Coefficient Derived by Intravoxel Incoherent Motion Diffusion-Weighted MR Imaging in Normal Liver and Metastases. Eur Radiol (2013) 23(2):428–34. doi: 10.1007/s00330-012-2604-1
93. Park HJ, Sung YS, Lee SS, Lee Y, Cheong H, Kim YJ, et al. Intravoxel Incoherent Motion Diffusion-Weighted MRI of the Abdomen: The Effect of Fitting Algorithms on the Accuracy and Reliability of the Parameters. J Magn Reson Imaging (2017) 45(6):1637–47. doi: 10.1002/jmri.25535
94. Marino MA, Helbich T, Baltzer P, Pinker-Domenig K. Multiparametric MRI of the Breast: A Review. J Magn Reson Imaging (2018) 47(2):301–15. doi: 10.1002/jmri.25790
95. Wilmes LJ, Li W, Shin HJ, Newitt DC, Proctor E, Harnish R, et al. Diffusion Tensor Imaging for Assessment of Response to Neoadjuvant Chemotherapy in Patients With Breast Cancer. Tomography (2016) 2(4):438–47. doi: 10.18383/j.tom.2016.00271
96. Furman-Haran E, Nissan N, Ricart-Selma V, Martinez-Rubio C, Degani H, Camps-Herrero J. Quantitative Evaluation of Breast Cancer Response to Neoadjuvant Chemotherapy by Diffusion Tensor Imaging: Initial Results. J Magn Reson Imaging (2018) 47(4):1080–90. doi: 10.1002/jmri.25855
97. Ebrahimi B, Rihal N, Woollard JR, Krier JD, Eirin A, Lerman LO. Assessment of Renal Artery Stenosis Using Intravoxel Incoherent Motion Diffusion-Weighted Magnetic Resonance Imaging Analysis. Invest Radiol (2014) 49(10):640–6. doi: 10.1097/RLI.0000000000000066
98. Lu Y, Jansen JF, Stambuk HE, Gupta G, Lee N, Gonen M, et al. Comparing Primary Tumors and Metastatic Nodes in Head and Neck Cancer Using Intravoxel Incoherent Motion Imaging: A Preliminary Experience. J Comput Assist Tomogr (2013) 37(3):346–52. doi: 10.1097/RCT.0b013e318282d935
99. Yu J, Xu Q, Song JC, Li Y, Dai X, Huang DY, et al. The Value of Diffusion Kurtosis Magnetic Resonance Imaging for Assessing Treatment Response of Neoadjuvant Chemoradiotherapy in Locally Advanced Rectal Cancer. Eur Radiol (2017) 27(5):1848–57. doi: 10.1007/s00330-016-4529-6
100. Chen Y, Ren W, Zheng D, Zhong J, Liu X, Yue Q, et al. Diffusion Kurtosis Imaging Predicts Neoadjuvant Chemotherapy Responses Within 4 Days in Advanced Nasopharyngeal Carcinoma Patients. J Magn Reson Imaging (2015) 42(5):1354–61. doi: 10.1002/jmri.24910
101. Wang F, Jin D, Hua XL, Zhao ZZ, Wu LM, Chen WB, et al. Investigation of Diffusion Kurtosis Imaging for Discriminating Tumors From Inflammatory Lesions After Treatment for Bladder Cancer. J Magn Reson Imaging (2018) 48(1):259–65. doi: 10.1002/jmri.25924
102. Katz-Brull R, Lavin PT, Lenkinski RE. Clinical Utility of Proton Magnetic Resonance Spectroscopy in Characterizing Breast Lesions. J Natl Cancer Inst (2002) 94(16):1197–203. doi: 10.1093/jnci/94.16.1197
103. Jagannathan NR, Kumar M, Seenu V, Coshic O, Dwivedi SN, Julka PK, et al. Evaluation of Total Choline From in-Vivo Volume Localized Proton MR Spectroscopy and Its Response to Neoadjuvant Chemotherapy in Locally Advanced Breast Cancer. Br J Cancer (2001) 84(8):1016–22. doi: 10.1054/bjoc.2000.1711
104. Tozaki M, Sakamoto M, Oyama Y, Maruyama K, Fukuma E. Predicting Pathological Response to Neoadjuvant Chemotherapy in Breast Cancer With Quantitative 1H MR Spectroscopy Using the External Standard Method. J Magn Reson Imaging (2010) 31(4):895–902. doi: 10.1002/jmri.22118
105. Tozaki M, Oyama Y, Fukuma E. Preliminary Study of Early Response to Neoadjuvant Chemotherapy After the First Cycle in Breast Cancer: Comparison of 1H Magnetic Resonance Spectroscopy With Diffusion Magnetic Resonance Imaging. Jpn J Radiol (2010) 28(2):101–9. doi: 10.1007/s11604-009-0391-7
106. Bolan PJ, Kim E, Herman BA, Newstead GM, Rosen MA, Schnall MD, et al. MR Spectroscopy of Breast Cancer for Assessing Early Treatment Response: Results From the ACRIN 6657 MRS Trial. J Magn Reson Imaging (2017) 46(1):290–302. doi: 10.1002/jmri.25560
107. Chen JH, Su MY. Clinical Application of Magnetic Resonance Imaging in Management of Breast Cancer Patients Receiving Neoadjuvant Chemotherapy. BioMed Res Int (2013) 2013:348167. doi: 10.1155/2013/348167
108. Bayoumi D, Zaky M, Ibrahim DA, Abdallah A, Abouelkhair KM. The Additive Role of (1)H-Magnetic Resonance Spectroscopic Imaging to Ensure Pathological Complete Response After Neoadjuvant Chemotherapy in Breast Cancer Patients. Pol J Radiol (2019) 84:e570–e80. doi: 10.5114/pjr.2019.92282
109. Tokuda Y, Yanagawa M, Fujita Y, Honma K, Tanei T, Shimoda M, et al. Prediction of Pathological Complete Response After Neoadjuvant Chemotherapy in Breast Cancer: Comparison of Diagnostic Performances of Dedicated Breast PET, Whole-Body PET, and Dynamic Contrast-Enhanced MRI. Breast Cancer Res Treat (2021) 188(1):107-15. doi: 10.1007/s10549-021-06179-7
110. Liu Q, Wang C, Li P, Liu J, Huang G, Song S. The Role of (18)F-FDG PET/CT and MRI in Assessing Pathological Complete Response to Neoadjuvant Chemotherapy in Patients With Breast Cancer: A Systematic Review and Meta-Analysis. BioMed Res Int (2016) 2016:3746232. doi: 10.1155/2016/3746232
111. Li H, Yao L, Jin P, Hu L, Li X, Guo T, et al. RI and PET/CT for Evaluation of the Pathological Response to Neoadjuvant Chemotherapy in Breast Cancer: A Systematic Review and Meta-Analysis. Breast (2018) 40:106–15. doi: 10.1016/j.breast.2018.04.018
112. Sheikhbahaei S, Trahan TJ, Xiao J, Taghipour M, Mena E, Connolly RM, et al. FDG-PET/CT and MRI for Evaluation of Pathologic Response to Neoadjuvant Chemotherapy in Patients With Breast Cancer: A Meta-Analysis of Diagnostic Accuracy Studies. Oncologist (2016) 21(8):931–9. doi: 10.1634/theoncologist.2015-0353
113. Schwarz-Dose J, Untch M, Tiling R, Sassen S, Mahner S, Kahlert S, et al. Monitoring Primary Systemic Therapy of Large and Locally Advanced Breast Cancer by Using Sequential Positron Emission Tomography Imaging With [18F]Fluorodeoxyglucose. J Clin Oncol (2009) 27(4):535–41. doi: 10.1200/JCO.2008.17.2650
114. Akimoto E, Kadoya T, Kajitani K, Emi A, Shigematsu H, Ohara M, et al. Role of (18)F-PET/CT in Predicting Prognosis of Patients With Breast Cancer After Neoadjuvant Chemotherapy. Clin Breast Cancer (2018) 18(1):45–52. doi: 10.1016/j.clbc.2017.09.006
115. Antunovic L, De Sanctis R, Cozzi L, Kirienko M, Sagona A, Torrisi R, et al. PET/CT Radiomics in Breast Cancer: Promising Tool for Prediction of Pathological Response to Neoadjuvant Chemotherapy. Eur J Nucl Med Mol Imaging (2019) 46(7):1468–77. doi: 10.1007/s00259-019-04313-8
116. Groheux D, Giacchetti S, Moretti JL, Porcher R, Espie M, Lehmann-Che J, et al. Correlation of High 18F-FDG Uptake to Clinical, Pathological and Biological Prognostic Factors in Breast Cancer. Eur J Nucl Med Mol Imaging (2011) 38(3):426–35. doi: 10.1007/s00259-010-1640-9
117. Gillies RJ, Anderson AR, Gatenby RA, Morse DL. The Biology Underlying Molecular Imaging in Oncology: From Genome to Anatome and Back Again. Clin Radiol (2010) 65(7):517–21. doi: 10.1016/j.crad.2010.04.005
118. Lambin P, Rios-Velazquez E, Leijenaar R, Carvalho S, van Stiphout RG, Granton P, et al. Radiomics: Extracting More Information From Medical Images Using Advanced Feature Analysis. Eur J Cancer (2012) 48(4):441–6. doi: 10.1016/j.ejca.2011.11.036
119. Luo WQ, Huang QX, Huang XW, Hu HT, Zeng FQ, Wang W. Predicting Breast Cancer in Breast Imaging Reporting and Data System (BI-RADS) Ultrasound Category 4 or 5 Lesions: A Nomogram Combining Radiomics and BI-RADS. Sci Rep (2019) 9(1):11921. doi: 10.1038/s41598-019-48488-4
120. Li H, Zhu Y, Burnside ES, Drukker K, Hoadley KA, Fan C, et al. MR Imaging Radiomics Signatures for Predicting the Risk of Breast Cancer Recurrence as Given by Research Versions of MammaPrint, Oncotype DX, and PAM50 Gene Assays. Radiology (2016) 281(2):382–91. doi: 10.1148/radiol.2016152110
121. Quiaoit K, DiCenzo D, Fatima K, Bhardwaj D, Sannachi L, Gangeh M, et al. Quantitative Ultrasound Radiomics for Therapy Response Monitoring in Patients With Locally Advanced Breast Cancer: Multi-Institutional Study Results. PloS One (2020) 15(7):e0236182. doi: 10.1371/journal.pone.0236182
122. Zhuang X, Chen C, Liu Z, Zhang L, Zhou X, Cheng M, et al. Multiparametric MRI-Based Radiomics Analysis for the Prediction of Breast Tumor Regression Patterns After Neoadjuvant Chemotherapy. Transl Oncol (2020) 13(11):100831. doi: 10.1016/j.tranon.2020.100831
123. Cain EH, Saha A, Harowicz MR, Marks JR, Marcom PK, Mazurowski MA. Multivariate Machine Learning Models for Prediction of Pathologic Response to Neoadjuvant Therapy in Breast Cancer Using MRI Features: A Study Using an Independent Validation Set. Breast Cancer Res Treat (2019) 173(2):455–63. doi: 10.1007/s10549-018-4990-9
Keywords: neoadjuvant chemotherapy (NAC), breast cancer, evaluations of response, imaging, PCR
Citation: Kong X, Zhang Q, Wu X, Zou T, Duan J, Song S, Nie J, Tao C, Tang M, Wang M, Zou J, Xie Y, Li Z and Li Z (2022) Advances in Imaging in Evaluating the Efficacy of Neoadjuvant Chemotherapy for Breast Cancer. Front. Oncol. 12:816297. doi: 10.3389/fonc.2022.816297
Received: 16 November 2021; Accepted: 29 March 2022;
Published: 20 May 2022.
Edited by:
Siuly Siuly, Victoria University, Australia, AustraliaReviewed by:
Hadassa Degani, Weizmann Institute of Science, IsraelMin-Ying Su, University of California, Irvine, United States
Copyright © 2022 Kong, Zhang, Wu, Zou, Duan, Song, Nie, Tao, Tang, Wang, Zou, Xie, Li and Li. This is an open-access article distributed under the terms of the Creative Commons Attribution License (CC BY). The use, distribution or reproduction in other forums is permitted, provided the original author(s) and the copyright owner(s) are credited and that the original publication in this journal is cited, in accordance with accepted academic practice. No use, distribution or reproduction is permitted which does not comply with these terms.
*Correspondence: Zhen Li, li_hazel@126.com; Zhenhui Li, lizhenhui621@qq.com
†These authors have contributed equally to this work and share first authorship