
Ultra-wideband data as input of a combined EfficientNet and LSTM architecture for human activity recognition
Abstract
The world population is aging in the last few years and this trend is expected to increase in the future. The number of persons requiring assistance in their everyday life is also expected to rise. Luckily, smart homes are becoming a more and more compelling alternative to direct human supervision. Smart homes are equipped with sensors that, coupled with Artificial Intelligence (AI), can support their occupants whenever needed. At the heart of the problem is the recognition of activities. Human activity recognition is a complex problem due to the variety of sensors available, their impact on privacy, the high number of possible activities, and the several ways even a simple activity can be performed. This paper proposes a deep learning model combining LSTM and a tuned version of the EfficientNet model using transfer learning, data fusion, minimalist pre-processing as well as training for both activity and movement recognition using data from three ultra-wideband (UWB) radars. As regards activity recognition, experiments were conducted in a real and furnished apartment where 15 different activities were performed by 10 participants. Results showed an improvement of 18.63% over previous work on the same dataset with 65.59% in Top-1 accuracy using Leave-One-Subject-Out cross validation. Furthermore, the experiments that address movement recognition were conducted under the same conditions where a single participant was asked to perform four distinct arm movements with the three UWB radars positioned at two different heights. With an overall accuracy of 73% in Top-1, the detailed analysis of the results obtained showed that the proposed model was capable of recognizing accurately large and fine-grained movements. However, the medium-sized movements demonstrated a significant impact on the movement recognition due to an insufficient degree of variation between the four proposed movements.
1.Introduction
From year to year, the world population is getting older and based on a report published by the United Nations Department of Economic and Social Affairs [29], people over the age of 65 could represent up to 25% of the North American population by 2050. In the world, the number of people over 80 could triple in the same period.
Many problems occur with the normal course of aging, namely the risk of developing cognitive impairments such as Alzheimer’s and Parkinson’s diseases or physical conditions such as osteoarthritis and general loss of muscle strength, endurance and flexibility. As a result, these problems lead to an increasing difficulty of maintaining healthy daily habits and behaviors. Activities that are performed to take care of one’s living environment and for self-care are called Activities of Daily Living (ADLs). Examples of such ADLs are Cooking, Cleaning, Brushing teeth, Taking medicines, and more. The ability of a person to perform these activities is directly linked to their ability to live unassisted. A person that has difficulty performing some ADLs can receive help at home or move to an adapted facility such as nursing homes. Leaving its home, particularly at an old age, can be a source of great distress [22]. It is, therefore, beneficial for a person to keep its home as long as possible. Help can take many forms (e.g., having a caregiver at home). While a caregiver can help in providing essential services, most of this task often becomes the responsibility of relatives. Providing care for an aging relative with an underlying medical condition such as Alzheimer’s disease is quite demanding and can become an emotional and financial burden for relatives [2].
Luckily, home automation can also bring some form of help. Home automation is the building of homes that incorporate sensors in order to improve their occupant’s experience. A minimalist example is the inclusion of smart devices in a home with consumer devices such as a smart assistant (e.g., Alexa), smart thermostats, smart switches, vacuum robots, etc. While it cannot replace the care given by another person, certain specific tasks can be automated. For instance, in the last few years, many researches focused on detecting falls [15,24,25], which is a critical event to monitor for people of a certain age. Although fall detection is important, more complex behaviors performed daily, such as ADLs, must be detected and monitored to support a person with cognitive and or physical decline. The first step towards making applications that can support a person throughout the day is to detect the activity being carried out by that person.
Many approaches can be adopted to monitor a person in its environment. These can be divided into two categories. The first category are approaches relying on the use of wearable devices. For instance, wearable devices can detect falls [25] or even differentiate between specific movements such as swimming styles [5]. Wearable device can be a tag specially developed and fixed on clothes or devices already available on the market such as smartphones or smartwatches. A significant limitation of approaches based on the used of such devices is that the person can forget to wear it. The second category of approaches relies on ambient sensors installed in the home environment. There is a wide range of ambient sensors, including Passive Infrared (PIR) sensors, pressure mats, smart switches, cameras, radars, passive Radio-Frequency Identification (RFID) tags, microphones and so on. Among those, cameras have generated a lot of interest for activity recognition, either the standard RGB or RGB-Depth cameras [8,10]. While cameras yet offer the most information on an activity and the context surrounding it, they tend to be difficult to accept by the occupant as they offer very little privacy [16]. For this reason, the use of ultra-wideband (UWB) radars seems promising. UWB radars operate in the 3.1 GHz to 10.6 GHz radio frequency range and use a large portion of the radio spectrum covering more than 500 MHz [28]. UWB radars have a good precision in the order of few millimeters in close range, have the ability to pass through walls and are relatively cheap at $ 249 US. They remain an interesting alternative because they allow to capture extensive information on the ADLs, while maintaining a certain level of confidentiality.
The work presented in this paper focuses on the recognition of ADLs in itself as well as movement recognition using UWB radars. In this paper, we propose a deep learning model combining a tuned version of the EfficientNet baseline model and a Long-Short Term Memory (LSTM) neural network. This model was trained in part using transfer learning. It exploits data fusion and uses minimally pre-processed data from three UWB radars. We tested this model on 15 different ADLs performed by 10 participants in a fully furnished smart apartment. This paper is the continuation of work already published by the Laboratoire d’Intelligence Ambiante pour la Reconnaissance d’Activités (LIARA) [19], where different LSTM and 1D Convolutional Neural Network (CNN) model combinations were tested to recognize activities based on time series representations of the collected data from UWB radars. Since these models were trained and tested on the same dataset, the 1D CNN with stacked LSTM model which performed the best using this approach served as a baseline to compare the deep learning model proposed in this paper. Furthermore, in order to complete the movement recognition experimentation, the proposed model architecture was trained with a dataset including four different arm movements performed by a single participant under the same conditions inside the smart apartment as for the activity recognition dataset. Such an analysis was proposed because we initially wanted to evaluate the model’s ability to recognize relatively fine-grained movements. In addition, we wanted to obtain useful insights to guide our future works to suggest the most accurate learning architecture for ADL recognition.
2.Related work
Human Activity Recognition (HAR) is the task of recognizing all activities performed by a human. A large part of the work proposed in HAR focuses on the recognition of simple activities such as Sitting, Getting Up, Jumping and other short activities. Contrariwise, ADLs are much more complex activities as they are composed of great variety of simpler activities. The most obvious example being Cooking; this activity is composed of simpler and shorter activities such as Reaching, Cutting, Heating, etc. in a way that varies depending on the environment, the person and what is being cooked. Even though ADLs are complex, algorithms, and models developed to recognize simpler activities can nevertheless offer great insight into how to efficiently extract information of human movements in the temporal domain.
There are many approaches to achieve activity recognition. These ones are fundamentally limited to the sensors used, regardless of the capability of the inherent model used. Usually, the approaches are divided into two categories, namely those based on wearable sensors and those based on ambient sensors. However, in this work, we decided to subdivide the second category into three more specific categories of sensors, namely purely ambient sensors, cameras, and UWB radars.
2.1.Wearable sensors
For the first category, most wearable devices used are already available on the market, such as smartphones and smartwatches. These devices already contain sensors (e.g., accelerometers, gyroscopes), which can provide relevant data as regards the movements performed by a person. This category emerged more recently due to their wide availability and their ease of use. HAR based on wearable sensors relies on two main techniques; feature engineering combined with machine learning techniques or deep learning techniques.
On the first hand, systems based on machine learning technique first need to extract key features from data generated by the sensors. Such data are then used by different machine learning algorithms in order to perform ADL recognition [4,9]. On the other hand, deep learning techniques are based on the pre-processing of sensor data allowing their direct use with learning models. As these methods allow to keep a maximum of information that may be present in the data, several deep learning models have been proposed in the last years [12,23]. In addition, these techniques tend to demonstrate excellent recognition performance regarding the activities recorded through wearable sensors.
The main advantage of wearable devices based techniques lies in the fact that they are not physically limited to a static position within an environment to recognize activities. Indeed, the recognition process can happen anywhere as long as a sensor is worn by a user or placed on the objects that have interactions in the activities to be recognized. Moreover, wearable devices such as smartwatches and smartphones are generally positively accepted by their users [16]. However, such approach does have limitations. Indeed, in our context, since the recognition of ADLs mainly aims at assisting people with cognitive impairments, it may be difficult for them to remember to wear or recharge the battery of such devices. In addition, data produced by the embedded sensors rarely provide contextual information on the activity being performed, such as the location of the person within the environment. This is the main reason why work that focuses on wearable devices based techniques tend to only differentiate between movements and simple activities such as ADLs.
2.2.Ambient sensors
If more contextual information is required, using non-wearable sensors appears to be the most promising option. In such approaches, different types of sensors are directly integrated into the environment. On one hand, specific sensors can be hidden in everyday objects such as pressure mats in the floor or smart light switches and even certain appliances retrofitted with a variety of sensors [6]. On the other hand, more generic sensors can be installed in the environment for the single purpose of activity recognition such as cameras, microphones, and UWB radars.
The advent of the Internet of Things (IoT) has made it easier to integrate sensors in an environment since they have become cheaper and more widespread. Smart environments can easily be equipped with low-level sensors such as magnetic contact sensors, pressure mats, passive infrared (PIR) motion detection sensors, and smart actuators [26]. The interaction of a person with these simple sensors makes it possible to determine what activities are being performed [3,14].
Since it is a relatively recent trend, a common communication standard has yet to emerge from IoT. As such, many communication protocols are present on the market (e.g. Bluetooth Low Energy (BLE), WiFi, ZigBee, Z-Wave and X10), making it harder to integrate a variety of these sensors into one cohesive solution. Also, using these types of sensors relies on the participants’ interaction with the environment, which might make it hard to discriminate between two similar monitored activities. For example, suppose a PIR sensor detecting that a person is located in the restroom. In this case, it is impossible to know for sure that this person is brushing its teeth contrary to drinking unless additional sensors are present to monitor the state of either the toothbrush or the glass.
2.3.Cameras
One of the most obvious type of sensors to use in the context of HAR is the camera. In this case, a camera is placed in the environment in a key location that can best monitor the activities performed by the resident. As with other image recognition problems, HAR using cameras tend to rely heavily on deep learning techniques and more precisely the use of CNN. For example, authors [11] have proposed an ADL recognition system based on images from a RGB camera. In addition, RGB-D cameras also remain a popular type of camera used to perform the activity recognition process [21]. These cameras are capable of adding depth information to a conventional RGB image, based on the distance between the subject and the sensor. Since the depth analysis with RGB-D cameras does not allow to identify a person in a formal way but mainly the shape of the position of the joints of a basic skeleton representing the posture of a person, these cameras are generally more accepted by residents of smart environments when only depth information is kept and RGB images are not processed. [8,10].
The main downside of this approach is that not all sensors from this category are easily accepted by the person being monitored due to privacy concerns. Acceptability varies from one sensor to another, usually based on perceived intrusiveness. On one end of the sensor intrusiveness spectrum are cameras and microphones that leave little to no privacy. On the other end of the spectrum are sensors monitoring the state of the environment and not the person (sensors embedded in furniture and appliances).
2.4.Ultra-wideband radars
Finally, UWB radars remain an interesting alternative to cameras for ADL recognition as they tend to offer a good alternative between both the confidentiality and the richness of data they provide. Indeed, while movements achieved can be extracted from UWB radar data, it is not possible to identify the features related to the person performing them. Moreover, the precision of UWB radars allow, most of the time, to see the difference between the movement of different parts of the body. However, UWB approaches share the same limitation as wearable sensors, namely the difficulty of making sense of objects being manipulated by a person with the information provided by such sensors.
In most works, a single UWB radar is placed in front of a person in an unobstructed environment. In the work proposed by Yang et al. [30], a spectrogram of the activity recorded with a UWB radar is used to train a Generative Adversarial Network (GAN). In a GAN, two models are trained side-by-side, one generating data similar to the training set (the generator), and the other (the discriminator) has to learn whether its input comes from the real dataset or if it was generated by the generator. In order to measure its performance, two datasets were used. The first dataset is composed of seven activities recorded in a laboratory: Boxing in Place, Crawling, Creeping, Jumping Forward, Running, Standing and Walking. The second is generated from the MOtion CAPture (MOCAP) dataset and is composed of the same activities. This approach has shown better results on both the created dataset and the MOCAP dataset (F1-score of 0.9703 and 0.9851 respectively) than carefully selected features with algorithms such as KNN (F1-score of 0.9697 on both datasets), Principal Component Analysis data description (PCA dd) (F1-score of 0.9490 and 0.9146) and k-means (F1-score of 0.9436 and 0.9381).
Transforming the Doppler-domain into a spectrogram is a common approach [13,30]. More precisely, Hao et al. [13] suggested a modified CNN that uses multiple filter sizes to detect patterns combined with Gated Recurent Units (GRU) to detect temporal patterns. Two datasets were used in this study. The first one contains the activities Running, Walking, Boxing, Kicking, Jumping and Standing that were recorded in a laboratory. The second one is composed of simulated UWB radar data from the MOCAP dataset. Their model has reached 88.49% accuracy in Leave-One-Subject-Out (LOSO) cross-validation.
Another common approach consists of transforming the UWB radar data into 1D time series instead of a matrix of UWB radar frames [20,24]. Maitre et al. [20] aim at recognizing fall events using three UWB radars. In this work, a dataset composed of fall and non-fall activities was built. These activities were recorded in a fully furnished smart apartment. The activities were performed by seven different participants and recorded in different locations in the apartment. The final dataset is composed of 280 instances, half of which are falls. A time series is then computed from the raw UWB radar data. The transformation of Distance-Doppler data into a time series is done by normalizing and summing the bins in each recorded frame. Then, the summed frames (forming a 1D array) are normalized for future use by a neural network. Since three radars are used to record the activities, this process is applied to all UWB radars data and combined to form a single array. The work proposed a CNN-LSTM model, composed of five 1D CNN models, each given a subset of the input time series and topped with two LSTM layers and a dense layer for classification. The model achieved a good accuracy of 89% using a 70/30 training and testing set split.
While all the papers mentioned above proposed interesting solutions to the HAR problem. However, they share a common weakness: the activities being recognized are simple, recorded by a limited number of people and recorded in an environment devoid of obstacles.
As mentioned previously, this work results from ongoing research in the domain of recognition of ADLs at the LIARA lab. It represents further investigations regarding the use of UWB radars in the context of ADL recognition in a smart home and is built upon our last published work [19]. In this one, the data collected from the UWB radar was transformed into a time series similarly to [24], and a CNN-LSTM model composed of multiple 1D CNN models each given a subset of the input were combined to multiple layers of LSTM and topped with a dense layer for the classification. The dataset used is composed of 15 activities: Toothbrushing, Cleaning, Cooking, Doing the dishes, Drinking, Eating, Making Tea, Putting on Jacket, Putting on shoes, Reading, Sleeping, Taking Medication, Using Computer, Walking, Washing Hands. These activities were performed by ten different participants in a fully furnished environment. Since LOSO cross validation was used, the model was trained and tested ten different times (one for each participant). The model achieved performances ranging from 30% to 43% in top-1 accuracy depending on which participant was used as a test, but reached up to 90% in top-5 accuracy. This result offers a baseline to compare the model developed in this work. In part, this proposed study explores what was left out of the previous work, investigating if minimally processed UWB radar data could improve the accuracy of the activity recognition without losing generalization and investigating different deep learning models and their hyperparameters.
3.Experimental setup
The datasets used for the proposed work were recorded at the LIARA laboratory (the data used in this paper were collected as part of a project (#2019-220) reviewed and approved by our institution’s ethics committee). This laboratory includes an apartment composed of more than a hundred different sensors (e.g., passive infrared sensors, contact sensors, radio frequency identification transponders, and antennas), and effectors (e.g., lights, speakers, screens) within an area of about
In this work three UWB radars (i.e. XeThru X4M20011 designed by Novelda) have been installed in the smart apartment at various strategic locations to monitor the ADLs at the specific height of 36 cm, which corresponds to the height of power outlets. Figure 1 shows the blueprint of the apartment where the locations of the three UWB radars are indicated by red circles. However, the other sensors, while still present in the environment, were not used in this specific research.
Fig. 1.
The blueprint of the LIARA smart apartment showing the locations of the UWB radars [19] and the locations of the movements recordings respectively circled in red and blue.
![The blueprint of the LIARA smart apartment showing the locations of the UWB radars [19] and the locations of the movements recordings respectively circled in red and blue.](https://content.iospress.com:443/media/ais/2022/14-3/ais-14-3-ais210462/ais-14-ais210462-g001.jpg)
XeThru X4M200 UWB radars were chosen thanks to their interesting hardware technical capabilities compared to their relatively affordable price (i.e. $ 300 US per unit). Indeed, these radars use a transceiver sending signals within a 6.0 GHz to 10.2 GHz band, making them capable of operating at a range between 0.4 m and 9.8 m. Such a range is divided into 184 bins per frame, which means that each bin has a resolution of 5.14 cm. The radars were configured to acquire these frames at a 50 Hz frequency. An example of the raw data acquired from one radar is provided by Fig. 2.
![A single frame recorded by a XeThru X4M200 when placed in the smart environment [19].](https://content.iospress.com:443/media/ais/2022/14-3/ais-14-3-ais210462/ais-14-ais210462-g002.jpg)
3.1.Activity recognition
In the first place, we focused on collecting data related to ADLs only. In order to achieve this data collection, ten participants, all being healthy adults under the age of 40, were asked to perform a total of 15 activities with no specific indication as to how long each activity should take to complete and how they should be performed. Therefore, a high variation between the different completions of the same activity is expected in order to obtain a more realistic dataset. All activities and their respective duration are shown in Table 1.
Table 1
Activities recorded during the collection of the first dataset and their respective duration
| Activity | Minimum duration (s) | Maximum duration (s) | Average duration (s) |
| Drinking | 15 | 28 | 26.6 |
| Sleeping | 38 | 58 | 55.2 |
| Putting on Jacket | 21 | 29 | 26.5 |
| Cleaning | 92 | 118 | 115 |
| Cooking | 231 | 299 | 291.3 |
| Making Tea | 129 | 178 | 169 |
| Doing the Dishes | 98 | 118 | 114.9 |
| Brushing teeth | 120 | 179 | 171.8 |
| Washing hands | 21 | 29 | 26.8 |
| Reading | 97 | 118 | 114.2 |
| Eating | 76 | 118 | 113.4 |
| Walking | 22 | 29 | 26.9 |
| Putting on Shoes | 27 | 43 | 40.7 |
| Taking Medication | 13 | 28 | 25.7 |
| Using Computer | 93 | 118 | 114.5 |
3.2.Movement recognition
In a second time, since activities may be seen as a set of actions involving several movements to be performed, we have considered that the recording of an additional dataset containing only movements. To this end, we considered interesting to suggest an evaluation of the ability of the model architecture introduced in this work to recognize relatively fine-grained movements. For that purpose, ten strategic locations were identified in the apartment where a single participant, selected from the 10 available, was ask to perform several arm movements, in a static position, with the three UWB radars placed first at 36 cm. The same procedure involving the same participant has been then repeated with the three UWB radars placed at 96 cm from the floor. The ten strategic locations are represented by blue circles in Fig. 1. For each of these locations, a total of four arm movements were achieved two times (i.e. one for each height of the UWB radars) over a period of 30 s. A detailed description of each movement is provided by Table 2. Besides, as the bathroom remains the only room in the apartment with a door, the recording of the four movements was completed twice for locations 9 and 10, either with the door open and closed.
Table 2
Details of the various movements recorded during the collection of the second dataset
| Movement | Height of the radars | Description |
| 36 cm & 96 cm | No movement: arms and forearms are placed along the body and the feet remain still. | |
| 36 cm & 96 cm | Fine movements: arms are along the body, the forearms are placed in front of the person and the feet remain still. The movements are constrained to the wrists and hands (including fingers). | |
| 36 cm & 96 cm | Medium-sized movements: arms are along the body, the forearms are placed in front of the person and the feet remain still. The movements are constrained to the forearms, wrists and hands. | |
| 36 cm & 96 cm | Large movements: the feet remain still. The movements are constrained to the arms, forearms, wrists and hands. |
4.Proposed system
4.1.Data pre-processing
In image recognition tasks, the input images used are usually RGB images with a shape varying from 150 by 150 pixels to 300 by 300 pixels. For this work, 15 s of consecutive UWB radar recordings were considered sufficient for the task of activity recognition. Since the sampling rate of the UWB radars was set to 50 frames per second, the unprocessed input shape is 750 samples by 184 bins as shown in Fig. 3.
Fig. 3.
Scattering matrix of all frames recorded by a single UWB radar over period of 15 seconds [19].
![Scattering matrix of all frames recorded by a single UWB radar over period of 15 seconds [19].](https://content.iospress.com:443/media/ais/2022/14-3/ais-14-3-ais210462/ais-14-ais210462-g003.jpg)
The following method was used to pre-process the raw data into input images that have a shape similar to the one generally used for image recognition:
1. 15 s from each UWB radar are combined to form a single array of shape
2. To reduce the size of the array, MaxPooling is done on the time axis for each UWB data reducing the size on the time axis from 750 to 150, resulting in an array of shape
3. In order to subtract the background (the environment is fully furnished) from the data, the first frame was subtracted to all other frames in the array.
4. The array is normalized, based on the minimum value and the maximum value present in the whole array.
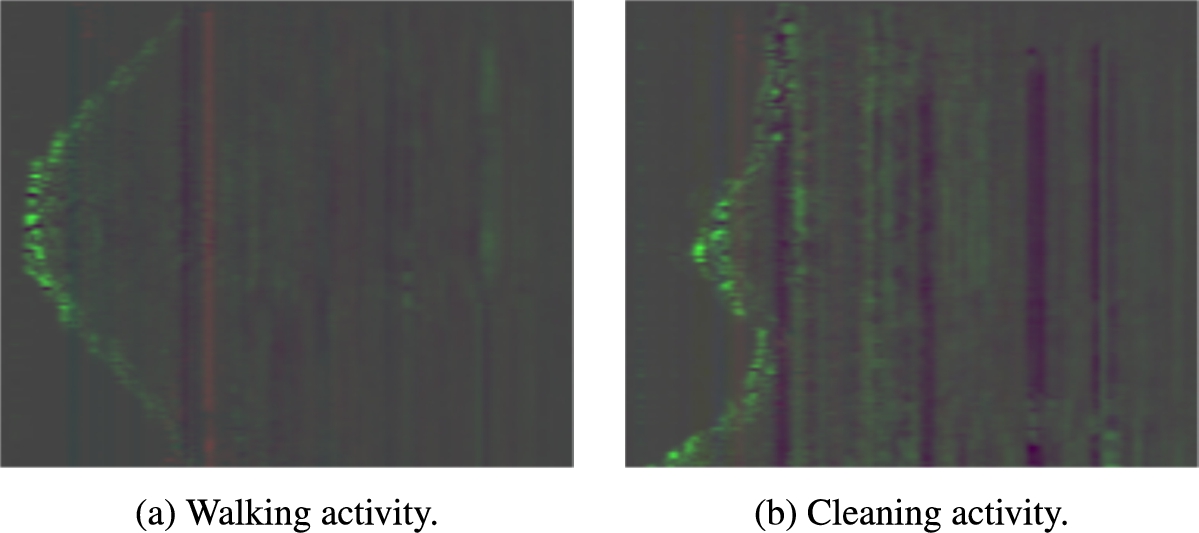
The resulting array, displayed as an RGB image where each UWB radar represents a color channel, is shown in Fig. 4. In this figure, two activities are shown. The first activity is Walking and the second is Cleaning. It is interesting to see that for the activity Walking, the person is getting nearer to a specific UWB radar, then getting further. Also, in the Cleaning activity, it is possible to see that the person is going back and forth near one of the UWB radars, and that some furniture was probably moved in front of another.
Fig. 4.
Pre-processed UWB radar data taken from activity (a) Walking and (b) Cleaning.
For the activity recognition dataset only, the position of the participants was computed using trilateration [1] along with the Range-Domain data provided by the UWB radars. From this algorithm, five data fields are provided: the position of the person in the environment (two fields) and the estimated distance of the person relative to each UWB radar (three fields being one per UWB radar). The position of the person is computed once every second and the same 15 s of data is used. Therefore, the output shape of the position data is
As shown in Table 1, some activities take naturally longer to perform than others. This difference is particularly noticeable between some activities such as, Drinking and Cooking. Hence, in order to avoid an unbalanced dataset, a fixed number of 100 samples were extracted from each recorded activity. Moreover, since the 100 samples are evenly distributed, it therefore guarantees that the entire activity is covered each time. However, since none of the recorded activities have identical duration, the overlap between two samples may vary from one activity to another.
4.2.Model architecture
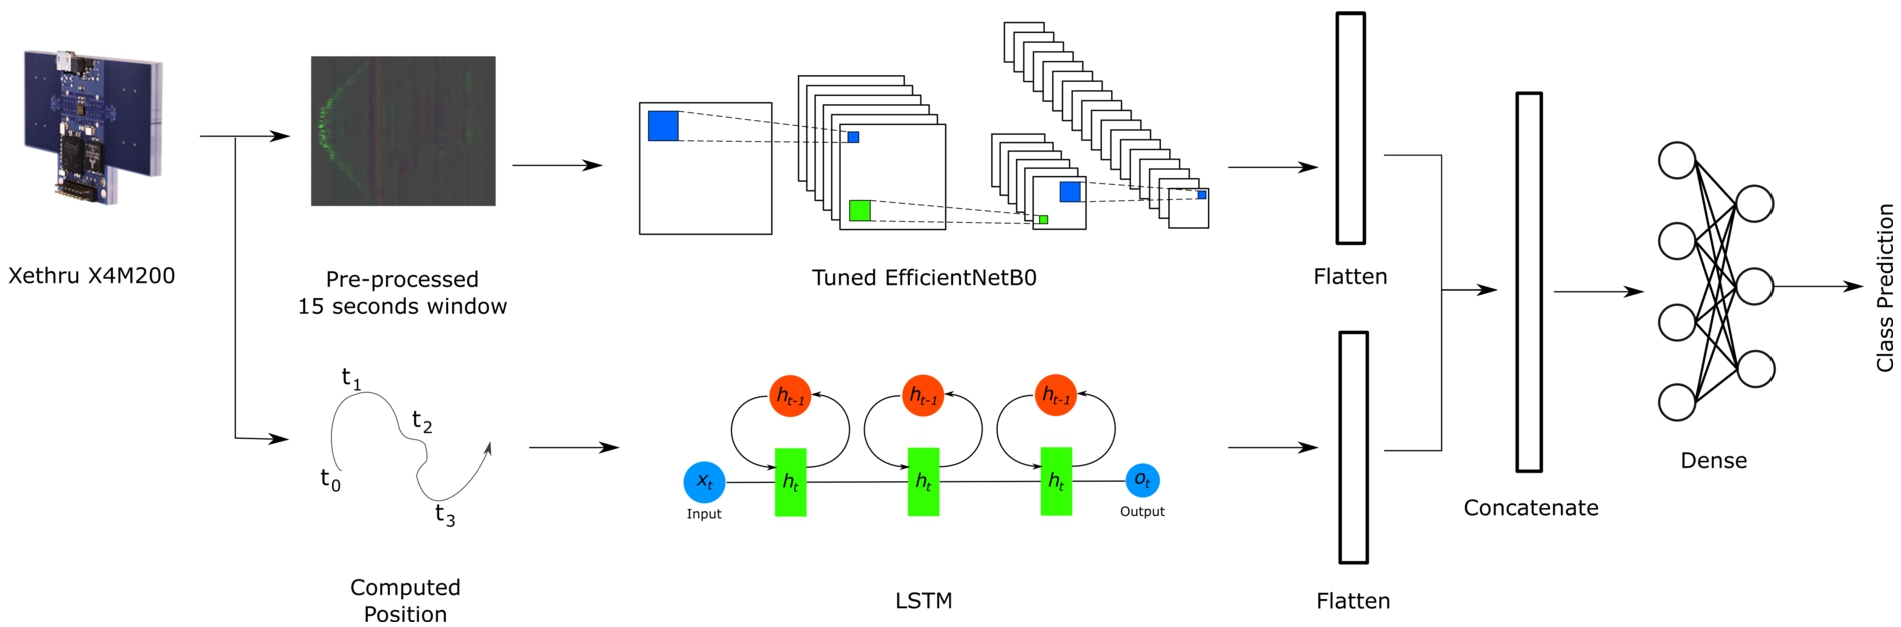
The proposed model is composed of two different parts. The first part, which is a CNN, exploits the pre-processed dataset. The other part, which is an LSTM, exploits the computed location of the participant in the dataset.
The first phase of the development was hence to identify which CNN model performed the best on the dataset. Keras22 [18] contains many implementations of largely used deep learning models. For this test, VGG16 [17], VGG19 [17], Xception [7] and EfficientNet B0 through B6 [27] were tested on a subset of the dataset. Since in other works autoencoders have shown great promise [24], a CNN autoencoder was built and trained for comparison. An autoencoder is trained to encode and decode the input. The principle is that the main features of the input data end up being encoded at the center of the model. In order to classify, the decoder part is dropped and replaced by one or more dense layers and trained again using transfer learning. The architecture of the resulting classifier is shown in Table 3. The preliminary results for identifying the best model are shown in Table 4.
Table 3
The detailed structure of the layers that compose the classifier built from the trained autoencoder model
| Layer ID | Layer name | Output shape |
| 1 | Input | 150, 184, 3 |
| 2 | Zero_Padding | 152, 184, 3 |
| 3 | Convolution_1 | 152, 184, 32 |
| 4 | Max_Pooling_1 | 76, 92, 32 |
| 5 | Convolution_2 | 76, 92, 64 |
| 6 | Max_Pooling_2 | 38, 46, 64 |
| 7 | Convolution_3 | 38, 46, 128 |
| 8 | Flatten | 223744 |
| 9 | Dense_1 | 200 |
| 10 | Dropout_1 | 200 |
| 11 | Dense_2 | 50 |
| 12 | Dropout_2 | 50 |
| 13 | Output | 15 |
Table 4
Performances of various built-in models in Keras on a subset of the first dataset containing activities only
| Built-in | Accuracy |
| VGG16 | 0.08 |
| VGG19 | 0.08 |
| Xception | 0.55 |
| EfficientNetB0 | 0.63 |
| EfficientNetB4 | 0.61 |
| EfficientNetB5 | 0.62 |
| EfficientNetB6 | 0.6 |
| CNN autoencoder | 0.55 |
Based on the preliminary results, EfficientNetB0 was identified as the most promising model. EfficientNet [27] proposed a way of scaling up a CNN network. The proposed composite scaling method scales the depth, width and resolution of the model. EfficientNetB0 refers to the baseline model proposed by Mingxing and Quoc [27] which optimizes accuracy and Floating Point Operations per Second (FLOPS). The choice of EfficientNetB0 makes sense, since larger models would be more fitted for more massive datasets and could lead to overfitting on smaller datasets. This means that while EfficientNetB0 is selected for this work, future improvements on the dataset could lead to different scaled models to perform better.
In a CNN, kernels have a square shape and a depth corresponding to the number of channels. The reason behind this is versatility, since the shape of patterns are unknown and in the case of image recognition, the object to recognize can have any orientation in the input image. In our dataset, we have an insight into the size and orientation of the data. Since we are looking for temporal patterns (evolution of position in the Doppler-Domain data provided by the UWB radars), various kernel shape variations at various layers of the EfficientNetB0 model were tested. Globally, changing the shape of the kernels provided a small improvement over non-tuned EfficientNetB0. For the remainder of this paper, the EfficientNetB0 model with modified kernel shape will be called Tuned EfficientNetB0. It is important to mention that varying the shapes of the kernels was time-consuming and the approach used was non-exhaustive. This means that while an improvement is present, a better improvement (a better combination of kernel shapes) could still be made with further tests by considering to achieve an optimization phase of the hyperparameters.
Table 5
The detailed structure of the layers that compose the architecture of the LSTM model
| Layer ID | LayeName | Output shape |
| 1 | Input | 15, 5 |
| 2 | LSTM_1 | 15, 50 |
| 3 | LSTM_2 | 50 |
| 4 | Dense_1 | 100 |
| 5 | Dropout_1 | 100 |
| 6 | Dense_2 | 100 |
| 7 | Dropout_2 | 100 |
| 8 | Dense_3 | 50 |
| 9 | Dropout_3 | 50 |
| 10 | Output | 15 |
For the second half of the model, LSTM has shown good performance in recognizing temporal patterns. Alone, the use of the computed position of the participant in the environment combined with the LSTM model has poor performance. The aim here is not to have state-of-the-art performance, but to provide complementary information to the final model. The architecture of the LSTM is shown in Table 5. A second version of the position dataset was also tested. In this dataset, the minimum, maximum, average and standard deviation of each field in the input was appended (the shape of the position dataset was hence increased to
Both models are combined, flattened, and fed to a dense layer for classification. The final architecture of the model is displayed in Fig. 5.
Fig. 5.
Graphical representation of the architecture of the complete proposed model.
5.Results & discussion
In order to achieve the activity recognition process, the model was trained in three separate phases. In the first one, the pre-processed dataset was used for the training of the Tuned EfficientNetB0 model. The second phase, involved to train the LSTM model using only the location dataset. Finally, transfer learning was applied from the two previous phase to the complete Tuned EfficientNet model with LSTM. In this last scenario, the weight of all the layers that are before the classification layers (i.e. the dense layers at the end of the model) are copied to the new model. In this last phase, the training of the complete model begins by freezing the non-classification layers for half the training period. This allows the dense layers to be updated without having to modify the previously trained models. In the second half of the training, the whole model is unfrozen for optimization purposes. The main reason a multi-phase training like this was performed is to avoid overfitting that may result from such a complex architecture. As regards the movement recognition only, the same methodology was applied except for the training phase of the LSTM model since the positions were not necessary for that purpose.
5.1.Human activity recognition
In the context of human activity recognition (HAR), both the LSTM and Tuned EfficientNet models were trained over a period of 25 epochs with a batch size of 16. These two trainings were also completed empirically over several epochs (up to 100). However, we observed that the best results were obtained in the first 20 epochs. This finding was expected since the EfficientNet technique is known to be prone to overfitting. As a result, the final model training was performed over a period of 40 epochs, being 20 epochs for the frozen and 20 epochs for the unfrozen non-classification layers. Every model training was completed using a Nvidia GeForce GTX 1080, and took 20 min for the LSTM model alone, 95 min for the Tuned EfficientNetB0 model alone and 65 min for the entire model. In that sense, a single fold of LOSO cross-validation took around 3 hours to train and a total of 30 hours was required to train all LOSO folds.
Since there are a few number of samples, it was determined that the best way to show the ability of the model to generalize was to test the performance of the model with LOSO cross-validation. In the case of a 70-15-15 training, testing and validation split, data that are very similar would have been present in the training, testing and validation set. In other terms, two instances from an activity performed by one person with a slightly different starting time contain roughly the same information. This would only have measured the ability of the model to overfit the data and not measure how well it can generalize.
Since ten participants were involved in the creation of the dataset, the dataset was split in ten different subsets to perform LOSO cross-validation. Each model was trained on each dataset. Additionally, the Top-5 results are used to measure the performances. The previous work [19] revealed that some activities were hard to identify by the different models and confusion existed between similar activities such as Cooking and Making Tea. For this reason, the Top-5 results returned by the models were used to compare the performance of the models as such an evaluation allows to determine the possibility of combining independent activities with a high degree of similarities. The average Top-5 accuracy (overall LOSO folds) of each model is shown in Fig. 6a.
Fig. 6.
Overview of the results obtained for the movement recognition when compared to LSTM, CNN-LSTM, EfficientNetB0 and TunedEfficientNetB0 models, where (a) is the Top-5 average accuracy; (b) is the Top-5 maximum accuracy; (c) is the Top-5 minimum accuracy and (d) is the Top-5 standard deviation of the accuracy.
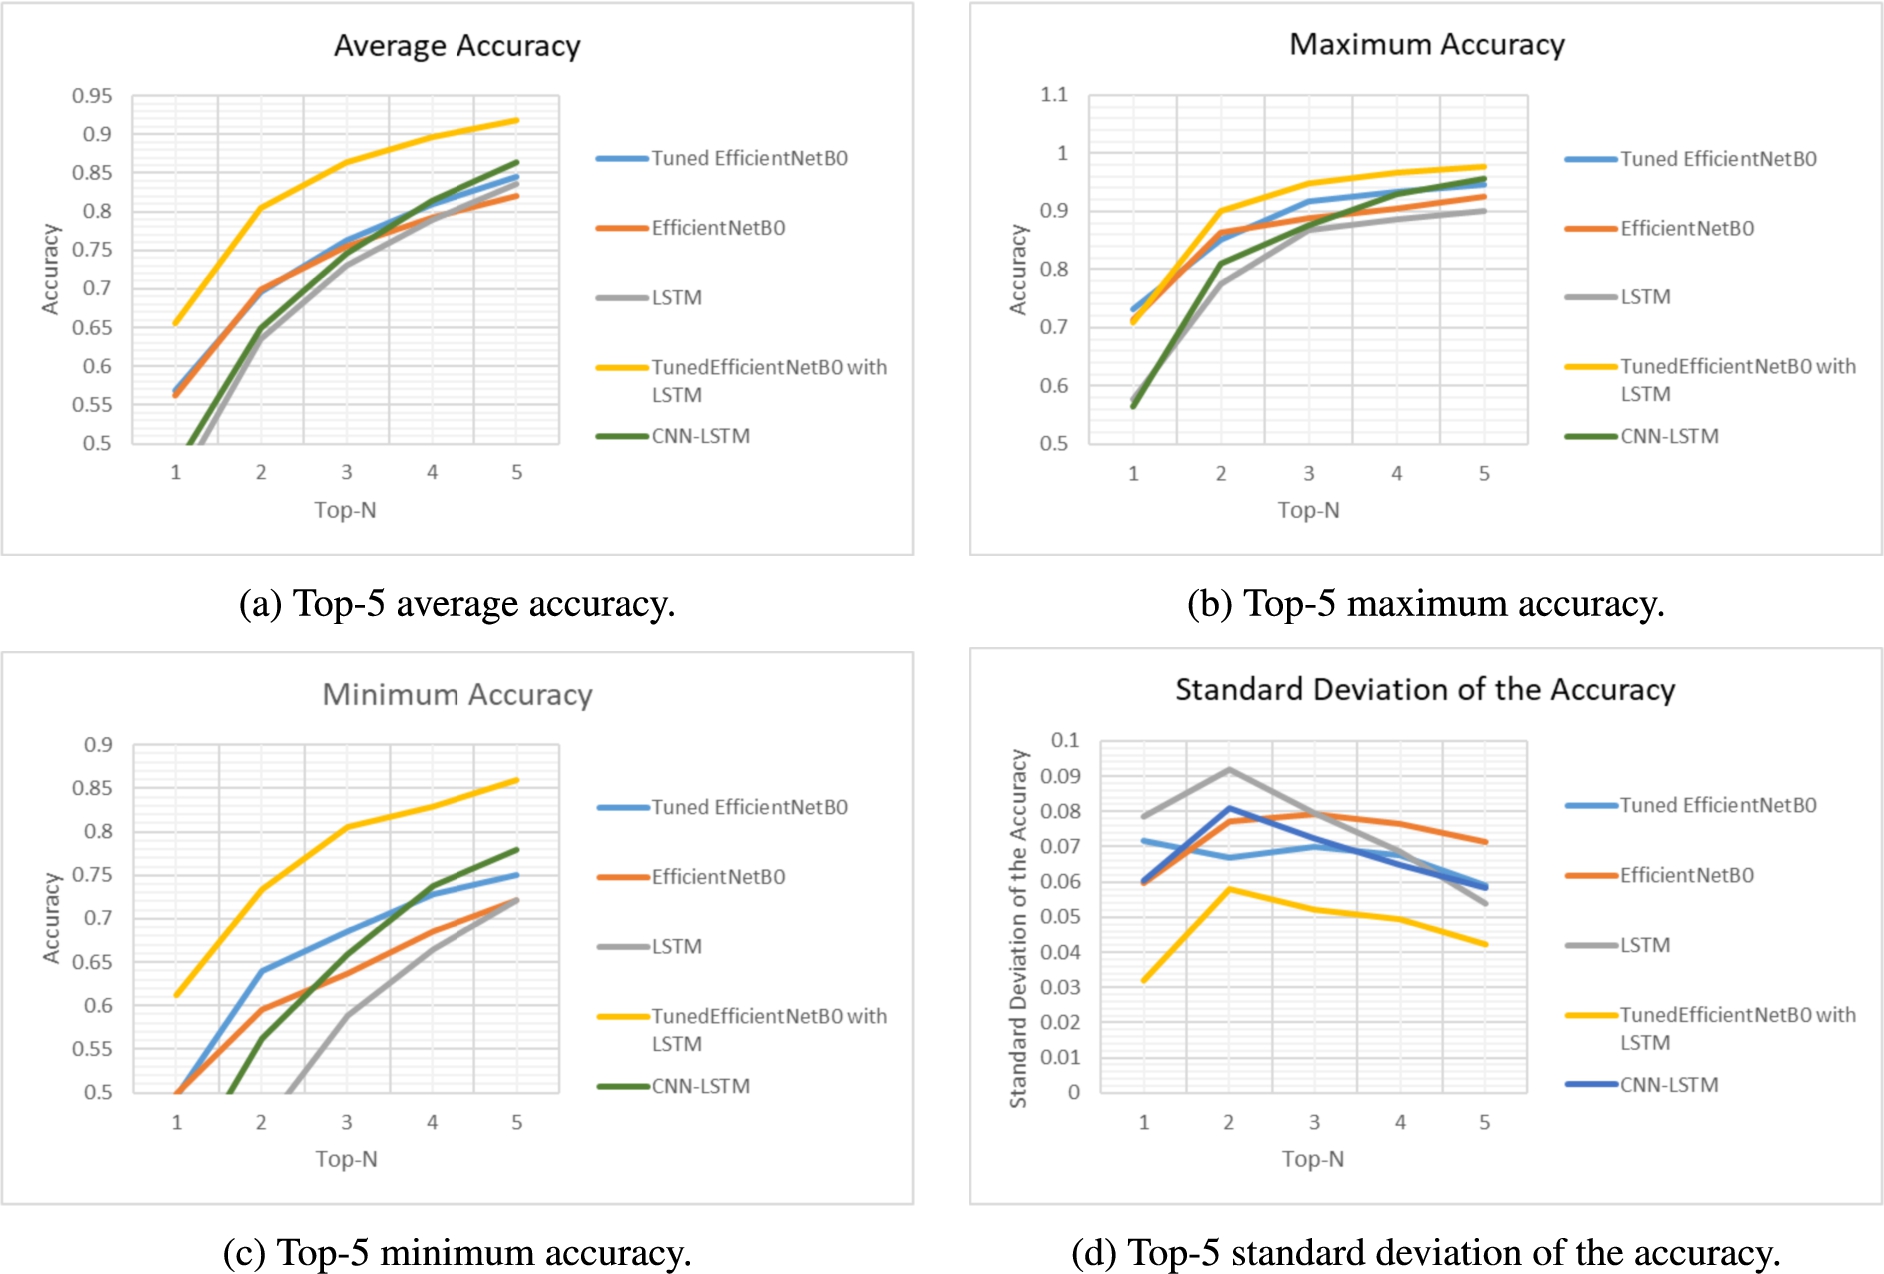
The proposed model performed better than the baseline model, increasing the average Top-1 accuracy from 46.96% to 65.59% which corresponds to a 18.63% increase in Top-1 accuracy. While the difference between the performance of the proposed model and the baseline gets smaller further in the Top-N, the proposed model showed an advantageous increase of 5.54% over the baseline model. Along with the average accuracy, the proposed model kept performing better on maximum accuracy, as shown in Fig. 6b and minimum accuracy as shown in Fig. 6c. The most notable increase in performance occurs in the Top-1 minimum accuracy, which increased 21.5%. Hence, it shows that the proposed model generally performs much better on each of the ten LOSO folds. Finally, the standard deviation of the accuracy of the model as shown in Fig. 6d is consistently lower than the other models, indicating that the model is much more stable.
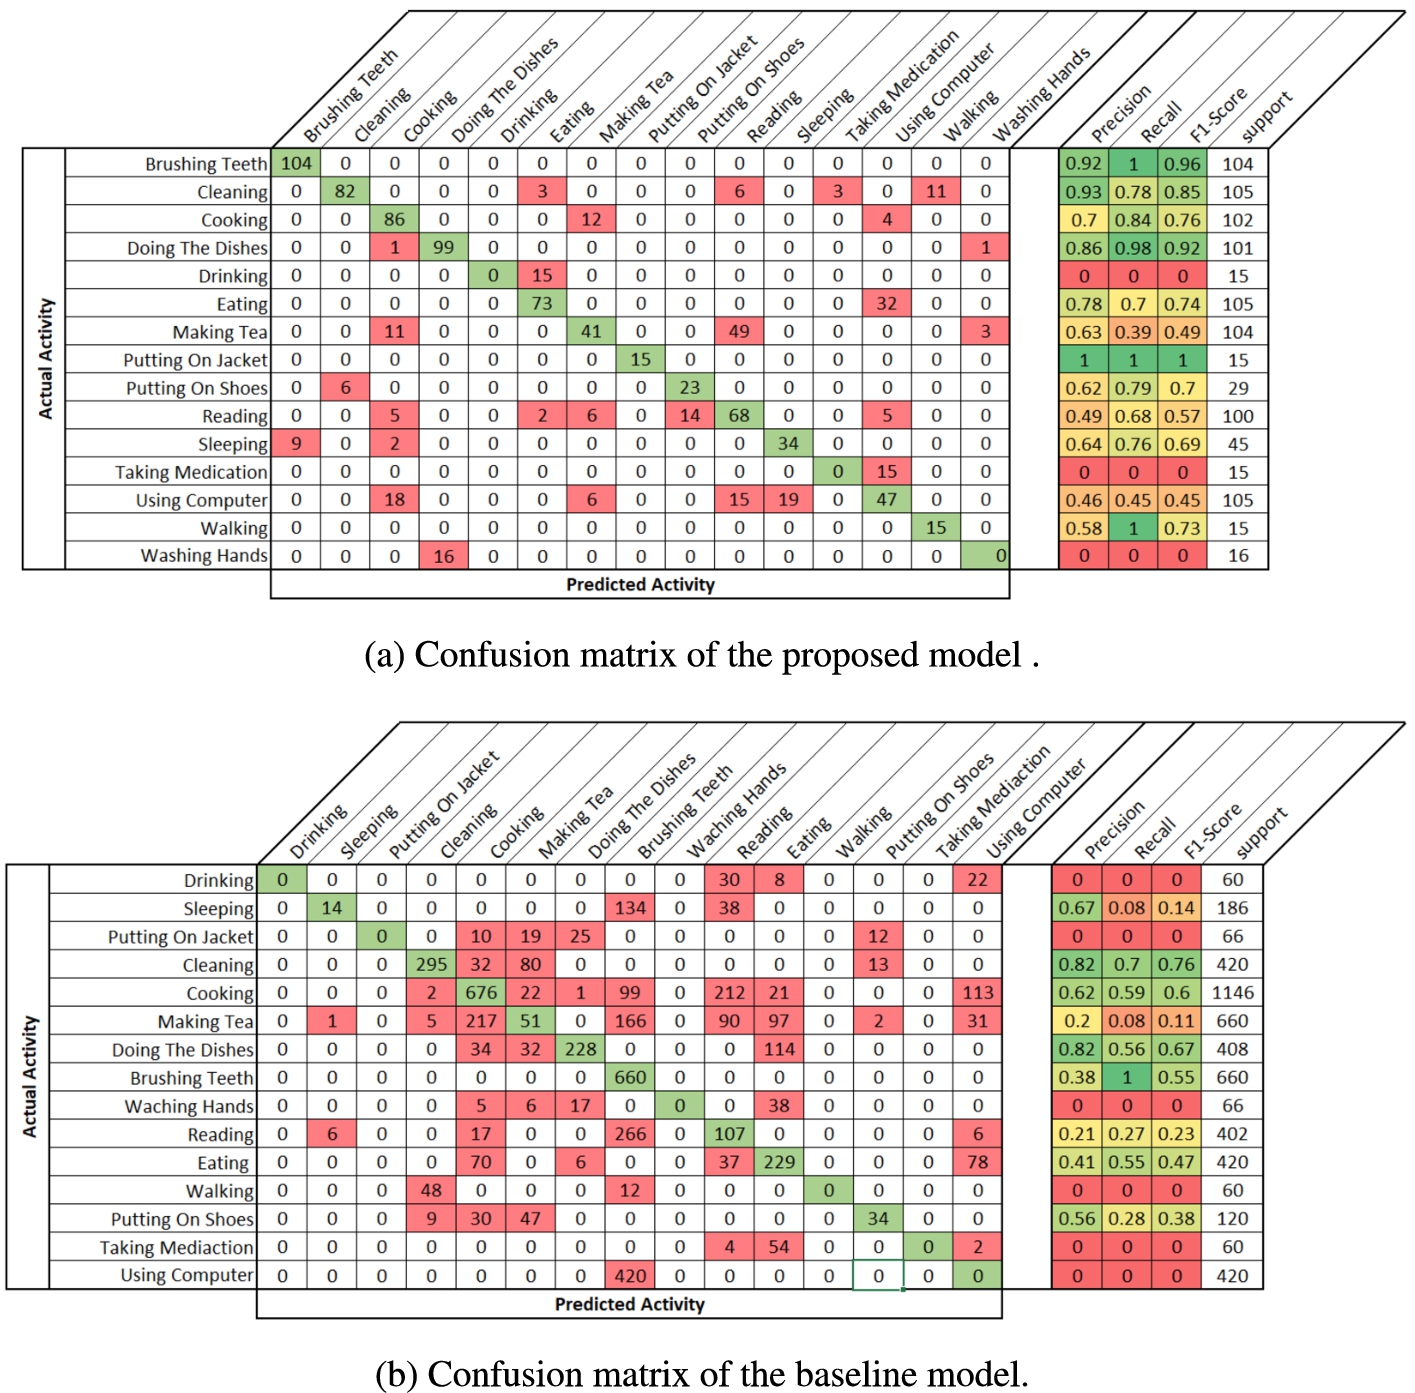
Despite the general increase in accuracy provided by the proposed models, the results show that certain activities are still hard to detect. The confusion matrix of the Top-1 of the proposed model on the LOSO 1-fold (i.e. participant 1 is used for testing set) is shown in Fig. 7a and the confusion matrix of the Top-1 of the baseline model on the LOSO 1-fold is shown in Fig. 7b. It is important to note here that while not all LOSO fold results are the same, they all show these limitations (i.e. some activities, no matter what improvements are made to the system, will remain difficult to recognize). The confusion matrices show that tremendous improvement was made for the recognition of the activities: Putting on Jacket, Walking and Using Computer which were not recognized with the baseline model. However, some activities are still not recognized, namely Drinking, Washing Hands and Taking Medication. These activities have some points in common. Firstly, they are shorter than most of the other ones. Secondly, by definition they contain fewer “macro” movements such as legs movements and can be performed anywhere at more than one location in the apartment.
Fig. 7.
Confusion matrices of the Top-1 of both the proposed model (a) and the baseline model (b) on the dataset with the first person left out.
5.2.Movement recognition
The movement data were processed following the same protocol as for activity recognition described previously. The dataset was, however, split into 12 Leave-One-Out (LOO) cross-validation sets, being one set by location (
Table 6
Overall accuracy of the Tuned EfficientNetB0 model with and without transfer learning when computed over the movement dataset using a LOSO cross-validation strategy
| Tuned EfficientNetB0 model | Top-1 | Top-2 | Top-3 |
| Tuned EfficientNetB0 without transfer learning | 0.56 | 0.8 | 0.91 |
| Tuned EfficientNetB0 with transfer learning | 0.73 | 0.89 | 0.96 |
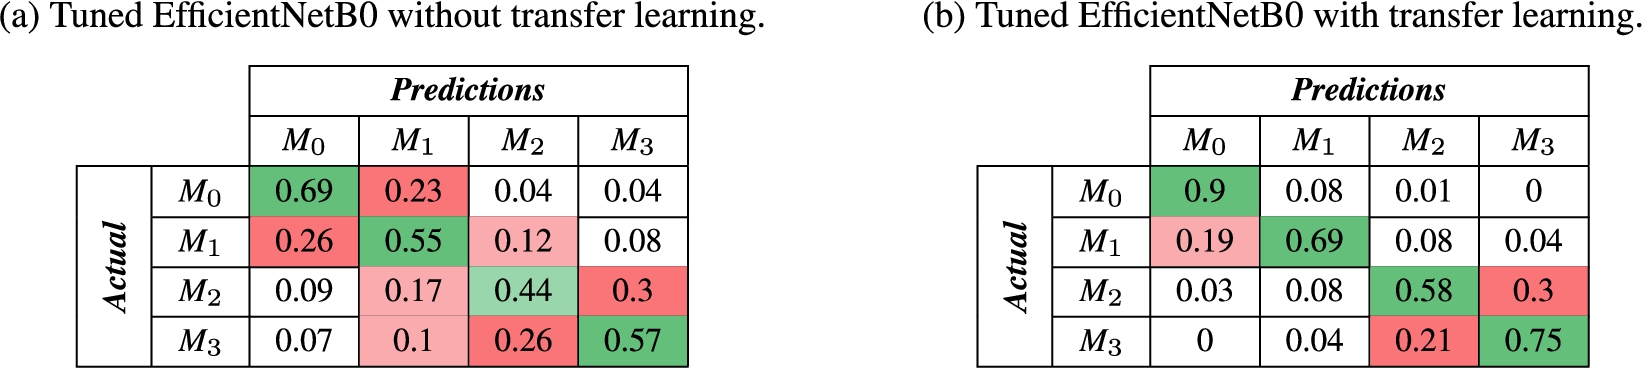
Through such results, it is possible to observe that the proposed method is capable of recognizing movements in a fairly accurate way. In addition, based on the confusion matrices given in Table 7, it appears that the proposed Tuned EfficientNetB0 model is able to extract the key features of the movements to be recognized from the UWB data with more accurate results obtained when using the transfer learning strategy. Nevertheless, we believe that due to a small difference between these four different movements, such a model may offer better results in a context closer to the movements that are performed in real activities. Besides, since this experiment was reproduced by positioning the UWB sensors closer to the arms movement (at a height of 96 cm from the ground) we have observed an improvement of 2.1% and 4.4% in Top-1 recognition accuracy for the strategies with and without transfer learning respectively, thus supporting the hypothesis that these four movements admit too much similarities.
Table 7
Confusion matrices that express the percentage of recognition obtained using the Tuned EfficientNetB0 model with (a.) and without (b.) transfer learning for each movements as described in Table 2 using a LOSO cross-validation strategy
Finally, to carry out an in-depth study of the model proposed in this work, a last evaluation was performed in order to identify the locations in the apartment where the movements are most easily recognized. Hence, Table 8 exposes detailed results of the movement recognition for the two learning strategies and for each location in the apartment as illustrated in Fig. 1. Once again, the transfer learning strategy demonstrated a significantly better accuracy. However, it is possible to observe that the movements, when they are performed in locations that meet the field of operation of a single UWB radar, are less precisely recognized (e.g.,
Table 8
Results obtained using the Tuned EfficientNetB0 model with (a) and without (b) transfer learning for each location identified in Fig. 1 with either an open (
| (a) Tuned EfficientNetB0 without transfer learning | (b) Tuned EfficientNetB0 with transfer learning | ||
| Location | Accuracy | Location | Accuracy |
| 0.67 | 0.9 | ||
| 0.65 | 0.86 | ||
| 0.62 | 0.84 | ||
| 0.6 | 0.83 | ||
| 0.58 | 0.79 | ||
| 0.58 | 0.76 | ||
| 0.58 | 0.7 | ||
| 0.52 | 0.68 | ||
| 0.51 | 0.66 | ||
| 0.5 | 0.64 | ||
| 0.47 | 0.64 | ||
| 0.45 | 0.46 | ||
6.Limitations
While improvements were undoubtedly made with the proposed work over the previous one, several other ones are still required to develop practical applications capable of recognizing ADLs efficiently. First, the recorded datasets proposed in this work remain quite limited. Indeed, the nature of the activities and the way they were captured have introduced a high variability between each participant’s record of the same activity, which is generally not optimal in small datasets such ours, but profitable in larger ones. In addition, the nature of ADLs leads to a combination of movements that are inherent to the location of both strategic appliances and furniture. However, a true generalization of algorithms designed for ADL recognition requires datasets composed of activities recorded in a wide variety of environments. Therefore, future work will be to create new datasets that include more people, more instances per activity as well as more diverse environments.
Moreover, the work we proposed was primarily focused on the research and adaptation of ready-to-use deep learning models for ADL recognition. However, we have explored only a fraction of all the deep learning architectures that are potentially suitable for the ADL recognition problem. Thus, based on the findings of this work, future work may also involve building a truly optimized model for the recognition of ADLs using data recorded from UWB radars.
7.Conclusion
In this paper, we proposed a deep learning model combining EfficientNetB0 and LSTM neural networks using transfer learning and minimalist data pre-processing in order to recognize ADLs from data generated by UWB radars inside a smart apartment. Our proposed model completed such a task with 65.59% Top-1 accuracy, surpassing by 18.63% the performance of our previously developed model [19]. Furthermore, in this work, a detailed analysis of the behavior of the proposed architecture for movement recognition has also been suggested. Obtained results demonstrated that most of the four proposed arm movements were accurately identified. However, due to a low variation of medium-sized movements compared to fine movements as well as large movements, we were able to observe that the overall performance of the proposed model was significantly degraded by such movements.
Acknowledgement
The authors would like to thank the Ministère de l’Économie et de l’Innovation from the government of the province of Québec, Canada for the grant that made this project possible. The authors would also like to thank Moonshot Health for their contribution to this project.
Conflict of interest
The authors have no conflict of interest to report.
References
[1] | A. Alarifi, A. Al-Salman, M. Alsaleh, A. Alnafessah, S. Al-Hadhrami, M.A. Al-Ammar and H.S. Al-Khalifa, Ultra Wideband Indoor Positioning Technologies: Analysis and Recent Advances, Sensors 16(5) (2016). doi:10.3390/s16050707. |
[2] | Alzheimer’s Association, Alzheimer’s disease facts and figures, Alzheimer’s & Dementia 14: (3) ((2018) ), 367–429. doi:10.1016/j.jalz.2018.02.001. |
[3] | S. Aminikhanghahi and D.J. Cook, Enhancing activity recognition using CPD-based activity segmentation, Pervasive and Mobile Computing 53: ((2019) ), 75–89. doi:10.1016/j.pmcj.2019.01.004. |
[4] | G. Bhat, R. Deb, V.V. Chaurasia, H. Shill and U.Y. Ogras, Online human activity recognition using low-power wearable devices, in: Proceedings of the International Conference on Computer-Aided Design (ICCAD 18), ACM, (2018) , pp. 1–8. doi:10.1145/3240765.3240833. |
[5] | G. Brunner, D. Melnyk, B. Sigfússon and R. Wattenhofer, Swimming style recognition and lap counting using a smartwatch and deep learning, in: Proceedings of the 23rd International Symposium on Wearable Computers (ISWC 19), ACM, (2019) , pp. 23–31. doi:10.1145/3341163.3347719. |
[6] | B. Bruno, B. Kévin and B. Abdenour, A smart range helping cognitively-impaired persons cooking, in: Twenty-Sixth IAAI Conference, (2014) . |
[7] | F. Chollet, Xception: Deep learning with depthwise separable convolutions, in: 2017 IEEE Conference on Computer Vision and Pattern Recognition (CVPR), IEEE, (2017) , pp. 1800–1807. doi:10.1109/CVPR.2017.195. |
[8] | M. Danushka, M. Rivindu, S. Chathuranga and G. Kutila, Real-time multimodal ADL recognition using convolution neural networks, The Visual Computer 39: ((2021) ), 1263–1276. doi:10.1007/s00371-020-01864-y. |
[9] | G. De Leonardis, S. Rosati, G. Balestra, V. Agostini, E. Panero, L. Gastaldi and M. Knaflitz, Human activity recognition by wearable sensors: Comparison of different classifiers for real-time applications, in: 2018 IEEE International Symposium on Medical Measurements and Applications (MeMeA), IEEE, (2018) , pp. 1–6. doi:10.1109/MeMeA.2018.8438750. |
[10] | G. Ercolano, D. Riccio and S. Rossi, Two deep approaches for ADL recognition: A multi-scale LSTM and a CNN-LSTM with a 3D matrix skeleton representation, in: 2017 26th IEEE International Symposium on Robot and Human Interactive Communication (RO-MAN), IEEE, (2017) , pp. 877–882. doi:10.1109/ROMAN.2017.8172406. |
[11] | M. Gabrielli, P. Leo, F. Renzi and S. Bergamaschi, Action recognition to estimate Activities of Daily Living (ADL) of elderly people, in: 2019 IEEE 23rd International Symposium on Consumer Technologies (ISCT), IEEE, (2019) , pp. 261–264. doi:10.1109/ISCE.2019.8900995. |
[12] | D. Gholamiangonabadi, N. Kiselov and K. Grolinger, Deep neural networks for human activity recognition with wearable sensors: Leave-one-subject-out cross-validation for model selection, IEEE Access 8: ((2020) ), 133982–133994. doi:10.1109/ACCESS.2020.3010715. |
[13] | D. Hao, J. Tian, H. Yuan, S. Yongping and D. Yongpeng, Segmented convolutional gated recurrent neural networks for human activity recognition in ultra-wideband radar, Neurocomputing 396: ((2020) ), 451–464. doi:10.1016/j.neucom.2018.11.109. |
[14] | N. Irvine, C. Nugent, S. Zhang, H. Wang and W.W.Y. NG, Neural network ensembles for sensor-based human activity recognition within smart environments, Sensors 20(1) (2020). doi:10.3390/s20010216. |
[15] | B. Jokanović and M. Amin, Fall detection using deep learning in range-Doppler radars, IEEE Transactions on Aerospace and Electronic Systems 54: (1) ((2018) ), 180–189. doi:10.1109/TAES.2017.2740098. |
[16] | O.-v.H. Julia, S. Eva-Maria and Z. Martina, Bare necessities? How the need for care modulates the acceptance of ambient assisted living technologies, International Journal of Medical Informatics 127: ((2019) ), 147–156. doi:10.1016/j.ijmedinf.2019.04.025. |
[17] | S. Karen and Z. Andrew, Very deep convolutional networks for large-scale image recognition, in: 3rd International Conference on Learning Representations, ICLR 2015, Conference Track Proceedings, San Diego, CA, USA, May 7–9, 2015, B. Yoshua and L. Yann, eds, (2015) . |
[18] | N. Ketkar, Introduction to keras, in: Deep Learning with Python, Apress, Berkeley, CA, (2017) , pp. 97–111. doi:10.1007/978-1-4842-2766-4_7. |
[19] | J. Maitre, K. Bouchard, C. Bertuglia and S. Gaboury, Recognizing activities of daily living from UWB radars and deep learning, Expert Systems with Applications 164: ((2021) ), 113994. doi:10.1016/j.eswa.2020.113994. |
[20] | J. Maitre, K. Bouchard and S. Gaboury, Fall detection with UWB radars and CNN-LSTM architecture, IEEE Journal of Biomedical and Health Informatics 25: (4) ((2021) ), 1273–1283. doi:10.1109/JBHI.2020.3027967. |
[21] | L. Minh Dang, K. Min, H. Wang, M. Jalil Piran, C. Hee Lee and H. Moon, Sensor-based and vision-based human activity recognition: A comprehensive survey, Pattern Recognition 108: ((2020) ), 0031. doi:10.1016/j.patcog.2020.107561. |
[22] | V. Paula, Not ageing in place: Negotiating meanings of residency in age-related housing, Journal of Aging Studies 35: ((2015) ), 55–64. doi:10.1016/j.jaging.2015.07.004. |
[23] | L. Peng, L. Chen, Z. Ye and Y. Zhang, AROMA: A deep multi-task learning based simple and complex human activity recognition method using wearable sensors, Proc. ACM Interact. Mob. Wearable Ubiquitous Technol. 2: (2) ((2018) ), 1–16. doi:10.1145/3214277. |
[24] | H. Sadreazami, M. Bolic and S. Rajan, Fall detection using standoff radar-based sensing and deep convolutional neural network, IEEE Transactions on Circuits and Systems II: Express Briefs 67: (1) ((2020) ), 197–201. doi:10.1109/TCSII.2019.2904498. |
[25] | G.L. Santos, P.T. Endo, K.H.d.C. Monteiro, E.d.S. Rocha, I. Silva and T. Lynn, Accelerometer-Based Human Fall Detection Using Convolutional Neural Networks, Sensors 19(7) (2019). doi:10.3390/s19071644. |
[26] | G. Sprint, D.J. Cook, R.S. Fritz and M. Schmitter-Edgecombe, Using smart homes to detect and analyze health events, Computer 49: (11) ((2016) ), 29–37. doi:10.1109/MC.2016.338. |
[27] | M. Tan and Q.V. Le, EfficientNet: Rethinking model scaling for convolutional neural networks, in: Proceedings of ICML, (2019) . |
[28] | J.D. Taylor and E. Hochdorf, UWB radar definitions and regulations, Chap. 1.4, in: Ultrawideband Radar, CRC Press, Taylor & Francis, (2012) , pp. 5–10. |
[29] | United Nations, Department of Economic and Social Affairs, Population Division, World Population Prospect 2019: Highlights, 2019. |
[30] | Y. Yang, H. Chunping, L. Yue, G. Dai, H. Danyang and X. Jinchen, Open-set human activity recognition based on micro-Doppler signatures, Pattern Recognition 85: ((2019) ), 60–69. doi:10.1016/j.patcog.2018.07.030. |

