


Recent econometric research has found recurring evidence that the international slave trades underdeveloped Africa over the long term, an idea most closely associated with Rodney (Reference Rodney1972) and his book How Europe Underdeveloped Africa. The modern evidence begins with Nathan Nunn’s influential article published in 2008, where he develops new anthropological data on African slave exports in the distant past. Researchers have used these data to identify a number of long term legacies of the slave trades that manifest today in a variety of ways: lower national incomes per capita, greater ethnic diversity, more polygyny as a family organization, heightened conflict and mistrust, underdeveloped access to credit, greater political corruption, and less local schooling.Footnote 1 We do not know if or how these legacies are related, but each constrains growth.
AFRICAN SLAVERY: THE MISSING LINK
This study investigates an important but overlooked immediate outcome of the slave trades, an institutional response (or mechanism) that could carry many of these long-term effects forward—namely, the possibility that the international slave trades spread the institutions of slavery in Africa. This question attracted the attention of historians like Fage (Reference Fage1959, Reference Fage1969, Reference Fage1980), Rodney (Reference Rodney1966), and Lovejoy (Reference Lovejoy2000), and competing anthropological perspectives, like those found in Meillassoux (Reference Meillassoux1971, Reference Meillassoux1991) and Miers and Kopytoff (Reference Miers and Kopytoff1977). Slavery and the institutions that supported it are likely to be carriers of many of the long term effects mentioned previously, yet two recent surveys of the new economic literature on Africa fail to mention a single reference to the institutions of African slavery or a single quantitative assessment of the issues at stake in the debates.Footnote 2
This study bridges this gap in the economic literature. It investigates the effects of international slave trades on the spread and transformation of slavery across the continent of Africa. The analysis focuses on the effects of slave capture and slave trading to ports serving the trans-Atlantic, Indian Ocean, trans-Saharan, and Red Sea slave trades. The empirical design is similar to previous research in this area. All data have a spatial marker. The primary data are observations on the locations and characteristics of African societies circa 1900, found in George Murdock’s Ethnographic Atlas. One of Murdock’s variables (V70) codes whether or not an African society practiced slavery. This is my main dependent variable. I merge this data with spatial data on the international slave trades (circa 1500–1850) and look for meaningful correlations.Footnote 3
First I add estimates of past slave exports from named “ethnicities” found in Nunn and Wantchekon (Reference Nunn and Wantchekon2011).Footnote 4 These data have been used in most of the studies mentioned earlier. Since they are estimates of slave exports that originated in identified regions of Africa, they are useful in estimating spatial variations in exposure to capture and how the probability of capture may have altered African institutions.
Second, I add new data on distances to the nearest international slave port. In this context, distance measures transport and communication cost. Distance has been deployed in this literature as an excluded instrumental variable that helps identify the degree of exposure to (or protection from) the international slave trades. Distance has been measured in a variety of ways, sometimes as inclusion within an arbitrary buffer around an international slave port (e.g., Whatley and Gillezeau Reference Whatley2011b; Whatley Reference Whatley, Akyeampong, Bates, Nunn and Robinson2014; Fenske and Kala Reference Fenske and Kala2015), but most often as a mixture of straight-line distances by land and sea, with mixed results (e.g., Nunn Reference Nunn2008; Nunn and Wantechkon 2011; Whatley and Gillezeau Reference Whatley2011b; Obikili Reference Obikili2016b; Bhattacharyya Reference Bhattacharyya2009; also see footnote 1).
Here I introduce newly-developed data on distance that outperforms straight-line distance in that it identifies outcomes that straight-line distance misses, which explains why the effects of the slave trades on African slavery have eluded econometric investigations thus far, as I shall show later. I develop an estimate of travel time to the nearest port serving one of the four international slave trades. This is a manageable calculation for precolonial Africa because the inland transportation technology was limited to horses, camels, human portage, and canoes. The estimate takes into account the effects of groundcover type (e.g., rainforest versus plains), terrain (uphill or down), river velocity, head-load, and local knowledge about the best path forward. Parameters come from hydrological studies, survey maps, hiking, and headload studies, and travel times recorded by early British ambassadors, missionaries, and explorers. I use these parameters to estimate the hours to travel anywhere on the continent of Africa.
My estimate of travel time differs from two related measures found in the literature. Ozak (Reference Ozak2018) introduces a global measure of distances to pre-industrial technology frontiers, but the measure is not applicable to the African continent. It is based on estimates of “the maximal sustainable speeds of dismounted infantry movements under different temperature, relative humidity, slope, and terrain conditions” before becoming a victim of heat exhaustion (p. 191). As such, the measure closely tracks global distances from the equator and tropics (see fig. 4, p. 192) with corrections for variations in the earth’s slope. All groundcover is assumed to be sand, and there is no accounting for river transportation.
Nunn and Puga (Reference Nunn and Puga2012) calculate the ruggedness of terrain, measured as the average change in elevation around a point on the surface of the earth. They find that only in Africa does this measure of ruggedness exert a positive indirect effect on relative income and population density, which disappears once past slave exports are controlled for. They interpret this result as one driven by movements of population into rugged areas to avoid exposure to the international slave trades, but they present no evidence of population movements during the slave trade era. The spatial distribution of economic activity could just as easily be driven by the negative income and population effects of exposure to slave capture. The travel time variable used in this study goes beyond ruggedness by adding finer detail to the surface raster and in a way that allows ruggedness to be additive across space.
A major portion of this paper and its Online Appendix 1 are devoted to introducing this new data on travel time and demonstrating how it improves our ability to track transport and communication costs in precolonial Africa. In this study, I use the raster to calculate travel time to the nearest international slave port. The idea is that the locations of international slave ports were determined primarily by the geography of the coast and not by the characteristics of African societies. As such, travel time to slave ports captures exogenous variations in societal exposure to international slave trades. I then look to see if exposure encouraged the adoption of slavery and the institutions that support it.Footnote 5
I find that exposure to capture (measured as exports per square kilometer) increased the probability that a society would adopt slavery as one of its institutions and that the effect was greatest among societies that were politically decentralized at the end of the slave trade era. Second, I decompose slave exports by region and by century and find similar effects of exposure to capture in East and West Africa, but with important differences that reflect the different histories of the regions. Third, I use proximity to ports to estimate the effects of societal exposure to the trade of captives as they made their way to international slave ports. I estimate the impact of proximity to port on the probability of observing societies organized around the preservation and consolidation of slave wealth. The bundle of institutions includes slavery as a property right over people, polygyny as a property right over women as wives, inheritance rules that favor the retention of wealth within the nuclear family, hereditary succession in politics, and the centralization of political authority. This analysis finds that in East Africa, proximity to port incentivized the spread of polygynous family-based slavery—institutions designed to preserve slave wealth within polygynous nuclear families regardless of the overarching political structure. This is consistent with the view that slavery in East Africa spread with the expansion of export-oriented enclaves of slave plantations in the late eighteenth and early nineteenth centuries. In West Africa, the outcome was different. Here, proximity to port incentivized the spread of family-based polygynous slavery but only in societies controlled by a lineage-based aristocratic elite. This finding is consistent with West African slavery evolving out of lineage-based adaptations to long-term and intense exposure to international slave trades, first the trans-Saharan and then the trans-Atlantic slave trades.
I argue that these findings help historically decompress two long-term legacies found in the development literature because they integrate the history of African slavery into both. One legacy is a negative long-term effect of the slave trades on income (Nunn Reference Nunn2008). The other is a positive long-term effect of political centralization (Michalopoulos and Papaioannou Reference Michalopoulos and Papaioannou2013, Reference Michalopoulos and Papaioannou2015; Englebert Reference Englebert2000). The institutions of slavery were key institutions in both precolonial and colonial Africa, which helps explain why the negative effects on income do not show up until after colonialism (Bezemer, Bolt, and Lensink Reference Bezemer, Bolt and Lensink2014; Bottero and Wallace Reference Bottero and Wallace2013). Similarly, virtually all centralized precolonial African societies were slave societies, so some of the long-term benefits of political centralization accrued during the colonial era as well. In my concluding remarks, I return to these issues and the related issue of customary authority in Africa today.
THE DEBATE
Africa is generally viewed as a labor-scarce environment, so why export its people? Fenoaltea (Reference Fenoaltea1999) proposes a model to explain this seeming contradiction, but his model does not explain why Africans emigrated as slaves rather than free persons.Footnote 6 Domar (Reference Domar1970), Nieboer (Reference Nieboer1900), and Hopkins (Reference Hopkins1973) offer models that predict the institution of slavery in labor-scarce environments, but these models do not explain why African slaves were exported rather than employed domestically. This is where the debate comes in. If slavery was widespread in Africa prior to the international slave trades, then the emigration of Africans as slaves had a strong supply-side component. The subsequent history of African slavery might then be seen as a continuation of previous domestic trends (Eltis Reference Eltis1987; Thornton Reference Thornton1998). If, on the other hand, the international slave trades transformed property systems in Africa and spread the institution of slavery, then Africans emigrated as slaves (rather than, say, indentured servants) because of strong demand-side factors, like racism, for example. The international slave trades should then be viewed as transformative shocks to African economies and societies.
The modern debate begins with an exchange between Fage (Reference Fage1959) and Rodney (Reference Rodney1966)—an exchange that focused on the extent of slavery in West Africa before the coming of the trans-Atlantic slave trade, a theme Fage returns to repeatedly over the course of his career. Fage (Reference Fage1959) initially argued that,
“…the presence of a slave class among the coastal people meant that there was already a class of human beings who could be sold to Europeans if there was an incentive to do so… So the coastal merchants began by selling the domestic slaves in their own tribes.” (p. 78)
Rodney (Reference Rodney1966), investigating the upper Guinea Coast between the Gambia River and Cape Mount, concludes that the growth in slave exports did not come from existing stocks but was a response to the increased international demand for enslaved African people. Fage (Reference Fage1969) responds that Sudanese slave states existed prior to European arrival and spread to coastal areas during a golden era of trade (1500–1650). The growing transatlantic slave trade (1650–1850) expanded African slavery further. Later Fage (Reference Fage1980), generalizing from a growing body of case studies, argues that slavery was integral to the process of political centralization and state-building in medieval and precolonial Africa. As for the impact of the trans-Atlantic slave trade, Fage speculates that it could have encouraged political centralization and, therefore, slavery, but he was uncertain about the net effect.
The further proliferation of historical case studies and the collection of early demographic data on slave exports prompted Paul Lovejoy to attempt a synthesis in his book Transformations in Slavery (2000). Lovejoy concludes that
“…the opening of the Atlantic to trade marked a radical break in the history of Africa… Slavery was closely associated with this transformation not only because slaves were a major export, but also because slaves became far more common in local society than previously (p. 19)…. and the changes that took place resulted in the emergence of slave societies in places where previously there had only been a few slaves in society. That is, slavery became a central institution and not a peripheral feature.” (p. 21)
Critics of Lovejoy, like Eltis (Reference Eltis1987) and Thornton (Reference Thornton1998), counter that internal economic, political, and social factors were so overwhelmingly dominant or otherwise impervious to external influence that there were no transformations within Africa that resulted from the slave trade.Footnote 7
Anthropologists debated a similar issue—the social origins of slavery in Africa—exemplified by the contrasting views of Miers and Kopytoff (Reference Miers and Kopytoff1977) and Meillassoux (Reference Meillassoux1971, Reference Meillassoux1991). Miers and Kopytoff (Reference Miers and Kopytoff1977, pp. 66–72) consider slavery to be an extension of African kinship systems trying to expand in a labor-scarce environment, similar to the models of Domar (Reference Domar1970), Nieboer (Reference Nieboer1900), and Hopkins (Reference Hopkins1973):
“We see the roots of these servile institutions in the need for wives and children, the wish to enlarge one’s kin group, and the desire to have clients, dependents, servants, and retainers.” (p. 67)
They take a decidedly Smithian view of a human propensity to “truck and barter” (p. 68).
Meillassoux (Reference Meillassoux1991) argues the exact opposite—that “slavery is the antithesis of kinship” (p. 35). His argument is more theoretical. He begins with a conception of a closed kinship-based economy that equilibrates internally through a nexus of lifecycle obligations and exchanges between productive and unproductive kin. Kin are people brought up in the lifecycle. People not brought up in the lifecycle are aliens. Over the life course, kin pass from being unmarried cadets, who contribute to social reproduction by producing a surplus and transferring it to elders, into married men who contribute to social reproduction by raising families that eventually produce for and care for elders.
In this conception of kinship economy, cadets can be exploited if elders limit their access to wives and the products of progeny, but Meillassoux argues that slavery as an institution cannot emerge from the internal dynamics of such an economy. Since “gentles” are born into the life-cycle, a permanent class of exploited gentles must be permanently denied access to wives. But if this happens, the lineage dies out. Institutionalized exploitation of gentles requires a new “alien” lineage/class to justify and enforce the exploitation. Slavery, according to Meillassoux, is one such institution: the systematic and institutionalized limitation on access to progeny’s product; the institutionalized denial of kin status enforced by rules that reproduce alien status. Institutionalized war and regularized slave raiding can accomplish this, as in regions caught up in a gun-slave cycle (Whatley Reference Whatley2018; Gemery and Hogendorn Reference Gemery and Hogendorn1974; Lovejoy Reference Lovejoy2000, pp. 80–86). Racialized slavery can accomplish this, as in the Muslim Sudan of Africa (Hall Reference Hall2011). Kinship-based African societies had difficulty accomplishing this. As evidence, Meillassoux (Reference Meillassoux1991, pp. 78–84) cites data showing African kinship societies having difficulty biologically reproducing their slave populations (also, see Klein Reference Klein, Robertson and Klein1983).
This debate, like the one among historians, is about the impact of the external slave trade on African social relations and institutions. The different anthropological perspectives apply best to different levels of political and economic development. Meillassoux’s theory of kinship economy applies best to politically decentralized villages organized into age groups with elders and lineage heads wielding power and how these societies might have difficulty introducing and enforcing slavery. Miers and Kopytoff’s conception applies best to societies centralizing political authority around an aristocracy that controls land and exploits labor to produce a surplus.Footnote 8
The development question is this: How might an external slave trade drive the transformation of kinship-based economies into slave-based economies? An obvious mechanism is through the incorporation of enslaved women. Male cadets retain the products of progeny. Slave wives, concubines, and dependents are exploited. Reproduction of the slave population depends on the social status of the offspring. According to Meillassoux (Reference Meillassoux1991), as well as Miers and Kopytoff (Reference Miers and Kopytoff1977), the societal challenge is for free people to introduce slaves without undermining the societal norm that freedom (as opposed to slavery) means “belonging to kin.”
In this context, the rules that govern the inheritance of social status will influence the form that slavery takes, but in the final analysis, the reproduction of slave property concentrates wealth within male-headed nuclear families as opposed to the lineage, the clan, or the tribe. In matrilineal societies, for example, the social status of offspring is inherited from the slave mother, so the offspring of a free father and a slave mother is a slave, which does not violate the social norm. They also have no kin other than the father.Footnote 9 In patrilineal societies, the social status of offspring is inherited from the father, so the offspring of a free father and a slave mother should be free. According to Meillassoux (Reference Meillassoux1991, pp. 130–40), this violates a fundamental societal norm and explains why patrilineal kinship societies seldom condone marriage between free men and slave women but instead incorporate slave women through concubinage. The offspring still have no kin other than the father.
Miers and Kopytoff (Reference Miers and Kopytoff1977), summarize the results of centuries of this type of pressure on inherited slave status and conclude that the “… position of the second generation is least ambiguous in matrilineal societies… Most patrilineal societies, however, made some distinction between the various children of “free” men, based on the status of their mother” (p. 33). Lovejoy (Reference Lovejoy2000), focusing on the property aspect of inherited slave status, concludes that the incorporation of slaves “… enabled wealthy men to establish large households that were dependent upon them and not some larger kinship unit” (p. 123).
Lagerlof (Reference Lagerlof2009) models a similar transition from “egalitarian” ownership of land and labor to a “state of despotism and slavery, with a political elite owning both people and land” (p. 319). Here the transition is driven by the joint evolution of agricultural technology and population growth. This paper advances the hypothesis that in Africa, this evolution was also driven by the international slave trades.
DATA SECTION
In this section, I introduce estimates of travel time to the nearest international slave port as a measure of local exposure to international slave trades. The idea is that travel time to the nearest international slave port was independent of the institutions of African societies. As late as the nineteenth century, international slave traders still possessed very little knowledge of the locations and characteristics of inland African societies, so it is unlikely that they located slave ports close to societies known to have stocks of slaves. In 1620–21 Jobson (Reference Jobson1932) traveled 400 miles up the Gambia River in search of gold, but as late as the 1790s, Park’s (2000) Travels in the Interior Districts of Africa were still not very far into the interior, confined primarily to the Sahel region around the Niger River Bend, only venturing as far southeast as Bussa, where he was ambushed or killed in the rapids.
Instead, the locations of ports were largely determined by the geography of the coast. Islands off the coast served as protected trading posts throughout the slave trade era. Examples include Cape Verde off of the Upper Guinea Coast, Sao Tome off the Lower Guinea Bights, and Pemba, Madagascar, and Zanzibar off the East Coast. On the mainland, traders established posts at the mouths of rivers so that African traders could more easily bring goods and slaves down to the coast. Examples include major trading posts at the mouths of the Senegal, Gambia, Niger, Congo, and Zambezi river systems. Ports were also established in the expansive Niger Delta and the lagoons along the Lower Guinea Coast. A few forts were established upriver on islands and in protected bays. The Portuguese established a few upriver forts along the Zambezi. Agents, goods, and information about the international slave trades reached inland societies along these rivers, through dense forests, and over mountain ranges. The idea is that travel time correlates with the cost of transporting goods and people between coastal slave ports and inland societies. Once exposed, people and societies coordinate a response.Footnote 10
Estimating Travel Time
In precolonial Africa, the transportation and communication technology was relatively simple. The TseTse fly eliminated draft animals from the technology set in much of tropical Africa (Alsan Reference Alsan2015). The camel and the horse were confined primarily to the desert and its savannah fringes (Bulliet Reference Bulliet1990; Law Reference Law1980). The wheel, like in most parts of the world, was virtually nonexistent (Bulliet Reference Bulliet2016).Footnote 11 The major modes of transportation were walking and canoeing. Slaves were transported by these methods even when horses and camels were available.
I develop an index of precolonial TRAVEL TIME for the entire continent of Africa (see Online Appendix 1 for a detailed discussion). The index estimates travel time by portage and canoe, measured in hours per kilometer. I estimate and combine two GIS rasters. The first raster uses historical observations of walking speeds and the Waldo Tobler Hiking Function (1993) to estimate walking speeds over a variety of Food and Agriculture Organization of the United Nations (FAO) land-cover types and earth slopes. The second raster estimates canoe speeds along rivers of different velocities using data from the Global Runoff Data Center’s Major River Basins of the World, classified by mean annual discharge (GRDC 2007). The two rasters are joined to form a raster of travel time for each .452 square kilometer cell of the African continent. I use the ArcGIS Path Distance tool to estimate the least-cost time to travel from any point on the continent to the nearest international slave port.Footnote 12
Figure 1 displays the estimated average travel times between each society in Murdock’s Ethnographic Atlas and the nearest slave port serving either the Transatlantic or the Indian Ocean slave trades, ports taken from the Transatlantic Slave Trade Database.Footnote 13 Figure 2 displays the estimated travel times to the nearest trans-Saharan or Red Sea slave port, with ports taken from Austen (Reference Austen2010, p. 29). Each society’s travel time is the average weighted travel time for all of the cells contained within the society’s borders. These are the measures of travel time used in the empirical section.Footnote 14
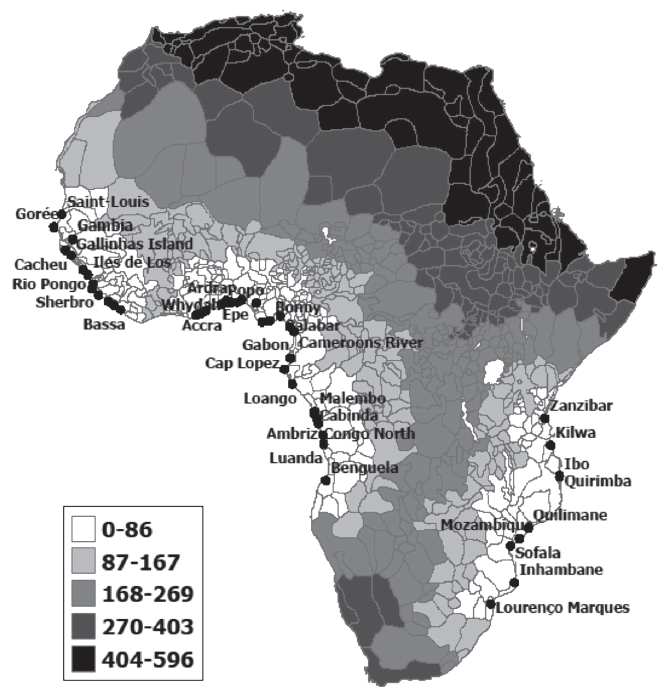
Figure 1 HOURS TO THE NEAREST ATLANTIC OR INDIAN OCEAN SLAVE PORT
Sources: Travel time is described in Online Appendix 1. Ports come from slavevoyages.org.
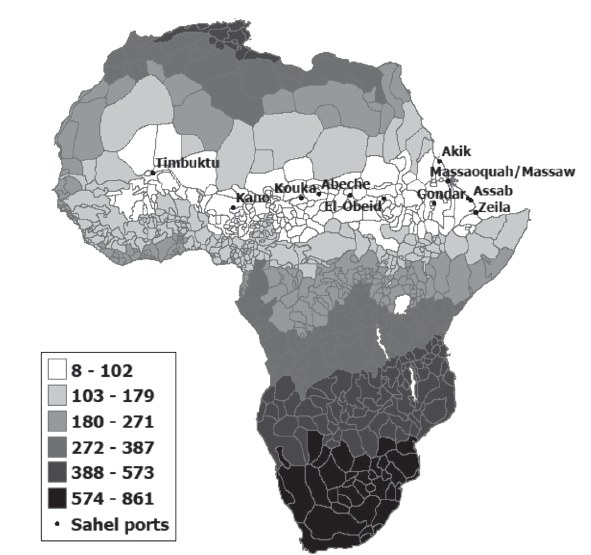
Figure 2 HOURS TO THE NEAREST TRANS-SAHARAN OR RED SEA SLAVE PORT
Sources: Travel time is described in Online Appendix 1. Ports come from Austen (Reference Austen2010).
Other Data
Table 1 reports the means of the other variables. AFRICAN SLAVERY is the main dependent variable. It comes from variable V70 in the Ethnographic Atlas and takes the value one if the society is reported as having the institution of slavery, zero if slavery was recorded as “absent or near absent.”Footnote 15 Bezemer, Bolt, and Lensink (Reference Bezemer, Bolt and Lensink2014) check Murdock’s classifications against the references used by Murdock and find that it “…did not lead to major changes in the coding of our data” (p. 150). They found less agreement with the types of slavery recorded in the Ethnographic Atlas (Incipient, Unspecified, and Hereditary). I follow their lead and confine the analysis to the presence or absence of the institution of slavery as recorded by western observers in the Ethnographic Atlas.
Table 1 MEANS AND FREQUENCIES, CIRCA 1900

Sources: Slave exports come from Nunn and Wantchekon (Reference Nunn and Wantchekon2011). Institution categorical variables come from Murdock’s Ethnographic Atlas: slavery (V70); polygyny (V9); political hierarchies (V33); patrilineal descent (V43); children inherit (V74, V76); and hereditary local headship (V72). TseTse fly suitability comes from Alsan (Reference Alsan2015). Region indicators and agricultural suitability index come from Michalopoulos and Papaioannou (Reference Michalopoulos and Papaioannou2013). Date of observation comes from Murdock’s Ethnographic Atlas (V102). Data on Ethno-Linguistic Affiliation are taken from Alsan (Reference Alsan2015). Euclidean distance is calculated using the Distance Tool in ArcGIS. See Online Appendix 1 for construction of the travel time variables.
The variable SLAVE EXPORTS estimates the number of local people captured and exported into international slave markets. The data come from Nunn and Wantchekon (Reference Nunn and Wantchekon2011) and are only available for local captives exported into the trans-Atlantic and Indian Ocean slave trades. Potential bias is introduced by the absence of data on local captives exported into the competing trans-Saharan and Red Sea slave trades. To handle this, I control for travel time to the nearest trans-Saharan or Red Sea slave port.Footnote 16 Slave exports are normalized by square kilometers to reflect the probability of individual capture. Exports per square kilometer are highly skewed, with 60 percent zeros, 90 percent less than 1, and outliers as large as 43. The estimation, therefore, uses the natural log transformation, which removes the truncation at zero, produces more symmetry around the mode, and compresses outliers. I add the extremely small value of .00001 to the export per square kilometer data (smaller than the smallest positive number) to approximate the value of zero.
Institutional controls include POLITICAL HIERARCHY and PATRILINEAL descent. POLITICAL HIERARCHY is based on Murdock’s variable V33. It measures jurisdictional hierarchy beyond the local community. Hierarchical ordering begins with village societies that recognize no political authority beyond the local community; then one level of jurisdictional hierarchy beyond the local community (e.g., petty chiefdoms); two levels of hierarchy beyond the local community (larger chiefdoms); three levels (states); and four levels (large states). The variable has been used in a number of influential studies of the causes and consequences of precolonial political centralization, defined as large chiefdoms and states (Osafo-Kwaako and Robinson Reference Osafo-Kwaako and Robinson2013; Gennaioli and Rainer Reference Gennaioli and Rainer2007; Michalopoulos and Papaioannou Reference Michalopoulos and Papaioannou2013, Reference Michalopoulos and Papaioannou2015, Reference Michalopoulos and Papaioannou2018).
The variable PATRILINEAL descent comes from Murdock’s V43. It takes the value 1 if the major descent type is patrilineal, zero otherwise. According to Meillassoux, patrilineal societies should have more difficulty incorporating slave women as the wives of free men (1991, pp. 130–40).
Other CONTROL variables capture exogenous variations across regions that might influence the presence or absence of slavery. The first is an index of agricultural suitability, which should correlate with population density and the economic returns from exploiting slaves. The second is an index of TseTse fly suitability, which reduces agricultural productivity overall (Alsan Reference Alsan2015), reduces the availability of camels and horses as means of transportation, warfare, and state-building (Goody Reference Goody1971), and eliminates an important store of wealth other than slaves. The third control is a region indicator that captures broad regional differences like Islam in the north, coastal versus interior, Atlantic Ocean versus Indian Ocean trade histories, and early European occupation of the Southern Cape. I include the date of observation to account for any changes in the probability of observing slavery due to changes in the date at which the society was observed, as recorded in the Ethnographic Atlas.Footnote 17
EXPOSURE TO CAPTURE
Did the international slave trade spread slavery in Africa? The development literature traces the effect through slave exports, so the analysis begins there. I estimate the following relationships:
SLAVERY = F (EXPORTS, HIERARCHY, PATRILINY, CONTROLS)
EXPORTS denotes losers in the kinds of conflicts that produced slaves. SLAVERY denotes users of the slaves produced by such conflict. Why would societies that suffer more losses be more likely to be a slave society? A first-order effect might be adoptions of slavery among people defending against further enslavement, as in catchment zones. Historical case studies show how the probability of capture disrupted decentralized kinship-based societies and transformed them into bands of young cadets and warriors using newly acquired slaves to raid the countryside for more recruits (Klein Reference Klein2001; Hawthorne 2003; Roberts Reference Roberts1980, Reference Roberts1987; Meillassoux Reference Meillassoux1991, pp. 143–56). Similarly, along the southern shores of the Sahara desert, eighteenth and nineteenth-century Islamic Jihads began as defensive movements to protect against enslavement, only to become justifications for enslaving others (Lovejoy Reference Lovejoy2016).
Also, the kinds of social conflict that produced slaves did not always produce clear winners and losers. The importation of new weapons of war often pushed entire regions into a prisoners’ dilemma arms race of raid-or-be-raided, with belligerents sometimes winning, sometimes losing (Whatley Reference Whatley2018; Gemery and Hogendorn Reference Gemery and Hogendorn1974; Lovejoy Reference Lovejoy2000, pp. 80–86; Inikori Reference Inikori1977). As the volume of slave raiding and trafficking grows, so too do the opportunities and temptations to trade in slaves and to use them in military and administrative functions, which requires recognition and enforcement of the institution. Many African slave systems were designed to slowly integrate the descendants of captives into society, so continued slave raiding and slave trading were required to reproduce the systems (Meillassoux Reference Meillassoux1991; Miers and Kopytoff 1997).
Linear Estimates
Table 2 reports ordinary least square (OLS) estimates of the linear relationship between the local numbers of slaves captured and exported from a society and whether or not that society was a slave society. Column (1) reports the simple regression of SLAVERY on the log of EXPORTS per square kilometer. The coefficient is .011 and significant at .01 percent, confirming a strong relationship between international slave exports and African slavery. Column (2) clusters robust standard errors by ethnolinguistic affiliation. Nothing changes.
Table 2 OLS LINEAR PROBABILITIES (DEP. VAR. = AFRICAN SLAVERY)

Notes: Dependent variable is the presence of slavery, V70, from Murdock’s Ethnographic Atlas. Robust standard errors in parentheses, Columns (3)–(5) clustered by ethno-linguistic affiliation. *** p<0.01,
** p<0.05, * p<0.1.
Sources: Slave exports come from Nunn and Wantchekon (Reference Nunn and Wantchekon2011). Institution categorical variables come from Murdock’s Ethnographic Atlas: slavery (V70); political hierarchies (V33); patrilineal descent (V43); TseTse fly suitability comes from Alsan (Reference Alsan2015). Region indicators and agricultural suitability index come from Michalopoulos and Papaioannou (Reference Michalopoulos and Papaioannou2013). Date of observation comes from Murdock’s Ethnographic Atlas (V102). Data on Ethno-Linguistic Affiliation are taken from Alsan (Reference Alsan2015). See Online Appendix 1 for construction of the travel time variables.
We only have slave export data for the trans-Atlantic and Indian Ocean slave trades. Societies on the margins of export zones were exposed to more than one international slave trade, so the available export data might underestimate the extent of exposure for societies near competing outlets. To control for this, Column (3) adds a measure of travel time to the nearest competing trans-Saharan or Red Sea slave port. As expected, proximity to one of these alternative ports increased the probability of slavery, suggesting that distance from a trans-Saharan or Red Sea ports offered some protection from exposure. The coefficient on EXPORTS into the trans-Atlantic and Indian Ocean trades remains positive and significant.
Column (4) adds the environmental controls. These explain a substantial amount of the spatial variation in African slavery, the most important factor being the index of TseTse fly suitability. The TseTse fly reduced the probability of establishing a viable livestock industry, leaving slavery as the primary form of wealth accumulation and eliminating draft animals from the technology set. Column (5) adds the two institutional variables. The coefficient on patrilineal descent shows a negative correlation with slavery, confirming the view that patrilineal kinship societies had more difficulty incorporating slaves without calling into question societal norms about freedom and citizenship. The coefficients on political hierarchy show a positive correlation with slavery, consistent with Miers and Kopytoff’s conception that slavery was easier to establish and sustain in societies centralizing political authority around an elite class extracting a surplus. Again, the coefficient on EXPORTS into the trans-Atlantic and Indian Ocean slave trades remains positive and significant throughout.
Non-Linear Probit Estimates
The dependent variable, SLAVERY, is a dichotomous variable that takes the value zero or one, so Table 3 presents probit estimates of the relationship between slave exports and African slavery. The maximum likelihood method is used for parameter estimation. The estimated coefficient is the increase in the z-score due to a one-unit increase in the independent variable. For categorical variables, it is the increase in the z-score per increase in category. For X=ln(EXPORTS), a 1 percent increase would lead to a β/100 increase in the z-score. Conditional predicted probabilities are obtained by the inverse probit transformation, where the predicted probabilities will vary over the distribution of covariates.
Table 3 NON-LINEAR PROBIT ESTIMATES (DEP. VAR. = AFRICAN SLAVERY)

Notes: Dependent variable is the presence of slavery, V70, from Murdock’s Ethnographic Atlas. Robust standard errors in parentheses clustered by ethno-linguistic affiliation. *** p<0.01, ** p<0.05, * p<0.1. Equation specification is Probit.
Sources: Slave exports come from Nunn and Wantchekon (Reference Nunn and Wantchekon2011). Institution categorical variables come from Murdock’s Ethnographic Atlas: slavery (V70); political hierarchies (V33); patrilineal descent (V43). The decentralized category includes villages and petty chiefdoms. Environmental controls include TseTse fly suitability from Alsan (Reference Alsan2015) and agricultural suitability index come from Michalopoulos and Papaioannou (Reference Michalopoulos and Papaioannou2013). Region controls included North, South, East, West, and Central from Michalopoulos and Papaioannou (Reference Michalopoulos and Papaioannou2013). Date of observation comes from Murdock’s Ethnographic Atlas (V102). Data on Ethno-Linguistic Affiliation are taken from Alsan (Reference Alsan2015). See Online Appendix 1 for construction of the travel time variables.
Results are reported in Table 3. The estimated coefficient on slave exports is always positive and significant. According to these results, a 1 percent increase in slave exports per square kilometer increased the z-score by 4.6 to 6.5 percent. Figure 3 graphs the within-sample predicted probabilities with 95 percent confidence intervals. The probability of observing slavery increases as exports per kilometer increase. As can be seen from this graph, variations in EXPORTS per kilometer do not explain the majority of African slavery. At zero levels of EXPORTS, the predicted probability of observing slavery is already approaching 80 percent, so there are factors other than exposure to capture explaining African slavery. Below I consider the effects of slave trading in addition to slave capture, but it is important to note that the probability of slavery increases as the probability of capture increases, such that the probability of observing slavery among the hardest hit societies approaches 100 percent by the end of the slave trade era.

Figure 3 PREDICTED PROBABILITIES OF SLAVERY BY EXPORTS
Source: Sample predictions from Table 3, Column (4).
Instrumental Variables Probit Estimates
Linear and probit estimates show a positive correlation between slave exports and African slavery. However, reverse causality is a concern. Exposure to capture could have encouraged societies to adopt slavery. Alternatively, slave societies could have welcomed the opportunity to sell slaves to international slave traders. Omitted variable bias is also a concern. The variable EXPORTS measures cumulative export over three centuries. Variables omitted from the analysis could be positively correlated with both slave exports and the probability of adopting slavery. Lagerlof (Reference Lagerlof2009), for example, proposes a model where improved agricultural productivity and increased population density make slavery a more profitable institution for elites to consider, although Ronnback and Theodoridis (Reference Ronnback and Theodoridis2018) provide evidence that labor productivity in the Senegambia region was low during this period. In Lagerlof’s model, the additional cost of policing slavery is offset by the opportunity to pay slaves less than their marginal product. Over the centuries of the international slave trades, new crops like maize diffused throughout Africa, increasing the carrying capacity of land and encouraging the export of slaves (McCann 1999; Cherniwchan and Moreno-Cruz Reference Cherniwchan and Moreno-Cruz2019), although Dalrymple-Smith and Frankema (Reference Dalrymple-Smith and Frankema2017) show that African provisioning of slave ships was not an important source of agricultural demand. The importation of weapons like guns, knives, and swords improved the productivity of guards and was also correlated with the export of slaves (Whatley Reference Whatley2018; Ronnback Reference Ronnback2020).
Instrumental variable estimation can address these types of concerns. We seek an instrument for slave exports that influences the probability of slavery only through its influence on slave exports. I use DAYS to the nearest trans-Atlantic or Indian Ocean slave port. Variation in DAYS to the nearest slave port should correlate with variation in exposure to the international slave trades. DAYS differs from Euclidean distance in that it captures some of the protections afforded by the ruggedness of terrain and land cover, and some of the exposure of societies located near rivers. Column (6) of Table 3 presented some evidence that DAYS satisfies the exclusion restriction. It shows that once slave exports are controlled for in the probit equation, DAYS to the nearest slave port has no independent effect on the probability of observing slavery. As an excluded instrument, variations in DAYS should only affect the probability of slavery through its correlation with slave exports.
I use first-stage F-tests to assess the strength of the instrument. The preferred estimator is the maximum likelihood estimator, which estimates the parameters of the reduced form first stage regressions jointly with the parameters of the probit equation, so there is no first-stage F-statistic.Footnote 18 However, the reduced form equation for the endogenous explanatory variable (EXPORTS) is still linear in the IV probit specification, so I report the diagnostic first-stage F-statistics from the corresponding linear probability model (Cragg-Donald and Kleibergen-Paap F-statistic). An alternative IV probit estimation method uses Newey’s (1987) two-step estimator, which generates first-stage F-statistics, which I report as well.
Table 4 reports the results. DAYS performs well as an excluded instrument. The coefficient on DAYS in the first stage is large, negative, and statistically significant at .01 percent. The coefficient on EXPORTS in the SLAVERY equation is .10 and also significant at .01 percent. F-statistics are all above 10. Figure 4 graphs the predicted impact of exposure to capture on the probability that an African society adopts slavery as one of its institutions. The graph is similar to the graph from the reduced form probit (Figure 3) with larger standard errors around the upper end of the distribution of exports.
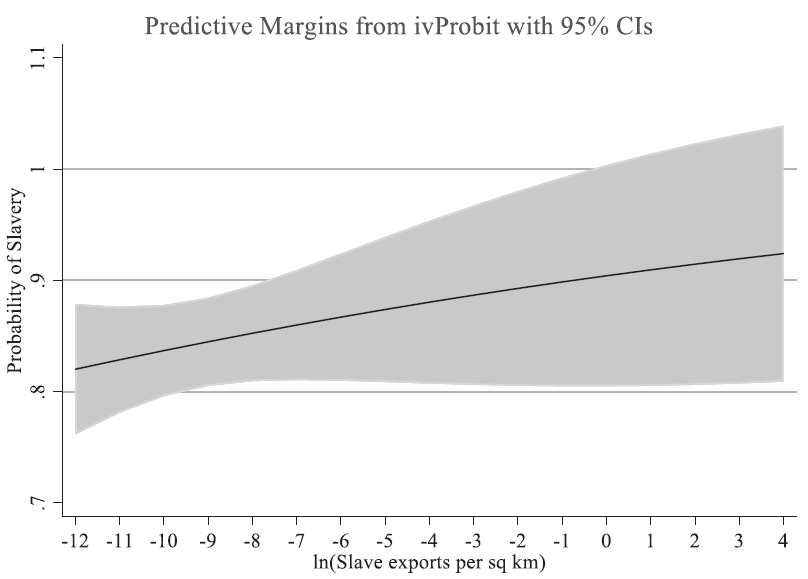
Figure 4 PREDICTED PROBABILITIES OF SLAVERY BY CATCHMENT
Source: Sample predictions from Table 4, Model (1).
Table 4 INSTRUMENTAL VARIABLE PROBIT ESTIMATES OF EXPOSURE TO CAPTURE (EXCLUDED INSTRUMENT IS AVERAGE WEIGHTED TRAVEL DAYS TO PORT)

Notes: Robust standard errors in parentheses clustered by ethno-linguistic affiliation. *** p<0.01, ** p<0.05, * p<0.1. Coefficient estimates obtained from instrumental variable probit using the maximum likelihood method. First-stage F-statistics come from the instrumental variable probit using Newey’s two-step method. Cragg-Donald and Kleibergen-Paap Wald F-statistics obtained from linear instrumental variable estimation.
Sources: Slave exports come from Nunn and Wantchekon (Reference Nunn and Wantchekon2011). Institution categorical variables come from Murdock’s Ethnographic Atlas: slavery (V70); institutional controls include political hierarchies (V33) and patrilineal descent (V43). The decentralized category includes villages and petty chiefdoms. Environmental controls include TseTse fly suitability from Alsan (Reference Alsan2015) and agricultural suitability index from Michalopoulos and Papaioannou (Reference Michalopoulos and Papaioannou2013). Region controls of North, South, East, West, and Central come from Michalopoulos and Papaioannou (Reference Michalopoulos and Papaioannou2013). Date of observation comes from Murdock’s Ethnographic Atlas (V102). Data on Ethno-Linguistic Affiliation are taken from Alsan (Reference Alsan2015). See Online Appendix 1 for construction of the travel time variables.
Sensitivity Tests
Table 5 reports sensitivity tests using different measures of exposure. The first two columns report results for Euclidean distance, the typical measure of exposure in this type of research design. While straight-line Euclidean distance is correlated with slave exports in the first stage, the coefficient is one-third the size of the coefficient on travel time and leads to the conclusion that catchment did not influence the adoption of slavery. This is evidence that access to river transportation, considerations of terrain and headload, and traders’ use of local knowledge improve the measure of exposure. Columns (3) and (4) run a race between travel time and Euclidean distance. When both measures are included, Euclidean distance loses significance in the first stage, travel time picks up the statistically significant correlation with slave exports, and the predicted impact of catchment on slavery returns.
Table 5 SENSITIVITY TESTS OF ALTERNATIVE IV MEASURES OF DISTANCE
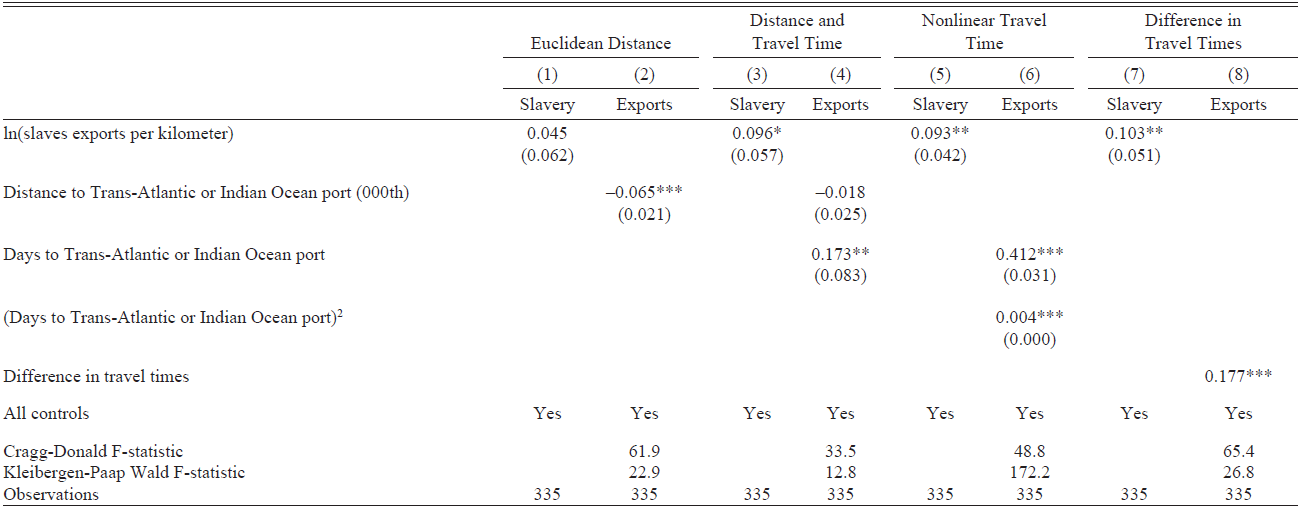
Notes: Robust standard errors in parentheses clustered by ethno-linguistic affiliation. *** p<0.01, ** p<0.05, * p<0.1. Coefficient estimates obtained from instrumental variable probit using the maximum likelihood method. Cragg-Donald and Kleibergen-Paap Wald F-statistics obtained from linear instrumental variable estimation. Euclidean distance is calculated by the ArcGIS Path Distance Tool from the centroid of each ethnicity to the nearest international slave port. Difference in travel time equals days to nearest trans-Atlantic or Indian Ocean port minus days to nearest trans-Saharan or Red Sea port.
Sources: Slave exports come from Nunn and Wantchekon (Reference Nunn and Wantchekon2011). Institution categorical variables come from Murdock’s Ethnographic Atlas: slavery (V70); institutional controls include political hierarchies (V33) and patrilineal descent (V43). The decentralized category includes villages and petty chiefdoms. Environmental controls include TseTse fly suitability from Alsan (Reference Alsan2015) and agricultural suitability index from Michalopoulos and Papaioannou (Reference Michalopoulos and Papaioannou2013). Region controls of North, South, East, West, and Central come from Michalopoulos and Papaioannou (Reference Michalopoulos and Papaioannou2013). Date of observation comes from Murdock’s Ethnographic Atlas (V102). Data on Ethno-Linguistic Affiliation are taken from Alsan (Reference Alsan2015). See Online Appendix 1 for construction of the travel time variables.
Columns (5) and (6) investigate non-linearity in travel time. Slave traders may have incurred costs that increase with distance, like larger headloads per kilometer, traveling through additional hostile territories, or paying more duties to middlemen. Column (6) shows evidence of nonlinearity in travel time, but it does not affect the estimated impact of exposure. Columns (7) and (8) replace travel time to the nearest port with the difference between travel time to the nearest port and travel time to the nearest alternative port (trans-Saharan or Red Sea), the idea being that accounting for proximity to alternative ports in the first stage might reduce the estimated impact of exports in the second stage. It does not. If anything, it increases the estimated impact by approximately 10 percent.
Heterogeneity Effects
Online Appendix 2 investigates heterogeneity effects. Fage, for example, suggests that the slave trades may have encouraged the spread of slavery through the spread of political centralization. Table B1 in Online Appendix 2 shows that this was not the case, at least not for capture. Running the capture model on political centralization and patrilineal descent shows no effect of exposure to capture on these variables, so they can be treated as exogenous covariates in the analysis. Figure 5, therefore, graphs the estimated effects of catchment by the different levels of political hierarchy and types of descent. These results show that the major effect of exposure to capture was concentrated among decentralized societies (panels (a) and (b)). Panel (c) shows the same for patrilineal descent. Political decentralization and patrilineal descent constrained the transition to slavery, as Meillassoux argues, but exposure to capture incentivized these types of societies to overcome those constraints. Online Appendix 2, Table B2 shows that the impact of catchment on African slavery is not confined to one coast or the other, although the histories and the resulting slave systems may differ.

Figure 5 THE CONSTRAINTS OF POLITICAL DECENTRALIZATION AND PATRILINEAL DESCENT
Source: Sample predictions from Table 4, Models (1) and (2).
EXPOSURE TO TRADE
The previous section showed how exposure to capture encouraged societies to adopt slavery and overcome the constraints of political decentralization and patrilineal descent. But exposure to capture does not explain the majority of African slavery. In this section, I go beyond catchment to investigate how exposure to slave trading transformed African societies. I use the travel time variable to estimate the effects of exposure to the trade of captives as they made their way to international slave ports. For a variety of reasons, not all societies exposed to the international slave trade experienced serious capture. Figure 6 displays the geographic dispersion of the sample of slave exports per square kilometer. While coastal areas were hit hardest, many near-coastal societies were not. In West Africa, the hinterland behind the Ivory Coast was sandwiched between two zones that sent large numbers of slaves into the trans-Atlantic slave trade, but on the whole, the region avoided serious capture and export. Dialonke, northeast of Futa Djallon, is surrounded by victims of the slave trade but failed to show any people in the American slave samples. The same applies to a cluster of societies between Asante and Dahomey and another cluster just northeast of Ibo. On the east coast, the Island of Pemba was a staging ground for the Indian Ocean slave trade, yet just across the channel on the mainland, the Imbugu avoided capture. The Masai, just north of there, were feared warrior-herdsmen that slave traders learned to avoid. Just to the west is another cluster of societies that apparently escaped serious capture. The same applies to the Gomani at the southern tip of Lake Tanganyika and a cluster of societies just off the east coast, west of Mbunga. Central Africa looks like a random checkerboard.
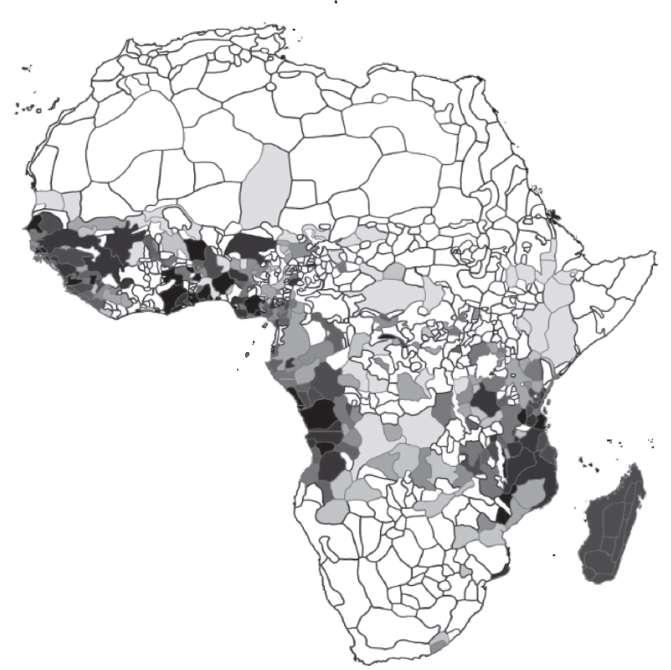
Figure 6 SLAVE EXPORTS PER KILOMETER
Notes: Darker areas are higher exports per kilometer. White areas are zero exports per kilometer.
Source: Nunn and Watchenkon (2011).
These are examples of societies that appear to fall within the orbit of the international slave trades yet avoided serious capture. Did exposure to trade transform societies in any way, even if they were able to avoid serious capture? To address this question, I estimate the impact of proximity to the nearest international slave port on the probability that a society was organized around the preservation of slave wealth. The bundle of institutions includes slavery as a property right over people, polygyny as a property right over women as wives, inheritance rules that favor the retention of wealth within the nuclear family, and hereditary succession in politics.
Table 6 reports the results. The first panel reports results for all of Africa, the second panel for the west coast, and the third panel for the east coast. First, consider the all-Africa sample. Columns (1)–(3) report the estimated impact of proximity to port on family structure. Column (1) reports the coefficient on the joint outcome of slavery and polygyny and shows that proximity to port spread the institution of slavery joint with the institution of polygyny, regardless of the number of inhabitants captured and exported.Footnote 19 This result is found for all of Africa, in East Africa and West Africa. The connection between slavery and polygyny is so strong and so universal that one might call them inseparable. The very first sentence of the volume on Women and Slavery in Africa, edited by Robertson and Klein (Reference Robertson and Klein1983, p. 3), explains why. It reads: “Most slaves in sub-Saharan Africa were women.”
Table 6 PROBIT ESTIMATES OF EXPOSURE TO TRADE ON BUNDLES OF AFRICAN INSTITUTIONS

Notes: Robust standard errors in parentheses clustered by ethno-linguistic affiliation. *** p<0.01, ** p<0.05, * p<0.1. Estimated Probit specifications.
Sources: See Online Appendix 1 for construction of the travel time variable. Proximity = – travel time. Institution variables come from Murdock’s Ethnographic Atlas: slavery (V70); polygyny (V9); children inherit (V74, V76); and hereditary local headship (V72). Political centralization includes large chiefdoms and states (V33). Controls include patrilineal descent (V43); political hierarchies (V33); TseTse fly suitability from Alsan (Reference Alsan2015) and agricultural suitability index from Michalopoulos and Papaioannou (Reference Michalopoulos and Papaioannou2013). Region controls are North, South, East, West, and Central, and come from Michalopoulos and Papaioannou (Reference Michalopoulos and Papaioannou2013). West Coast includes the North, West, and Central regions. East Coast includes the East and South regions. Date of observation comes from Murdock’s Ethnographic Atlas (V102). Data on Ethno-Linguistic Affiliation are taken from Alsan (Reference Alsan2015).
The capture and trade of slaves also created slave wealth. Columns (1) and (3) report proximity effects on the joint outcome of slavery and inheritance rules that favor the retention of wealth within the nuclear family.Footnote 20 The estimated coefficients in the all-Africa sample are large and statistically significant for both capital (including slaves) and land.Footnote 21 To the author’s knowledge, this is the first empirical evidence showing that the international slave trades altered patterns of intergenerational wealth accumulation in Africa by encouraging the concentration of wealth within the nuclear family as opposed to the lineage, the clan, or the tribe.
The last three columns go further and report results for bundles of institutions. Column (6) bundles slavery, polygyny, and the inheritance of wealth within the nuclear family. In the all-Africa sample, proximity to port encouraged the spread of family-based polygynous slavery— slavery and polygyny as integral components of family structure, with wealth accumulated within the nuclear family over generations. Column (7) adds to the bundle hereditary political succession at the local level and finds that proximity to port encouraged the spread of family-based polygynous slavery under inherited local political control. Call this aristocratic family-based polygynous slavery. Column (8) adds to the bundle the level of political centralization beyond the local level and finds that proximity to port also encouraged the spread of family-based polygynous slavery under the protection of politically centralized aristocracies.
These are results for all of Africa. They mask important differences between East and West Africa. In all regions of Africa, proximity to port encouraged the spread of slavery joint with polygyny, but this is where the similarities end. Column (6) shows that in East Africa proximity to port encouraged the spread of family-based polygynous slavery independent of political institutions, which is consistent with the driving force being the expansion of export-oriented slave plantations in the late eighteenth and early nineteenth centuries (Martin 1991; Lovejoy Reference Lovejoy2000, pp. 226–51).
Columns (7) and (8) show that in West Africa, the effects of proximity to port were very different. Here, family-based polygynous slavery emerges only under the protection of a lineage-based local aristocracy, which is consistent with West African slavery evolving out of the adaptations of lineage systems to long-term exposure to slave trades (Bates, Grief, and Singh 2002; Whatley Reference Whatley, Akyeampong, Bates, Nunn and Robinson2014; articles in Miers and Kopytoff Reference Miers and Kopytoff1977). In West Africa, the impact of proximity on the spread of politically centralized slave aristocracies is particularly strong, with a statistically significant coefficient of .227.
Figure 7 graphs the predicted impact of proximity to port on the probabilities of observing these types of slave systems. In each case, the probabilities are large for societies adjacent to international ports, with the impact declining as one moves away from ports. In East Africa, the probability of observing family-based polygynous slavery is approximately 55 percent for societies adjacent to a port. Twenty days out, it is still approximately 40 percent, and at 40 days out, still 30 percent. The flatness of the curve reflects the expansion of external enclaves along a coast that had few slave ports, and the widespread use of the Arab sailing vessel, the dhow, for coastwise trade, which is not captured by our measure of overland travel times (see Online Appendix 2).

Figure 7 AFRICAN SLAVE SYSTEMS BY PROXIMITY TO INTERNATIONAL SLAVE PORTS
Source: Sample predictions from Table 6.
In West Africa, the predicted effect of proximity on aristocratic slave regimes declines much faster as one moves away from international slave ports. Starting at approximately 30 percent for societies adjacent to a port, the impact is virtually zero 40 days out. For centralized aristocratic slave regimes, the impact is virtually zero by 20 days out. Coastal differences were many. Along the West African coast, there were many more slave ports, so more societies were closer to a slave port. Coastwise trade along the Atlantic coast was not as developed as the coastwise trade in the Indian Ocean. And West Africa lacked a coastal trade diaspora like the Swahili that reduced transactions cost along the coast (Horton and Middleton Reference Horton and Middleton1988; Sheriff Reference Sheriff2010). Trade diasporas in West Africa tended to extend inland from international ports to facilitate the inland penetration of the trans-Saharan and trans-Atlantic slave trades (consult Online Appendix 3 for a discussion of the role of trade diasporas).
In either case, these results document an impact of the international slave trades on the spread of polygynous slavery across the continent of Africa. We do not have data on the number of slaves in the sample of societies in the Ethnographic Atlas or the uses to which slaves were put, so we do not know if these were slave “modes of production” in the strict sense of the term. Nor can we estimate spillovers effects that extended slave markets inland and away from international slave ports. We can, however, conclude that the international slave trades encouraged the spread of family-based polygynous slavery in East Africa and aristocratic polygynous slavery in West Africa. The Online Appendix 3 offers some historical examples of the kinds of social transformations picked up by the econometric analysis.
CONCLUSION: IN THE SHADOW OF SLAVERY
This study has used new estimates of travel times to investigate how the international slave trades transformed African economies and societies. I find that the international slave trades encouraged decentralized African societies in catchment zones to adopt slavery as a defense against further enslavement. I also find that the international slave trades encouraged the spread of family-based polygynous and aristocratic slavery. As a result, slavery and polygyny were almost universal in Africa on the eve of colonial occupation, much of it caused by exposure to international slave trades.
Over time, these societies became sub-national regions of European colonies and post-colonial nation-states. As mentioned at the outset, the results of this study help historically decompress two findings in the development literature that focus on long-term legacies of this period. One proposed legacy is a positive long-term effect of political centralization (Gennaioli and Rainer Reference Gennaioli and Rainer2007; Michalopoulos and Papaioannou Reference Michalopoulos and Papaioannou2013, Reference Michalopoulos and Papaioannou2015, Reference Michalopoulos and Papaioannou2018). The other is a negative long-term effect of the slave trades (Nunn Reference Nunn2008; Bezemer, Bolt, and Lensink Reference Bezemer, Bolt and Lensink2014; Bottero and Wallace Reference Bottero and Wallace2013). Documenting the expansion of slavery in precolonial Africa integrates the history of African slavery into both of these development trajectories.
First, African slavery was a key institutional feature of precolonial and colonial Africa. While the abolition of slavery was a stated justification for European occupation in the late nineteenth century, colonial authorities quickly realized that precolonial traditions of authority were required for political stability, infrastructure development, and revenue enhancement (Phillips Reference Phillips1989; Getz Reference Getz2004; Miers and Klein Reference Miers and Klein1999; van Waijenburg Reference van Waijenburg2018; Austin Reference Austin2004; Lovejoy and Falola Reference Lovejoy and Falola2003; Crowder Reference Crowder1978; Bolt and Gardner Reference Bolt and Gardner2015). Phillips (Reference Phillips1989) carefully analyzes the internal documents of the British Colonial Office and shows that prior to WWI, the British were committed to establishing free land and labor in the colonies, but the strategy destabilized the situation to the point where authorities feared they would lose control. Chiefs were selling land to anyone who would buy it; land speculation was widespread; peasants and slaves were becoming landless laborers, concentrating in cities and mining towns; and labor effort under free labor contracts was not proving profitable. By WWI, British authorities changed strategies and moved toward a more indirect form of colonial rule. Rather than encourage competitive markets in labor and land, colonial authorities strengthened indigenous chiefly authority over “customary” laws and lands and enlisted allied chiefs in the collection of taxes and the recruitment of labor for the colonial effort.Footnote 22
In addition, colonial-era efforts to abolish African slavery may have intensified gender-based exploitation by making the pawning of wives the more acceptable form of property rights in people. Lovejoy and Falola (Reference Lovejoy and Falola2003) document that most pawns in the colonial era were women and that pawning rose substantially in the colonial era, although they caution that this might be a reflection of better recordkeeping in the colonial era (pp. 1–26). Mary Douglas (Reference Douglas1964) describes how the pawning of wives in Central Africa converted matrilineal rights in land into inheritable patrilineal rights in the pawned wife and her children. Vansina (Reference Vansina2010) describes a similar dynamic among the matrilineal Kuba in colonial Congo.Footnote 23
The implications of the present study are straightforward: the international slave trades spread slavery in Africa, a legacy of which was the move toward indirect colonial rule and the colonial sanctioning of indigenous precolonial authority.Footnote 24 Any long-term legacies traced using precolonial ethnicity-level data (like the Ethnographic Atlas) are, by construction, long-term legacies that evolved under the kinds of social institutions and customary authority documented in this study.Footnote 25 The negative effects of the slave trades on incomes were delayed until after colonialism partly because slavery was beneficial to the colonial effort.Footnote 26 Economic development in politically centralized regions outpaced development in politically decentralized regions partly because centralized regions were typically aristocratic slave regimes, while negative catchment effects were concentrated among the politically decentralized.Footnote 27
Today, slavery in Africa is officially dead,Footnote 28 but customary authority lives on. The 2008 AfroBarometer survey asks several questions about customary authority as distinct from formal state authority. In Ghana (CCD 2009), 68 percent of the respondents said traditional leaders had “primary responsibility for allocating land”; 59 percent said they had primary responsibility for “solving local disputes”; 60 percent said they should remain non-partisan, independent of government, and without government salary; 65 percent said their power should be increased and 42 percent said, “by a lot!” For the 19 countries in the survey, on a scale of 1–5, the average influence of traditional leaders was 3.30, and respondents wanted them to have 3.8 (Logan Reference Logan2011). Legal scholars continue to debate the future of customary authority in a modern democracy, but there is no debating the fact that customary authority in Africa is currently a mechanism for discriminating against migrants (aliens) and women and their rights to own and inherit property (Fenrick, Galizzi, and Higgins 2011; Sheleff Reference Sheleff1999; Bowman and Kuenyehia Reference Bowman and Kuenyehia2003; Burrill, Roberts, and Thornberry Reference Burrill, Roberts and Thornberry2010; Catherine Coquery-Vidrovitch Reference Coquery-Vidrovitch1997).


 Open access