

1. INTRODUCTION
‘Are we on track to bridging the gap? Absolutely not’.Footnote 1 The United Nations Environment Programme's (UNEP) Emissions Gap Report of 9 December 2020 puts it unmistakably: current policies, as well as the nationally determined contributions (NDCs) for 2030, depart markedly from what is needed to meet the Paris Agreement'sFootnote 2 temperature goal.Footnote 3 There is, however, encouraging news in the form of the high number of mid-century net-zero emissions targets put forward during 2020. According to the report, if achieved, these net-zero targets could reduce global temperature rise by 0.5°C,Footnote 4 and potentially bring the temperature target of the Paris Agreement ‘within reach’.Footnote 5 Critically, though, apart from there being large consensus within the scientific community that even adherence to the Paris Agreement's temperature target would entail disastrous consequences for many vulnerable communities across the globe,Footnote 6 NDCs for 2030, as well as current climate policy projections, are far from aligned with the mid-century net-zero targets.Footnote 7
Against this backdrop, in courtrooms around the world the argument is being advanced with increasing vehemence that states’ actions and omissions that contribute to climate change can amount to a violation of states’ legal obligations.Footnote 8 While different cases base this argument on different fields of law (including human rights law, constitutional law, and tort law), one daunting question inevitably looms over these judicial deliberations: what exact level of greenhouse gas (GHG) emissions reduction is an individual state required to achieve for it to satisfy its legal obligations?Footnote 9 Answering this question is complicated by, inter alia, the lack of an appropriate legal methodology for determining mitigation obligations.Footnote 10
This article explores the extent to which such a methodology could rely on what this article calls the ‘meta-equity assessment’ of states’ GHG emissions provided by the Climate Action Tracker (CAT or the Tracker).Footnote 11 By constructing a range of options that are considered fair by various scholars and applying these to 2 to 1.5°C benchmark pathways, the CAT claims to offer a way in which to determine the mitigation level that a country needs to achieve so that the temperature target of the Paris Agreement is met without relying on other countries acting with a higher ‘relative ambition level’.Footnote 12 As claimants who seek more ambitious state climate action increasingly reference the CAT,Footnote 13 analyzing the Tracker's assessment through a legal lens becomes imperative.
The article proceeds by way of a three-tier approach. Section 2 focuses on current legal approaches towards interpreting states’ mitigation obligations and explores why an improved legal methodology is urgently needed in this context. The article then analyzes the extent to which the meta-equity assessment by the CAT could serve as a basis for developing a legal methodology suited to the task. To this end, Section 3 examines the methodology and data used by the Tracker from a legal perspective and compares it with other extant meta-equity methodologies. The article concludes (Section 4) with a summary of the best available methodological approach identified and offers an outlook of the challenges ahead.
2. THE NEED FOR AN IMPROVED LEGAL APPROACH TO SPECIFYING STATES’ MITIGATION OBLIGATIONS
Article 2 of the Paris Agreement states that ‘[t]his Agreement … aims to strengthen the global response to the threat of climate change … including by holding the increase in the global average temperature to well below 2°C above pre-industrial levels and pursuing efforts to limit the temperature increase to 1.5°C above pre-industrial levels’.Footnote 14 The Agreement stipulates that in pursuing this aim, each party's climate action ‘will … reflect its highest possible ambition, reflecting its common but differentiated responsibilities and respective capabilities, in the light of different national circumstances’.Footnote 15 The Paris Agreement further stresses the importance of acting in line with best available science.Footnote 16 Meanwhile, however, scientific analyses of state mitigation action show that the international community is falling well short of what is required to limit global warming even to 2°C.Footnote 17 Against this backdrop, climate litigation is increasingly used to force more ambitious state action across the globe.Footnote 18
The Paris Agreement does not contain specific guidelines on how the principle of equity, which Article 4(3) refers to as ‘common but differentiated responsibilities and respective capabilities’, is to be implemented in terms of the mitigation obligations of individual states.Footnote 19 Most courts that have upheld climate lawsuits in favour of more ambitious state action so far have issued procedural injunctions which order governments to devise a plan to step up their efforts to tackle climate change.Footnote 20 There is only one case to date in which a national court of last resort has reinforced state mitigation obligations by ordering the state to achieve a particular minimum mitigation level set by the court, and to do so within a specific time limit.Footnote 21 In its landmark Urgenda judgment, the Dutch Supreme Court ruled that the Dutch state was to reduce its GHG emissions ‘by at least 25%’ compared with 1990 by the end of 2020.Footnote 22 In settling on this target, the court relied on the good-faith principle, opinio iuris, and state practice. More specifically, the Supreme Court's reasoning for upholding this target is anchored, inter alia, in earlier statements by the Dutch government, which acknowledged the necessity of adhering to this target,Footnote 23 while the government's reasons for subsequently deviating from this target were ‘insufficiently substantiated’.Footnote 24 This argumentative structure results in formally straightforward judicial reasoning. Indeed, lowering the ambition of a previously endorsed target on ‘insufficiently substantiated’Footnote 25 grounds can be considered an uncontroversial violation of the principle of good faith under most legal systems.Footnote 26 Closer analysis, however, is warranted concerning the way in which the substantive outcome of this judicial approach relates to best available science and the equity principle. Such analysis requires distinguishing between the following questions, which refer to fundamental steps towards specifying states’ mitigation obligations in line with equity and best available science:
1. What global temperature pathway is to be pursued and at what likelihood level?
2. What global carbon budget/mitigation burden does this correspond to?
3. How should this carbon budget, or mitigation burden, be distributed equitably among states?
To shed light on if and, if so, how the ‘at least 25%’ figure settled on by the Dutch court deals with these questions, it is necessary firstly to consider the background to this figure. The ‘at least 25% by 2020’ figure is taken from a table contained in the Fourth Assessment Report (AR4) of the Intergovernmental Panel on Climate Change (IPCC) published in 2007.Footnote 27 Several decisions adopted by Conferences of the Parties to the United Nations Framework Convention on Climate Change (UNFCCC)Footnote 28 explicitly referred to this tableFootnote 29 and, in Urgenda, this table was introduced as evidence by the claimantFootnote 30 and accepted as fact by the courts of lower instance. According to the AR4 table of 2007, in order to be on track with a 450 parts per million (ppm) carbon dioxide equivalent (CO2e) scenario by 2100, which is generally considered to correspond to a 2°C warming, developed countries were to reduce their GHG concentration levels by between 25 and 40% by 2020.
With regard to the first question raised above concerning the global temperature pathway and corresponding carbon budget, it is necessary to consider that the 25 to 40% range in the IPCC AR4 is a single-year target and, as such, it is highly time-sensitive. Single-year targets do not consider cumulative emissions released up to the target year.Footnote 31 The fact that a country has achieved a single-year target does not, therefore, automatically mean that it has remained on the same long-term temperature pathway with the same likelihood level as that intended at the time when the single-year target was set. Published 12 years before the Dutch Supreme Court's Urgenda judgment, the reliability and accuracy of the emissions data underlying the ‘at least 25%’ figure at the time of the judgment are thus highly questionable.
As to the question of equitable distribution, the 25 to 40% mitigation range reflects a summary of 16 equity studies of state climate action published between 2001 and 2006.Footnote 32 Den Elzen and Höhne, the authors of the AR4 box,Footnote 33 aggregated the results of these 16 equity assessments into an emissions reduction range, thus producing what this article will subsequently refer to as a ‘meta-equity assessment’. A mitigation level of 25% is located at the least ambitious end of the range of what the authors behind the 16 equity studies considered to be a fair contribution by industrialized countries towards a stabilization of 450 ppm. Notably, a meta-equity assessment by the Climate Action Tracker – which, in many respects, could be considered the AR4 box version of September 2019, a few months prior to the Urgenda judgment – suggests that a 25% reduction level would no longer correspond to the IPCC's 2°C benchmark pathway, but rather moves towards a 3°C pathway.Footnote 34
Before exploring the Tracker's methodology in depth through a legal lens, it is opportune to consider the way in which the German Constitutional Court approached the global pathway/carbon budget and equity questions in its climate judgment of March 2021.Footnote 35 While limiting itself – at least for the momentFootnote 36 – to issuing a procedural injunction that obliges the ‘legislator’Footnote 37 to specify mitigation targets post-2030, the German Court's decision engages with questions pertaining to Germany's carbon budget in elaborating the grounds for its order. The main point of reference that the Court uses for its elaborations is a carbon budget calculation for Germany authored by the German Advisory Council on the Environment.Footnote 38 This calculation answers the global pathway question by settling on a 1.75°C temperature increase by 2100 at a 67% likelihood level.Footnote 39
Compared with Urgenda, this calculation is based on considerably more up-to-date emissions and pathway data – one of the key criteria mandated by the best available science principle. As far as the equitable distribution question is concerned, the budget calculation referred to by the Court uses emissions per capita for the present day as the sole equity factor underlying the distribution of the global carbon budget among states.Footnote 40 Both the German Advisory Council on the Environment and the German Constitutional Court acknowledge that other ways of operationalizing the equity principle exist.Footnote 41 Meanwhile, the draft amendment of the German Climate Change Act drawn up in response to the order of the Constitutional Court contains mitigation targets that cumulatively exceed the carbon budget that was used as a reference point by the Court by almost one-fourth.Footnote 42 This leaves no doubt as to the urgent need for more transparency and the necessity to close methodological gaps for a specification of states’ individual mitigation obligations in line with equity and best available science to be possible.
This task cannot be shouldered by the judiciary alone. In fact, many courts are limited to considering the evidence brought before them. Moreover, just like litigants, courts may lack the resources and may even lack the authority to engage in extensive interdisciplinary, exploratory research to compare different equity assessments of state climate action in order to develop a legal approach to interpreting states’ mitigation obligations informed by the best available findings from various disciplines relevant to tackling the climate emergency.Footnote 43
To increase the transparency of states’ mitigation obligations, this article engages with meta-equity assessments of state climate action through a legal lens. The best established meta-equity assessment is provided by the Climate Action Tracker, a database founded in 2009 by Niklas Höhne, one of the two authors of the IPCC AR4 box. At its core, the methodology of the CAT (which is further analyzed in Section 3.1 below) stays true to that which supports the AR4 table. There are, however, a few critical differences. The CAT does not base its assessment on only 16 equity studies but uses more than twice as many.Footnote 44 The Tracker's analysis, moreover, includes significantly more up-to-date data both in terms of global temperature pathways and countries’ emissions data. A collaboration between the NewClimate Institute, Climate Analytics (two research institutes made up of climate scientists and policy analysts), and the Potsdam Institute for Climate Impact Research (PIK),Footnote 45 the Tracker rates government climate action against the 2–1.5°C Paris Agreement goal in accordance with IPCC temperature pathways.Footnote 46 In doing so, the Tracker ranks countries into six categories: (i) critically insufficient (>4°C); (ii) highly insufficient (>3°C); (iii) insufficient (>2°C); (iv) 2°C compatible; (v) 1.5°C compatible; and (vi) role model (<1.5°C). Each rating category is defined as reflecting the temperature increase that would come about if all other states were to undertake risk management ‘with the same relative ambition level’.Footnote 47
The remainder of this article gauges the extent to which the Tracker's assessment can be applied in the legal context and can serve as a means to specify states’ mitigation obligations in line with equity and best available science. To this end, the article engages with matters of statistical methodology through a legal lens. Doing so is indispensable for shedding light on the three questions raised above concerning the global temperature pathway, corresponding carbon budget and equitable distribution of the carbon budget among states. This article is concerned primarily with the latter and therefore focuses on statistical matters relevant to the carbon budget distribution. For example, what is the underlying concept of equity that has been used for distributing the global carbon budget/mitigation burden among states? Is there ‘congruence’ between ‘the definition of the concept’ of equity and the ‘empirical measure’ used, or is a ‘measurement error’ at work?Footnote 48 Has the best available data source been used to conduct empirical measurements?Footnote 49 If the figure specifying a state's mitigation level is an average of conducted measurements, is it a mean, median or mode type of average, and does this choice accurately represent what is ‘normal’ in the case at hand?Footnote 50 Before exploring the CAT methodology in detail through these questions, Section 3 will start with a brief overview of equity assessments in general.
3. META-EQUITY ASSESSMENTS OF STATES’ EMISSIONS
Equity assessments investigate ways of operationalizing the equity principle introduced to the international legal regime on climate change in 1992 by Article 3(1) UNFCCC and enshrined in the Paris Agreement. In a bid to specify the level of mitigation action needed by each state for a certain global temperature target to be met, academic studies have been undertaking equity assessments over the last two decades.Footnote 51 Generally, such studies start by specifying a global emissions level to be achieved in a certain year, which corresponds to a specific temperature increase (for example, 450 ppm CO2e in 2100, generally considered to correspond to a 2°C warming). Subsequently, they allocate mitigation efforts to individual countries, thereby ensuring that the cumulative amount of emissions reduction is consistent with the long-term objective defined at the outset. In allocating mitigation efforts, most studies choose a particular interpretation of the equity principle – namely responsibility, capability, equality, or a combination of these.Footnote 52
Seven years after publication of the AR4 table, Höhne, den Elzen and Escalante published a seminal paper which compared the results of approximately 40 such equity studies.Footnote 53 The scholars grouped the studies into seven categories according to the equity principle used and constructed an allowance range for each category. They then compared the ranges with each other.Footnote 54 In the same year, the IPCC published its Fifth Assessment Report (AR5), which included the analysis by Höhne and co-authors and categorization of existing equity assessments.Footnote 55 The categories identified are: ‘Responsibility’; ‘Capability’; ‘Equality’; ‘Responsibility, capability, and need’; ‘Equal cumulative per capita emissions’; ‘Staged approaches’; ‘Equal Marginal Abatement Costs (for reference)’.Footnote 56 Also based on Höhne's analysis, the AR5 visualized the ranges of emissions allowances in 2030 (relative to 2010) across equity categories and regions.Footnote 57 As the operationalization of the selected equity principle can vary significantly, quite a few of these allowance ranges are large. Like Höhne and co-authors, the AR5 finds that ‘[d]espite the ranges within a category, distributional impacts differ significantly with underlying criteria for effort sharing’.Footnote 58
3.1. The Climate Action Tracker
The CAT, founded in 2009, expanded on this work. Apart from a few variations, the equity categories the Tracker uses in its assessment reflect those included in the AR5. Based on approximately 40 studies, as well as additional calculations performed by the Tracker,Footnote 59 the CAT constructs an allowance range for each of the following equity approaches: responsibility; capability-need; equality; equal cumulative per capita emissions; responsibility-capability-need; staged approaches (part of the assessments also include a ‘capability-cost’ category).Footnote 60 The Tracker adds a cumulative category (‘all’), summarizing all categories. The cumulative allowance range thus reflects what the studies used by the Tracker ‘consider a “fair” contribution to greenhouse gas reductions’.Footnote 61 It is for this reason that the Tracker refers to this range as the ‘fair share range’.
According to the CAT, some mitigation levels, which are considered fair in certain studies, would not be ‘sufficient to hold warming below 2°C much less 1.5°C unless others do substantially more’.Footnote 62 Consequently, the Tracker subdivides the ‘fair share range’ into three ranking categories: (i) 1.5°C Paris Agreement compatible; (ii) 2°C Paris Agreement compatible; and (iii) insufficient. The ‘insufficient’ category is defined as corresponding to a warming of 2 to 3°C. For each rating category/temperature scenario, the Tracker calculates the allowance ranges under every equity approach. For each of these equity and rating categories, the Tracker indicates the minimum, maximum, and the median of the respective allowance range.Footnote 63 In identifying the minimum and maximum value, the Tracker chooses ‘to eliminate extreme outliers’ and thus ‘only consider[s] values within the 10th to 90th percentile of all values’ in each category.Footnote 64 The Tracker further adds an emissions value that it defines as the demarcation, or limit, between a warming of 3 to 4°C (highly insufficient category) and higher than 4°C (critically insufficient).Footnote 65 As Figure 1 shows, the Tracker's dataset contains these emissions values for each of the years 2020, 2025, 2030 and 2050.

Figure 1 The CAT Meta-Equity Assessment for the EU
Source: Climate Action Tracker, ‘EU: Comparability of Effort September 2019’, n. 34 above. Copyright © 2019 by Climate Analytics and NewClimate Institute. All rights reserved.
How exactly does the CAT calculate these values, which it claims allow conclusions to be drawn regarding the connection between a country's mitigation action and the global temperature increase? In its methodology section the Tracker explains that, as a first step, it calculates a ‘global effort sharing best case scenario’ and a ‘worst case scenario’. The former equals the sum of all countries’ emissions values at the bottom of their respective cumulative allowance range or fair share range. The worst-case scenario equals the sum of the maximum allowance values of each country's allowance range or fair share range.
The Tracker then ‘overlays’ this global range between best- and worst-case scenarios with global emissions pathways that lead to a certain temperature increase by 2100.Footnote 66 The Tracker specifies that the 1.5°C and 2°C pathways are based on the ‘set of mitigation pathways’ contained in the 2018 IPCC Special Report on 1.5°C (SR1.5).Footnote 67 More specifically, the Tracker's 1.5°C compatible benchmark pathway corresponds to the median of those pathways in the SR1.5 which limit the global temperature increase to 1.5°C. The Tracker's 2°C compatible benchmark pathway, in turn, draws on those pathways in the SR1.5 that limit global warming to 2°C above pre-industrial levels by 2100 with a probability higher than 66%, excluding the 1.5°C compatible pathways.Footnote 68
Having determined the ‘intersection’ between the global allowance range (Step 1) and the benchmark pathways, the Tracker calculates what it defines as the ‘minimal emissions reduction level’ for each country necessary to ensure that global warming is limited to a specific temperature increase ‘without relying on other countries making a comparably bigger effort to reduce emissions’.Footnote 69 By comparing these emissions values with each country's current emissions levels and policy projections, the Tracker ranks countries into six categories, ranging from critically insufficient (global warming of more than 4°C) to role model (below 1.5°C warming).Footnote 70
While the potential usefulness of the data generated by the CAT is self-evident, sceptics may query how exactly the Tracker arrives at what it determines to be countries’ minimal reduction levels. The relevant passage in the methodology section on the Climate Action Tracker's website reads:
We apply the relative level of the global ‘Fair Share’ range that corresponds to the 1.5°C and 2°C compatible global pathways to each country's ‘Fair Share’ range in order to determine the minimal emissions reduction level that would be required in order to make sure that the global target is met without relying on other countries making a comparably bigger effort to reduce emissions.Footnote 71
The Tracker does not provide further detail on how exactly the ‘relative level of the global “Fair Share” range’ is applied to each country's ‘Fair Share’ range, an omission which, at a first glance, might encourage doubts concerning the robustness of its methodology. To assess the potential of the Tracker's methodology for use in the legal context it is critical to investigate this point further. Therefore, this article conducts a detailed analysis of the data compiled by the CAT, which reveals that the Tracker determines minimal reduction figures for each country by means of the mathematical calculation in Figure 2 (subsequently referred to as the ‘minimal reduction figures (MRF) formula’). Figures 3 and 4 illustrate the variables used in this deduced formula and their relation to each other. Applying the variables illustrated in Figures 3 and 4, the MRF formula for a maximum global warming of 2°C (x2) and 1.5°C (x1.5) respectively reads as follows:
 $${\rm x}_2 = cwc-\left[ {\displaystyle{b \over a}z} \right]\qquad\qquad{\rm x}_{1.5} = cwc-\left[ {\displaystyle{c \over a}z} \right]$$
This means that the share of the global allowance range that needs to be reduced for compatibility with the 2°C or 1.5°C benchmark pathway is applied to individual countries proportionally to the respective width of their fair share range.Footnote 72 An analysis of the Tracker's data further reveals that for 2020 the difference between a scenario in which all countries choose to take mitigation action that corresponds to the least ambitious end of their respective fair share range and a scenario that is compatible with the 2°C benchmark pathway amounts to one third of the global fair share range:
 $$\displaystyle{b \over a} = \displaystyle{y \over z} = \displaystyle{1 \over 3}$$
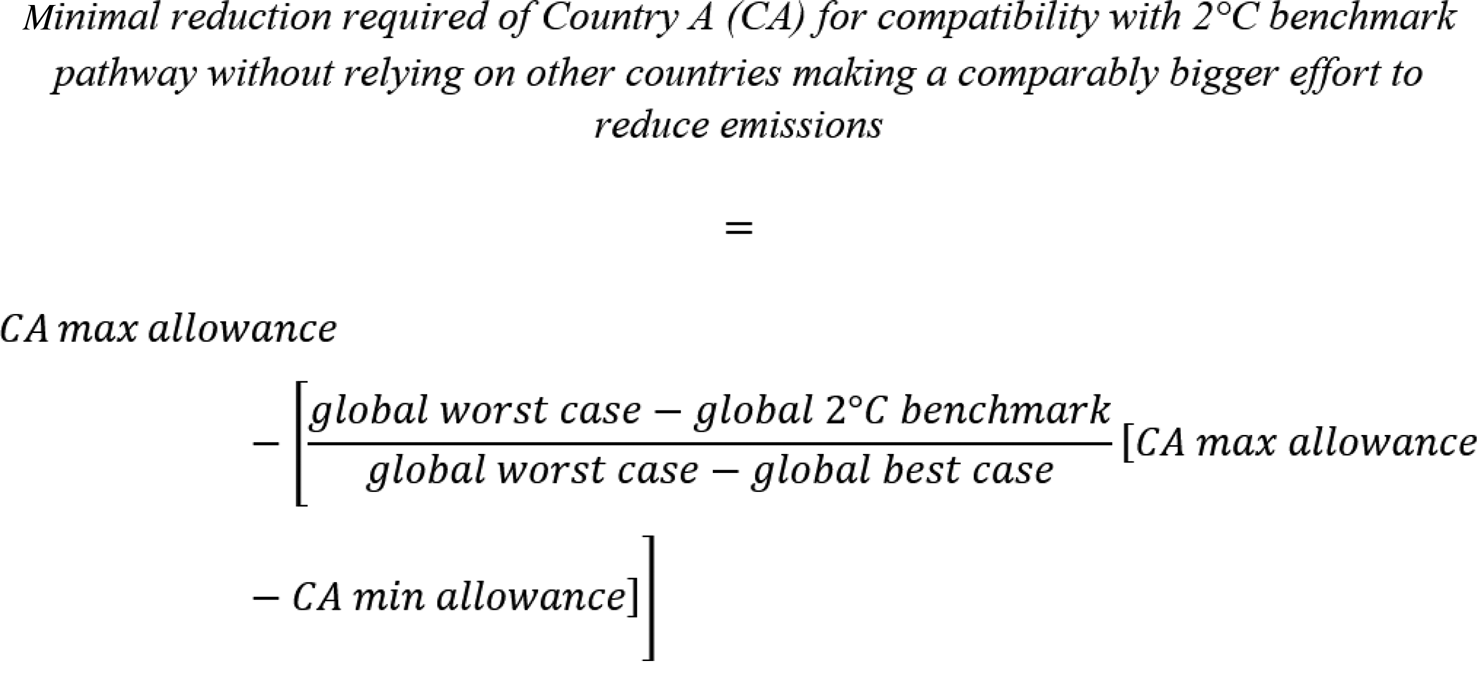
Figure 2 Formula that Yields the Minimal Reduction Figures that CAT Proposes (MRF Formula)

Figure 3 Visualization of the MRF Formula

Figure 4 Additional Specification of Variables in the MRF Formula
The difference between the ‘global worst case scenario’ and a scenario that is compatible with the 1.5°C benchmark pathway amounts to more than half of the global fair share range, or 57%:
 $$\displaystyle{c \over a} = 0.57 = \displaystyle{{2.85} \over 5}$$
These equations mean that, as calculated by the Tracker, the minimum mitigation level required of a country in 2020 for compatibility with the 2°C benchmark pathway corresponds to the upper end of a country's ‘fair share range’ minus one third of the width of its ‘fair share range’. For compatibility with the 1.5°C benchmark pathway, the amount to be subtracted from the upper end of a country's ‘fair share range’ increases to more than half of the width of its ‘fair share range’. 2020 emissions values that correspond to a 4°C pathway are calculated by adding one third of the width of a country's ‘fair share range’ to the upper end of a country's ‘fair share range’.
In sum, this means that the extreme values at the top and bottom of a country's ‘fair share range’ are given considerable weight in this formula. In fact, the highest and lowest fair share estimates are the only ones that matter when applying this formula. All studies in which the fair share estimates lie between these two extremes are disregarded. Figure 5 illustrates two hypothetical cases where this approach adopted by the Tracker could be problematic. In the first case (z) all equity studies settle on a similar estimate of what a certain country's fair mitigation contribution could be. The second case (z*) follows the same scenario, but with the addition of two studies that consider a much less ambitious contribution to be fair.

Figure 5 Two Cases in which the MRF Formula Yields Distinct Results
When applying the MRF formula, those very few studies that settle on much less ambitious action in z* lead to a considerable difference between the minimum reduction level (x) in z and z*. It is worth bearing in mind here that the more GHGs that one country emits, the smaller the remaining global carbon budget to be distributed among all other countries becomes. This means that the considerably less ambitious minimum mitigation level in z*, due only to those very few studies at the upper end of the z* range, needs to be compensated by other countries. Moreover, one needs to be aware that the approach chosen by the CAT to calculate the minimum ambition level will result in the same values for x*2 /x*1.5 in both hypothetical cases z* and y illustrated in Figure 6, which evidently differ greatly in their distribution of estimates.

Figure 6 Two Cases in which the MRF Formula Yields the Same Result
Unlike z, which has a small range, z* and y are cases with ‘high dispersion’, or a wide range. In cases of ‘high dispersion’, using the width of the range does not generate an accurate measurement of variables if values are unevenly (asymmetrically) distributed along the range (as is the case in z*).Footnote 73 The MRF formula as explained above is biased in favour of outliers.
An examination of the equity data the Tracker compiles for the assessment of the EU's mitigation action (Figure 1), discussed in Section 2, illustrates that the Tracker is well aware of this bias and takes steps to address it. Figure 1 contains a considerable outlier/extreme value that differs greatly from the rest: the maximum value of the 1.5°C ‘equality’ category reads 6,141 metric tons of carbon dioxide equivalent per annum (MtCO2e/a). This figure is an extreme outlier for three reasons. Firstly, it is an extreme outlier in its own category. Indeed, the median value in this very same category (i.e., 1.5°C ‘equality’) amounts to 3,779 MtCO2e/a and the difference between median and minimum value (3,671 MtCO2e/a) is only 108 MtCO2e/a. Secondly, compared with the values of all other 1.5°C equity categories, the only value higher than the ‘equality’ median is the maximum value for ‘staged approaches’, which is 3,850 MtCO2e/a. The 6,141 MtCO2e/a figure exceeds this value by a massive 2,291 MtCO2e/a. Thirdly, and more dramatically, the figure of 6,141 MtCO2e/a is 1,805 MtCO2e/a higher even than the highest values in the entire 2°C category. It thus becomes evident that this single study, which settled on a maximum value of 6,141 MtCO2e/a, would dominate the calculation when applying the MRF formula.
A closer look at the EU equity table, however, reveals that the CAT eliminates outliers in the MRF formula. In fact, in calculating the minimum reduction levels for compatibility with a specific temperature benchmark for the EU, the Tracker eliminated both the 6,141 MtCO2e/a figure as the maximum in the 1.5°C category, and the minimum in the 1.5°C category (482 MtCO2e/a for ‘equal cumulative per capita emissions’). For the latter, note that the difference between the next highest value is 1,253 MtCO2e/a while the difference between 6,141 MtCO2e/a and the next lowest figure was almost double that amount; the third value the Tracker eliminated as an outlier was the maximum value for the 2°C ‘capability-costs’ category (4,336 MtCO2e/a). By eliminating these outliers, the Tracker, using the MRF formula, calculates that for the EU the 2020 maximum emissions level to be rated compatible with the 2°C benchmark pathway amounts to 3,425 MtCO2e/a (see Section 2 above). Had the Tracker not eliminated any of the three outliers, that result would have been 4,254 MtCO2e/a. Had it eliminated only the 6,141 MtCO2e/a figure, the MRF formula would yield a result of 3,051 MtCO2e/a. Had it eliminated only the minimum of the 1.5°C ‘equal cumulative per capita’ category, the result would have been as high as 4,672 MtCO2e/a.
While not eliminating outliers would have led to a clearly biased result in the case at hand, this method, arguably, does not address the risk of bias in an ideal way. Eliminating outliers does not address the core of the issue: that the width of the range is not an accurate form of measurement in cases with an asymmetrical dispersion of values. In such cases, in fact, also ‘using the mean’ average would ‘clearly mislead’ because ‘outliers … drag the average way up or down’.Footnote 74 The statistically sound alternative in these cases is using the median (i.e., the middle value). Because the median has ‘the equal number of values above and below it’, it cannot be biased in favour of outliers.Footnote 75 Indeed, for the representation of the allowance ranges of the single equity categories, the Tracker indicates the minimum, maximum and the median values. However, the reason why it cannot do so for the overall ‘fair share range’ is that there is overlap between the different equity categories. The historical responsibility and capability categories, for instance, clearly overlap with the responsibility-capability-need category. Using any average value – mean, median or mode – would automatically lead to more weight being given to some variables and would be biased towards the equity category containing the highest number of studies.
The above analysis has brought to light another key question concerning the Tracker's meta-equity assessment: how can the maximum emissions level for the equality category for a 1.5°C scenario be significantly higher than the maximum of any equity category for a 2°C scenario? The Tracker notes that ‘[i]nstead of deciding what is fair, we construct a “Fair Share” range for each country from the range of fairness estimates from the literature’.Footnote 76 The Tracker certainly conforms with the gold standard in terms of expertise and independence; most of the studies it uses for its assessment are peer reviewed. Nevertheless, these highly dissonant mitigation values are likely to undermine trust in at least some of these scholarly studies even beyond issues of mere methodological robustness and data reliability. One of the CAT Briefing Papers accompanying a data update indeed speaks of:
ambigu[ity] for the upper end of emissions allowances …, where we found that 1.5°C compatible scenarios are not always lower than 2°C compatible scenarios for every country: In 2030, the upper end of 1.5°C-compatible scenarios is lower than the 2°C compatible scenarios for only 18 out of 33 countries.Footnote 77
In accounting for this ‘unintuitive result’, the paper states that:
[it] can be explained by the diversity of underlying studies and the fact that most studies only assess either 2°C or 1.5°C, but not both, and therefore inconsistencies can occur when comparing these two groups of studies. However, by 2050, the upper effort sharing boundary for 1.5°C scenarios is lower for all countries, except Brazil and Indonesia.Footnote 78
This explanation reveals the crux of the issue, namely, that the single studies use different datasets which ‘cannot be updated to reflect recent developments in country-level data, as the authors have not published updated versions of their allowance estimates’.Footnote 79 This is problematic and unlikely to support a conclusion that such an assessment is based on ideal scientific methods and constitutes an undisputable operationalization of the equity principle. This begs the question whether a calculation tool exists that allows for the identification of countries’ emissions allowance ranges according to the IPCC equity criteria and implements the different options for operationalizing and measuring equity in a way that is apt for legal use.
3.2. The PRIMAP Equity Tool
The preceding section has shown that the Tracker's analysis makes a valuable contribution to the determination of countries’ possible allowance ranges, but that objections can be raised as to the extent to which it is able to be legally operationalized. To explore whether tools exist that effectively address these objections, it is important to consider that the Tracker does not only use the values from the approximately 40 different equity studies as input data for its assessments. It also ‘take[s] into account … [c]alculations run by Climate Analytics with the PRIMAP Equity tool’ as well as ‘[c]alculations … by NewClimate Institute with the EVOC tool’.Footnote 80
Similar to the Tracker, the equity tool developed by Climate Analytics together with the PIK, and embedded in the Potsdam Real-time Integrated Model for the probabilistic Assessment of emission Paths (PRIMAP), is presented as ‘offer[ing] a modality that allows users to emulate equity regimes based on various equity criteria’.Footnote 81 To date, the CAT provides a meta-equity assessment for 33 countries and regions (including the EU, which is classified as a single entity), which covers about 80% of worldwide emissions. By comparison, the PRIMAP Equity tool embedded in the PRIMAP Emissions moduleFootnote 82 belongs to the PRIMAP database, which covers all countries worldwide.Footnote 83 The methodology description of the PRIMAP Equity tool provided by Climate Analytics reveals that the tool further offers features that are critical in addressing the objections raised in the previous section of this article. The tool itself is not publicly available, which is why the following analysis is based on the latest methodology description available in 2017.
Like the Tracker's meta-methodology analyzed in the previous section, the PRIMAP Equity tool calculates emissions allowance ranges for individual countries reflecting IPCC equity criteria.Footnote 84 However, instead of constructing five separate ranges for the different IPCC categories that in part overlap with each other, the PRIMAP Equity tool uses what can be called three ‘equity pillar categories’: (i) historical responsibility; (ii) capacity to mitigate; and (iii) potential to mitigate. Figure 7 shows the empirical measures that are available in the tool for an operationalization of the categories defined.

Figure 7 Empirical Measures Available in the PRIMAP Equity Tool
Source: Rocha et al., n. 81 above, pp. 1–2, 5.
To understand how the three ‘pillar categories’ can be said to reflect the full range of IPCC categories in a valid way, a closer look at how the emissions allowance ranges are calculated in the PRIMAP Equity tool is required. The tool allows for:
[w]eights [to] be attributed to each one of the criteria selected. This means that allocation regimes based on only one of the criteria, e.g. responsibility, or based on more than one criterion, and assuming either equal or different weighting among the different criteria can be studied. For each criterion, one or a set of empirical measures to evaluate them can be selected, also with different weights. Such an approach allows for full flexibility of assumptions in regard to criteria and metrics.Footnote 85
More specifically, emissions allowance ranges are calculated by means of the following three steps:
(1) random weights are attributed to each indicator and measure;
(2) resulting emissions pathways calculated; and finally
(3) calculations are repeated multiple times to define a range of possible pathways.Footnote 86
This ‘tree search’ procedure is indeed a state-of-the art statistical method of robustness.Footnote 87 As a Climate Analytics statement explains, ‘[s]uch an approach allows capturing the full range of emissions allowances of a country and to determine how different criteria and metrics influence its outcome’.Footnote 88 In this context, it is important to note that the possibility of allocating all possible weighting combinations within and between categories compensates for, or even dispels, concerns over the low number of equity studies used by the PRIMAP Equity tool (a total of six), and the older publication date of some of these studies. Many of the 40 or so studies used by the Tracker or the IPCC in fact use the same approach, except for different weighting regimes, and thus are also reflected in PRIMAP. Notwithstanding this, it would certainly be valuable to examine whether more recent studies use IPCC equity aspects not yet integrated into the tool. More information is further warranted as to how the ‘final [mitigation distribution] index … is obtained by normalising and weighting the interim index by the population share of each country’.Footnote 89
One distinct advantage of the PRIMAP methodology is that, unlike the approach analyzed in Section 3.1, the PRIMAP Equity tool avoids uncontrolled overlap between categories and thus allows for its values to be accurately represented using the median value. An equally critical point in terms of methodological robustness is that Climate Analytics notes that it has ‘consistently used the same datasets across all scenario runs, ensuring that the differences between emissions allowances across scenarios arise from criteria/metric [i.e., weighting] choices alone and not through data divergences’.Footnote 90 Finally, and most crucially, the datasets in the PRIMAP Equity tool, which are used in a consistent and uniform manner across calculations, can be updated to reflect the latest and best available emissions data and global pathways.Footnote 91
Overall, this analysis leads to the conclusion that the PRIMAP Equity tool offers a very robust way of approaching the question regarding equitable distribution of the total mitigation burden. Before enabling a conclusion that it is also the ‘best available’ tool, a comparison with other extant meta-equity tools is warranted.
3.3. Comparison with Other Meta-Equity Assessments
The other tool the CAT uses for its calculations is the Evolution of Commitments (EVOC) tool, developed by Ecofys, an energy and climate consultancy. Like the PRIMAP Equity tool, the EVOC tool is not publicly accessible and the latest available methodology description dates back to 2011.Footnote 92 The equity categories used are, by and large, compatible with the IPCC equity criteria. However, in terms of methodological transparency, no information is provided on how the algorithm used in the EVOC tool integrates the different criteria, or the different weighting that is given to these criteria. Critically, CAT briefings on data updates report on the PRIMAP Equity tool being updated, but do not mention the EVOC tool.Footnote 93 Furthermore, no information about the tool published since 2014 is available, which suggests that it has not been updated since then.
There are three further equity calculation databases with the declared objective of providing a meta-equity assessment and about which public information is available. To a small or larger extent, they all refer to the CAT or the PRIMAP database as a reference framework. A notification on the Climate Interactive website reads:
[With] the addition of assessments like the UNEP Emissions Gap report, expanded efforts like the Climate Action Tracker, and many others, the need to offer another analysis of the gap between where policies are headed and what is needed has felt well covered. As a result, Climate Interactive has decided to invest our time in other endeavours. The Climate Scoreboard analysis below is no longer being updated and does not reflect the latest pledges countries have put forward.Footnote 94
This excludes the possibility of this database offering the best available approach at the current date.
The Climate Equity Reference Calculator, a meta-equity calculation tool created by the founders of the Greenhouse Development Rights approach,Footnote 95 uses the criteria of responsibility and capability in its calculation. In consulting this publicly available database, users can decide on the ratio between capability and responsibility. Responsibility is operationalized in terms of cumulative historical emissions, and capability in terms of income.Footnote 96 Consequently, the mitigation potential – namely, carbon or emissions intensity – is not taken into account in this calculating tool, which means that the full range of IPCC equity criteria is not reflected. A distinctive feature of the tool, which would make a valuable addition to the PRIMAP Equity tool (if not already integrated), is the possibility for users to choose the option of adding a ‘development threshold’:
The development threshold defines an income threshold below which an individual's income, whatever country they may reside in, is taken to be exempt from the calculation of national fair shares. Which is to say that income below the development threshold is not taken to contribute to national capability, nor are emissions corresponding to consumption below this threshold taken to contribute to national responsibility.Footnote 97
The last update notice on the Climate Equity Reference Calculator is dated 18 October 2018 and the global pathways used in the Climate Equity Reference Calculator are taken from the Climate Action Tracker:
In mid 2015, we decided to standardize on the global mitigation pathways provided by the Climate Action Tracker … As a result, this paper, which describes and analyses the global emissions pathways that we had previously assembled for the use with the Climate Equity Reference Framework is out-of-date and is currently being reworked. In the meanwhile, you might want to check out the Climate Action Tracker's own description of their methodology and of their pathways that we use here.Footnote 98
A final meta-equity assessment tool on which public information is available is the Paris Equity Check. A meta-equity assessment created by PIK researchers, the Paris Equity Check's methodology section reveals that the ‘emissions allocation model used’ was taken from the ‘emissions module’ of the PRIMAP module and thus was based on the same study referred to in the methodology description of the PRIMAP Equity tool discussed in Section 3.2.Footnote 99 The Paris Equity Check can therefore be considered a precursor to the PRIMAP Equity tool. The last update of the Paris Equity Check website goes back to 2015. Similar to the CAT, the equity operationalization in the Paris Equity Check retains the structure of overlapping categories in the AR5. This is useful for assessing the difference between equity categories but, compared with the PRIMAP Equity tool, it is less transparent and robust when it comes to settling on one representative reduction level figure for an individual country. Moreover, the methodology description to which the Paris Equity Check refers does not mention the possibility of attributing different weights to empirical measures used within one equity category.Footnote 100 Furthermore, the Paris Equity Check methodology section refers to the CAT, noting that in some cases mitigation figures as calculated by the Tracker are used.Footnote 101
Overall, this comparison supports the conclusion that the PRIMAP Equity tool indeed offers the best available among extant meta-equity methodologies.Footnote 102
4. CHALLENGES AHEAD
This article has argued that a legal methodology to specify states’ mitigation obligations in line with the equity principle and best available science needs to distinguish between the following interrelated questions, which warrant different epistemological and methodological approaches. The first two questions ask what global temperature pathway is to be pursued and what is the total amount of global emissions to which this corresponds. The third question asks how the total mitigation burden – a function of the answer to the first two questions – can be distributed equitably among states. After making the case that answering these questions on the basis of state practice, opinio iuris, and the good-faith principle alone is insufficient, the remainder of the article engaged in an in-depth exploration of the best possible way of answering the third question. By comparing extant approaches relevant to this quest, the article concludes that the best available tool to calculate an equitable distribution of the global carbon budget in accordance with IPCC equity criteria is the PRIMAP Equity tool. In calculating countries’ allowance ranges, this tool allows for attributing all possible weighting combinations among and within the IPCC equity criteria. The criteria are operationalized in a transparent and comprehensive manner, using objectively reviewable data. The same emissions data sources and global pathways are uniformly used for the calculation of allowance ranges. A further critical advantage of the PRIMAP Equity tool is that it allows for these emissions data and pathways to be updated. The major task ahead is to engage with these pathway models and the inherent normative choices from a legal vantage point, and search for the best possible ways of determining the global temperature pathway to be pursued and the corresponding carbon budget in line with equity and the best available science. Of paramount significance in this context are recent studies which revised Nordhaus's famous DICE Model according to ‘latest data and insights from both climate science and economics’Footnote 103 These studies found that the original DICE Model's finding that an ‘economically optimal warming outcome would correspond to 3.5°C’ has to be drastically corrected downwards even without tipping points being considerd.Footnote 104 Engaging with such studies, and temperature and emissions pathways generally, from a legal perspective is indispensable in the quest for developing a legal methodology capable of specifying states’ individual mitigation obligations in line with the equity principle and best available science. Not doing so is a luxury the legal community does not have in the face of a climate emergency that poses risks to present and future life on earth of an unprecedented magnitude in terms of both severity and irreversibility.
POSTSCRIPT
The above article was written before September 2021. On 15 September 2021, the CAT published a comprehensive update to its rating methodology.Footnote 105 Not only does this update provide detailed information on how the ‘fair share range’ is constructed,Footnote 106 but it also includes measures to address some of the methodological issues analyzed in the article above. Most importantly, no longer are only the extreme values, or the minimum and maximum ‘data point[s]’ of a ‘fair share range’, used in calculating states’ minimal reduction levels for each temperature category.Footnote 107 Rather, by introducing a Cumulative Distribution Function, the Tracker now takes into account the distribution of ‘datapoint[s]’, or studies, within the range.Footnote 108 This is why the Tracker writes that ‘[t]he definition of the fair share range has changed to limit the possible influence of a small number of extreme studies’.Footnote 109 The Cumulative Distribution Function is further calibrated in such a way as to give ‘equal weight’ to each rating category.Footnote 110 This has important implications. With this step the Tracker avoids giving more weight to one equity category just because there are more studies in relation to it. As such, this is a significant improvement compared with the previous methodology. It is necessary to consider, however, that giving equal weight to all equity categories means giving more weight to some studies, or scholarly opinions, than to others on the sole basis of the number of other studies in the same category. Figure 8 visualizes a hypothetical case which has been drawn up analogously to the more complex figure the Tracker uses to demonstrate the new way of constructing the ‘fair share range’.Footnote 111 As in the original figure by the Tracker, the different symbol size in Figure 8 indicates the different weight allocated to different studies in order to give equal weight to each equity category.Footnote 112 In the hypothetical case illustrated above, one study in the ‘Capability and costs’ category is weighted considerably more than one study in the ‘Equal cumulative per capita emissions’ category.Footnote 113

Figure 8 Fair Share Range Construction According to the Tracker's September 2021 Methodology
The disparity in weights attributed to different studies may become more pronounced as a consequence of the fact that the Tracker eliminates both the highest and lowest 5th percentile of ‘the weighted distribution’Footnote 114 (marked in grey in Figure 8). This is a step the Tracker chooses in both its new and old methodology to limit the effect of outliers. From a legal viewpoint, however, this measure is not ideal: for instance, when the highest 5th percentile is made up of studies that all belong to just one category, as in the case with the ‘Capability’ category in Figure 8. In this case, the ‘Capability’ category will be represented by just one study which happens to be within the middle 90% of the distribution. In calculating a country's minimal reduction level in line with the September methodology update, this one study will be given equal weight to the sum of all five studies in the ‘Staged approaches’ category. This one ‘Capability’ study, or datapoint, however, is not representative of the studies in its category with the mean average situated at ‘x’ and the median equalling the datapoint highlighted in Figure 9.

Figure 9 Averages within One Equity Category
Furthermore, by giving equal weight to each equity category, there continues to be overlap between categories, which may lead to uncontrolled double counting of certain empirical measures. This is the case, for instance, for the empirical measure of ‘per capita cumulative emissions’ from, for example, 1990 to the present day. This empirical measure is used to operationalize the ‘Responsibility’ category and it also plays a key role in the ‘Responsibility, capability, need’ category. Hence, even with this methodological update, certain empirical measures are weighted more than others in a way that cannot be transparently accounted for.
Lastly, the Tracker emphasizes that the ‘fair share allocations’ it calculates itself, which is to be deduced as referring mainly to the PRIMAP Equity tool,Footnote 115 have been updated to reflect more recent emissions pathways.Footnote 116 The Tracker further states that some of the studies in its dataset have been replaced with newer ones.Footnote 117 While an improvement, this does not resolve the issue concerning possible inconsistencies between the datasets in the ‘over 40 studies’Footnote 118 included in the Tracker's assessment, which, in some instances, previously even led to higher emission values for a 1.5°C compatible scenario compared with a 2°C scenario.Footnote 119
When drawing conclusions from the above analysis, it is important to recall that the Climate Action Tracker constructs the ‘fair share range’ so that its assessments are not only based on its own calculations with the PRIMAP Equity tool but also reflect 40 or so external studies. The update introduced by the Tracker in September 2021 significantly improved the construction of the ‘fair share range’. For legal use, however, the PRIMAP Equity tool used by the Tracker and developed by two of its founding institutionsFootnote 120 is still to be considered the best available method when it comes to distributing a global carbon budget in line with equity and best available science.Footnote 121


 Open access