


Radiocarbon (14C) dates estimate the age of sites, stratigraphic layers, houses, burials, caches, hearths, and so on. But in large numbers, 14C ages are important data in their own right. Although there are biases to consider, the analysis of aggregated 14C dates help study human demography of the past approximately 55,000 years, the limit of 14C dating under IntCal20 (e.g., Kelly et al. Reference Kelly, Surovell, Shuman and Smith2013; Robinson et al. Reference Robinson, Kyle Bocinsky, Freeman, Bird and Kelly2020; Shennan et al. Reference Shennan, Downey, Timpson, Edinborough, Colledge, Kerig, Manning and Thomas2013). Therefore, from 2014 to 2021, we compiled 104,027 radiocarbon ages for the lower 48 states. Figure 1 shows counts by state and date density by county. Here, we report on the database, which is freely available to vetted researchers through the Canadian Archaeological Radiocarbon Database (CARD; Martindale et al. Reference Martindale, Morlan, Betts, Blake, Gajewski, Chaput, Mason and Vermeersch2016), Supplemental Table 1, and GitHub.
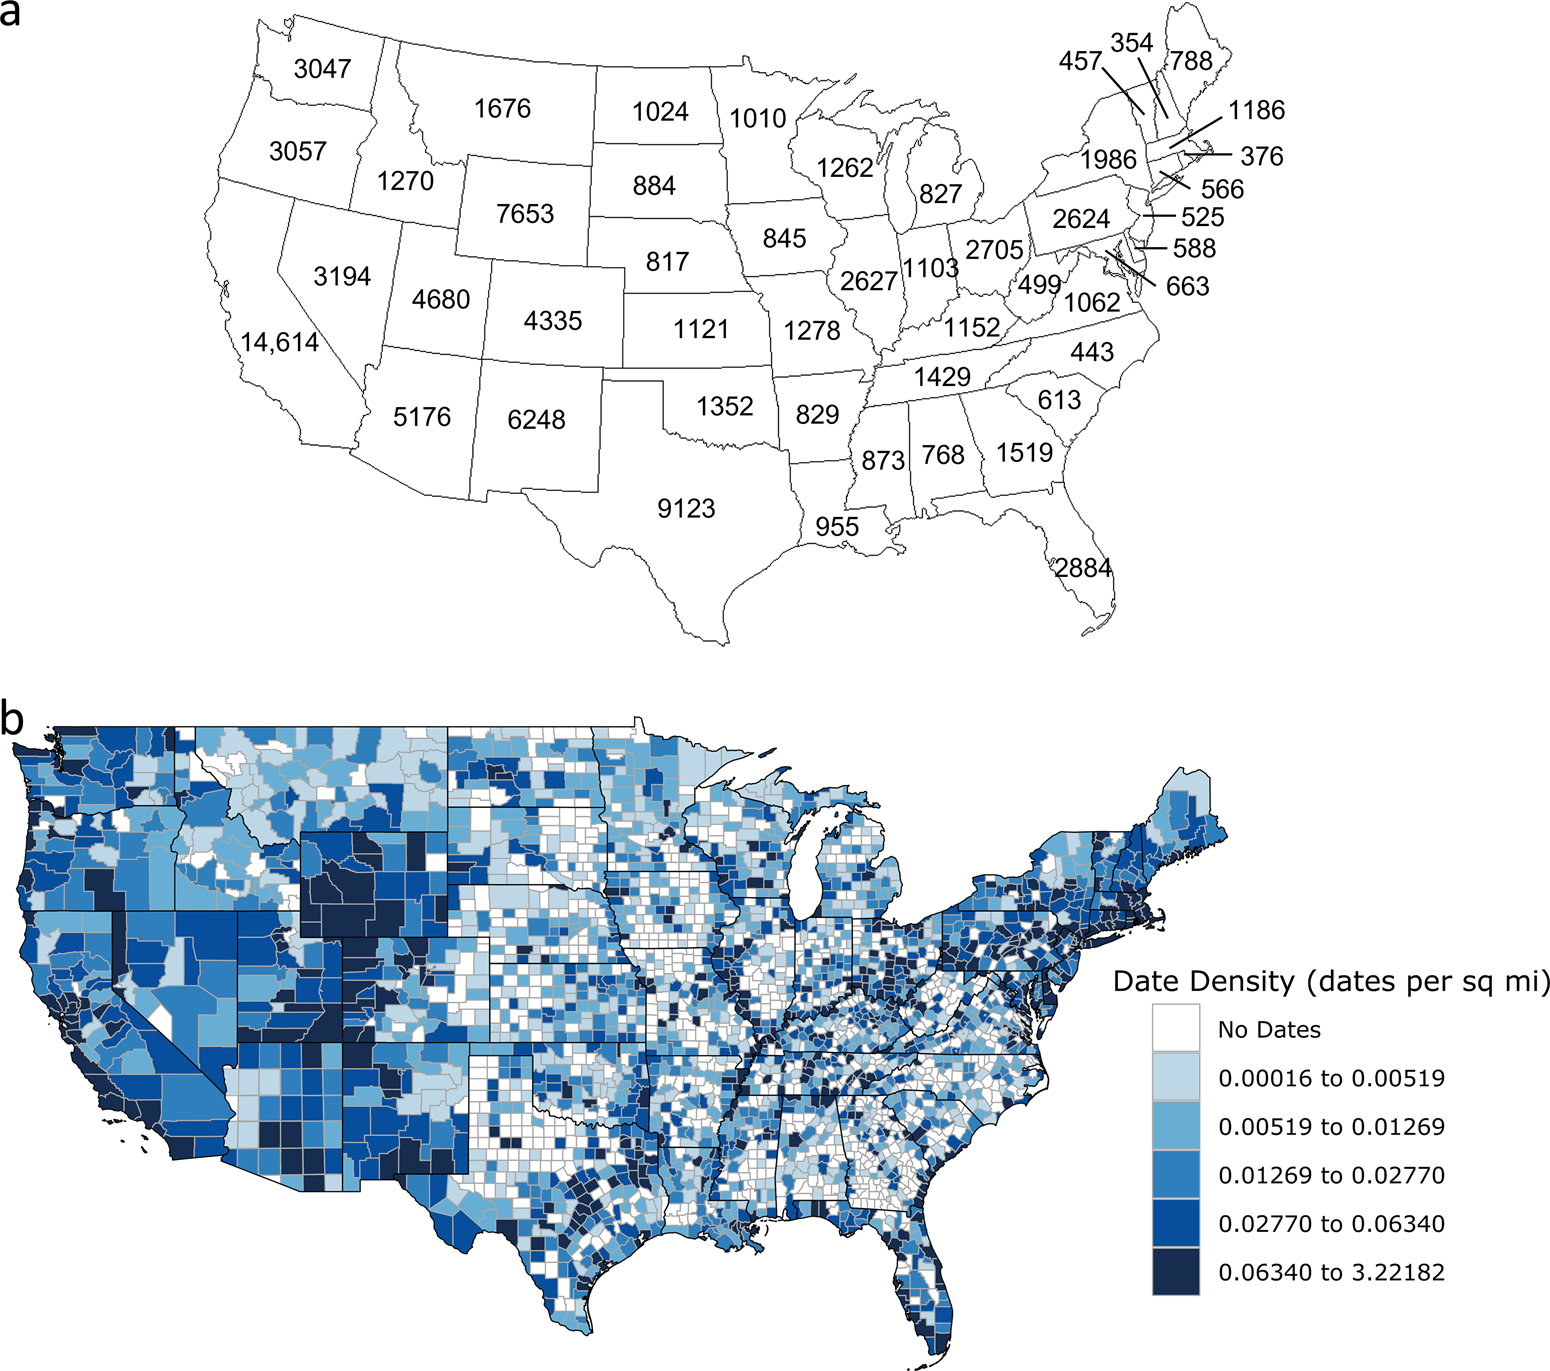
Figure 1. Distribution of 14C dates across the lower 48 states: (a) map of the lower 48 states with numbers of all 14C dates recorded for each state; (b) date density by county made with Choroplethr (Lamstein Reference Lamstein2020) (created by Madeline Mackie). (Color online)
Background
Archaeologists recognized the importance of a radiocarbon database soon after Willard Libby developed the method in 1950. Frederick Johnson created Radiocarbon Dates Association Inc. in 1952 at Phillips Academy's Peabody Institute of Archaeology, compiling dates on punch cards until 1972 (Baich Reference Baich2010; Gates Reference Gates2017). In 1959, the journal Radiocarbon was created to publish dates, which it did through 1987. Berry (Reference Berry1982) was among the first to use a 14C age compilation, employing one in the northern Southwest to track intensity of occupation. Rick (Reference Rick1987) focused the approach on population and labeled it “dates as data.” In 1987, Kra (Reference Kra1988) organized a conference to create an international radiocarbon database. Although that effort stalled, it inspired one participant, Richard Morlan, to create CARD. About the same time, 14C databases were started in Europe (e.g., Vermeersch Reference Vermeersch2020).
Radiocarbon ages, to at least some extent, track changes in human population. They do this indirectly by tracking energy extracted as fuel, food, clothing, housing, et cetera (Freeman et al. Reference Freeman, Byers, Robinson and Kelly2018). Date distributions are affected by taphonomic loss (Bluhm and Surovell Reference Bluhm and Surovell2019; Surovell et al. Reference Surovell, Finley, Smith, Jeff Brantingham and Kelly2009), and they may only record statistically significant peaks and valleys detected by comparison to null models of growth (Shennan et al. Reference Shennan, Downey, Timpson, Edinborough, Colledge, Kerig, Manning and Thomas2013). Large databases can swamp date clusters produced through research bias, and rcarbon (Crema and Bevan Reference Crema and Bevan2021)—the primary program used to produce summed probability distributions of 14C ages—has binning and thinning routines to compensate for overdating of features, strata, or sites. Progress is being made in the use of 14C dates to track human demography through time (e.g., Edinborough et al. Reference Edinborough, Martineau, Dufraisse, Shennan, Imbeaux, Dumontet, Schauer and Cook2021; Palmisano et al. Reference Palmisano, Lawrence, de Gruchy, Bevan and Shennan2020; Price et al. Reference Price, Capriles, Hoggarth, Kyle Bocinsky, Ebert and Jones2021; Shennan and Sear Reference Stephen and Sear2021). And to continue to move forward, the field needs the data to be made available.
Compiling Dates
All dates were compiled from databases, publications, gray literature reports, site forms, or communications with researchers. We produced no new dates. We included all dates located regardless of quality, given that we cannot anticipate what uses future researchers might find for dates that today appear useless.
We conducted the data collection in three “slices”: the 11 western states, 12 central states, and 25 eastern states. Although obtaining lab records might seem the easiest way forward, labs cannot share their data for proprietary reasons. Therefore, we downloaded data from CARD and databases compiled by state entities and individuals (Table 1). Over the years, we contacted hundreds of researchers for gray literature reports, metadata, or clarification. For states with digital archives, we searched report titles for terms such as “data recovery,” “Phase III,” and “excavation.” We tracked down defunct radiocarbon lab databases, with mixed results. We searched the January 1950–December 2020 issues of national, state, and regional journals, bulletins, and newsletters, as well as recent books/monographs whose titles suggested they may contain dates. We e-mailed colleagues about recent academic or CRM projects and conducted blind Google searches (e.g., Indiana, archaeology, radiocarbon). In addition to reviewing all PhD and MA titles in ProQuest and ScholarWorks for likely sources, we e-mailed CRM firms asking for reports or permission for Beta Analytic to make dates available to us. This was useful for the western states but less so for the central states. We targeted only a few large firms in the East.
Table 1. Databases Used as Baseline Population (Not Including Initial CARD Dates).

Supplemental Text 1, Part I describes how we collected, entered, and checked data. We used the CARD submission Excel template. As a global database, CARD attempts to balance general utility with local relevance. It does so by winnowing the relevant data/metadata to a few fields: Lab Number, Field Number, Material Dated, Taxa Dated, Type of Date, Location, Provenance (e.g., submitter, date submitted), Measured Age/Error, Normalized Age/Error, δ13C, Significance (e.g., Phase), Site Number, Site Name, Stratigraphic Component, Context, Associated Taxa, Additional Information (we used this to record if a date was AMS or radiometric), Comments, and Reference.
We gave little attention to metadata that was difficult to obtain or that seemed of little value (e.g., Provenance, Stratigraphic Component) that could be a matter of considerable debate (Significance) or could involve an endless list (Associated Taxa). Instead, we focused on information we thought researchers would need for data scrubbing: Lab Number, Material and Taxa Dated, Type of Date, Location, Age, δ13C, Site Name and Number, Context, AMS/Radiometric, Comments, and Reference. As dates were added to our state databases, we checked for duplicates based on the lab number. We resolved duplicates with conflicting information by consulting original sources or by contacting authors.
Lab Numbers
Lab numbers are essential to track duplicate ages. They also allow researchers to remove entries from labs—such as Dicarb and Gakushuin—whose results some archaeologists have questioned (e.g., Reuther and Gerlach Reference Reuther and Gerlach2005). Lab numbers should always accompany published radiocarbon ages (Millard Reference Millard2016). They should also use official lab abbreviations (http://radiocarbon.webhost.uits.arizona.edu/node/11). For example, Beta Analytic is “Beta-,” not “B” (which is Switzerland's Bern lab) or “β.” Where lab numbers did not follow convention, we sought the correct identification. AMS dates sometimes have two numbers if the preparation and accelerator labs differed—for example, Beta-xxxx/ETH-yyyy. Note that we did not use leading zeros on lab numbers.
In cases where a report provided the lab but not the number, we recorded the date, for example, as “Beta-?” We also added “?” to any uncertain lab number. We listed unknown lab numbers as “?”; in CARD, these appear as “LUNK-x.” We checked for whether these dates were recorded properly elsewhere in our files or tried to resolve them by consulting researchers.
Material Dated
The CARD template provides specific options, such as charcoal, wood, bone, shell, pottery residue, sediment, and unknown. The Taxa Dated column allows for elaboration, such as species (using the report's nomenclature—i.e., Latin or common name) and condition. Some archaeological dates have “unknown” material (n = 5,261; 5.1%).
We labeled dates on cultigens as “Seeds,” with Zea mays, Phaseolus, and others in the Taxa Dated column (noting for maize, if possible, whether the sample is a cob, kernel, or cupule). Dates on human bone, teeth, hair, tissue (very rare), or coprolites are labeled “Homo sapiens” under Taxa Dated, with additional information when available. Textile includes anything manufactured from plants (e.g., basketry, sandals, cordage); animal skin-based goods appear as Leather. Wooden or bone artifacts appear as Wood or Bone, with description under Taxa Dated. For bone dates, we report where possible if the date was collagen or apatite and which method was used (e.g., XAD, ultrafiltration).
Type of Date
We focused on archaeological ages but added geological and paleontological ages if such dates fell into our laps. Geological ages do not necessarily date human presence, so a dated hearth in an arroyo profile is “archaeological,” but isolated charcoal in the same profile is “geological.” Paleontological dates include those on faunal remains not found in archaeological sites and those from pack-rat middens. Dates from archaeological sites were considered “archaeological,” and sediment dates were “geological,” unless something in the context or comments suggested otherwise.
Location
CARD masks site locations to the public by randomizing them within 500 km of their submitted location. Registered users gain access to specific site locations. However, we only recorded location to county, with the county's centroid as the site's latitude and longitude. The county is encoded in a site's Smithsonian trinomial, but some states do not use this system. For Connecticut, Delaware, Maine, New York, and Rhode Island, we used reports and maps to link sites to their counties. In New Mexico, where sites are numbered sequentially (e.g., LA1, LA2), we obtained counties from reports or from the state's Laboratory of Anthropology. Arizona uses two major systems: the primary one relies on 1° × 1° map blocks, so we treated these as counties (we linked “NA-x,” Museum of Northern Arizona numbers, to these map blocks). The use of county-level locational data unfortunately precludes some kinds of spatial analyses (Robinson et al. Reference Robinson, Nicholson and Kelly2019), but any other uniform masking procedure requires buy-in by all SHPOs/THPOs, and this was unlikely in our project time frame.
Ages
The CARD template records measured and normalized (aka conventional or corrected—i.e., corrected for isotopic fractionation) ages. We did not record calibrated date ranges because they are often reported incorrectly (as 1σ or 2σ ranges, when the possibly several ranges and their associated probabilities is the correct format) and because the calibration curve changes every few years. Ages were sometimes difficult to assign to measured or normalized dates, but only the latter should be calibrated, so it is important to distinguish between the two.
Ages are normalized to a δ13C value of −25.0‰; consequently, a measured age with δ13C = −25.0 is the normalized age. Dates with δ13C values <−25 become younger when normalized; those with δ13C values >−25 become older. All AMS dates are normalized; radiometric dates, particularly those generated between 1950 and the mid- to late 1990s often are not.
We included dates with only measured ages because some researchers may be comfortable normalizing charcoal or wood dates to an assumed value of −25.0 (−10 for maize) or, for materials identified to taxa, another standard (e.g., Morlan Reference Morlan1999). Where a reference provided both the measured and normalized ages, we entered both, along with the δ13C value, if provided. Ages produced by labs that closed doors before δ13C analysis became standard (e.g., Michigan, Florida, Florida State, Wisconsin, Washington State) are considered measured unless a δ13C value was reported. Sometimes a report states that a date was normalized, but it does not provide the δ13C value; these are reported as normalized, with a comment.
Some labs were able to report when they began to routinely normalize dates. For Beta, this was with lab numbers greater than Beta-70783; for Georgia, lab numbers greater than UGa-5470. All ISGS dates are normalized. Geochron began normalizing soon after 1980 (Alex Cherkinsky, personal communication 2021). We used GX-8633 as the cutoff, knowing it was a 1982 normalized date (Reuther Reference Reuther2003:25). We normalized some Texas (Tx-) dates with δ13C values reported in a partial lab database.
As detailed in Supplemental Text 1, we also report dates as Radiometric, Radiometric Plus (extended counting time), or AMS. Unfortunately, many reports do not include the method used.
Finally, some labs and investigators report dates rounded to the nearest five years. We did no rounding, and we recorded dates as they were reported.
Site Name and Number
We recorded a site's number (the Smithsonian trinomial, but see above) and—when given—its name. Anyone familiar with site management is aware of duplicate site numbers, sites with multiple numbers, and confusing names (e.g., Utah has a Dust Devil Cave and a Dust Devil site). Arizona extended its systems into neighboring states (and Mexico), so some sites in those states have two numbers (e.g., Utah's Dust Devil Cave is 42SA19113/NA-6713). Dates from geological or paleontological settings often only have a locality name or investigator-provided site number.
Context
Context was as specific as possible within time constraints and was taken from a report's date table and/or a report's narrative. In some cases, it is minimal (e.g., “Feature 15”). In others it is not (e.g., “Feature 15, bell-shaped pit beneath wall trench structure 4, filled with burnt animal bone, charcoal, and Mississippian sherds”).
When we brought data collection to a close, we followed a “Final Check” protocol (Supplemental Text 1, Part II) to search for errors, standardize spelling, and identify issues that might prevent a smooth transfer to CARD. We also ran a cross-state check for duplicate lab numbers, resolving about 95% of the approximately 500 found.
How Complete Is the Database?
We do not know what percentage of existing dates we culled except that it is certainly less than 100%. Better than half our dates (>50,000) are from Beta. Although Beta has run more than 600,000 dates, we cannot know what percentage of the other roughly 550,000 dates are ones we missed, are samples from elsewhere in the world, or are dates not yet reported.
Therefore, we directed attention to ascertaining if particular states were undercounted relative to others. Assuming the number of dates in a state should correlate with the amount of research conducted in it, we settled on the relationship between a state's date count in our database and its site count as reported by SHPO offices or the Digital Index of North American Archaeology (2021). Site counts measure the combined intensity of academic and CRM research, and they account for differences in state size. Figure 2 shows the expected positive relationship between site and date counts. Note that some states fall above and others below the general scatter. Given differences in site definitions, this approach provided only a rough guide over the years of our project to those states requiring more attention. South and North Carolina, Idaho, and Arkansas may still be relatively undercounted.

Figure 2. Graph of the relationship between the reported number of recorded archaeological sites (x-axis) and the number of archaeological 14C dates recorded (y-axis): (a) for all states (California, Delaware, Massachusetts, and Rhode Island are not included because we could not acquire accurate site counts); (b) for those states enclosed in dashed box in (a) (created by Madeline Mackie).
Those well above the general scatter are ones where the state maintained a radiocarbon database, where we or a colleague had greater access to the gray literature (e.g., Wyoming, California), and/or where CRM reports were searchable online through a state office or were otherwise accessible (e.g., Index of Texas Archaeology 2021). But they might also be states with an archaeological tradition that results in more 14C dates.
Two cases suggest that we have gathered a large percentage of available dates. Jerry Spangler and the team of Carey Garland and Victor Thompson independently worked on—and shared—databases for Utah and Georgia, respectively. These expanded our datasets for both states, but we had already acquired 85% and 94% of their Utah and Georgia dates, respectively. We conclude that although a very few states are under- or overrepresented relative to others, nearly all are well represented.
In global terms, the lower 48 states have roughly 11 archaeological dates per 1,000 km2, whereas the EUROEVOL Neolithic (EUROEVOL 2021), Paleolithic Europe (Vermeersch Reference Vermeersch2020), AustArch (Williams and Ulm Reference Williams and Ulm2014), Canada (Martindale et al. Reference Martindale, Morlan, Betts, Blake, Gajewski, Chaput, Mason and Vermeersch2016), and the People 3000 global project (People 3000 2021) databases have approximately one or fewer dates per 1,000 km2. The lower 48 states are perhaps the most densely radiocarbon-documented continental region of the world.
Characteristics
The majority of our dates are archaeological (n = 86,946; 83.6%; Figure 3), with smaller numbers of geological (n = 13,476; 13.0%) and paleontological (n = 2,710; 2.6%) ages (indeterminate, n = 895; <1%). Beta Analytic dominates the labs, distantly followed by the university labs of Texas, Arizona, and Georgia. Charcoal is the most common material dated (>52%; Table 2). Many entries have only measured ages (n = 33,113; 31.8%), and 32.9% (n = 34,178) are known to be AMS dates. Standard errors on normalized archaeological dates have a median of 50; measured dates have a median of 70. The majority of archaeological dates have some context information (83.4%; n = 72,589) and many archaeological dates originate from features (37.6%; n = 32,733). Nearly all archaeological dates have a site number (95.9%).

Figure 3. Temporal distribution of archaeological dates: (a) frequency of uncalibrated, normalized dates (n = 58,198) by radiocarbon years before present; (b) summed probability distribution of archaeological dates produced in rcarbon (Crema and Bevan Reference Crema and Bevan2021). Dashed line represents 200-year smoothing (created by Madeline Mackie).
Table 2. Counts/Percentages of Radiocarbon Dates by Material.

Dates of Human Remains
The database includes 3,023 dates on human remains (bone, teeth, hair, and tissue). Knowing that Indigenous communities might have concerns about making these dates available, we added information on consultation. Many dates made before the 1990 Native American Graves Protection and Repatriation Act were not the result of consultation, although we checked as many as possible because that is not uniformly true. Our comments included statements such as “Consultation unverified” (n = 1,300; 43.0%), “Consultation verified (Muwekma Ohlone),” or “Culturally unaffiliated (approval given through American Museum review board).”
Given concerns of Indigenous communities, we have included entries for dates on human remains, but CARD will mask the dates—as we have done in Supplemental Table 1—until it can work with Indigenous communities to decide how to treat these entries.
What Did We Learn about “Big Data” Projects?
Assuming an average of $300/date, the database represents more than $30,000,000 in mostly public funding (not including recovery costs). Even if the per-date estimate were halved or quartered, we achieved a substantial return on the National Science Foundation's (NSF) funding. And yet, this was a very modest “big data” project, involving low-hanging archaeological fruit that nonetheless required six years to collect. So, the first lesson: even small “big data” projects take time and resources.
The second lesson concerns continuation of the project. Methods improve faster than data, and so adding new, better dates is essential to the database's utility. Lacking further funding, we hope researchers will access, correct, and upload dates to CARD, and that someone follows up in a few years’ time and compiles more dates.
But hope is a poor strategy. NSF could require that dates generated through its grants be uploaded to CARD, and SHPOs could do the same for compliance projects (which generate the most dates). In 2019, for example, British Columbia required submission of dates to CARD to obtain heritage investigation permits (at the request of the Musqueam Indian Band). Although we “need to do more to make sure dates are published following best practice guidelines and eventually become freely and publicly accessible” (Thompson and Krus Reference Thompson and Krus2017:5), doing so requires funding, a change in reporting requirements, or a change in the culture of archaeology.
The issue of continuation, however, is part of a bigger question. Undoubtedly, we have missed many dates, notably those in gray literature reports. Although most journals, including back issues, are now available digitally, many state archives of gray literature cannot be digitally searched. So one necessary, simple—albeit labor-intensive—goal would be to scan all the remaining gray literature in the United States and archive it (e.g., on tDAR or in state archives). If such resources had been in place, we could have quickly searched them for “radiocarbon.” Recognition of this need led to the National Archeological Database years ago, but it is only a bibliography and has not been updated since 2004 (National Archeological Database 2021).
Also, to move to the next level, American archaeology requires a protocol for recording site location at a level of obfuscation that protects a site from looting and yet permits fine-grained spatial analysis (e.g., a random location within a 1–5 km radius of the site). We have not yet achieved an “as open as possible, as closed as necessary” level of provenience or access to records advocated by FAIR data (Landi et al. Reference Landi, Thompson, Giannuzzi, Bonifazi, Labastida, da Silva Santos and Roos2020). This must be a priority for big data approaches to move forward, and it obviously requires discussion among the country's SHPOs and THPOs.
Finally, moving to the next level entails coping with the issue of “data sovereignty” or “data decolonization” (Global Indigenous Data Alliance 2021). Although we cannot discuss this issue here, we mention it because in 2013, when Kelly submitted the first NSF proposal for this project, it was admittedly not on his radar screen, but it needs to be for future big data projects.
Acknowledgments
No author has a conflict of interest or financial interest relevant to this manuscript, nor were any research permits required. This project was funded by NSF grants to Kelly: BCS 14-18858, 16-24061, and 18-22033. The Texas date collection by R. Hard was funded by NSF grant 15-20308. We thank the many private firms and individuals who provided dates, reports, and clarifications on published information. The cooperation and goodwill of our colleagues was heartening. We thank the many students who worked on the project and David G. Anderson for assistance with the Digital Index of North American Archaeology and for providing US county centroids. Finally, we thank the late Richard Morlan, who had the vision and energy to initiate CARD.
Data Availability Statement
The radiocarbon database described here is available to vetted researchers through the Canadian Archaeological Radiocarbon Database (CARD): www.canadianarchaeology.ca. It is also available as Supplemental Table 1 and through GitHub: https://github.com/ericknrobinson/RadiocarbonDatabaseLower48States, DOI:10.5281/zenodo.5590269.
Supplemental Material
For supplemental material accompanying this article, visit https://doi.org/10.1017/aaq.2021.157.
Supplemental Text 1. Part I: A Guide to Collecting Radiocarbon Dates. Part II: Final Check Process.
Supplemental Table 1. CSV of Compiled Radiocarbon Dates. Since completion of the project, we added a few more dates, for a total of 104,651. This article uses only those dates compiled by May 31, 2021. All dates on human remains are masked in the CSV. The New Mexico dataset includes approximately 280 dates for which we only had calibrated ages. The COVID-19 pandemic prevented checking the paper records in New Mexico.


 Open access