


Introduction
Past studies that have focused on validating different psychological constructs in L2 domain have primarily used exploratory factor analysis (EFA) and confirmatory factor analysis (CFA) to explore, develop, refine, and distinguish between latent psychological variables (Alamer, Reference Alamer2021a, Reference Alamer2021b, Reference Alamer2021c; Hancock & Schoonen, Reference Hancock and Schoonen2015; Plonsky, Reference Plonsky2015; Woodrow, Reference Woodrow2014). Although these two techniques generate useful information on how observed and latent variables are connected to each other, there are some limitations. Developments in factor analysis research have recently offered a technique that incorporates the utility of EFA and CFA into one analytical framework, namely exploratory structural equation modeling (ESEM) (Asparouhov & Muthén, Reference Asparouhov and Muthén2009; Marsh et al., Reference Marsh, Morin, Parker and Kaur2014; Morin et al., Reference Morin, Marsh and Nagengast2013). Thus, explaining the utility of ESEM using the constructs of the dualistic model of passion (DMP) (Vallerand, Reference Vallerand2015; also see Horwood et al., Reference Horwood, Marsh, Parker, Riley, Guo and Dicke2021) is the focus of this article. Nevertheless, we assume that readers want to know more about the constructs of DMP to assist in contextualizing the assessment. Hence, we present an overview of the DMP. Accordingly, this research represents an essential substantive-methodological synergy that applies a cutting-edge methodology to address substantive issues with theoretical and methodological implications in L2 domain. Theoretically, this study follows from the dual passion model (Horwood et al., Reference Horwood, Marsh, Parker, Riley, Guo and Dicke2021; Marsh et al., Reference Marsh, Morin, Parker and Kaur2014; Vallerand, Reference Vallerand2015), positing distinct components of obsessive passion (OP) and harmonious passion (HP). Methodologically, we juxtapose traditional exploratory and confirmatory approaches to factor analysis (EFA and CFA) with ESEM that combines the most important advantages of EFA and CFA into a unified analytic approach. To make this article more practical, we are making the data publicly available, and we are including the syntax (code) necessary to run the analyses in Appendix B.
Exploratory factor analysis and confirmatory factor analysis
As its name suggests, EFA involves exploring data searching for emerging latent variables (or factors) based on various observed variables obtained from the data (Hancock & Schoonen, Reference Hancock and Schoonen2015). As such, EFA is mostly used when researchers do not have a clear, hypothesized structure regarding the underlying factors in the data. EFA became widely used because it offered a more realistic representation of the data presumed to assess the underlying factors by allowing for the estimation of item cross-loading.
However, the empirical assessment of measurements cannot be founded solely on EFA (Marsh et al., Reference Marsh, Morin, Parker and Kaur2014) because EFA lacks a few of the methodological advantages that CFA offers, such as computation of the goodness-of-fit indices, allowing error terms to be correlated (when theory justify this), testing the predictive power of the constructs for the outcomes, and testing the measurement invariance (equivalence) among different groups. A key specification of CFA (which is also a drawback and is discussed later) is that items that correspond to a specific factor are only allowed to load onto their hypothesized factor. Thus, cross-loadings across other presumably unrelated factors (which EFA specifies) are specified to zero (Alamer, Reference Alamer2021b; Tóth-Király et al., Reference Tóth-Király, Bõthe, Rigó and Orosz2017). In this way, researchers use CFA when they have a hypothesized structure of the factors that exists in the data. Due to the advantages CFA offers, researchers prefer using CFA over EFA in theory-driven research because it yields a more parsimonious measurement model; this is particularly true for those who seek to reutilize previously established scales.
However, there are limitations on ignoring cross-loadings in assessing measurement models using CFA. It often results in a certain level of systematic measurement error because items do not load onto only their corresponding factor. Instead, psychological factors tend to overlap (Marsh et al., Reference Marsh, Muthén, Asparouhov, Lüdtke, Robitzsch, Morin and Trautwein2009, 2014; Tóth-Király et al., Reference Tóth-Király, Bõthe, Rigó and Orosz2017). In many cases, items represent not only one pure construct but also share a certain degree of commonality with other similar constructs. Hence, items can be said to be somehow imperfectly representative of their corresponding factors.
Consequently, item cross-loading should be expected and accepted. Thus, cross-loading should be assessed when conceptually related latent variables are present (Morin et al., Reference Morin, Arens, Tran and Caci2016). It is quite possible that constraining cross-loading items to zero, which is a default approach in CFA, would result in an unexpressed variance that eventually inflates the correlation between the factors and distorts their definition (Marsh et al., Reference Marsh, Muthén, Asparouhov, Lüdtke, Robitzsch, Morin and Trautwein2009). This is because unexpressed cross-loadings on the presumed unrelated factor can only be explained through factor correlation, thus inflating the correlation size. This issue raises methodological and empirical concerns about the magnitude of the correlation between factors in the measurement model in CFA (see next section for an example).
Using exploratory structural equation modeling to assess construct validity
ESEM has been developed as an improved method that overcomes the aforementioned EFA and CFA limitations (Asparouhov & Muthén, Reference Asparouhov and Muthén2009; Horwood et al., Reference Horwood, Marsh, Parker, Riley, Guo and Dicke2021; Marsh et al., Reference Marsh, Muthén, Asparouhov, Lüdtke, Robitzsch, Morin and Trautwein2009; Morin et al., Reference Morin, Marsh and Nagengast2013). In essence, ESEM simultaneously permits cross-loadings among items and factors (which is an EFA-derived property), and computes goodness-of-fit indices (which is a CFA-derived property). Thus, ESEM integrates the advantages of both EFA and CFA into one complete model (Marsh et al., Reference Marsh, Morin, Parker and Kaur2014). In fact, one could imagine ESEM as an EFA being executed through SEM. Hence, ESEM takes on all advanced features that SEM can offer. However, to maintain the confirmatory application of ESEM, a ‘target rotation’ may be used (Morin et al., Reference Morin, Arens, Tran and Caci2016). In target rotation, cross-loadings are ‘targeted’, but not forced, to be close to zero. Figures 1 and 2 comparatively illustrate the differences between the CFA and ESEM models visually.

Figure 1. A simplified representation of the CFA model.
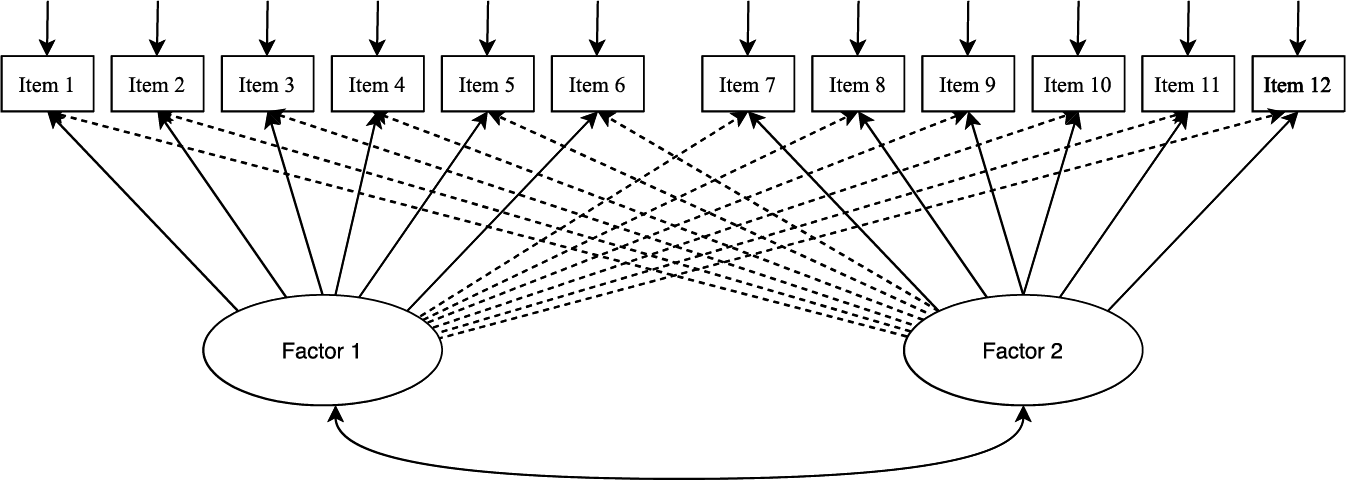
Figure 2. A simplified representation of the ESEM model.
It is evident that the CFA model is more restrictive than ESEM because cross-loadings are constrained at zero. This issue has resulted in several cases of less-than-optimal support for the constructs validity in CFA that had been established in EFA. For example, Marsh et al. (Reference Marsh, Muthén, Asparouhov, Lüdtke, Robitzsch, Morin and Trautwein2009) illustrated that standard CFA models often fail to meet the new, even more demanding, cutoff guidelines in establishing the measurement model. Thus, L2 researchers appear to be forced to apply ex post facto modifications to get a better fit that, in turn, may impact the measurement theory. Consequently, researchers stress that even small cross-loadings (such as .10 or .15) should be considered; otherwise, path coefficients and factor correlations could potentially be inflated and biased, thus affecting the goodness-of-fit (Guay et al., Reference Guay, Morin, Litalien, Valois and Vallerand2015). Alamer and Lee (Reference Alamer and Lee2019) offered an example from L2 literature that points to the issue of CFA models as the researchers examined the measurement model of Self-Determination Theory. It was anticipated that five motivational factors—namely intrinsic, identified, introjected, external regulations, and amotivation—would emerge in the CFA; however, the model fit indices indicated a poor fit to the data (i.e., χ2 = 705.11, RMR = .11, RMSEA = .09, CFI = .91, NFI = .88), leading the researchers to reformulate the measurement model. A similar concern has been recently raised in the L2 domain by Alamer (Reference Alamer2021b). The researcher provided examples from L2 literature that assessed a scale of Self-Determination Theory in language learning using the standard CFA. Alamer (Reference Alamer2021b) indicated that these studies tended to present inflated factor correlations that are contrary to theory. For instance, a previous study (Ardasheva et al., Reference Ardasheva, Tong and Tretter2012) reported that the correlation between intrinsic regulation and external regulation in the CFA was positive and substantial r = .87 which has been increased substantially from r = .55 in the EFA (i.e., ∆r = +.32). These issues, however, do not imply that researchers should refrain from using CFA and rely solely on EFA. Rather, the combined ESEM framework can be a synergic methodological approach to overcome the previously mentioned CFA and EFA issues. A similar concern about relying on CFA and ignoring ESEM in assessing the psychometric properties of the constructs has been also raised in Alamer (Reference Alamerin press).
When to use ESEM?
Although its name may suggest an exploration procedure, ESEM is mainly used to confirm a priori defined factor structure. Therefore, it might be more appropriate for newly developed scales to use EFA, especially when the researcher’s objective is to search for the relationships among the variables to determine the possible number of factors. ESEM should be, then, used to confirm the factor structure that EFA suggested. In cases in which the factor structure is already defined and tested in previous research, the researcher can skip the EFA and conduct the ESEM analysis to assess the model’s fit to the data. ESEM should then be compared to CFA. If the ESEM and CFA models are similar in fit and parameter estimates, the researcher should prefer the more parsimonious CFA model. Nonetheless, not all measurement models should apply the standard ESEM. In some cases, the theory may postulate the coexistence of the global factor(s). In such cases, the researcher should include the bifactor CFA and bifactor ESEM in the comparison (see Alamer, Reference Alamer2021b, Reference Alamerin press for examples in the L2 domain). In addition, when the design of the study or intended purpose dictates that one set of factors should not cross-load on another, Set-ESEM should be used (Marsh et al., Reference Marsh, Guo, Dicke, Parker and Craven2020). For example, when the study includes longitudinal data, the researcher can keep the constructs separate for each wave (see Marsh et al., Reference Marsh, Guo, Dicke, Parker and Craven2020 for details). The tree decision shown in Figure 3 illustrates the process of selecting the appropriate measurement model.

Figure 3. Decision tree for the use of the appropriate measurement model.
To the best of our knowledge, only three empirical studies in the applied linguistics and language learning domain have employed ESEM to assess multidimensionality (Alamer, Reference Alamer2021b, Reference Alamerin press; Alamer & Almulhim, Reference Alamer and Almulhim2021). These studies showed that ESEM and bifactor ESEM were successful and outperform their CFA counterparts. The present study demonstrates the power of the ESEM method and applies it to the conceptualization of the DMP in two samples of language learners.
The dualistic model of passion and the L2 Passion Scale
Persons are more likely to learn a second language successfully when they are passionate about the undertaking (Vallerand, Reference Vallerand2015). Research on the concept of passion has been conducted primarily within the DMP framework (Horwood et al., Reference Horwood, Marsh, Parker, Riley, Guo and Dicke2021; Marsh et al., Reference Marsh, Vallerand, Lafrenière, Parker, Morin, Carbonneau, Jowett, Bureau, Fernet, Guay, Abduljabbar and Paquet2013; Vallerand, Reference Vallerand2015, Reference Vallerand, Liu, Wang and Ryan2016; Zhao et al., Reference Zhao, St-Louis and Vallerand2015; but also see Pollack et al., Reference Pollack, Ho, O’Boyle and Kirkman2020). DMP postulates the existence of two distinct types of passion, namely harmonious passion (HP) and obsessive passion (OP), each of which accounts for one of two paths, leading to either positive or negative consequences. For more than a decade, the DMP has been used to study passion across various life domains such as sports, marketing, teaching, work, social activities, and leisure (see Vallerand, Reference Vallerand2015, for a review). In addition, several studies have demonstrated empirical support for the DMP and the Passion Scale—a scale that is developed to assess the two types of passion (see Horwood et al., Reference Horwood, Marsh, Parker, Riley, Guo and Dicke2021; Vallerand, Reference Vallerand2015, Reference Vallerand, Liu, Wang and Ryan2016, for a review). However, there have been very few attempts to examine the constructs of DMP in the field of language learning. Among these is the study of the role of HP and OP among Chines L2 students (Chen et al., Reference Chen, Vallerand and Padilla2021). The study involved 260 Chinese high school students learning English as an L2. The researchers found that HP better predicted mastery goals and L2 flow than did OP. In turn, L2 flow experience mediated the effect of HP and OP on willingness to communicate.
In essence, DMP postulate that passion is “a strong inclination toward a specific object, activity, concept, or person that one loves (or at least strongly likes) and highly values, that is part of [one’s] identity, and that leads one to invest time and energy in the activity (or person) on a regular basis” (Vallerand, Reference Vallerand2015, p. 331). Passion is not only directed toward the activity (e.g., learning a language), but it goes beyond that to also include other aspects related to the activity such as a person (e.g., a native speaker) or a specific object (e.g., the targeted language). In this manner, passion is inherently motivational in nature. Indeed, there is a desire, a goal, an inclination, an impulse, and a drive toward an object that is perceived to be desirable. However, passion can also result in negative consequences, such as losing personal control, inflexible persistence, emotional suffering, and the erosion of well-being. Therefore, the DMP postulates the existence of the two previously mentioned forms of passion, HP and OP. The difference between these two types of passion rests primarily on the internalization of the passionate activity (Vallerand, Reference Vallerand2015). As per self-determination theory, internalization is a process that reflects the extent to which socially sanctioned values and behaviors are perceived autonomous (Ryan & Deci, Reference Ryan and Deci2017).
Thus, HP results from an autonomous internalization of the tasks that are integrated into one’s identity. According to self-determination theory, autonomous internalization is a term that applies to individuals who have decided, of their own volition, that an activity is valuable and important (Ryan & Deci, Reference Ryan and Deci2000). Such internalization originates from within the self and integrates well with one’s identity. Thus, HP is likely to produce a motivational drive that is related to engagement in the activity. It also fosters feelings of autonomy and promotes the meaningful pursuit of the activity (Vallerand, Reference Vallerand, Liu, Wang and Ryan2016). With regard to HP, the activity is generally integrated with one’s self-structure, and is in harmony with the other elements of the individual’s life. Therefore, people with high levels of HP should wholeheartedly engage in the passionate activity with a nondefensive attitude (Brown & Ryan, Reference Brown and Ryan2003). In so doing, individuals with high levels of HP will be able to immerse themselves in the task at hand and experience positive outcomes both during the execution of the task (e.g., expending greater effort) and after the task’s completion (e.g., satisfaction and willingness to continue involvement in the task) (Vallerand, Reference Vallerand, Liu, Wang and Ryan2016).
In contrast to HP, OP is generated from the controlled internalization of a task (Vallerand et al., Reference Vallerand, Blanchard, Mageau, Koestner, Ratelle, Léonard, Gagné and Marsolais2003). That is, the task is not fully internalized in the self and there may be some contingencies attached to it (Brown & Ryan, Reference Brown and Ryan2003; Ryan & Deci, Reference Ryan and Deci2017). Such controlled internalization originates from an intrapersonal and/or interpersonal urge because particular contingencies are attached to the activity (e.g. social pressure, self-esteem, or an uncontrollable excitement derived from being involved in the activity; Horwood et al., Reference Horwood, Marsh, Parker, Riley, Guo and Dicke2021; Marsh et al., Reference Marsh, Vallerand, Lafrenière, Parker, Morin, Carbonneau, Jowett, Bureau, Fernet, Guay, Abduljabbar and Paquet2013; Zhao et al., Reference Zhao, St-Louis and Vallerand2015). Therefore, although OP entails passion for a particular activity, individuals with an OP may experience an uncontrollable urge to partake in an activity. Accordingly, individuals with high OP levels may risk experiencing conflicts and losing the flow (Zhao et al., Reference Zhao, St-Louis and Vallerand2015).
The construct validity of the L2 Passion Scale
Many empirical investigations that have been conducted across various life domains have supported the usefulness of the DMP (see Vallerand, Reference Vallerand2015 for a review). Furthermore, studies that have examined the psychometric properties of its scale (the Passion Scale) have demonstrated strong support for its reliability and validity. EFA, CFA, and even ESEM support the two-factor structure of the Passion Scale as well as its invariance across genders, languages, and different types of activities (Fernet et al., Reference Fernet, Lavigne, Vallerand and Austin2014; Horwood et al., Reference Horwood, Marsh, Parker, Riley, Guo and Dicke2021; Marsh et al., Reference Marsh, Vallerand, Lafrenière, Parker, Morin, Carbonneau, Jowett, Bureau, Fernet, Guay, Abduljabbar and Paquet2013; Vallerand et al., Reference Vallerand, Blanchard, Mageau, Koestner, Ratelle, Léonard, Gagné and Marsolais2003; Verner-Filion et al., Reference Verner-Filion, Vallerand, Amiot and Mocanu2017; Zhao et al., Reference Zhao, St-Louis and Vallerand2015). For example, using the Passion Scale, Tóth-Király et al. (Reference Tóth-Király, Bõthe, Rigó and Orosz2017) explored the ESEM method’s applicability to assessing Hungarian adults’ passion for using social media and playing on smartphones and with online games. The study compared CFA and ESEM results, confirming ESEM’s superiority in terms of goodness-of-fit indices and the definition of the factors. The researchers found that the correlation between HP and OP in ESEM was relatively modest but meaningful, representing the communalities between the factors more accurately than CFA. More recently, Chen et al. (Reference Chen, Vallerand and Padilla2021) have tested the relationship between HP and OP, and L2 positive experience when carrying out L2 activity. The study examined a CFA model that included both HP and OP. Their results have shown that the initial CFA model was unacceptable (e.g., CFI = .90, TLI = .87, and RMSEA = .14). To improve the model’s fit, the researchers have correlated all uniquenesses (error terms) in the model, with exception of two items. After correlating multiple error terms, their model appeared to be improved (e.g., CFI = .97, TLI = .95, and RMSEA = .08). However, it is still not clear whether ESEM can be a useful tool to overcome the need to apply multiple post hoc modifications (e.g., correlating the error terms) in the measurement model to achieve an acceptable fit. Although the scale used in Chen et al. (Reference Chen, Vallerand and Padilla2021) is similar to the present study’s scale, the main difference is related to the fact that the Chen et al. (Reference Chen, Vallerand and Padilla2021) scale has been translated to Chinese whereas the present study maintained the English version (i.e., it has not been translated to participants’ L1) but the items have been adjusted to suit language learning passion. Thus, the present study builds directly on the Passion Scale (Vallerand et al., Reference Vallerand, Blanchard, Mageau, Koestner, Ratelle, Léonard, Gagné and Marsolais2003) and introduced the language-specific scale (L2 Passion Scale) by adjusting the wording of the items in the original scale to suit the language learning setting.
Further, empirical research within the DMP framework has underscored the positive relationship between the two types of passion and passion criteria. In essence, the passion criteria were based on the definition of passion (Vallerand et al., Reference Vallerand, Blanchard, Mageau, Koestner, Ratelle, Léonard, Gagné and Marsolais2003). They allow interested researchers to examine the extent to which an individual loves/likes and values an activity. In addition, passion criteria also assess the time and energy that is invested into the activity and whether the individual perceives the activity to be a part of him/herself and considers it his/her passion. Therefore, research studies have consistently reported that both HP and OP are positively associated with passion criteria, thus supporting the predictive validity of the two types of passion (Horwood et al., Reference Horwood, Marsh, Parker, Riley, Guo and Dicke2021; Guay et al., Reference Guay, Morin, Litalien, Valois and Vallerand2015). Nonetheless, past research has shown HP to be a substantially better predictor of passion criteria than OP (Zhao et al., Reference Zhao, St-Louis and Vallerand2015).
The present study
The present study aimed to apply the ESEM method to L2 research, using the DMP framework. To achieve this, we adopted the two-studies design. In Study 1, we psychometrically analyzed the L2 Passion Scale among a sample of Saudi EFL students. We first conducted an EFA on the data that we obtained. After establishing the suggested factorial structure from the EFA, we applied both CFA and ESEM and compared their results to obtain the best-fitting measurement model. We then replicated the results of Study 1 in Study 2 with another sample of Saudi EFL students, and we extended the application of ESEM by assessing the predictive validity of the L2 Passion Scale. We based the predictive validity on the best-fitting model obtained from Studies 1 and 2, and the extent to which HP and OP can predict L2 passion criteria scores (Vallerand et al., Reference Vallerand, Blanchard, Mageau, Koestner, Ratelle, Léonard, Gagné and Marsolais2003) using an ESEM structural model. Kline (Reference Kline2016) indicated that 200 cases are the median sample size in uncomplex models, but cases > 200 are generally desirable. The samples for Studies 1 and 2 meet this guideline.
In making this study more practical for the readers, we make the data available publicly to rerun the data using the methods explained in the article. In addition, we provide the Mplus syntaxes (codes) required to run CFA, ESEM, and structural ESEM models (see Appendix B).
Research questions
RQ1: What factor structure model (i.e., CFA or ESEM) best represents the L2 Passion Scale?
RQ2: Does ESEM provide support for the convergent, discriminant, and predictive validity of the L2 Passion Scale?
Study 1
Participants and procedure
A total of 220 Saudi EFL undergraduate students enrolled in the Department of English at a Saudi public university received email invitations to participate in this study. The participants’ ages ranged from 20 to 26 years old, with a mean age of 21.3 years (SD = .46). The sample was 39% male, and we only contacted students who had completed their foundation year and entered the department’s program. Students in the foundation year had to pass English subjects designed for A2 English level—based on the Common European Framework of Reference for Languages (CEFR).
The institutional review board approved data collection. An e-mail request to complete an online Google Forms questionnaire was sent to the students. An inspection of the responses revealed that none of the participants had a lower completion rate of 90%; therefore, no data were deleted. Missing data were handled by implementing the full information maximum likelihood (FIML) estimation. There were only five instances of missing data for only two of the variables, so missing data was not a serious issue.
Measures
We examined the reliability of the measures through McDonald’s composite reliability (ω). Composite reliability ω (also known as CR) differs from Cronbach’s alpha (α) because the former takes into account the magnitude of association between variables as well as their error measurements, therefore assessing the extent to which different variables represent the overall construct (McDonald, Reference McDonald1970). Values equal to .70 or above indicate acceptable internal consistency of reliability. However, compared to CFA, the values of ω tend to decrease in ESEM, and thus researchers should expect and accept this observation as long as other model parameters are comparable. To evaluate the quality of the models, we consider the chi-square statistic χ2 and its p-value. However, χ2 often yields significant results in large samples. Thus, we evaluated goodness-of-fit for all models based on traditional indices that are reasonably independent of sample size (RMSEA = root mean square error of approximation with its 90% confidence interval, CFI = confirmatory fit index, TLI = Tucker–Lewis index, and SRMR = standardized root mean square residual). CFI and TLI values in the region of .95 indicate a good model fit, but values around .90 can be acceptable. Both RMSEA and SRMR should be equal to or lower than .07 or .05 to acceptable and good model fits, respectively (Hair et al., Reference Hair, Black, Babin and Anderson2019; Marsh et al., Reference Marsh, Balla and McDonald1988). For comparing nested models, Cheung and Rensvold (Reference Cheung and Rensvold2002) suggested that if the decrease in fit for the more parsimonious model is less than .01 for incremental fit indices such as the CFI, there is reasonable support for the more parsimonious model. For indices that incorporate a penalty for lack of parsimony, such as the RMSEA and the TLI, it is also possible for a more restrictive model to result in a better fit than would a less restrictive model. For present purposes, to facilitate communication, we present primarily TLIs in the written summaries of the results. In addition, however, we present the chi-square, degrees-of-freedom, RMSEA, CFI, and TLI in the corresponding tables. Nevertheless, these cutoff values for these indices constitute only rough descriptive guidelines rather than “golden rules” (Marsh et al., Reference Marsh, Hau and Wen2004).
The L2 Passion Scale
This L2-specific scale was developed based on the original Passion Scale that Vallerand et al. (Reference Vallerand, Blanchard, Mageau, Koestner, Ratelle, Léonard, Gagné and Marsolais2003) developed and Marsh et al. (Reference Marsh, Vallerand, Lafrenière, Parker, Morin, Carbonneau, Jowett, Bureau, Fernet, Guay, Abduljabbar and Paquet2013) subsequently refined. The L2 Passion Scale items have been slightly modified to suit the L2 context. The L2 Passion Scale uses two six-item subscales that assess HP and OP, similar to the original scale. The students responded to all the statements based on a 5-point Likert scale, ranging from 1 (Strongly Disagree) to 5 (Strongly Agree). An example of an item that assesses HP in the context of L2 is as follows: “Learning English is in harmony with the other activities in my life.” Similarly, an example of an item that assesses OP for L2 learning is as follows: “I have difficulties controlling my urge to learn English” (see Appendix A for scale items). The mean and standard deviation were M = 4.28, SD = .53.
Results
Normality and outliers
It is important to check whether the data are normally distributed. To test univariate normality, we examined the skewness and kurtosis of the data distribution using the A “+2/–2” guideline (Collier, Reference Collier2020). Our data did not violate these guidelines. We tested multivariate outliers using the Mahalanobis D 2 measure for all variables in the data set, which instructs that any data point that has a D 2 value that deviates substantially from the dataset’s D 2 values (i.e., p < .001) should be removed (Hair et al., Reference Hair, Black, Babin and Anderson2019). The results showed that five cases exceeded the acceptable threshold; therefore, they were excluded from the analyses.
The measurement model of the L2 Passion Scale: CFA and ESEM
Based on the results obtained from the EFA (see Appendix C), the next step was to confirm the hypothesized factor structure of the L2 Passion Scale and assess its construct validity by comparing the results of CFA with those of ESEM. All measurement models were estimated using the maximum likelihood estimation with robust standard errors in Mplus 8.1 (Muthén & Muthén, Reference Muthén and Muthén2014). In the CFA model, the items were specified to load onto their a priori construct (i.e., HP or OP). However, in the ESEM model, the items were allowed to be freely estimated and they cross-loaded onto HP and OP (see Figures 1 and 2). A Geomin rotation was used in the ESEM.
The results presented in Table 1 indicate that both CFA and ESEM solutions generated an unsatisfactory model fit with the data. Furthermore, an inspection of the modification indices using Mplus 8.1 suggested that the inclusion of covariance between the uniqueness of OP1 “If I could, I would only do my English learning tasks” and OP2 “I have almost an obsessive feeling for learning English” would significantly improve model fit (items correlated strongly, r = .71, p < .001). This covariance was considered in the two solutions, resulting in an improved model fit in both CFA and ESEM (see Table 1 under CFA and ESEM). This inclusion was also justified considering that the two items might share a certain similarity and an inspection of the wording of the items suggests that the inclusion of the correlated uniquenesses is reasonable. Although both solutions provided the expected L2 Passion Scale factor structure, only the ESEM provided an adequate fit to the data (see Table 1 for details). Furthermore, the differences between the fit values for CFA and ESEM were above the typical criterion (e.g., difference in CFI > .015) used to test the difference between nested models. These results support the ESEM solution’s superiority to CFA for improved (and acceptable) goodness of fit. This, in turn, supports the L2 Passion Scale’s construct validity within the ESEM framework.
TABLE 1. CFA and ESEM model fit indices for the L2 Passion Scale in study 1

a Correlated uniqueness between OP1 and OP2.
We present standardized factor loadings in Table 2. We note that the items loaded on their presumed factors for both the CFA and the ESEM solutions. Most items loaded strongly on their respective factors in the ESEM; however, there was one instance of positive cross-loading (i.e., OP3 loaded significantly on HP and OP, though weakly on HP, β = .29) that might appear puzzling at first, although it did not impair the definition of the two factors. Indeed, this parameter might offer useful information on how OP and HP share some degree of similarity. Hence an item (or items) on one passion factor could be empirically loaded weakly on another (Tóth-Király et al., Reference Tóth-Király, Bõthe, Rigó and Orosz2017; Vallerand et al., Reference Vallerand, Blanchard, Mageau, Koestner, Ratelle, Léonard, Gagné and Marsolais2003; Zhao et al., Reference Zhao, St-Louis and Vallerand2015). Although OP1 and OP2 factor loadings were modest, we retained the items in the analysis because they are part of the original scale. Furthermore, removing any of these items will significantly decrease reliability estimates and potentially distort the meaning of the construct (Hair et al., Reference Hair, Black, Babin and Anderson2019).
TABLE 2. Factor loadings of CFA and ESEM based on the most adequate solutions

Note: Nonsignificant parameters (p ≥ 0.05) are italicized; (uniq) = item uniqueness; HP = harmonious passion; OP = obsessive passion; ω = omega coefficient of model-based composite reliability.
We assessed convergent validity by inspecting the strength of items loading on their respective factors in the ESEM solution (Guay et al., Reference Guay, Morin, Litalien, Valois and Vallerand2015). The results presented in Table 2 support these relationships because the items were strongly loaded on their hypothesized factors, even though they were allowed to cross-load on the other factor. Validity was also supported by the small correlation between the HP and OP factors in ESEM (r = .23, p = .02). Discriminant validity was supported in that items presumed to load on one factor did not load on the other in the ESEM solution, and if there were cross-loadings they were weaker than the target loadings. Another important result that was obtained from the ESEM is related to the factor correlation between HP and OP, which was reduced from (r = .34, p < .001) in the CFA solution to (r = .23, p = .02) in the ESEM solution. This decrease can be attributed to the variance expressed in the cross-loadings between the factors that were allowed in ESEM and not in CFA. This decreased correlation provides a more accurate representation of the relation between HP and OP because the association was not inflated by ignoring the cross-loadings (Marsh et al., Reference Marsh, Morin, Parker and Kaur2014).
Study 2
Participants and Procedure
A new sample consisting of 272 Saudi EFL undergraduate students was drawn from the same institution as the Study 1 sample and invited to participate voluntarily. Their ages ranged from 18 to 22 years old, with a mean age of 19.2 years (SD = .26), and the sample was 62% male. In Study 2, we contacted only students studying in the foundation year of the department of English. In this way, the researchers ensured that the participants are independent of Study 1. Data collection was approved by the institutional review board. This data collection occurred 5 weeks after we conducted Study 1. An e-mail was sent to the students inviting them to participate in the study, which required them to complete an online Google Forms questionnaire. An inspection of the responses revealed that none of the participants had a completion rate that was lower than 90%; therefore, their data were retained in the analyses from the analyses. Thus, missing data was not a serious issue and appropriately handled with FIML.
Measures
The L2 Passion Scale
In Study 2, we used the same measure as in Study 1.
The L2 passion criteria
This measure was adapted from the Passion Scale (Vallerand, Reference Vallerand2015) and five items. The scale examines whether individuals are passionate about a given activity (the scale has been adjusted to suit the language learning setting). A 5-point Likert scale ranging from 1 (Strongly disagree) to 5 (Strongly agree) was used. An example item is “I like my English learning” (see Appendix A for scale items). The mean and standard deviation were M = 4.30, SD = .61.
Results of Study 2
Normality and outliers
The normality and outlier tests were conducted in Study 2. Our data did not violate univariate normality; however, a multivariate outlier analysis using the Mahalanobis D 2 measure for all variables involved showed that nine cases exceeded the acceptable threshold (i.e., their D 2 values deviated substantially from the rest at p < .001). Therefore, these cases were excluded from further analyses.
Replicating the measurement model of the L2 Passion Scale using ESEM
Study 1 demonstrated the ESEM’s solution superiority to the CFA solution. In Study 2 we sought to replicate these results by comparing the CFA and the ESEM models. We then examined predictive validity based on the more appropriate model. The results of the CFA and the ESEM goodness-of-fit indices are presented in Table 3, and the models’ factor loadings are provided in Table 4. Similar to what was observed in Study 1, the modification indices generated using Mplus software suggested the inclusion of a covariance between the uniqueness of OP1 and OP2 in both CFA and ESEM, which were considered—replicating the results from Study 1. We also note that Chen et al. (Reference Chen, Vallerand and Padilla2021) also reported the need to include this correlated covariance between these two items in their L2 passion study. Overall, the results of Study 2 replicated the advantages of ESEM over CFA, as indicated by the lower chi-square (χ2) statistic, the better goodness-of-fit measures (see Table 3), the meaningful cross-loading parameters, and less inflated factor correlation (see Table 4). These findings provide further evidence of the construct validity of the L2 Passion Scale’s measurement model as well as its convergent and discriminant validity.
TABLE 3. CFA and ESEM model fit indices for the L2 Passion Scale in Study 2

a Correlated uniqueness between OP1 and OP2.
TABLE 4. CFA and ESEM factor loadings based on the most adequate solutions

None: Nonsignificant parameters (p ≥ 0.05) are italicized; (uniq) = item uniqueness; HP = harmonious passion; OP = obsessive passion; ω = omega coefficient of model-based composite reliability.
Test of measurement invariance
Measurement invariance between the samples of Study 1 and Study 2 was conducted to substantiate psychometric invariance of the solution across the two samples. A total of 492 cases (220 for Study 1 and 272 for Study 2) were considered in a multigroup comparison. We, first, run CFA and ESEM models with the merged samples to see if the models fit the data. The CFA solution, nonetheless, failed to converge while ESEM provided acceptable fit to the data (i.e., χ2 = 148.223, df = 42, p < .001, CFI = .93, TLI = .89, RMSEA = .07, RMSEA 90% CI [.06, .09], SRMR = .04). The configural, metric, and scalar models of the ESEM fit the data (e.g., CFI/TLI ≥ .90, RMSEA ≤ .07 and SRMR ≤ .07) (for a greater explanation about configural, metric, and scalar models, see Collier, Reference Collier2020 and Kline, Reference Kline2016; also see Marsh et al., Reference Marsh, Guo, Dicke, Parker and Craven2020 in relation to invariance tests with ESEM). Thus, we turn to the most important part of the assessment, the comparison results. The first measure that demonstrates psychometric invariance is the p-value of the ∆χ2 across the models. The results, as shown in Table 5, suggest that all specified equality constraints are tenable. In addition to the ∆χ2, measures of ∆RMSEA, ∆CFI, and ∆TLI are checked. The changes in these values across the models were trivial and support measurement invariance.
TABLE 5. Test of measurement invariance between the samples of Study 1 and Study 2

Assessing the predictive validity of the L2 Passion Scale using the ESEM method
The present study extended ESEM’s effectiveness by assessing the L2 Passion Scale’s predictive validity in predicting passion criteria scores (Vallerand, Reference Vallerand2015). We present (Figure 4) a simplified representation of this hypothesized structural model. This ESEM structural model was competed against a CFA structural model (see Figure 5). The complete structural ESEM-based model outperformed the CFA model and resulted in a good fit to the data. Thus, we continue analyzing this model only (see Table 6). Note that the factor loadings have been already reported in Table 4 and we now only focus on the results of prediction. The results presented in Table 7 show the robustness of the HP and OP to predict the L2 passion criteria. This ESEM structural model explained a large amount of the variance (69%) in the L2 passion criteria for both the HP and the OP factors. Although both HP and OP significantly predicted the L2 passion criteria, it was found that HP outperformed OP in predicting the outcome. Overall, the ESEM structural model results suggest that both the HP and the OP factors reflect the conceptualization of passion (albeit differently in terms of magnitude), as represented in the DMP literature (Vallerand, Reference Vallerand2015).
TABLE 6. CFA and ESEM structural models fit indices predicting L2 passion criteria

TABLE 7. Standardized coefficients of HP and OP predicting L2 passion criteria through ESEM

* Path is significant at 0.05.
** Path is significant at the 0.01 level.
Note: (uniq) = item uniqueness; PC = L2 passion criteria; HP = harmonious passion; OP = obsessive passion.

Figure 4. A complete structural model based on the ESEM solution.
Note: HP = harmonious passion; OP = obsessive passion; PC = passion criteria.

Figure 5. A structural model based on the CFA solution.
Note: HP = harmonious passion; OP = obsessive passion; PC = passion criteria.
Discussion
The present study introduced the applicability and effectiveness of the relatively novel ESEM factor analysis method using the L2 Passion Scale. This investigation is probably the first of its kind in L2 research and has contributed to the enrichment of the literature on ESEM in general, while also opening the door for new directions in L2 psychometric examination research. The present study has provided evidence for the power of the ESEM by comparing its results to those of its traditional CFA counterpart in two samples of language learners. Both studies’ results show that ESEM resulted in a better fit to the data and generated a more realistic representation of the data based on responses to L2 Passion Scale among language learners using measurement invariance test. To extend the application of ESEM, the present study tested a structural ESEM-based model in which HP and OP were set as predictors of L2 passion criteria. The results illustrate the flexibility and usefulness of this novel method for SEM research.
CFA failed to provide an adequate fit to the data, even with the inclusion of the suggested correlation of uniqueness in the measurement model. This issue can be seen in past research in the field, leading researchers to apply several post hoc modifications in their measurement models, resulting in the distorted definition of their constructs (Collier, Reference Collier2020; Hair et al., Reference Hair, Black, Babin and Anderson2019; Marsh et al., Reference Marsh, Muthén, Asparouhov, Lüdtke, Robitzsch, Morin and Trautwein2009). This was evident in the study by Chen et al. (Reference Chen, Vallerand and Padilla2021) with the Chinese version of the Passion Scale in which the researchers had to covary almost all measurement errors in the CFA model to improve the fit indices. Because of the overly restrictive requirement of the items to load on their perspective factors only, correlating the error terms was the most accessible approach to improve the model fit in the CFA. With multiple modifications included, one would argue that there is an unobserved factor that was failed to be accounted for in the measurement. Thus, providing empirical evidence, not theoretical support. Instead, ESEM can be, as the present study showed, a flexible method that overcome the need to apply unnecessary post hoc (ex post facto) modifications. Following previous DMP research (Horwood et al., Reference Horwood, Marsh, Parker, Riley, Guo and Dicke2021; Marsh et al., Reference Marsh, Vallerand, Lafrenière, Parker, Morin, Carbonneau, Jowett, Bureau, Fernet, Guay, Abduljabbar and Paquet2013; Tóth-Király et al., Reference Tóth-Király, Bõthe, Rigó and Orosz2017; Vallerand, Reference Vallerand, Liu, Wang and Ryan2016), we believe that ESEM is a better fit to the DMP than the CFA as suggested by the goodness-of-fit and more realistic factor correlation. There was support for this a priori hypothesis for both language learners’ samples.
In the ESEM solution, many cross-loadings were detected that, when not estimated, could erode the factorial structure of the L2 Passion Scale, as was the case in the CFA solution. Although two cross-loadings were significantly loaded on the other unrelated factor, they were not larger in size than the loadings on the intended factor. The first was OP3 “Learning English is the only thing that really turns me on,” which loaded on its factor (i.e., OP), while loading on HP in Study 1 and Study 2, respectively. This can be justified through the wording of the items and the invariance of the solution across the two samples. It is possible that this item did not capture the specific aspect of OP exclusively; rather, it may have tapped into a more general, shared aspect of passion, resulting in significant loading onto the two factors. Moreover, perhaps the participants could understand this item’s wording as, in part, a type of harmonious passion because their L2 learning could be perceived as harmonious but potentially as the only thing that attracts their attention when confronted with other activities. In contrast, OP1 “If I could, I would only do my English learning tasks” showed significant negative loading on HP, while showing significant positive loading on OP, thus indicating that this item might represent the two opposite poles of passion. For instance, a language learner with HP would openly engage in other important activities, demonstrating an ability to refrain from being involved in a controlled type of learning. The opposite is true for a language learner with OP. In summary, allowing the estimation of cross-loadings in ESEM provided a meaningful, flexible approach in L2 Passion Scale factor analysis (and possibly other scales), allowing for data interpretation from a novel perspective compared to the standard CFA (Horwood, Reference Horwood, Marsh, Parker, Riley, Guo and Dicke2021; Marsh et al., Reference Marsh, Vallerand, Lafrenière, Parker, Morin, Carbonneau, Jowett, Bureau, Fernet, Guay, Abduljabbar and Paquet2013; Tóth-Király et al., Reference Tóth-Király, Bõthe, Rigó and Orosz2017).
We used ESEM to test the predictive power of HP and OP for L2 passion criteria. ESEM functioned in accordance with previous studies that have shown how the two types of passion relate to passion criteria. Of particular relevance, we found that HP outperformed OP in predicting the L2 passion criteria. These patterns of association are consistent with previous passion studies that examined the relationship between HP and OP, on the one hand, and passion criteria, on the other, demonstrating that HP is more strongly associated with these criteria than OP (Marsh et al., Reference Marsh, Vallerand, Lafrenière, Parker, Morin, Carbonneau, Jowett, Bureau, Fernet, Guay, Abduljabbar and Paquet2013; Vallerand, Reference Vallerand2015; Zhao et al., Reference Zhao, St-Louis and Vallerand2015).
Directions for L2 psychometric research
From a theoretical perspective, we encourage L2 researchers to replicate the findings of the L2 Passion Scale and L2 passion criteria and assess the extent to which they predict language learning outcomes. From a psychometric perspective, future research should replicate the factorial structure of the many L2 scales that have been solely established using EFA, standard CFA, or correlation by considering the application of ESEM and possibly contrasting competing measurement models. As the present research showed, ESEM can be extended to investigate the ability of the constructs to predict outcomes and contrast their predictive validity. This approach seems to be more rigorous and appropriate than using the widely implemented multiple regression analysis technique. This is because the ESEM structural model uses the rigor of SEM in both the measurement and prediction. In addition, researchers could consider the more recently developed forms of ESEM, namely, Bifactor ESEM (Alamer, Reference Alamer2021b, Reference Alamerin press; Howard et al. Reference Howard, Gagné, Morin and Forest2018) and Set-ESEM (Marsh et al., Reference Marsh, Guo, Dicke, Parker and Craven2020), and contrast the results to the standard ESEM. ESEM (and its variants) can be applied with Mplus or the “lavaan” R package. An applied example of ESEM can be found in the “Mplus User’s Guide,” which can be freely downloaded from the software website. To make this article more practical for analysts, we included the syntax required to run ESEM in the Mplus software (see Appendix B). We also make the raw data available for the researchers to replicate and rerun the analysis.
Further, the two studies discussed in this article have some limitations. First, although the EFA, CFA, and ESEM results yielded useful information with regard to the L2 Passion Scale’s construct validity, the correlated error terms of OP1 and OP2 in both Study 1 and Study 2 indicated that these two items share a common pattern of information that was not captured in the analyses. Further inspection into these two items could be useful. Second, although the number of participants in both studies satisfied the statistical guidelines for factor analysis (Hair et al., Reference Hair, Black, Babin and Anderson2019; Kline, Reference Kline2016), the sample sizes were relatively modest. Third, like other statistical analyses, ESEM, at its basic form infers group characteristics. Thus, researchers should consider multilevel modeling of ESEM as a compromise if hierarchical differences are believed to exist. In addition, ESEM is also subjected to rotational indeterminacy in that different rotation strategies result in different solutions that all fit the data adequately (Marsh et al., Reference Marsh, Guo, Dicke, Parker and Craven2020). Fourth, although the ESEM appears to be less parsimonious than the corresponding CFA, some fit indices such as TLI and RMSEA control for parsimony (Marsh et al., Reference Marsh, Muthén, Asparouhov, Lüdtke, Robitzsch, Morin and Trautwein2009). However, we note that whilst TLI and RMSEA do control for parsimony, they are not the only control for parsimony. Ultimately, the balance between parsimony and goodness-of-fit should be based on evaluation of the parameter estimates in relation to theory, a priori predictions, evaluation of the parameter estimates. Lastly, it would be better for the assessment of discriminant validity to include variables that may share similarities with HP and OP such as consistency of interest (from Grit) and intrinsic motivation (from Self-Determination Theory).
Conclusion
Overall, the present research introduced the ESEM method to the language learning and education field and applied it to the DMP framework. The study offered two scales to the field, the L2 Passion Scale and the L2 passion criteria and assessed them in a more advanced perspective. Using the advancement of ESEM, this study provided evidence that ESEM, as a synergistic product of EFA and CFA, is useful and powerful in testing the construct validity and unidimensionality of the L2 Passion Scale and possibly other L2 scales. In addition to construct validity, ESEM offered methodological features that allow researchers to evaluate convergent, discriminant, and predictive validity from a new empirical perspective (Guay et al., Reference Guay, Morin, Litalien, Valois and Vallerand2015), as this research has demonstrated. Moreover, the versatility of the ESEM, as it builds directly on SEM, can provide a more realistic, flexible representation of the already established instruments in the L2 domain. Thus, L2 researchers are encouraged to endorse ESEM and its extensions in their research to test and replicate the hypothetical factorial structures.
Data Availability Statement
The experiment in this article earned Open Materials and Open Data badges for transparent practices. The materials and data are available at https://www.iris-database.org/iris/app/home/detail?id=york:939777.
Appendix A
TABLE A1. L2 Passion Scale items and L2 passion criteria

Note: HP = harmonious passion; OP = obsessive passion; PC = L2 passion criteria.
Appendix B

Figure B1. Mplus syntax (code) for running ESEM with the data of Study 1.

Figure B2. Mplus syntax (code) for running structural ESEM.

Figure B3. Mplus syntax (code) for running CFA.
Appendix C: Exploratory factor analysis
An EFA with Oblimin rotation was selected because the DMP factors tap similar aspects of passion. EFA was performed using Jamovi software 1.1 (Jamovi Project, 2019) to identify information for induction into the L2 Passion Scale’s possible factor structure. We posited a priori that there would be two well-defined factors. We tested this by evaluating (a) eigenvalues greater than 1, (b) the scree plot of the eigenvalues, (c) factor loadings greater than .30, and (d) the substantive interpretability of the factor structures. As shown in Table 1 and Figure 3, the results yielded a two-factor structure for HP and OP, accounting for 59.60% of the variance. These two factors reflected the L2 Passion Scale’s hypothesized factorial structure.
TABLE B1. EFA factor loadings of HP and OP based on Oblimin rotation

Note: The minimum residual extraction method was used in combination with an Oblimin rotation.

Figure B4. A scree plot based on the Oblimin solution.


 Open access