


Introduction
Food insecurity in sub-Saharan Africa (SSA) is a chronic and widespread condition, whose main cause is low productivity and income at household level (Kidane et al., Reference Kidane, Maetz and Dardel2006). Production on smallholder farms is critical to household food security, which also contributes to the majority of food production at national level in SSA (Frelat et al., Reference Frelat, Lopez-Ridaurab, Giller, Herrerod, Douxchamps, Djurfeldte, Erenstein, Henderson, Kassie, Paul, Rigolot, Ritzema, Rodriguez, van Asten and van Wijk2016). Therefore, increasing productivity through diversification of smallholder agriculture and improving market access are considered crucial components of the strategy toward food security and resilience (ibid.). Diversification may be achieved through greater integration of staple cereals and grain legumes. Among the grain legumes, soybean (Glycine max) has high market demand due to its use in human food, animal feed, and industrial products including biodiesel production (Gasparri et al., Reference Gasparri, Kuemmerle, Meyfroidt, de Waroux and Kreft2015; Kolapo, Reference Kolapo and Tzi-Bun2011; Sinclair et al., Reference Sinclair, Marrou, Soltani, Vadez and Chandolu2014; Tefera, Reference Tefera and Sudaric2011). The growing livestock industry and need for soy-based food create market demand for local soybean production and processing in SSA (Kolapo, Reference Kolapo and Tzi-Bun2011). However, its production is very low compared with the growing demand for soybean products (Kaizzi et al., Reference Kaizzi, Byalebeka, Semalulu, Alou, Zimwanguyizza, Nansamba, Musinguzi, Ebanyat, Hyuha and Wortmann2012; Sinclair et al., Reference Sinclair, Marrou, Soltani, Vadez and Chandolu2014; Tefera, Reference Tefera and Sudaric2011). Demand for soybean far exceeds the supply in Africa, and annual imports are valued at $1.2 billion (Sileshi and Gebeyehu, Reference Sileshi and Gebeyehu2020).
Despite the presence of soybean varieties that yield up to 5 t ha-1 in SSA (Giller et al., Reference Giller, Murwira, Dhliwayo, Mafongoya and Mpepereki2011), yields are very low (Mabapa et al., Reference Mabapa, Ogola, Odhiambo, Whitbread and Hargreaves2010; Ronner et al., Reference Ronner, Franke, Vanlauwe, Dianda, Edeh, Ukem, Bala, van Heerwaarden and Giller2016). As the global demand for soybean continues to surge; however, SSA is likely to be the new frontier for expansion of soybean cultivation (Gasparri et al., Reference Gasparri, Kuemmerle, Meyfroidt, de Waroux and Kreft2015; Sinclair et al., Reference Sinclair, Marrou, Soltani, Vadez and Chandolu2014). Integrating smallholder farmers into the soybean value chain has the potential to generate household income, diversify production risks, and alleviate food insecurity and malnutrition (Giller et al., Reference Giller, Murwira, Dhliwayo, Mafongoya and Mpepereki2011; Kolapo, Reference Kolapo and Tzi-Bun2011). When soybean is intercropped or rotated with cereals such as maize, it can enhance the fertility status of the soil, control the Striga weed, and increase cereal yields (Carsky et al., Reference Carsky, Berner, Oyewole, Dashiell and Schulz2000; Giller et al., Reference Giller, Murwira, Dhliwayo, Mafongoya and Mpepereki2011; Sanginga et al., Reference Sanginga, Okogun, Vanlauwe and Dashiell2002). When improved soybean varieties are grown with good management, they can fix up to 300 kg ha-1 of nitrogen (N) (Salvagiotti et al., Reference Salvagiotti, Cassman, Specht, Walters, Wiess and Dobermann2008), which contributes N to cereal crops grown in rotation. This can be sufficient to replace the basal N fertilizer needed for maize crops in some cases (Giller et al., Reference Giller, Murwira, Dhliwayo, Mafongoya and Mpepereki2011). The financial value of the N fixed by soybean in Africa is over $200 million annually (Chianu et al., Reference Chianu, Huising, Danso, Okoth, Chianu and Sanginga2010). Thus, substantial savings could be made from fertilizer purchase to the national economies by integrating soybean into cropping systems in SSA.
The capacity of some soybean varieties to improve soil fertility may, however, be limited for at least two reasons. First, much of the N absorbed by plants is stored in the seeds and removed from the field at crop harvest, contributing to soil nutrient mining (Ojiem et al., Reference Ojiem, Vanlauwe, de Ridder and Giller2007; Salvagiotti et al., Reference Salvagiotti, Cassman, Specht, Walters, Wiess and Dobermann2008). Some of the early soybean varieties were bred for promiscuity or their ability to establish symbiotic relationships with the native Bradyrhizobia. Hence, their N harvest indices are usually larger than the proportion of N fixed from the atmosphere, leading to net negative contributions to the soil N balance (Sanginga, Reference Sanginga2003). This implies that Bradyrhizobia have lower N fixation efficiency. Second, optimal N fixation might be limited by availability of soil phosphorus (P) and compatible rhizobia in the soil (Giller et al., Reference Giller, Murwira, Dhliwayo, Mafongoya and Mpepereki2011).
Soybean yield response to N fertilization is usually very low except in high-yield (>4.5 t ha-1) environments (Salvagiotti et al., Reference Salvagiotti, Cassman, Specht, Walters, Wiess and Dobermann2008). What is more, higher N rates tend to depress biological nitrogen fixation (BNF). However, soybean needs adequate application of P fertilizers that are crucial for growth and N fixation (Carsky et al., Reference Carsky, Berner, Oyewole, Dashiell and Schulz2000; Giller et al., Reference Giller, Murwira, Dhliwayo, Mafongoya and Mpepereki2011). In addition, inoculation with the right rhizobium strain can significantly increase BNF and grain yields (Njira et al., Reference Njira, Nalivata, Kanyama-Phiri and Lowole2013; Ronner et al., Reference Ronner, Franke, Vanlauwe, Dianda, Edeh, Ukem, Bala, van Heerwaarden and Giller2016). Yet, very few studies (e.g., Ronner et al., Reference Ronner, Franke, Vanlauwe, Dianda, Edeh, Ukem, Bala, van Heerwaarden and Giller2016) have assessed yield gains and profitability of soybean production with the combined application of fertilizers and inoculants on smallholder farms. Therefore, information is lacking on the profitability of fertilizer and inoculant use on smallholder farms in SSA.
In SSA, few subsistence households invest in P fertilizers and inoculants due to lack of knowledge of their use and benefits. Current fertilizer recommendations for soybean are also based on results from research stations, which may not necessarily reflect farmers’circumstances. Therefore, the Alliance for a Green Revolution in Africa (AGRA) supported several partners (Supplementary Table S1) to create awareness in the use of fertilizers, inoculants, and improved soybean seeds in SSA. Much of this has been implemented through establishment of farmer participatory trials and on-farm demonstrations. In addition to knowledge dissemination, these trials were aimed at generating valuable data and insights into the variability in yields and financial viability of soybean production at farm scale. The present work focused on cross-site analyses of the data collected from trials conducted across Ghana, Kenya, Tanzania, Rwanda, Uganda, Malawi, and Zambia. The objectives of this analysis were to (1) determine the magnitude of increase in soybean yields and P use efficiency with the combined application of P and inoculants over P fertilizer alone; (2) quantify the profitability of P fertilizer and inoculant use under smallholder farm conditions; and (3) offer recommendations for policy and future research. The main hypothesis was that the combined application of P and inoculants significantly reduces yield risks and increases P use efficiency and profitability compared with P fertilizer alone under smallholder farm conditions.
Materials and Methods
Study areas
We analyzed a data set of over 2,800 observations (site–year–treatment combinations) from farmer participatory trials and demonstrations across sites in West Africa, East Africa, and Southern Africa. The data came from 17 projects implemented by 11 institutions through support from AGRA (Supplementary Table S1). AGRA engaged the following institutions as implementing partners, and the number of projects supported by each institution is given in parentheses: Savanna Agricultural Research Institute in Ghana (2), Kenyatta University in Kenya (2), Kenya Agricultural and Livestock Research Organization (1), Rural Outreach Program in Kenya (2), Clinton Hunter Development Initiative in Malawi (2), Clinton Hunter Development Initiative in Rwanda (1), the Ministry of Agriculture, Food Security and Cooperatives of Tanzania- (2), National Agricultural Research Organisation in Uganda (1), Millennium Promise – Uganda Millennium Villages (1), Africa 2000 Network in Uganda (1), and Zambia Agriculture Research Institute (2).
The sites in Ghana covered 19 districts in the northern region, which falls in the Guinea Savannah agroecological zone. The region is characterized by a single growing season (April–September) and the Harmattan period (December–March). In East Africa, the study areas covered 20 districts across Kenya, Rwanda, Tanzania, and Uganda. East Africa is diverse in terms of climate, soils, and agroecology, and the climate varies from arid to semi-arid to moist sub-humid. Precipitation is characterized by a bimodal annual cycle, with the major rainy season (also called the long rains) occurring during March–May and the short rains during October–December (Yang et al., Reference Yang, Seager, Cane and Lyon2014). The study areas in Southern Africa covered three districts in Malawi and five districts in Zambia. Southern Africa is characterized by a single growing season (December–April), followed by a dry season lasting seven or eight months.
The trial sites and their characteristics are summarized in Table 1, and detailed soil characteristics are in the Supplementary Table S2. The soil types are based on the harmonized soil atlas of Africa following the World Reference Base for Soil Resources (WRB) classification and correlation system (IUSS, 2014). For each site, baseline data on soil available N, P, pH, and soil organic matter (SOM) were also recorded.
Table 1. The number of districts covered by the projects, the dominant soils, and amount of P applied (kg ha-1) in the different countries (see appendix 1 for details), soybean varieties used, their recommended plant population density (plants ha-1), nominal water-limited yield potential (t ha-1), and the maximum yield (t ha-1) achieved in this study
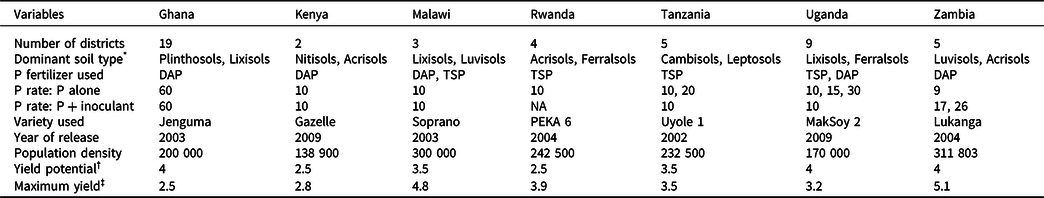
* Soil type according to WRB.
† Yield potential is the maximum yield recorded for each variety under optimum management by the agency that released the variety.
‡ Maximum yield recorded in this study.
The treatments
All data came from on-farm trials conducted in seven projects covering a wide range of biophysical and socioeconomic conditions. The design involved the mother-and-baby participatory trial design (Snapp et al., Reference Snapp, Blackie and Donovan2003), which systematically links a central “mother” trial managed by researchers to numerous farmer-managed “baby” trials (Snapp et al., Reference Snapp, Kanyama-Phiri, Kamanga, Gilbert and Wellard2002). The central mother trial tests a large number of “best-bet” technologies or varieties and it is replicated within a site, whereas the baby trials are each a partial replicate and test a smaller subset of technologies. Not only does this approach facilitate a rigorous cross-checking of biological performance with farmer assessment but it also allows for the testing of multiple technologies from which individual farmers colearn and select best-bet practices for own use as a baby (Snapp et al., Reference Snapp, Kanyama-Phiri, Kamanga, Gilbert and Wellard2002; Reference Snapp, Blackie and Donovan2003). On all sites each plot was 20 x 20 m (400 m2). The trials were nonreplicated, but each farm formed a replicate, as is the case in the study by Ronner et al. (Reference Ronner, Franke, Vanlauwe, Dianda, Edeh, Ukem, Bala, van Heerwaarden and Giller2016).
As a number of factors have not been controlled, we refrain from referring to “experiments.” Nor was a particular experimental design (in the strict sense) applied because the main objective of the trials was to disseminate knowledge rather than for experimentation. As such, we prefer to call them demonstrations. Although several interventions were demonstrated in the various projects, in this analysis, we focused on the control, P fertilizer alone, and P + inoculant because these were found across all sites and countries. The P fertilizer alone (for brevity, “with P” hereafter) is the P applied in the form of di-ammonium phosphate (DAP), single superphosphate (SSP), or triple super phosphate (TSP) on the particular site (Table 1). The control was soybean grown without any external inputs, which is often the de facto resource-poor farmers’ practice.
On all sites, improved soybean varieties released in the 2000s and recommended for the area were used. Characteristics of each variety are summarized in Table 1. All trials were conducted under rain-fed conditions with the recommended agronomic practices (e.g., planting dates, plant density, and weeding). On all sites, commercial strains of the rhizobial inoculants were used. The strain used in Ghana was USDA 442 applied at 5 g kg-1 seed, whereas in Kenya, Rwanda, Uganda, Tanzania, Malawi, and Zambia, the strain was USDA 110 applied at 10 g kg-1 seed.
Statistical analysis
The first step of the analyses focused on grain yield and the relative yield calculated as the difference between the treatment and the corresponding control yields. First, we estimated the probability of exceeding a given yield level in each treatment. We then generated the cumulative probability distribution of the yield in order to visualize the distribution of yield risks. With a given treatment, yield risk is said to exist when there was some probability of obtaining yields lower than or equal to those in the control. We also estimated the probability (ϕ) of exceeding 1 t ha-1 in each treatment using logistic regression with country, soil type, and treatment as predictors. The procedure, implemented in the SAS system, uses the average marginal effects of the predictors to estimate individual, cross-validated, predicted probabilities.
At country level, we estimated the overall effect of treatments on yield response using a linear mixed modeling approach, whereby treatment was entered as the fixed effect and site as the random effect in each country. The procedure used here fits the covariance structure of the data using the method of restricted (residual) maximum likelihood. To accommodate imbalances in sample sizes between trials, we used the Kenward–Roger method for approximating the degrees of freedom (Spilke et al., Reference Spilke, Piepho and Hu2005). At aggregate level, we explored the effects of soil type and treatment on grain yield using LMM, whereby soil type and treatment were the fixed effects and country was the random effect. We entered country as the random effect because data from one country are likely to be more correlated than data from another country. Acrisols, Ferralsols, Plinthosols, Luvisols, and Cambisols were included in the analysis, but Lixisols, Nitisols, and Vertisols were excluded due to their small sample sizes. To avoid the possibility of confounding of soil type effect with location effect, we did not include location as a factor in our model. In all analyses, the 95% confidence intervals (95% CIs) of estimates were used for statistical inference because CIs provide information about statistical significance as well as the direction and strength of the effect. Means were deemed significantly different from one another only if their 95% CIs were nonoverlapping. The width of the 95% CI was also used as an indication of uncertainties around estimated values. Variations in response to P alone and P + inoculant were also assessed using multiple regression of yield against soil pH, N, P, and SOM.
The second step of the analyses involved assessment of P use efficiency focusing on the partial factor productivity of P (PFPP) and agronomic efficiency of P (AEP) (Dobermann, Reference Dobermann2005; Snyder and Bruulsema, Reference Snyder and Bruulsema2007). PFPP answers the question, “How productive is this cropping system in comparison to its nutrient input?” AEP on the other hand answers the more direct question, “How much productivity improvement was gained by the use of this nutrient input?” (Snyder and Bruulsema, Reference Snyder and Bruulsema2007). We calculated PFPP as the ratio of grain yield to the amount of P applied and AEP in units of yield increase per unit of P applied. We then analyzed PFPP and AEP using LMM, whereby treatment is the fixed effect and site is the random effect in each country. We also assessed the variation in PFPP with soil pH, available N (%), available P (mg kg-1), and SOM (%) using multiple regression analysis as before.
The third step of the analyses involved determining the financial benefits of fertilizer use. Data on costs of fertilizer, labor and transport, and farm-gate prices of soybean were acquired through market surveys in each country. Next we estimated the net present value (NPV) for each treatment for a five-year horizon using the bank interest rates as proxies for discount rates. The interest rates during 2013–2014 were 17% for Kenya, 16% for Rwanda and Tanzania, 23% for Uganda, 25% for Malawi, 10% for Zambia, and 24% for Ghana.
We also calculated the value-cost ratio (VCR) as a measure of the average gain in the value of soybean output per kilogram of fertilizer applied. In high-risk production environments, VCR > 3 has been proposed as the threshold. However, a VCR ≥ 2 represents 100% return on the money invested in fertilizer and is sufficient to warrant investment in fertilizer (Kihara et al., Reference Kihara, Huising, Nziguheba, Waswa, Njoroge, Kabambe, Iwuafor, Kibunja, Esilaba and Coulibaly2015). Therefore, in this analysis, VCR ≥ 2 was taken as a reasonable threshold for risk coverage against investment in fertilizer at the scale of smallholder farms. We then estimated the probability of exceeding a given NPV and VCR in each treatment and present the cumulative probability distributions.
To determine the strength of association between profitability, yield, and AEP, a simple linear regression was performed with VCR as the dependent variable. This analysis was used to identify the yield or AEP at which VCR = 2, the threshold value warranting investment in P fertilizer and inoculants.
Results
Variation in grain yield
The maximum yields recorded across sites and seasons were larger than the nominal yield potential of the varieties except in Ghana and Uganda (Table 1). The mean yields achieved, however, were less than 60% of the yield potential of the varieties used. Application of P alone or P + inoculant significantly increased yields over the control except in Kenya (Table 2). The yield increases with P over the control ranged from a low of 7% in Kenya to as high as 170% in Tanzania. The combined application of P and inoculant also significantly increased yields over the P alone across all countries except in Uganda (Table 2): the estimated yield gain being −11.6% in Uganda, 17.3% in Kenya, 21.4% in Zambia, 25.7% in Ghana, 56.4% in Tanzania, and 57.1% in Malawi. In Kenya, yields remained below 1 t ha−1 in over 75% of the cases. Across all countries, the probability distribution of yields in P + inoculant remained on the right side of P alone (Figure 1), indicating lower yield risks with the combined application of P and inoculant. There was a 21 and 15% chance that yields will be equal to or less than the control with P + inoculant and with P alone, respectively. Across all countries, the probability of yields exceeding 1 t ha−1 with P and P + inoculant there was 74 and 69%, respectively (Figure 1a). When the probabilities of yields exceeding 1 t ha−1 were analyzed for each country separately, consistently higher probabilities were found with P + inoculant than with P alone (Table 2). In Kenya, the probability of exceeding 1 t ha−1 was very low both with P + inoculant (37%) and with P alone (28%).
Table 2. Variations in mean grain yield (in t ha-1), probability of exceeding 1 t ha-1 (ϕ > 1 t ha-1), partial factor productivity (PFP in kg kg-1), and agronomic efficiency (AE in kg increase kg-1) of P in soybean with phosphorus application and Rhizobium inoculation. Figures in parenthesis are 95% confidence limits (CLs). Nonoverlapping 95% CLs indicated statistically significant differences between treatments
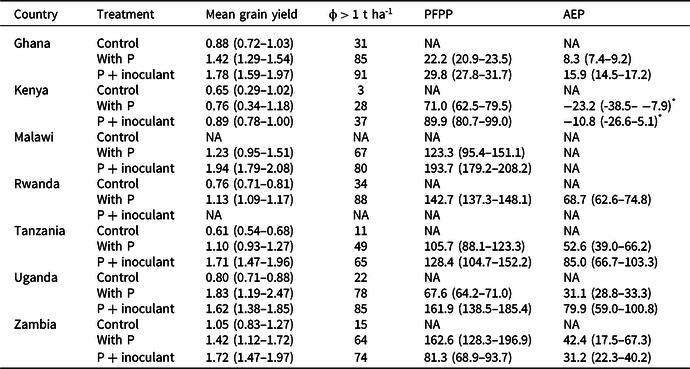
NA = not applicable.
* Negative AEP estimates arose because the control gave higher yields than the treatment in a large number of cases (∼48% with P+inoculum and 54% with P), especially in Busia.

Figure 1. The cumulative probability distribution of soybean grain yields across the six countries (a) and in each country (b–h).
At the aggregate level, yield responses significantly varied with soil type (F = 9.5; p < 0.0001), treatment (F = 41.8; p < 0.0001), and the interaction between soil type and treatment (F = 2.9; p = 0.0003). Yields in the control plots were generally higher on Luvisols than the other soils (Figure 2a). Yield gains over the control were significantly higher with P alone and P + inoculants on Cambisols than all other soils (Figure 2b); Acrisols gave the lowest yield gain over the control. Yield gains with P + inoculants over P alone were highest on Cambisols (73%) and lowest on Plinthosols (15%).
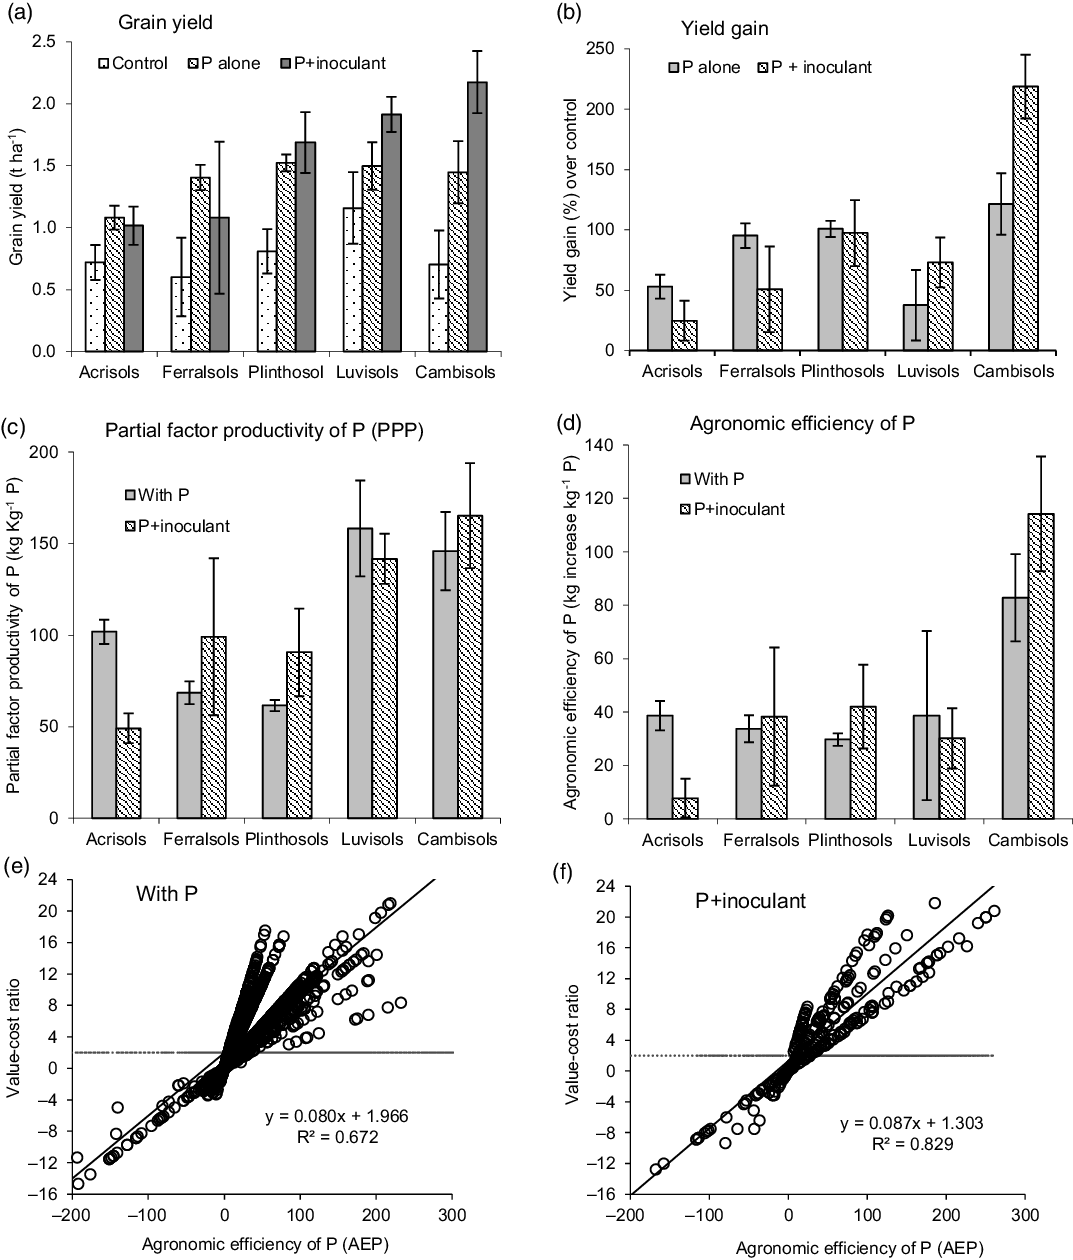
Figure 2. Variation in soybean grain yield (t ha-1), yield gains (in %) with P alone or with P + inoculant, partial factor productivity (kg grain kg-1 P) and agronomic efficiency (kg grain increase kg-1 P) with soil type (a–d), and covariation between the value cost ratio and agronomic efficiency of P (e–f). The dashed red lines represent VCR = 2, i.e., the level at which soybean is profitable.
According to the multiple regression analysis, yield response to P fertilizer significantly varied with soil pH and SOM, whereas response to P + inoculant differed with soil pH and available N (Table 3). Soil pH and SOM positively influenced yields, whereas available N tended to influence yields negatively (Table 3).
Table 3. Parameter estimates in the multiple regression analysis of variations in yield (in t ha-1), partial factor productivity of P (PFPP in kg kg-1), and agronomic efficiency of P (AEP in kg increase kg-1) with soil pH, available N (%), available P (mg kg-1), and soil organic matter (SOM in %)
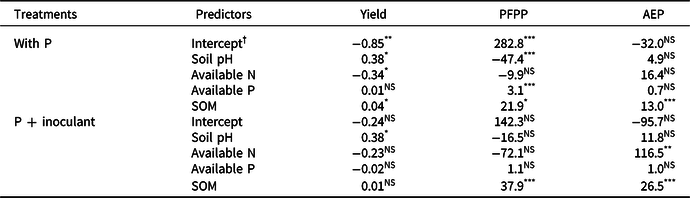
*, ** or ***after each figure represents significance at α = 0.05, 0.01, and 0.001.
† Intercept is the mean for the response when all of the independent variables are 0.
P use efficiency
PFPP was significantly higher with P + inoculant than with P alone on sites in Ghana, Malawi, Uganda, and Zambia but not in Tanzania. AEP was also significantly higher with P + inoculant than P on sites in Ghana, Tanzania, and Uganda (Table 2). Among the soils compared, Acrisols achieved the lowest PFPP and AEP (Figure 2c). Indeed, negative AEP estimates were found for Kenya (Table 2), especially in Busia where the control gave higher yields than the treatment in a large number of cases (∼48% with P+inoculum and 54% with P). Negative AEP values also occurred with 37% probability on the Embu site in Kenya. Both PFPP and AEP were significantly higher on Cambisols than the other soil types (Figure 2c).
In the multiple regression analysis, soil pH, available P, and SOM were significant determinants of PFPP in soybean grown with P alone, whereas SOM was the only significant determinant in soybean grown with P + inoculant (Table 3). In both cases, SOM had positive effects on PFPP and AEP. Available N also had a significant positive effect on AEP (Table 3).
Returns to P fertilizer
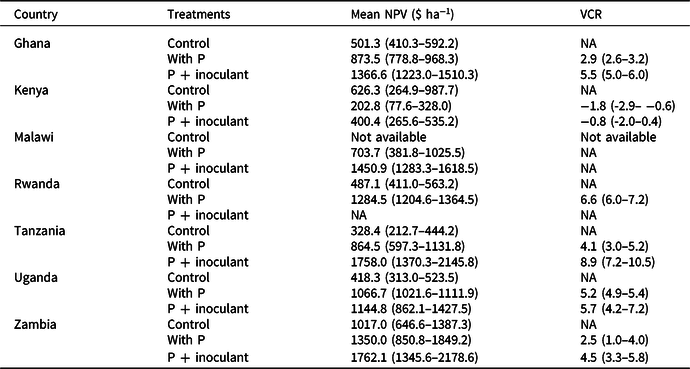
In all countries, NPVs were positive in all treatments (Table 4). P + inoculant gave the highest NPV in Zambia and the lowest in Kenya. The highest NPV (1762.1 $ ha−1) was achieved using P + inoculant across sites in Zambia and the lowest (400.4 $ ha−1) was in Kenya. Across all sites, the probabilities of producing soybean profitably (NPV > 0) using P alone and P + inoculant were 88 and 86%, respectively, over a five-year time horizon. The same trends were seen at country level except in Kenya, where NPV was higher in the control than for P + inoculant.
Table 4. The estimated mean net present values (NPV) for a five-year time horizon and the value cost ratios (VCRs). Figures in parenthesis are 95% confidence limits (CLs). Nonoverlapping 95% CLs indicated statistically significant differences between treatments
NA = not applicable.
The VCR across sites and seasons exceeded 2 in all countries except in Kenya (Table 4). The probability of getting VCR ≤ 0 was about 20% across countries. In Malawi, VCR could not be calculated because the control yield was not available. Soybean grown with P alone and P + inoculant consistently exceeded VCR of 2 when yields exceed 1 t ha-1 in Ghana, Rwanda, and Uganda. In Kenya and Zambia, VCR exceeding 2 was consistently achieved where yields exceed 2 t ha-1. Once yields exceed 2 t ha−1, investment in P fertilizer and inoculants became highly profitable. VCR was consistently greater than 2 where AEP exceeds 5 kg grain increase kg-1 P. The VCR increased linearly with increase in AEP (R2 = 0.829) with P + inoculant and less so with P alone (R2 = 0.672) across site and season combinations (Figure 2e–f).
Discussion
Our analyses provide evidence for consistent increases in soybean yields and nutrient use efficiency with P + inoculant over P alone and the control across sites in the six countries. P + inoculant also increased the probability of realizing the desired yield targets of 2 t ha−1 by up to 100% (Figure 1). The yield gains achieved in this study are comparable with the 0.3–0.7 t ha−1 increase recorded with P application rate of 20 kg ha−1 in Zimbabwe, Democratic Republic of Congo, and Mozambique (Woomer et al., Reference Woomer, Baijukya and Turner2012) under similar management conditions; but were higher than the 0.23–0.25 t ha−1 with P rates of 30 kg ha−1 on sites in Ghana (Kumaga and Ofori, Reference Kumaga and Ofori2004).
Although the overall effects of P and P + inoculant were positive, there were situations (e.g., in Kenya) where yields were lower than the control, constituting risks to farmers. The low-yield response in Kenya could be associated with the low-yield potential of the variety “Gazelle” and the low plant population density recommended for the sites (Table 1). Similarly, Ojiem et al. (Reference Ojiem, Vanlauwe, de Ridder and Giller2007) recorded low yields (mean: 0.43–1.04 t ha-1) with 30 kg ha−1 P when the variety SB20 was grown across various agroecological zones and soil fertility gradients in Kenya. On the sites in Kenya, plant populations were much lower than the densities required for high soybean yields. The desirable final population for soybean should be around 300 000 plants ha−1, with the minimum and maximum being 200 000 and 550 000 plants ha−1 (SeedCo, 2012).
The low yields could also be associated with the poorly buffered soils on the Busia site in Kenya. The soils at Busia are Acrisols, which suffer from strong acidity and P fixation (Batjes, Reference Batjes2011). Acrisols are also inherently unproductive because of their low nutrient content, low base saturation, aluminum toxicity, and strong P sorption (IUSS, 2014). The soils on the Embu site in Kenya are Nitisols, which are deep, well-drained, clay-rich, and generally fertile. Therefore, the low yields on the Embu site have to do with the low plant density.
Under rain-fed conditions, soil moisture stress associated with poor soil texture (e.g., sandy) and low SOM can also limit yields. According to simulation studies in East Africa (Sinclair et al., Reference Sinclair, Marrou, Soltani, Vadez and Chandolu2014), if the accumulated soil water is below 40 mm during a 50-days’ window, soybean production could be severely limited. The high yield response and P use efficiency observed in Tanzania could be related to favorable soil conditions on Cambisols, which are relatively younger, richer in nutrients, and have greater cation exchange capacity (IUSS, 2014) than other soils such as Acrisols and Ferralsols.
Although some of the soybean varieties used in this study have the potential to yield up to 5 t ha−1 (see maximum yield in Table 1), average yields were around 1.5 t ha−1. At such low yield levels, soybean production can be unprofitable. Therefore, it is important to close the yield gaps through appropriate agronomic practices such as use of inoculants, more balanced blend of nutrients, and planting at optimum densities.
Overall, our results show that the benefits of investment in P fertilizer and inoculants outweigh the costs, and the investment will generate profits over time. As argued by Ronner et al. (Reference Ronner, Franke, Vanlauwe, Dianda, Edeh, Ukem, Bala, van Heerwaarden and Giller2016), there is a strong agronomic and economic case for the combined use of P fertilizer and inoculants in soybean production under smallholder farm conditions. However, our analysis also indicated conditions where returns to investment are likely to be lower than the control. This highlights the need for appropriate targeting of soybean production areas to ensure efficient use of P fertilizer. It also points to the need for development of decision support tools for site-specific fertilizer recommendations and other agronomic practices. Promotion of inoculants in soybean production among smallholder farmers through extension advisory services and establishment of sustainable supply of good quality inoculants will also be critical. Additionally, the fertilizer industry would be encouraged to develop appropriate fertilizers that are more specific (e.g., high in P) to the needs of soybeans and other grain legumes.
Conclusions and Recommendations
From the results, it is concluded that the combined application of P and inoculants is superior to the application of P fertilizer alone in terms of yield gains across a wide range of conditions. NPVs were also positive in all countries, indicating that investments in P fertilizer and inoculants will generate profits over time. The results have also highlighted the key role soil type plays in the profitability of soybean; however, only a limited number of soil types were covered in this analysis. Therefore, future studies should assess the response of soybean to P application on other soil types with detailed chemical analyses so that the recommendation domains can be established better. Given the negative VCR and low NPV achieved in Kenya where the recommended plant populations were low, existing recommendations on planting densities and varieties need to be revisited. We strongly recommend that researchers test the productivity and profitability of higher plant densities in other countries as well. Additionally, there is a need to make fertilizers accessible to farmers in rural areas. It is also important for governments to devise policies and incentives that create more predictable and reliable soybean markets and stabilize prices.
Acknowledgments
We are grateful to the Bill and Melinda Gates Foundation for the funding to AGRA. We also thank grantees and partners in the recipient countries that implemented the projects reported in this paper. Specifically, we would like to thank the Savanna Agricultural Research Institute in Ghana, Kenyatta University in Kenya, Kenya Agricultural and Livestock Research Organization, Rural Outreach Program in Kenya, Clinton Development Initiative in Malawi and Rwanda, the Ministry of Agriculture, Food Security and Cooperatives in Tanzania, National Agricultural Research Organisation in Uganda, Millennium Promise in Uganda, Millennium Villages Africa 2000 Network in Uganda, and the Zambia Agriculture Research Institute.
Funding Support
This work was supported, in whole or in part, by the Bill & Melinda Gates Foundation [INV-005460]. Under the grant conditions of the Foundation, a Creative Commons Attribution 4.0 Generic License has already been assigned to the Author Accepted Manuscript version that might arise from this submission.
Conflict of Interest
The authors declare no conflict of interest.
Supplementary Material
For supplementary material for this article, please visit https://doi.org/10.1017/S0014479721000272


 Open access