the Creative Commons Attribution 4.0 License.
the Creative Commons Attribution 4.0 License.
 | 19 Jan 2022
Are agricultural plastic covers a source of plastic debris in soil? A first screening study
Zacharias Steinmetz
Paul Löffler
Silvia Eichhöfer
Jan David
Katherine Muñoz
Gabriele E. Schaumann
Agricultural plastic covers made from polyethylene (PE) and polypropylene (PP) provide increased yields and an improved crop quality. However, such covers are suspected of partially breaking down into smaller debris and thereby contributing to soil pollution with microplastics. To scrutinize this, we randomly sampled 240 topsoil cores (0–5 cm) from eight fields which were covered with fleeces, perforated foils, and plastic mulches for less than 2 years. Samples from the field periphery (50 m perimeter) served as a reference. Visual plastic debris > 2 mm was analyzed by Fourier transform infrared spectroscopy. Smaller, soil-associated plastic debris was dispersed from 50 g of fine soil (≤ 2 mm) using sodium hexametaphosphate solution and density-separated with saturated NaCl solution. The collected PE, PP, and polystyrene (PS) debris was selectively dissolved in a mixture of 1,2,4-trichlorobenzene and p-xylene at 150 ∘C and quantified by pyrolysis–gas chromatography–mass spectrometry (Py-GC/MS). We counted six PE and PS fragments > 2 mm in two out of eight fields. By contrast, Py-GC/MS detected PE, PP, and PS contents in the fine soil of six fields (6 % of all samples). In three fields, PE levels of 3–35 mg kg−1 were potentially associated with the use of thinner and less durable perforated foils (40 µm thickness). This was slightly more pronounced at field edges where the plastic covers are turned and weighed down. By contrast, 50 µm thick PE films were not shown to emit any plastic debris. PP contents of 5–10 mg kg−1 were restricted to single observations in the field centers of three sites. At one site, we found expanded PS particles > 2 mm that concurred with elevated PS levels (8–19 mg kg−1) in the fine soil. Both PP and PS were distributed indistinctly across sites so that their source remained unresolved. In addition, the extent to which plastic contents of up to 7 mg kg−1 in the field periphery of some sites were attributed to wind drift from the covered fields or from external sources needs to be investigated in future studies. Our results suggest that the short-term use of thicker and more durable plastic covers should be preferred over thinner or perforated films to limit plastic emissions and accumulation in soil.
- Article
(5693 KB) - Full-text XML
- BibTeX
- EndNote


The use of plastic covers has become common agricultural practice for improving yields and crop quality, managing harvest times, and increasing pesticide and water use efficiency (Lamont, 1993; Steinmetz et al., 2016). The most used materials are polyethylene (PE) films and polypropylene (PP) fleeces of various thicknesses made to last for up to 10 years (Bertling et al., 2021). However, wind, heavy machinery, or UV irradiation are likely to disintegrate parts of the covers into debris smaller than 1–5 mm (Scarascia-Mugnozza et al., 2011), termed microplastics (Hartmann et al., 2019). In recent years, this supposition has raised a discussion about agricultural plastic covers acting as a potential source of plastic debris in the terrestrial environment and particularly in soil (Steinmetz et al., 2016; Hurley and Nizzetto, 2018). Yet, the actual contribution of agricultural plastic covers to soil pollution with plastic debris has remained incompletely understood and rarely discriminated from other potential sources like aerial deposition or littering.
These knowledge gaps are probably because the few studies that have analyzed plastics in and on soil so far mostly relied on optical detection by Fourier transform infrared (FTIR) spectroscopy or visual microscopy. Both techniques deliver particle counts and are relatively sensitive to matrix interferences and thus require extensive sample preparation when applied to heterogeneous matrices with a similar particle structure to the plastic particles of interest (Thomas et al., 2020). For those reasons, Piehl et al. (2018) and Harms et al. (2021) excluded plastic debris < 1 mm from their FTIR analysis of agricultural topsoil (0–5 cm). The investigated sites were not covered with plastic; yet the soil contained 0.3 to 6 particles kg−1 of 1–5 mm size. These findings contrast Zhang and Liu (2018), who detected 95 % of plastic debris < 10 mm (up to 40 000 particles kg−1) in the size fraction of 0.05–1 mm after more than 25 years of permanent greenhouse cultivation. Topsoil previously covered with plastic revealed plastic counts of 60 up to 1000 particles kg−1 correlating with the 5–24 years of continuous plastic coverage (Huang et al., 2020). PE and PP are typically found the most (Harms et al., 2021; Kim et al., 2021). However, there are still studies which neither state particle sizes and analysis cutoffs nor assess the polymer composition of the retrieved particles (for example Zhang et al., 2018; Beriot et al., 2021). Moreover, mass-based information is still missing but urgently needed for the monitoring and regulation of plastics in the environment.
With this study, we aimed to understand the mass distribution of plastic debris associated with fine soil (≤ 2 mm) better and to scrutinize the extent to which agricultural plastic covers emit plastic debris into their surroundings. In contrast to other studies, we screened fields covered with plastic for less than 2 years, which reflects typical land use and crop rotations in Germany (Harms et al., 2021). To this end, we randomly sampled topsoil within and around eight commercially managed agricultural fields covered with fleeces, perforated foils, and plastic mulches. PE, PP, and polystyrene (PS) debris ≤ 2 mm was quantified by solvent-based pyrolysis–gas chromatography–mass spectrometry (Py-GC/MS) (Steinmetz et al., 2020). To better account for the heterogeneous distribution of plastic debris in soil, we further refined and validated a new sample preparation procedure involving soil aggregate dispersion and density separation that allowed for the analysis of up to 50 g soil. Our analyses were complemented by FTIR spectroscopy with attenuated total reflection (ATR) for plastic debris > 2 mm. We hypothesized that a directed gradient of plastic debris from the field center to its periphery (50 m field perimeter) supports the assumption of plastic covers contributing to an increased soil pollution with plastic debris. On the contrary, an undirected gradient would suggest another source of pollution such as littering. A uniform distribution may be an indicator for aerial deposition. In addition, we expected field margins (5 m perimeter) to be hotspots for plastic debris due to mechanical stress subjected to the plastic covers by weighing them down with soil or sandbags.
2.1 Study area
The screening study was conducted in cooperation with local farmers in commercially managed horticultural fields in the Palatinate region in southwestern Germany. The study area has a mild and dry climate with mean annual temperatures of 10–13 ∘C and a total annual precipitation of 600±100 mm (Agrarmeteorologie Rheinland-Pfalz, 2021).
Sites 1–3 were located near Offenbach an der Queich (49∘12′ N, 8∘11′ E) and cultivated with strawberries (Fragaria x ananassa). Site 1 was fully covered with white fleece (100 µm thickness) and overlain by an additional 40 µm thick perforated foil (750 punch holes m−2) for one growing season (for the last 4 months). Site 2 had plastic-mulched ridges (black, 50 µm thickness) and bare furrows established 2 years previously. On top of this, the complete field was covered with white fleece (100 µm thickness) for the growing season. Site 3 was mulched like site 2 but without any additional fleece cover (Fig. 1a).
Sites 4 and 5 were located near Schifferstadt (49∘24′ N, 8∘21′ E) and cultivated with lettuce (Cichorium endivia) and cabbage (Brassica oleracea var. gongylodes), respectively. Both fields were completely covered with white fleece (40 µm thickness) and a top layer of white perforated foil (50 µm thickness, 750 punch holes m−2; Fig. 1b) for the growing season.
Sites 6–8 were situated in Landau in der Pfalz (49∘11′ N, 8∘10′ E). The rhubarb cultivation (Rheum rhabarbarum) was fully covered with white perforated foil for the growing season. The foil on site 6 had 250 punch holes m−2 and was 50 µm thick. At site 7, the number of punch holes was similar to site 6, but the film thickness was only 40 µm. By contrast, the foil on site 8 (40 µm thickness) had 750 punch holes m−2 (Fig. 1c).
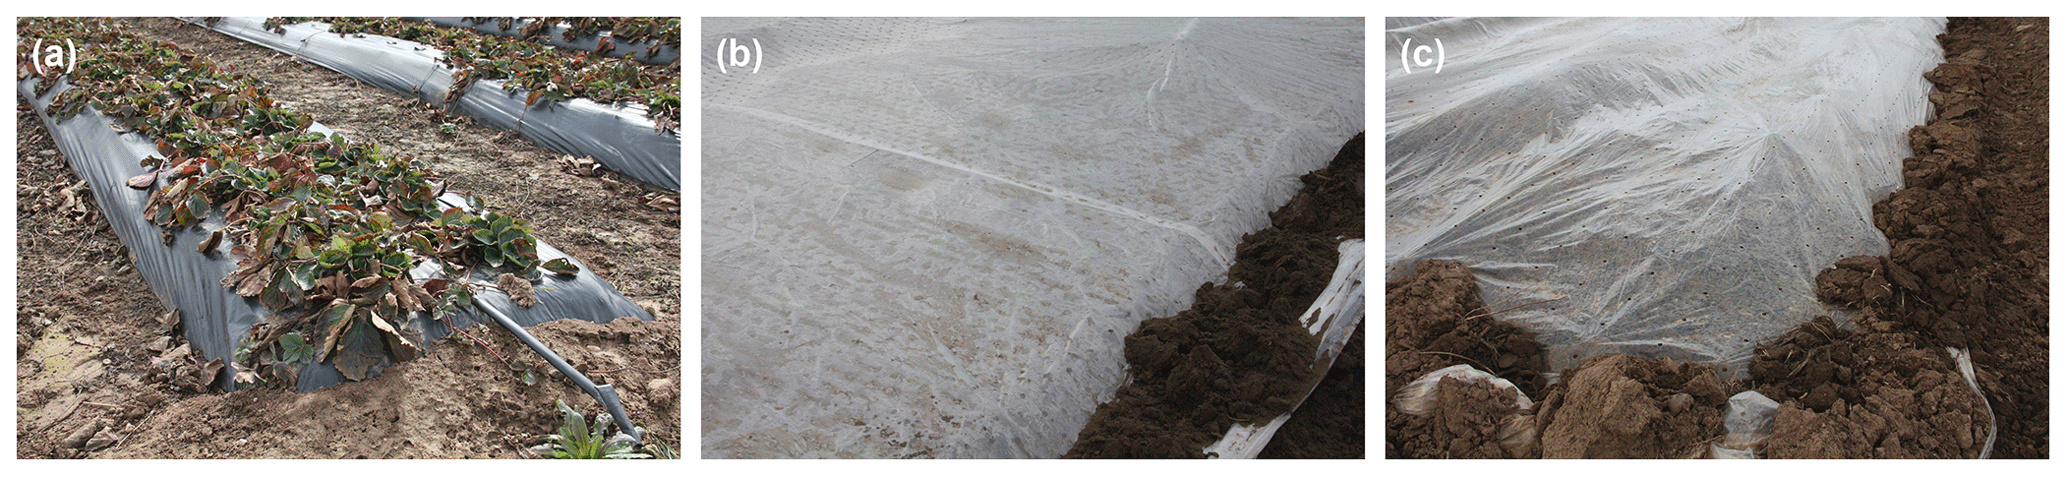
Figure 1Exemplary photographs of site 3, 4, and 8 field edges covered with (a) mulch, (b) fleece and perforated foil, and (c) perforated foil, respectively.
2.2 Sampling strategy
To systematically screen these agricultural fields for plastic debris, each site was subdivided into four transects as shown in Fig. 2. The field center and the inner field edge, defined as a 5 m strip around the field center, were cultivated and covered with plastic film. In these transects, plant rows (ridges) and track rows (furrows) were sampled separately. The outer field margin was marked by the 5 m perimeter around the cultivation. The field periphery (50 m perimeter around the cultivation) served as a reference.
Prior to retrieval of the plastic covers in spring 2018, small portions of the plastic cover were grab-sampled for subsequent characterization. Soil samples were taken < 1 week after retrieval of the plastic covers. The sampling spots were predefined by projecting a 1×1 m grid onto each transect and randomly selecting five squares without replacement (30 per site). At each of these spots, topsoil (0–5 cm depth) was sampled using a stainless steel core cutter (5 cm diameter). The soil cores were immediately transferred to uncoated paper bags and air-dried in there to reduce the risk of contamination.
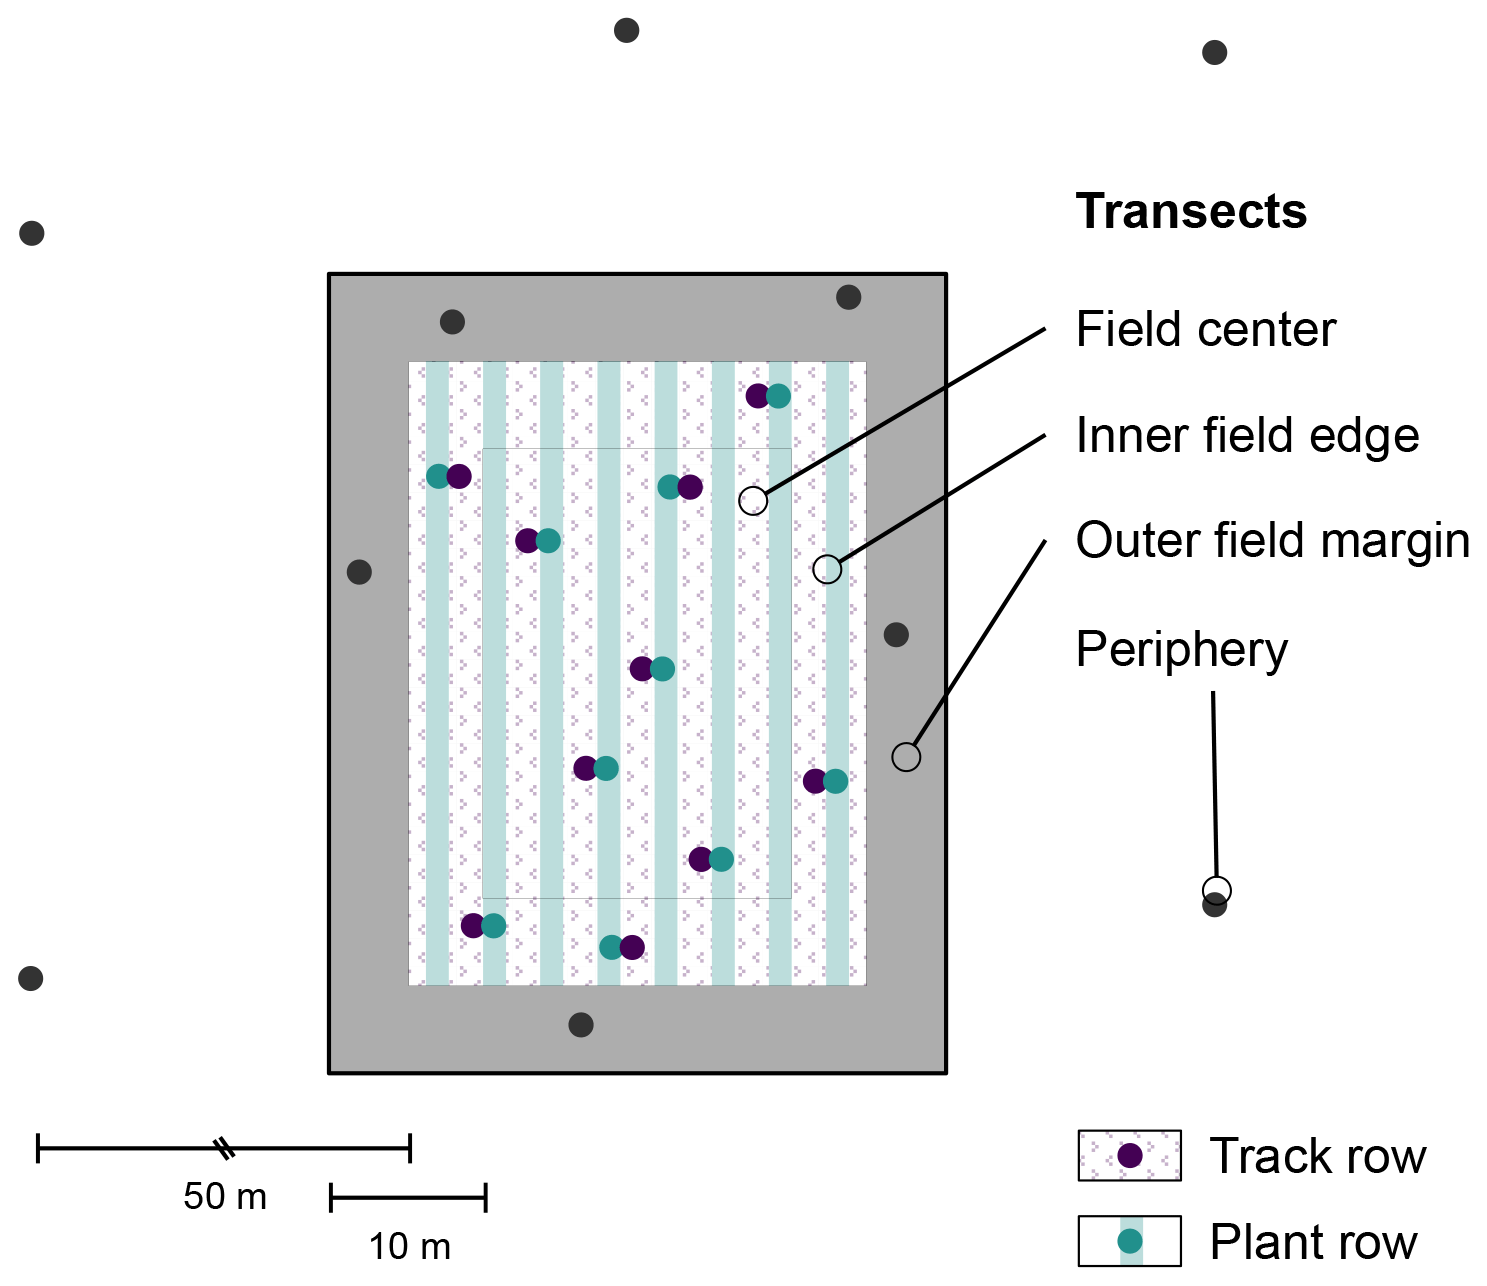
Figure 2Sampling scheme for one exemplary site; soil samples (filled dots, n=5 per transect) were randomly selected. At the cultivated field centers and inner field edges, plant and track rows were sampled separately. The outer field margin and the field periphery were uncultivated.
2.3 Soil characterization and chemical analysis of plastic covers
The soil texture at each site was estimated from composite subsamples using the hydrometer method described in ASTM D422-63 (2007). The electric conductivity (EC) and pH were measured in deionized water and 0.01 M CaCl2 aqueous solution, respectively. Soil carbon and nitrogen were determined by dry combustion elemental analysis (Vario MICRO Cube, Elementar, Germany).
The grab-sampled plastic covers were characterized by qualitative thermal desorption (TD)- and Py-GC/MS, differential scanning calorimetry (DSC), thermogravimetry (TGA), and FTIR–ATR analysis. TD- and Py-GC/MS were applied to assess volatile additives or other polymer-associated compounds as well as the overall polymer composition of the agricultural plastic covers. To this end, a 1×1 mm piece was cut out of each plastic cover and placed into a pyrolyzer quartz tube of a Pyroprobe 6150 filament pyrolyzer (CDS Analytical, Oxford, United States) coupled with a Trace GC Ultra with DSQII mass spectrometer (MS) (Thermo Fisher Scientific, Bremen, Germany). For the TD, the pyrolyzer interface was flash-heated (10 K ms−1) to 300 ∘C for 15 s to volatilize any polymer-associated compounds. A passivated transfer line (350 ∘C) transferred the volatiles to the split/splitless injector (300 ∘C, split ratio 1:75) of the GC/MS system. The compounds were chromatographically separated in a 1.3 mL min−1 He flow on a 30 m × 0.25 mm capillary column (5 % phenyl arylene, 95 % dimethylpolysiloxane, 0.25 µm film thickness, ZB-5MS, Phenomenex, Aschaffenburg, Germany). The oven program was: 40 ∘C (2 min hold), 8 K min−1 ramp to 300 ∘C (5 min hold). The GC/MS transfer line was kept at 280 ∘C, and the MS ion source (70 eV) was heated to 230 ∘C. The MS monitored 50–280 at a scan rate of 500 s−1. After TD, the sample was pyrolyzed at 750 ∘C for 15 s applying the same GC/MS settings. All chromatograms were evaluated using OpenChrom, version 1.4.0.202103172155 (Wenig and Odermatt, 2010), with the NIST08 database for peak identification.
DSC and TGA measurements were conducted in accordance with David et al. (2018). In brief, DSC was applied between −50 and 250 ∘C (10 K min−1 ramp, 50 mL min−1 N2 flow, Q1000, TA Instruments, New Castle, US) to determine the melting and crystallization temperatures of the agricultural plastic films. For the determination of polymer degradation onsets and evolved gases, plastic samples were subjected to TGA (STA 449 F3 Jupiter with QMS 403 C Aëolos, Netzsch, Selb, Germany). The heating ramp was 5 K min−1 from 40 to 1000 ∘C under a 20 mL min−1 Ar flow. The degradation onset was determined by the temperature at which the polymer starts to thermally decompose (< 1 % mass loss).
Complementary FTIR–ATR analyses were performed at 4000–650 cm−1 (4 cm−1 resolution) using a Cary 630 spectrometer (Agilent, Santa Clara, California, US). Peaks were identified with Open Specy, version 0.9.2 (Cowger et al., 2021).
2.4 Soil sample preparation and visual pre-screening
All soil cores were sieved to fine soil (≤ 2 mm) and manually homogenized as suggested by Thomas et al. (2020). Visual plastic items retained by the sieve (> 2 mm) were picked, photographed (Leica S9i, Wetzlar, Germany), and analyzed via FTIR–ATR as described in the previous section.
Plastic debris ≤ 2 mm was density-separated from the soil matrix using saturated NaCl solution. To this end, 50 g of fine soil was first weighted into 1 L separation funnels with polytetrafluoroethylene (PTFE) stop cock (Carl Roth, Karlsruhe, Germany) and agitated at 150 rpm with 125 mL of sodium hexametaphosphate (40 g L−1, CAS 68915-31-1, ≥ 99 % purity, Carl Roth, Karlsruhe, Germany) for 2 h to disperse any soil aggregates. In a second step, 90 g of NaCl (CAS 7647-14-5, ≥ 99.8 % purity, Carl Roth, Karlsruhe, Germany) and 125 mL of ultra-pure water were added to obtain a density solution of 1.2 g cm−3. The mixture was shaken for another 2 h and left for sedimentation for at least 16 h. The sedimented soil was released from the separation funnel by gentle stirring of the suspension using the curved end of a bicycle spoke. Afterwards, the supernatant was collected in pleated cellulose filters (Whatman 589/2, 4–12 µm particle retention, GE Healthcare, Buckinghamshire, UK). The filter cakes were transferred into glass culture tubes (16×100 mm, GL18, VWR, Darmstadt Germany) and dried at 60 ∘C.
Based on Steinmetz et al. (2020), the culture tubes were topped off with 8 mL of a 1:1 mixture (v+v) of p-xylene (CAS 106-42-3, > 98.0 % purity, Fluka Analytical, München, Germany) and 1,2,4-trichlorobenzene (TCB, CAS 120-82-1, 99 % purity, Alfa Aesar, Kandel, Germany). In addition, the mixture contained 100 mg L−1 butylated hydroxytoluene (CAS 128-37-0, ≥ 99 %, Merck, Darmstadt, Germany) to prevent polymer oxidation. The tubes were sealed with a PTFE packing (Carl Roth, Karlsruhe, Germany), vortexed, and heated at 150 ∘C for 1 h to facilitate extraction of the polymer analytes from the filter cake. After cooling down to room temperature, the supernatant was spiked with deuterated PS (PS-d5, PolymerSource, Quebec, Canada) for internal standardization using positive displacement pipettes with glass capillaries (Transferpettor micro, Brand, Wertheim, Germany). The extracts were stored in 2 mL ND9 glass vials with inserts and PTFE-sealed caps (Wicom, Heppenheim, Germany).
2.5 Quantification of plastic debris in soil
PE, PP, and PS debris in fine soil (≤ 2 mm) was quantified via Py-GC/MS as detailed in Steinmetz et al. (2020). In brief, 2 µL sample aliquots were injected into pyrolyzer quartz tubes equipped with two Whatman QM-A microfiber filter discs (Kent, United Kingdom) using a 10 µL syringe with PTFE plunger (Hamilton 1701 N with 26s gauge, Bonaduz, Switzerland). Each sample was measured once as described in Sect. 2.3. However, the pyrolyzer interface was first held at 300 ∘C to purge remaining solvents and volatiles online. After 3 min, the sample was flash-pyrolyzed (10 K ms−1) at 700 ∘C for 15 s and transferred to the GC/MS system. The MS selectively monitored (SIM mode) 70 and 126 for the PP pyrolysate 2,4-dimethyl-1-heptene (2,4Me9:1(1), RI 841), 104 and 118 for the PS pyrolysates styrene (Sty, RI 895) and α-methylstyrene (αMeSty, RI 981), respectively, and 82 and 95 for PE n-alkadienes like 1,21-docosadiene (, RI 2187). The internal standard styrene-d5 (Sty-d5, RI 892) was acquired at 109.
2.6 Method validation
The reference polymers used for external standardization and recovery experiments were analytical grade PE beads (CAS 9002-88-4, 500 µm average particle size) from Alfa Aesar, Kandel, Germany, PP fragments (CAS 9003-07-0, isotactic, ≤ 1000 µm) from Aldrich Chemistry, Taufkirchen, Germany, and PS beads (CAS 9003-53-6, 250 µm average particle size) from Goodfellow, Huntingdon, United Kingdom (see Steinmetz et al., 2020, for details).
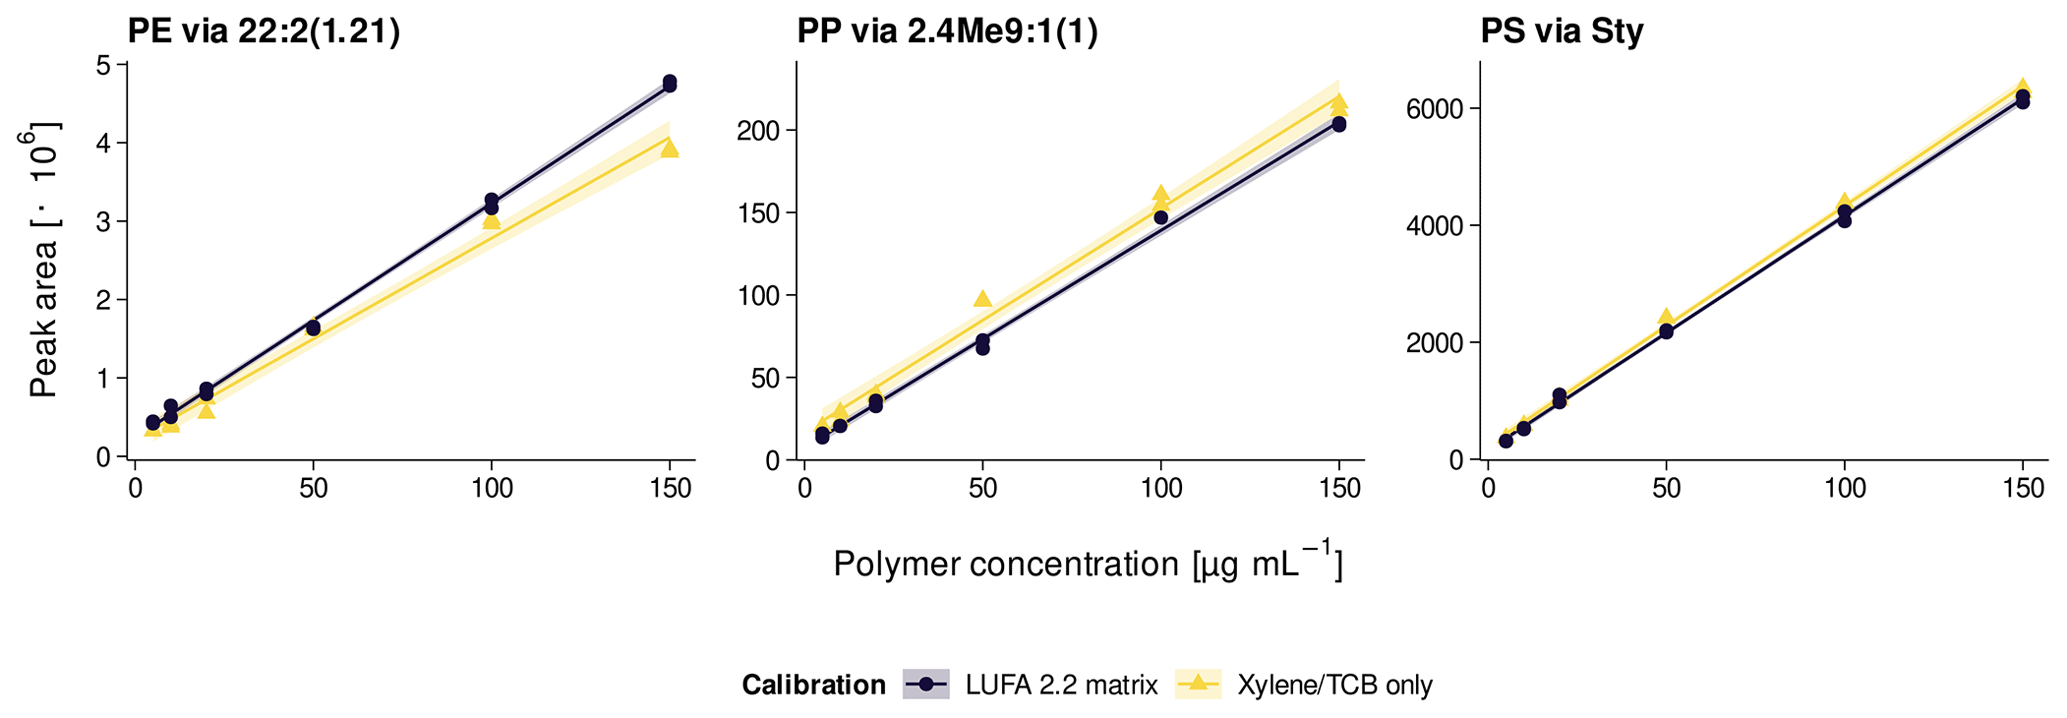
The Py-GC/MS system was calibrated weekly against external standards (5–200 µg mL−1 PE, PP, and PS dissolved in xylene/TCB at 150 ∘C) following the protocol by Steinmetz et al. (2020). Calibration curves were evaluated for signal sensitivity (slope) and linearity (adj. R2). Daily sample measurements were bracketed with 100 µg mL−1 standards to correct for inter-day variations. The intra-day repeatability was determined by consecutive injections of 100 µg mL−1 standards (n=12). The internal standard PS-d5 added after sample extraction was used for continuous repeatability checks of sample measurements.
To evaluate the plastic recovery from soil, triplicates of two agricultural reference soils were spiked at 2 and 20 mg kg−1 of each polymer. The reference soils used were a loamy sand (8 % clay, 16 % silt, 76 % sand) with a Corg content of 1.7 % (LUFA 2.2, Landwirtschaftliche Untersuchungs- und Forschungsanstalt, Speyer, Germany) and a silty clay (47 % clay, 41 % silt, 12 % sand) with 2.5 % Corg (RefeSol 06-A, Fraunhofer IME, Schmallenberg, Germany). Instrumental and method limits of detection (LODs) and limits of quantification (LOQs) were calculated from standard deviations (SDs) of signal intensities of low analyte concentrations (2 µg mL−1) and blank reference soils (n=3), respectively, in accordance with DIN 32645 (2008), Magnusson and Örnemark (2014), and Steinmetz et al. (2020). The selectivity against other potentially interfering non-target polymers was estimated from peak intensities of PE, PP, and PS pyrolysates in LUFA 2.2 soil spiked at each 40 mg kg−1 polyethylene terephthalate (PET), poly(methyl methacrylate) (PMMA), polyvinyl chloride (PVC), and tire wear debris (TWD). The PET came from a cryomilled bottle recyclate (PETKA CZ, Brno, Czech Republic) as detailed in David et al. (2018). The PMMA was ground from a commercial plexiglass provided by the Bundesanstalt für Materialforschung und -prüfung (Berlin, Germany). The PVC was purchased from Aldrich Chemistry (Taufkirchen, Germany), and the TWD was from a test rig at Bundesanstalt für Straßenwesen (Bergisch Gladbach, Germany). In addition, a matrix-matched calibration was performed in LUFA 2.2 soil extracts in accordance with Magnusson and Örnemark (2014) to assess the effect of soil matrix on the calibration parameters.
2.7 Quality control
To prevent the risk of contamination, all laboratory equipment coming into direct contact with the sample or the extract solution was made of glass, metal, paper, or PTFE. PE, PP, or PS equipment was completely avoided. The worn laboratory coats were of 100 % cotton. In addition, all samples and extracts were kept in closed vessels or covered with aluminum foil. The vessels were only opened under a fume hood.
The sample extraction was monitored with weekly procedural blanks that underwent the complete extraction procedure as the samples but without soil addition. Plastic contents in our procedural blanks were exclusively below the LOD.
2.8 Data evaluation
Data processing and statistical analyses were conducted using R (version 4.1.0) with “data.table”, “magrittr”, and “envalysis” as main libraries. The results are given as mean ± SD. Measurement repeatabilities are stated as percentage relative standard deviation (RSD). Matches from the Open Specy FTIR library are reported as Pearson's r.
The potential matrix effect on the calibration was evaluated using signal suppression enhancement ratios (SSEs; Eq. 1) which compare the slope of a calibration curve prepared in solvent (bsolv) with that of the matrix-matched calibration (bmatrix) (Magnusson and Örnemark, 2014).
3.1 Soil properties
According to FAO (2014) classification, the investigated soils were identified as Anthrosols. The dominant soil textures were silty clay and clayey silt (Table 1), with sites 1, 3, and 4 showing the highest clay contents (≥ 30 %) compared to the remaining sites. Sites 1–3 and sites 6–7 had Corg contents of 1.1 %–1.3 % and 1.4 %–1.5 %, respectively. The lowest Corg contents (0.9 %) were found at sites 4 and 5. Soil N was ≤ 0.2 % across all sites. The soil pH was slightly acidic (6.6–7.0), and the EC ranged from 118 to 536 µS cm−1. The highest EC values were observed at sites 6 and 7.
Table 1Soil properties of experimental sites.
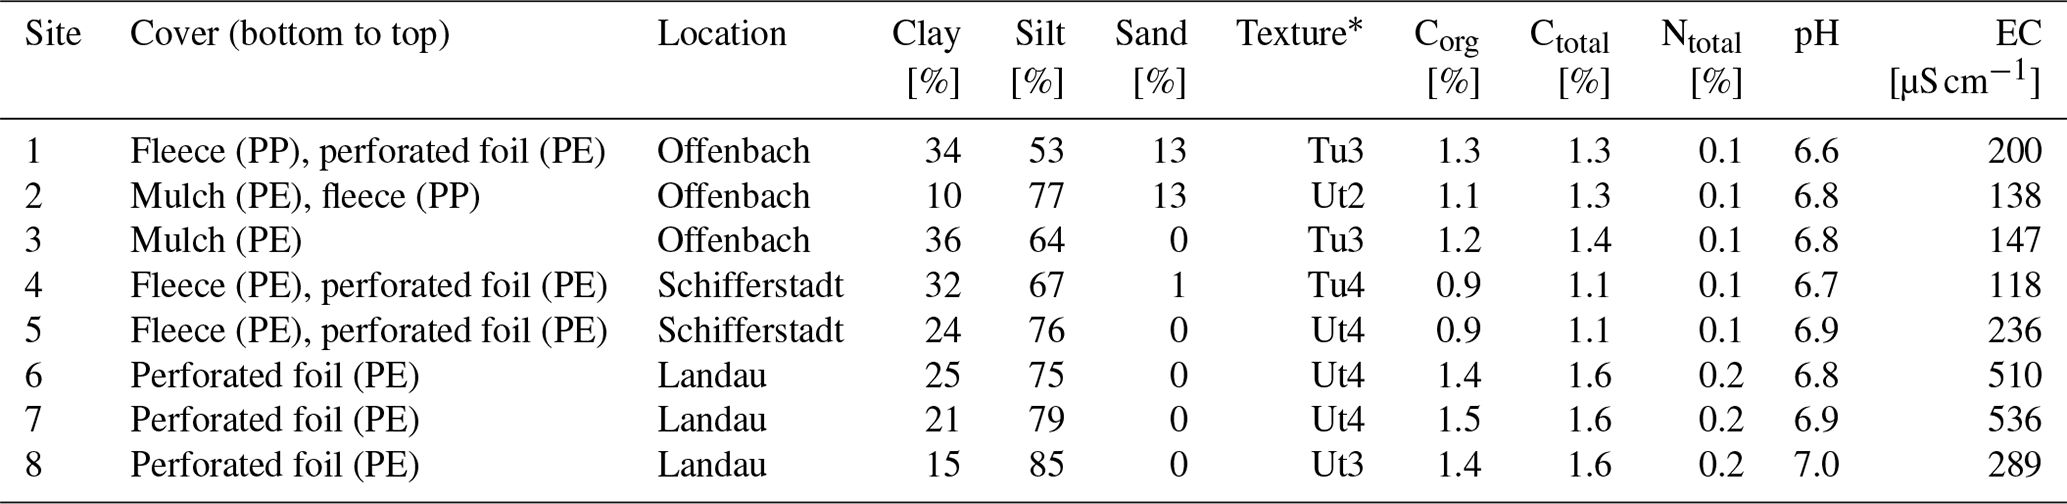
* In accordance with Sponagel et al. (2005); Tu is silty clay, and Ut is clayey silt.
3.2 Agricultural plastic covers
The fleeces that covered sites 1 and 2 were identified as PP as indicated by multiple C−H stretch deformations at 2950–2838 cm−1 as well as CH2 and CH3 bends at 1455 and 1377 cm−1, respectively (Open Specy FTIR library match: r≥0.96; see Fig. A1a for an exemplary FTIR spectrum). A shapeless broad peak between 1860 and 1660 cm−1 indicated the presence of carbonyl groups (Grause et al., 2020). The indistinct band between 1200 and 900 cm−1 may be attributed to C−O stretching in alcohols, acids, or ethers originating from a contamination with soil organic matter (SOM) or plastic aging (Fu et al., 2021). Complementary DSC showed crystallization temperatures at 114–116 ∘C and melting temperatures at 158–160 ∘C. Between 381 and 400 ∘C, the polymers started to decompose into methylalkenes characteristic of PP (Tsuge et al., 2011, Fig. A2a, for an exemplary pyrogram).
By contrast, the fleece from sites 4 and 5 was made of PE (r=0.96). The respective FTIR spectrum showed indicative CH2 stretching between 2919–2915 cm−1 (asymmetric) and 2851–2845 cm−1 (symmetric, Fig. A1c). The crystallization and melting temperatures were 96 and 108 ∘C, respectively. The degradation onset was 408 ∘C and triggered the formation of PE-specific triplets of n-alkadienes, n-alkenes, and n-alkanes (Fig. A2c). All other covers, namely mulches and perforated foils from sites 2–8, were made of PE (r≥0.86, Fig. A1b, d, e). The carbonyl band at 1860–1660 cm−1 was visible in all samples but was most pronounced for the PE mulch from sites 2 and 3. However, crystallization temperatures (100–113 ∘C) and melting temperatures (110–122 ∘C) of the PE mulch were slightly higher than those of the PE fleece. The degradation onsets of the mulches and perforated foils ranged from 384 to 397 ∘C.
The qualitative analyses of volatile polymer additives and other polymer-associated compounds thermally desorbing from the agricultural films at 300 ∘C revealed three omnipresent substances (NIST08 matches > 75 %; see Fig. A3): these were propyl dodecanoate (CAS 3681-78-5 or 10233-13-3), oleonitrile (CAS 112-91-4), and 9-octadecenamide (CAS 301-02-0; see Fig. A2 for exemplary chromatograms). In addition, the PP fleeces from sites 1 and 2 as well as the PE perforated foils from sites 4–8 contained traces of a di-tert-butylphenol (for instance CAS 96-79-4), which is an indicator for antioxidants (Hahladakis et al., 2018). Propyl dodecanoate and oleonitrile are lubricants probably added to agricultural plastic covers for easier spreading out on-site. 9-Octadecenamide is a known degradation product of hindered amine light stabilizers like Chimassorb 944 (Haider and Karlsson, 2001). No pesticides were detected in the plastic covers, probably due to the limited sensitivity of the qualitative analysis and/or their low thermal stability.
Complementary FTIR–ATR and Py-GC/MS confirmed that both plastic mulches and perforated foils were exclusively made of PE. The fleeces were of PE and PP, although PP is more common (Hamouz et al., 2011). All PE covers melted within the range of 109–125 ∘C and degraded > 318 ∘C as expected for virgin LDPE (Beyler and Hirschler, 2002). Interestingly though, melting temperatures of the PP fleeces were 5–10 ∘C lower than those of virgin PP (165–170 ∘C) (Beyler and Hirschler, 2002; Tocháček et al., 2019). The degradation onset was not affected by this and comparable to virgin PP (> 315 ∘C) (Beyler and Hirschler, 2002). Decreasing melting temperatures may indicate the presence of additives or other impurities but could also be a first sign of polymer aging, as similarly observed after 5–20 months of temperate weathering (Tocháček et al., 2019). This is consistent with the carbonyl groups identified via FTIR which are indicative for the photo-oxidation of polyolefins (Grause et al., 2020). In our study, fleeces and perforated foils were on the fields for about 4 months. The mulches were applied 2 years previously. The incipient aging concurred with the release of antioxidant di-tert-butylphenol from the PP backbone as indicated by TD-GC/MS. As di-tert-butylphenol was also released from PE perforated foils, it remains unresolved as to whether the presence of di-tert-butylphenol was material-specific or indeed triggered by polymer aging.
3.3 Visual plastic items on-site
We visually identified 30 suspect items (> 2 mm) during soil sieving. Subsequent FTIR–ATR analysis revealed six items as plastics. These were a black PE film (r=0.92, Fig. 3a) and four PS fragments (r≥0.91, Fig. 3b) at the field center of site 5 (see Fig. A4 for the respective FTIR spectra). The PS showed characteristic peaks at 3024, 1492, and 694 cm−1 originating from aromatic C−H stretch and bend deformations. In the field center of site 6, a green PE film (r=0.92, Fig. 3c) was found. All other items were of natural origin including invertebrate shells, stones or wood fragments, and cellulose fibers that were identified by Open Specy as chitin, resin dispersion, and cotton, respectively (r≥0.82, Fig. 3d–f).
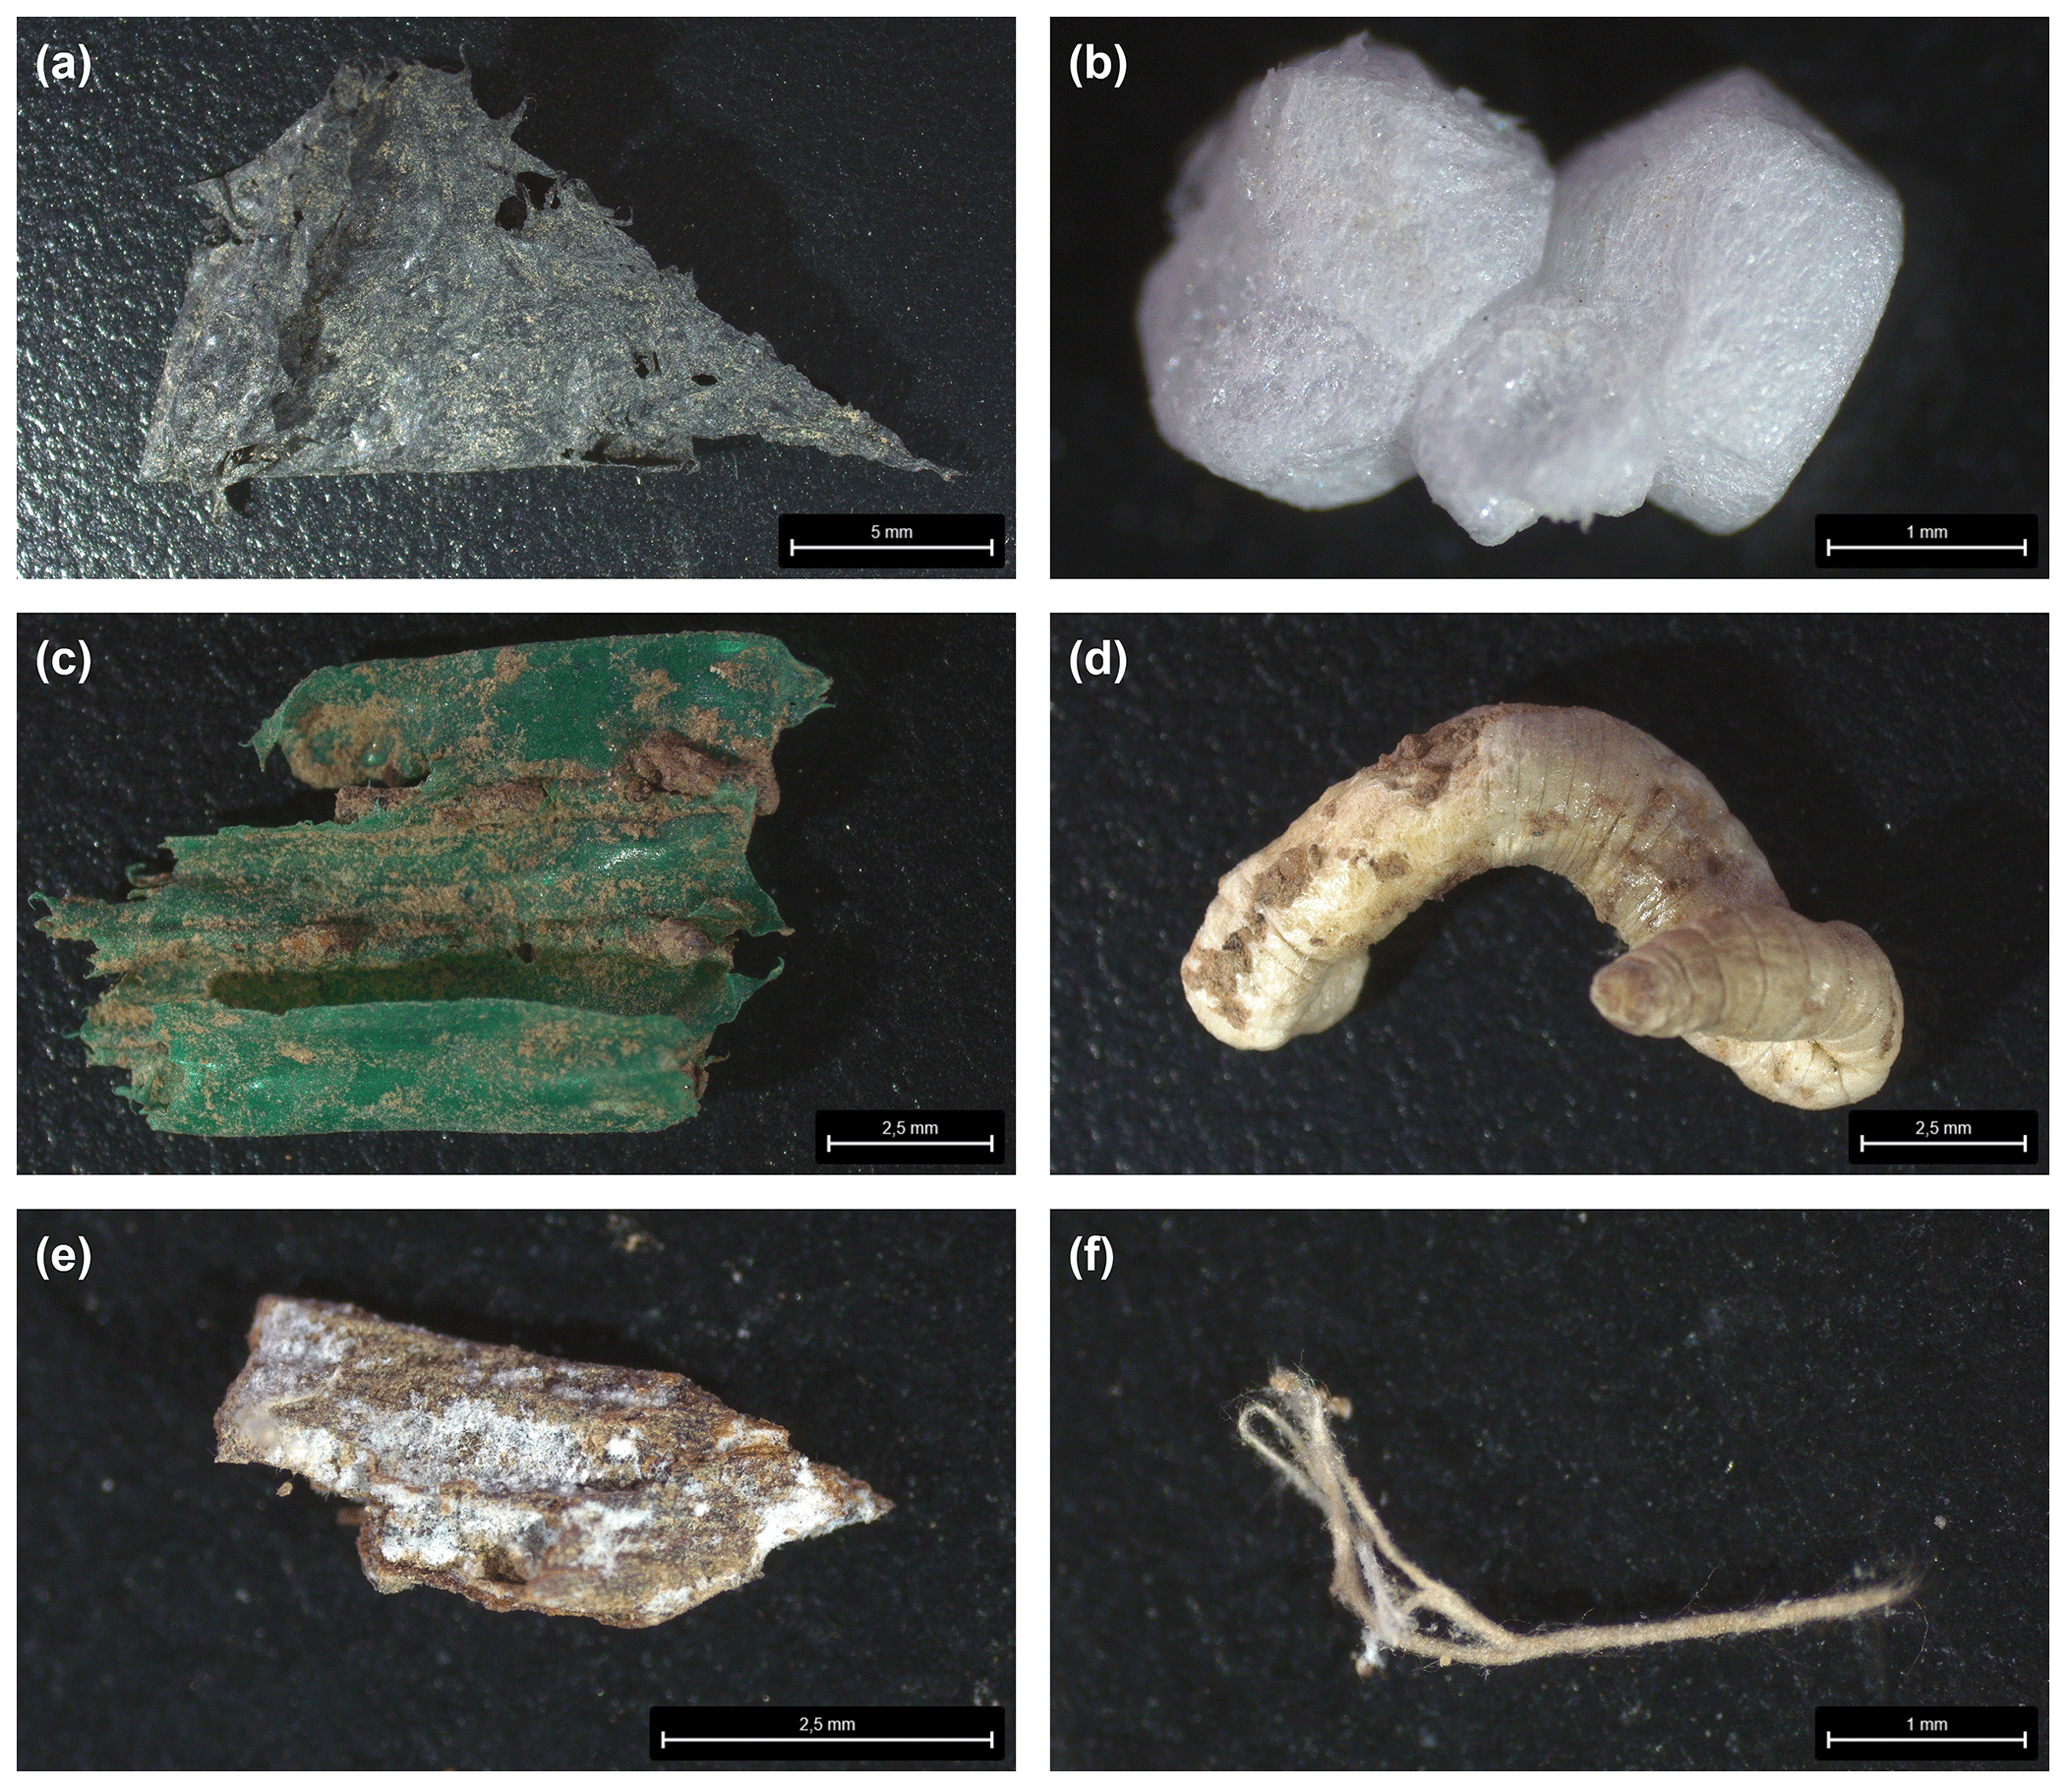
Figure 3(a) PE film and (b) PS fragment from the field center of site 5, (c) PE film and (d) chitin shell from the field center of site 6, and (e) resin or natural fragment and (f) cotton fiber from the field edge of site 7; see Fig. A4 for the respective FTIR spectra.
In this respect, it is important to note that the visual identification of suspect items largely depends on the operator's experience and may thus lead to excessive over- or underestimation of particle numbers (Thomas et al., 2020). Furthermore, counting suspect items > 2 mm in a 100 cm3 soil core is hardly representative. We thus refrained from extrapolating our findings to units of particles per kilogram and intended visual identification to serve as a qualitative complement to subsequent Py-GC/MS quantification. Interestingly though, the plastic debris > 2 mm was exclusively found at sites 5 and 6. None of the black and green PE or white PS fragments matched the applied white PE fleece and perforated foil in color or polymer type. This suggests an external source of plastic debris, for instance, from adjacent streets or other fields or residues from previous land use (Harms et al., 2021).
3.4 Py-GC/MS method performance
The pyrolysates chosen for PE, PP, and PS quantification were , 2,4Me9:1(1), and Sty, respectively, as they performed the best in terms of signal linearity (adj. R2>0.995), instrumental LODs (< 10 ng), and measurement repeatability (RSD < 10 %, Table 2). The n-alkadiene was preferred over the respective n-alkene or n-alkane because of its higher selectivity for PE (Steinmetz et al., 2020). LUFA 2.2 exerted a negligible matrix effect of 16 %, −3 %, and −2 % SSE on the selected PE, PP, and PS pyrolysates (see Fig. A5 for calibration curves). Method LODs were 0.7–1.2 mg kg−1 in RefeSol 06-A and 1.9–3.3 mg kg−1 in LUFA 2.2. The respective method LOQs ranged from 2.5 to 9.5 mg kg−1 (Table 3). A LUFA 2.2 soil containing each 40 mg kg−1 of potentially interfering, non-target PET, PMMA, PVC, and TWD did not induce significant false positive detections of PE, PP, or PS.
The extraction of 20 mg kg−1 plastic debris from LUFA 2.2 soil yielded recoveries of 86 %–105 % (Table 3). PE was recovered the best, whereas PS showed the lowest value. Recovering plastic debris at levels close to the method LOD (2 mg kg−1) and below the respective method LOQs led to an overestimation of recovered PE (133±9 %) and an underestimation of PP (70 %) and PS (50 %). Recoveries from RefeSol 06-A were generally lower: while we still recovered 50 % and 62 % of the 20 mg kg−1 PE and PP, respectively, recoveries dropped to 30±20 % at the lower spiking level. Hardly any PS was recovered from RefeSol 06-A (< 12 %), irrespective of the spiking level.
As recently reviewed by Thomas et al. (2020), several studies have already evaluated their extraction procedures for various plastic debris from solid matrices using organic solvents like dichloromethane (DCM) or tetrahydrofuran (THF). In combination with quantitative Py-GC/MS, however, matrix interferences and false positive detections from organic matrix constituents or other non-target polymers should be closely monitored (Dierkes et al., 2019; Steinmetz et al., 2020). By combining density separation and solvent extraction with xylene/TCB, we obtained method LODs from blank LUFA 2.2 and RefeSol 06-A and interferences from non-target polymers equivalent < 3.3 mg kg−1 PE, PP, and PS, which highlights the selectivity of our method. Dispersing soil aggregates with sodium hexametaphosphate prior to density separation further enabled the quantification of plastic debris potentially occluded in or masked by soil aggregates. The required filtration step, however, systematically excluded particles < 4 µm that were not retained by the applied filter.
Inconsistent recoveries at a spiking level below the method LOQs of 2.5–9.5 mg kg−1 challenged the sensitivity and robustness of our solvent-based approach. This particularly applied to the < 30 % PE, PP, and PS we recovered from RefeSol 06-A. While this clearly defines the quantitative limits of the method, our working range is still 10–100 times lower than that of previous applications involving solvent-based Py-GC/MS. Dierkes et al. (2019) and Okoffo et al. (2020), for instance, spiked 1 g of quartz sand and biosolids at 0.05–50 g kg−1 of various polymers to evaluate their accelerated solvent extraction with THF and DCM, respectively. Irrespective of the spiking level though, our PS recoveries from the clayey RefeSol 06-A were particularly low (< 12 %). This is in line with Wang et al. (2018), who found comparable recoveries after density separation of nano-sized PS from a silt soil. Luo et al. (2020) and Wu et al. (2020) reasoned that SOM as well as iron and aluminum oxides effectively retain PS particles in soil. The dramatic decrease in PS recovery may be attributed to interactions forming between the delocalized π electrons of the aromatic PS ring and SOM, iron and aluminum oxides, or cations bound to the negatively charged surface of clay particles (Newcomb et al., 2017). During the density separation, the aggregated PS may have been preferentially sedimented and thereby systematically excluded from subsequent solvent extraction. The addition of an anionic surfactant like sodium dodecyl sulfate or nonionic polysorbates during soil aggregate dispersion and density separation could counteract this but potentially at the expense of introducing another source of PE contamination from the surfactants' n-alkane domains.
Table 2Instrumental validity criteria.
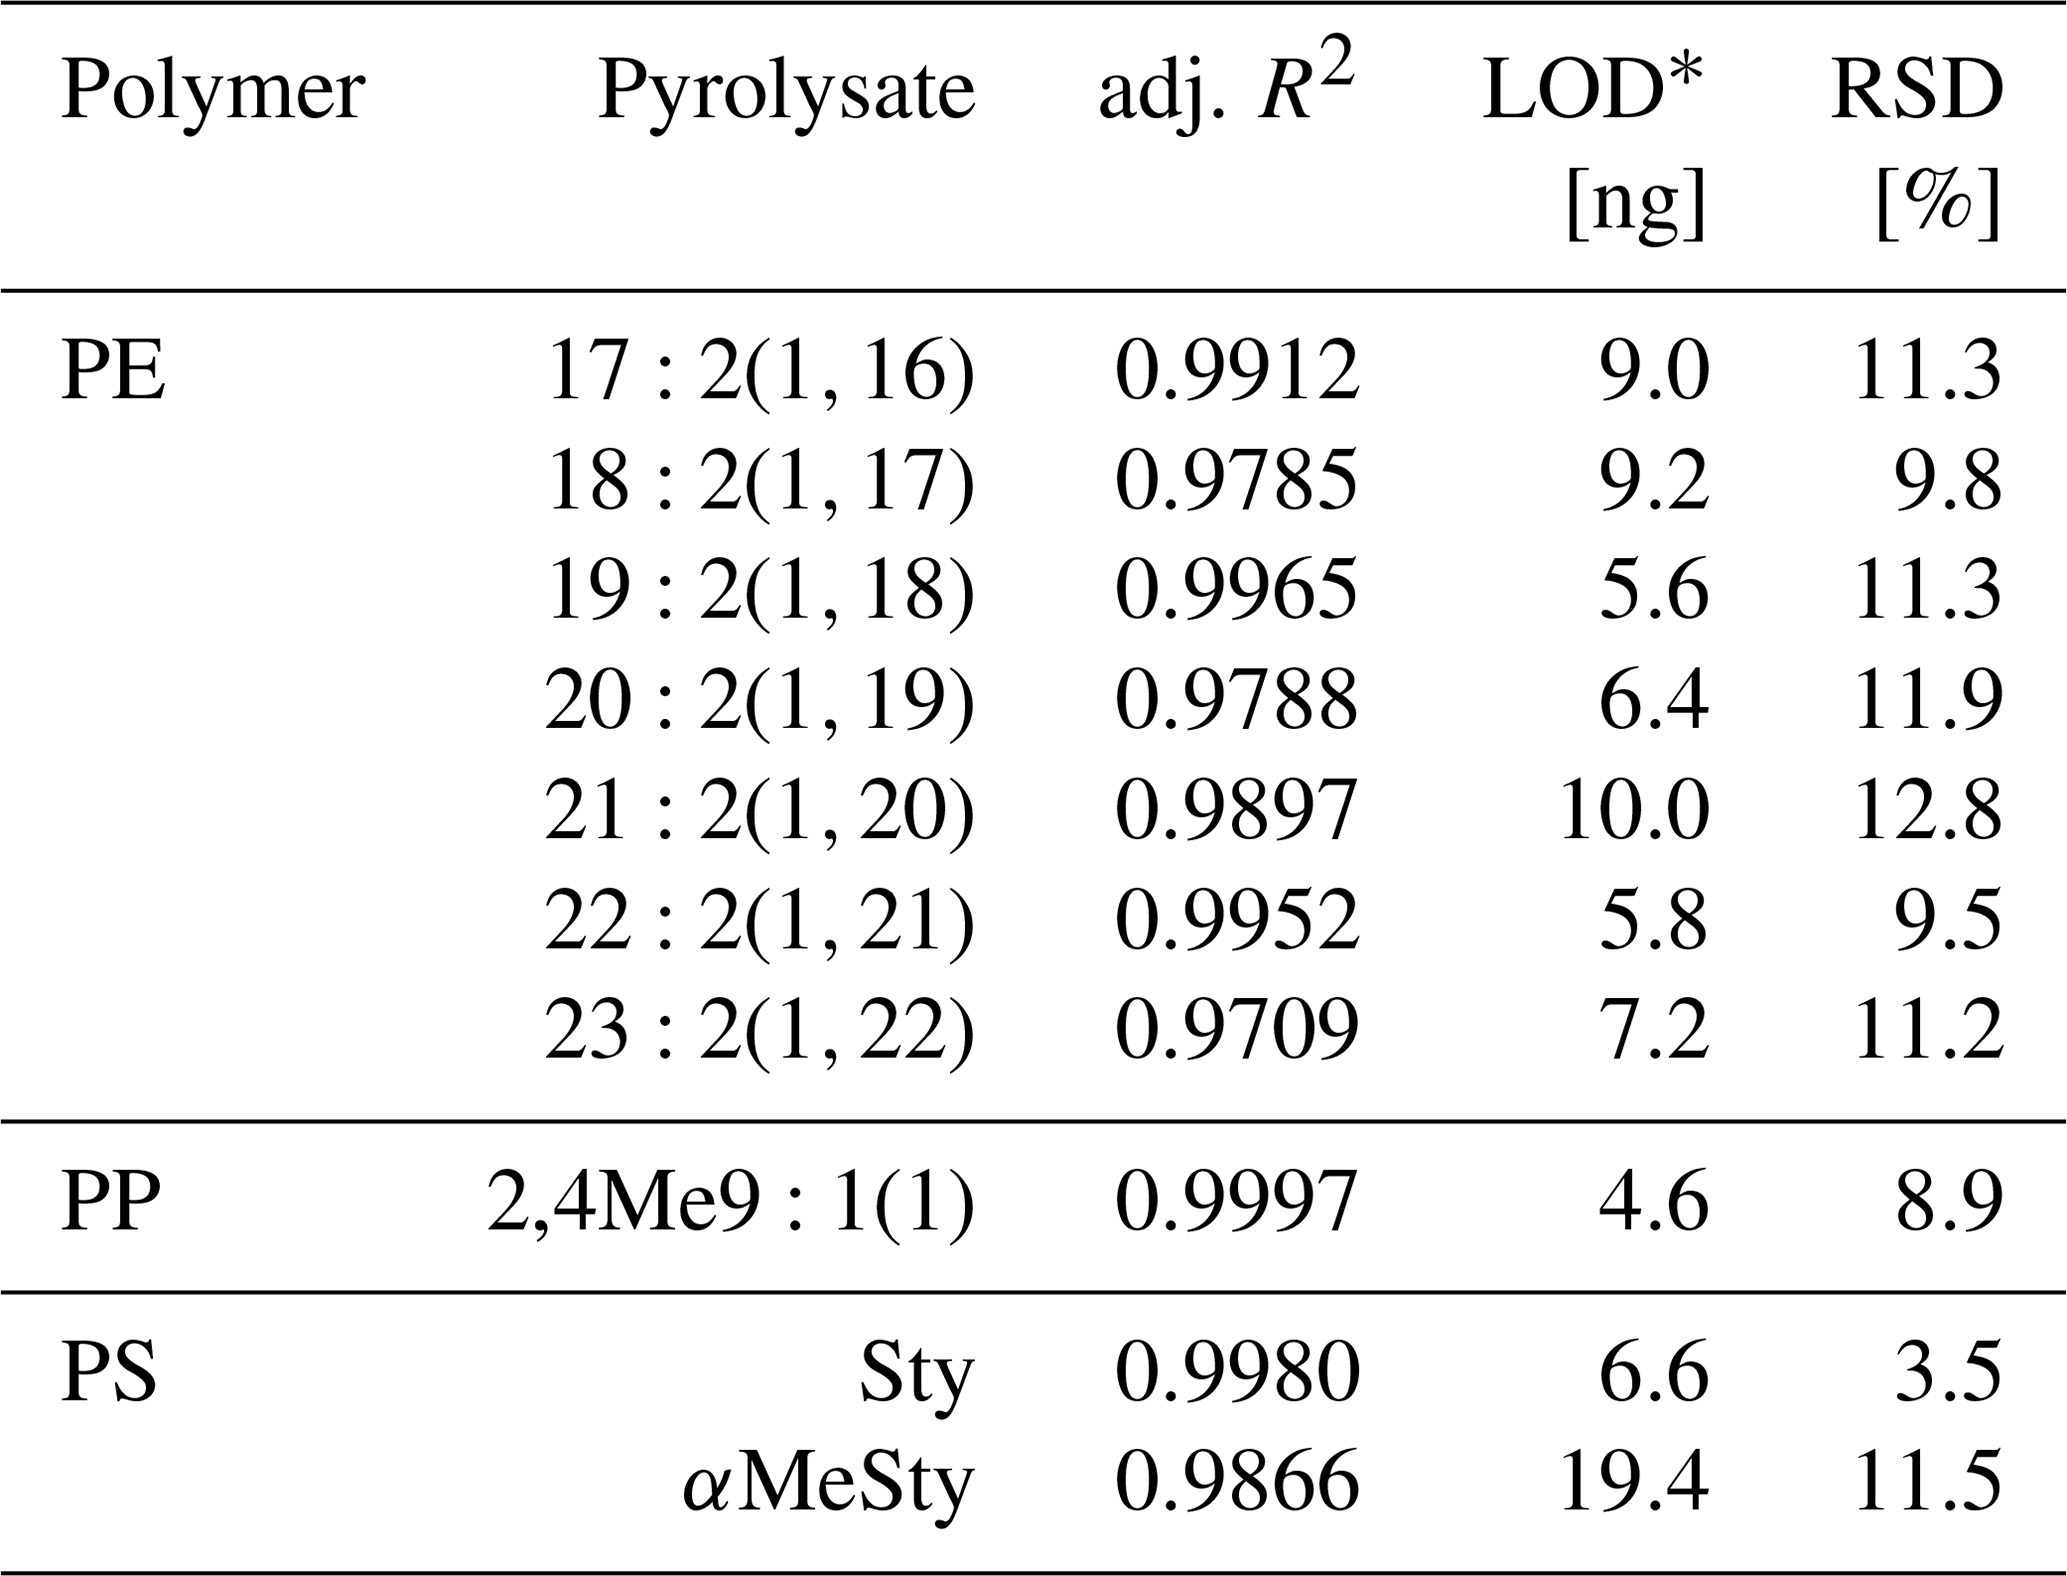
* Instrumental limit of detection. RSD is the relative standard deviation.
Table 3Validation criteria for the extraction method.
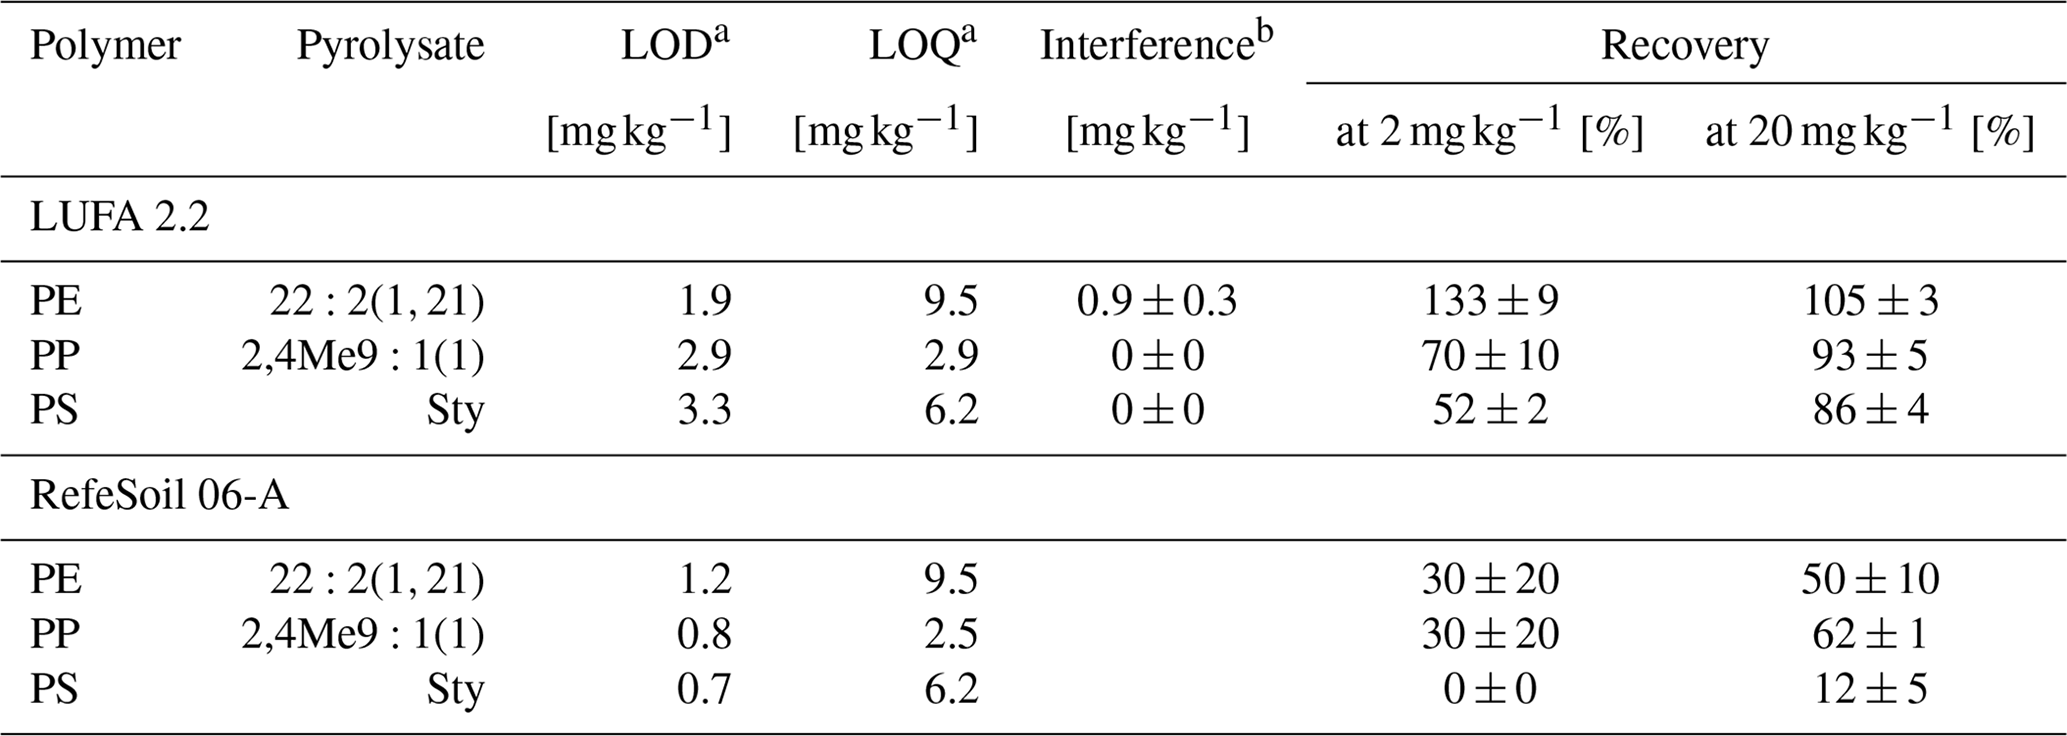
a Method limits of detection and quantification. b Introduced from 40 mg kg−1 non-target polymers.
Based on the two reference soils tested and on previous work (Steinmetz et al., 2020), we considered our method sufficiently sensitive and quantitative for environmentally relevant PE and PP levels exceeding the respective method LOQs. The 50 % PE and 62 % PP we recovered from RefeSol 06-A suggest a rather semi-quantitative evaluation of soils with a clay content > 47 % and a Corg content > 2.5 %. PS is evaluated qualitatively for its low recoveries. These findings once more highlight the importance of specifically testing and evaluating analytical methods for plastic analysis with various soil types (Thomas et al., 2020). The extrapolation of specific validity criteria to field samples with a different texture and Corg composition thus remains difficult and requires careful interpretation.
3.5 PE, PP, and PS debris in soil
We detected plastic debris ≤ 2 mm exceeding the average method LOD (1.5–2.0 mg kg−1) in 15 out of 240 samples from six sites (Fig. 4). This is equivalent to 6 % positive detections. Soil from sites 1, 7, and 8 contained the most PE (10 findings), with single detections peaking at 19 and 35 mg kg−1. Mean PE contents were the highest at the field margin of site 1 (10 ± 10 mg kg−1) and decreased below the method LOD in the field edge and the field periphery. Furthermore, PE contents were slightly higher in the track rows (furrows) than in the plant rows (ridges) of the field centers and edges of site 1. With 4–7 mg kg−1, sites 7 and 8 showed maximum PE contents in the field periphery. Field centers, edges, and margins contained less than 2 mg kg−1 PE. On these sites, differences in the PE contents between field track and plant rows were mostly indistinct. Sites 2–6 did not contain any PE above the method LOD. The PP findings were driven by single observations of 5–10 mg kg−1 in the field centers of sites 2, 4, and 7. PS was identified twice, namely in the periphery of sites 4 and 5. Due to the poor PS recoveries, these findings are most likely underestimated.
Interestingly, elevated PE contents occurred mostly at sites 1, 7, and 8, which were covered with 40 µm thick perforated foils. Sites 4–6, covered with thicker mulch films or perforated foils (50 µm), did not show any significant PE contamination. On the one hand, this is remarkable because the agricultural films were on-site for 4 months only. On the other hand, the elevated plastic contents may have originated from another, potentially diffuse input source prior to plastic coverage.
Our results are still in line with Zhang et al. (2016), who attributed elevated plastic emissions to the use of particularly thin agricultural films. In China, for instance, common film thicknesses are 6–10 µm, while EU regulations stipulate agricultural covers thicker than 20 µm (EN 13655, 2018). This may also explain why studies conducted in non-EU countries often report extraordinarily high plastic levels in soil (Liu et al., 2014), particularly after long-term use of agricultural plastics (Huang et al., 2020; Zhang and Liu, 2018).
Regardless of the film thickness, the increased PE contents at the field margin of site 1 suggested that the mechanical stress of weighing the plastic covers down with soil or digging them in favored the local formation of plastic debris. The close contact with soil and exposure to sunlight may have accelerated polymer aging and embrittlement as indicated by our complementary DSC and FTIR–ATR measurements. Due to the limited number of PE detections above the method LOD, we did not find a clear indication for the further translocation of plastic debris from the ridged plant rows to lower ground furrows. Tracing experiments by Laermanns et al. (2021), however, recently confirmed that the micro- and macrorelief of the soil surface may indeed favor the water erosion of plastic debris on a meter scale. Even at larger scales though, it remained unresolved as to what extent the PE debris in the field periphery (mainly sites 7 and 8) originated from the covered field centers or whether it came from an external source via wind drift. Due to ubiquity of products made from PE, such an external source cannot be excluded.
Although sites 1 and 2 were both covered with PP fleece, only site 2 showed elevated PP contents. At the same time, PP was found at sites covered exclusively with PE for the last 4 months. Therefore, no clear association between PP detections and the seasonal use of plastic covers was established. This is striking because the fibrous structure of the PP fleece, together with the initial signs of aging detected via DSC and FTIR–ATR, made emissions of plastic debris particularly likely. Unexpectedly, these two study sites were thus most likely dominated by external sources like littering or previous land use rather than receiving plastic debris from the in situ fragmentation of fleeces.
This similarly applied to PS, which is not used for agricultural plastic covers (Bertling et al., 2021) and may thus serve as an indicator for external sources of plastic debris in soil. Another possible explanation for the PS findings at the two neighboring sites 4 and 5 may be a legacy contamination with PS. In the past, beads made from expanded PS were used for the conditioning and stabilization of horticultural soils (Maghchiche et al., 2010). However, it remained unresolved whether this was the case in the agricultural area investigated in this study.
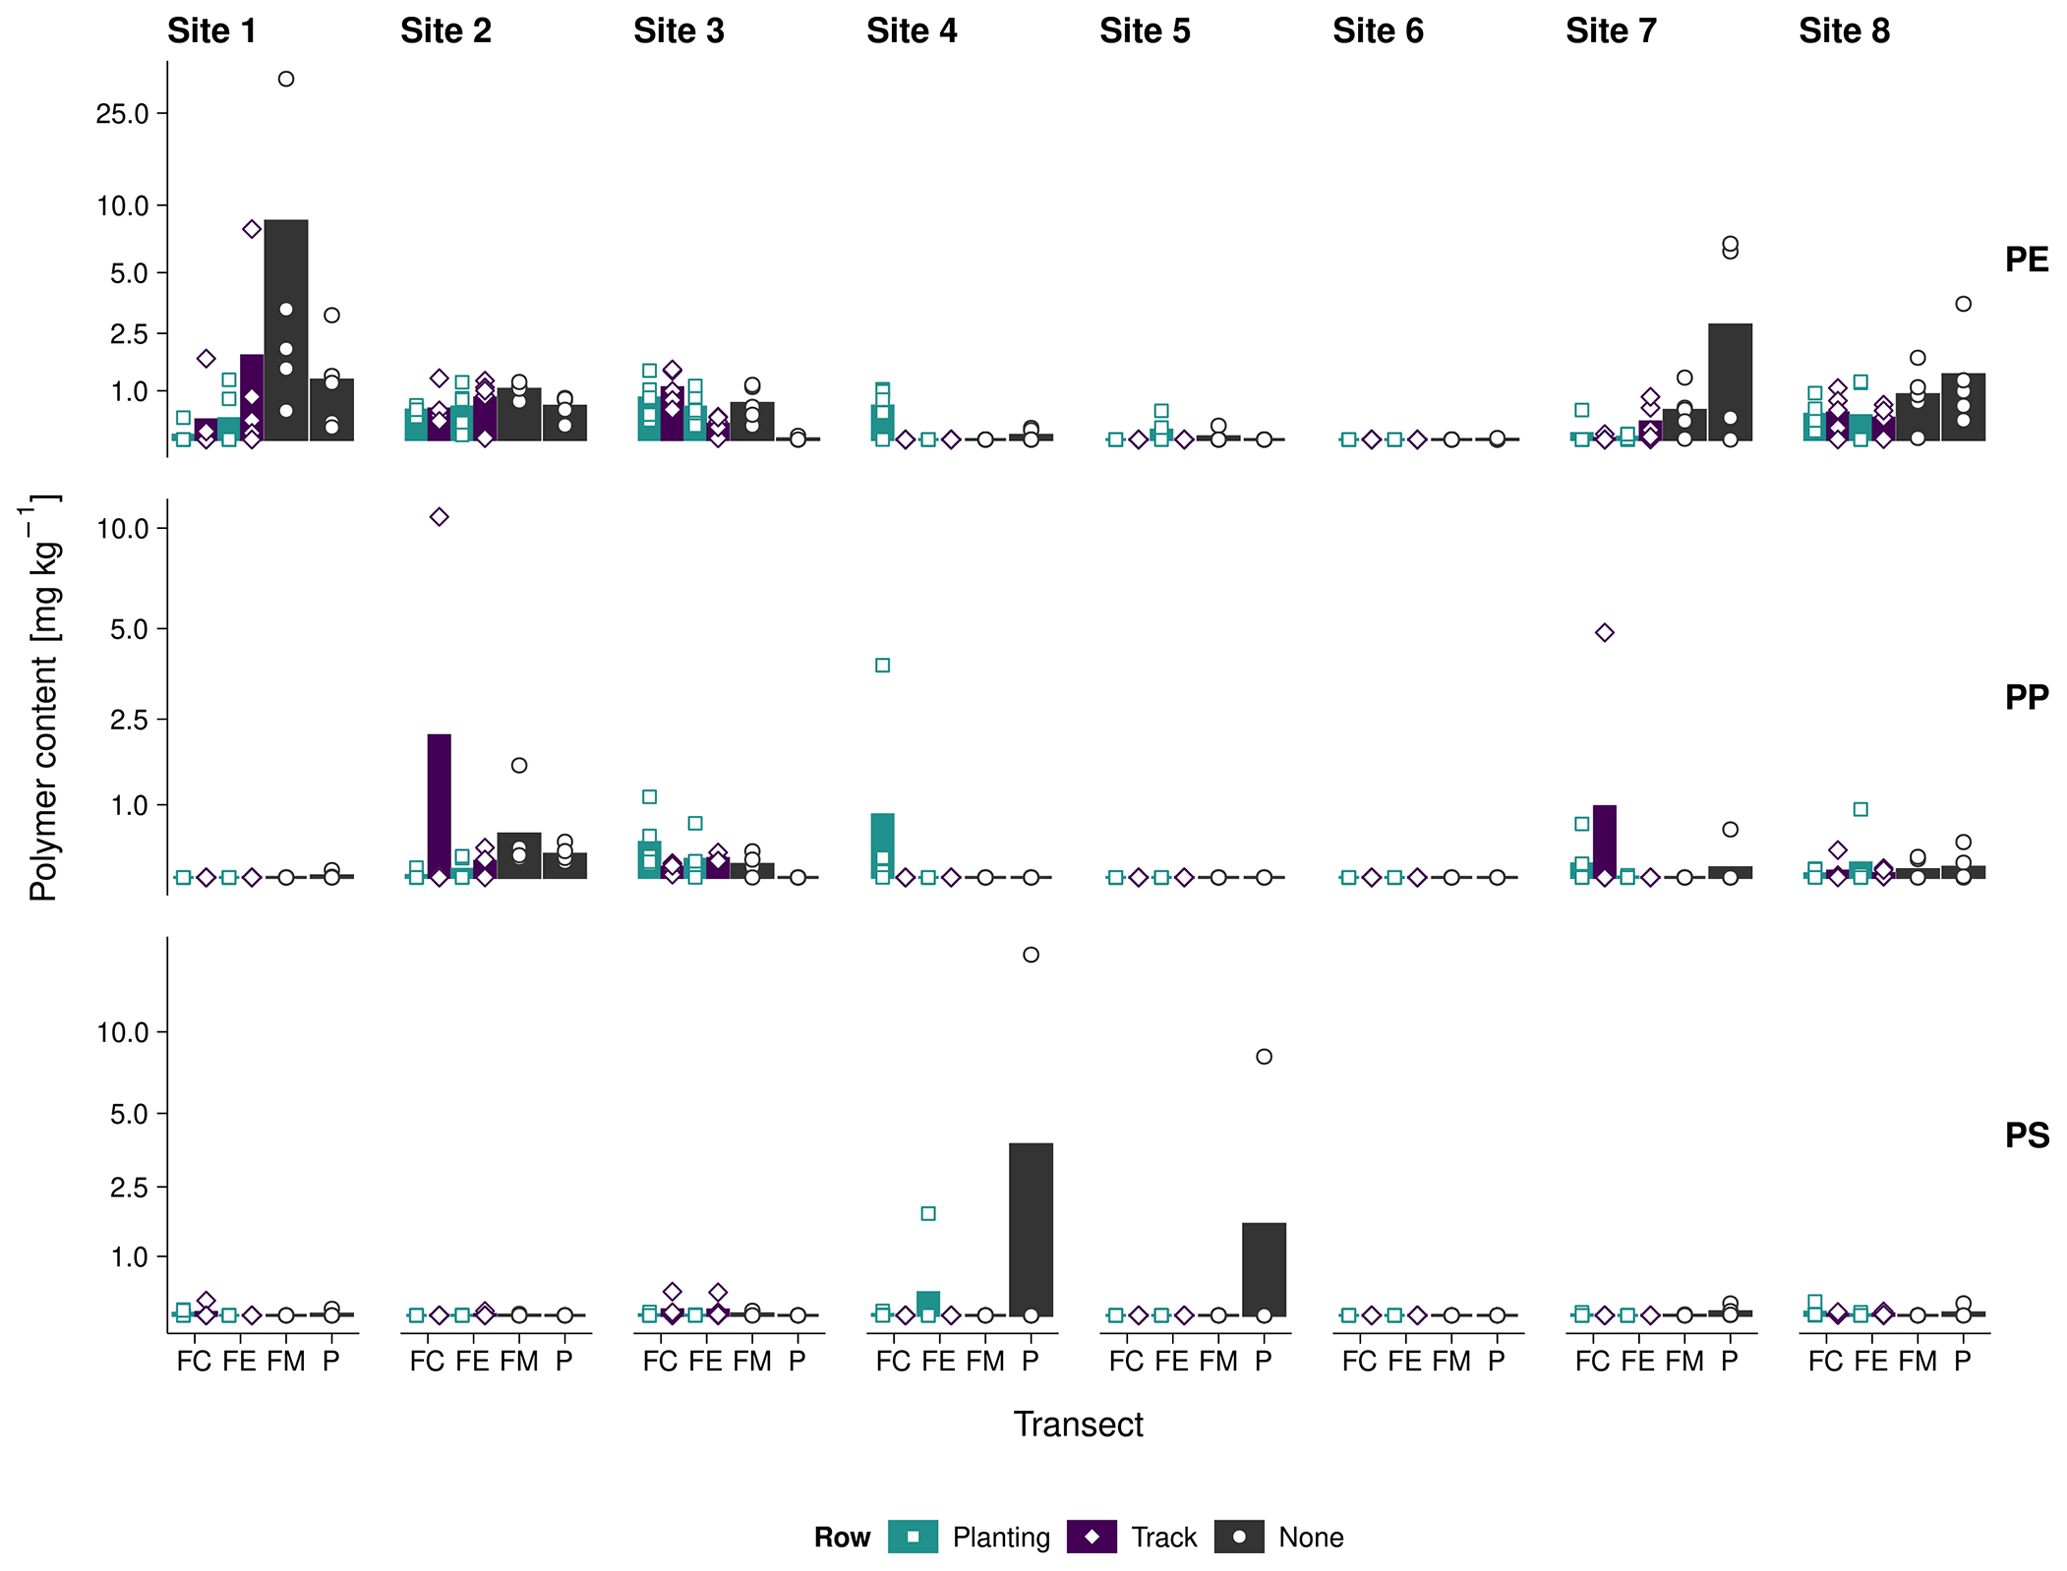
Figure 4Log-scaled PE, PP, and PS contents (≤ 2 mm) at the field center (FC), field edge (FE), field margin (FM), and periphery (P) of sites 1–8; dots represent single measurements, and the underlying bar plot shows the transect average.
Given that our investigated soils had a clay content of 15 %–36 %, the obtained PE, PP, and PS contents were potentially underestimated by a factor of 1.5–2. Even though this uncertainty was taken into account, the plastic contents detected in our study were still up to 100 times lower than the 820 mg kg−1 PE, 40 mg kg−1 PP, and 56 mg kg−1 PS that Dierkes et al. (2019) obtained from a non-characterized roadside soil using a comparable solvent-based Py-GC/MS method. A recent modeling study by Brandes et al. (2021) estimated that plastic debris emitted from agricultural plastic covers may increase the plastic contents in agricultural soil by 5–9 mg kg−1 yr−1. By contrast, conversions from particle counts and shapes to plastic masses resulted in contents of 0.1–1.2 mg kg−1 in agricultural soil covered with plastics (Büks and Kaupenjohann, 2020). However, such conversions are increasingly discouraged for their high estimate errors (Thomas et al., 2020; Primpke et al., 2020). All this challenges comparisons since studies investigating plastic debris in agricultural soil have so far exclusively used particle-based microspectroscopic techniques. Nonetheless, our results are approximately in the same order of magnitude as previous findings but should be further corroborated.
The combination of soil aggregate dispersion and density separation with solvent-based Py-GC/MS enabled the simple, yet selective quantification of PE and PP debris in agricultural soil. Analyzing a sample amount of 50 g better accounted for the heterogeneous distribution of discrete plastic particles in the soil matrix. The additional dispersion step further made plastic debris occluded in soil aggregates amenable to quantification. By contrast, poor PS recoveries potentially induced by that additional separation step challenged a reliable PS quantification.
We applied the new method to soil randomly sampled from four predefined transects located in and around eight agricultural fields covered with plastic films. This screening approach revealed first insights into the potential contribution of agricultural plastic covers to plastic pollution in soil: while PP fleeces and 50 µm thick PE films were not shown to emit plastic debris into their surrounding during their use, 4 months of covering with thinner perforated PE foils (40 µm thickness) was associated with elevated PE contents in and around the covered fields. Due to the ubiquitous use of plastic covers and potentially interfering external plastic sources, a causal relationship between the use of plastic covers and elevated plastic levels in soil still needs to be shown, for instance, by conducting more controlled and systematic experiments.
The maximum plastic levels were 35 mg kg−1 and with that about 30 times higher than those previously reported for covered agricultural soil (Büks and Kaupenjohann, 2020) but several orders of magnitude lower than in a roadside soil (Dierkes et al., 2019). This could mean that current EU regulations (EN 13655, 2018) and recycling efforts for agricultural plastics are starting to take effect but should be further intensified. The long-term use of thin perforated foils, in particular, is likely to contribute to the accumulation and further distribution of plastics in the environment. The use of thicker and more durable plastic covers may be preferred to prevent this.
To scrutinize this, future research should aim for the continuous monitoring of plastic contents in soil. This may also include samplings of deeper soil and more sensitive screenings of polymer-associated compounds, including additives and agrochemicals sorbed to the plastic covers. Advancing the field of mass spectrometric methods for the quantification of plastic debris in heterogeneous matrices will help to bridge the gap between modeling and monitoring, further the science-based regulation of agricultural plastic products, and contribute to their sustainable use.
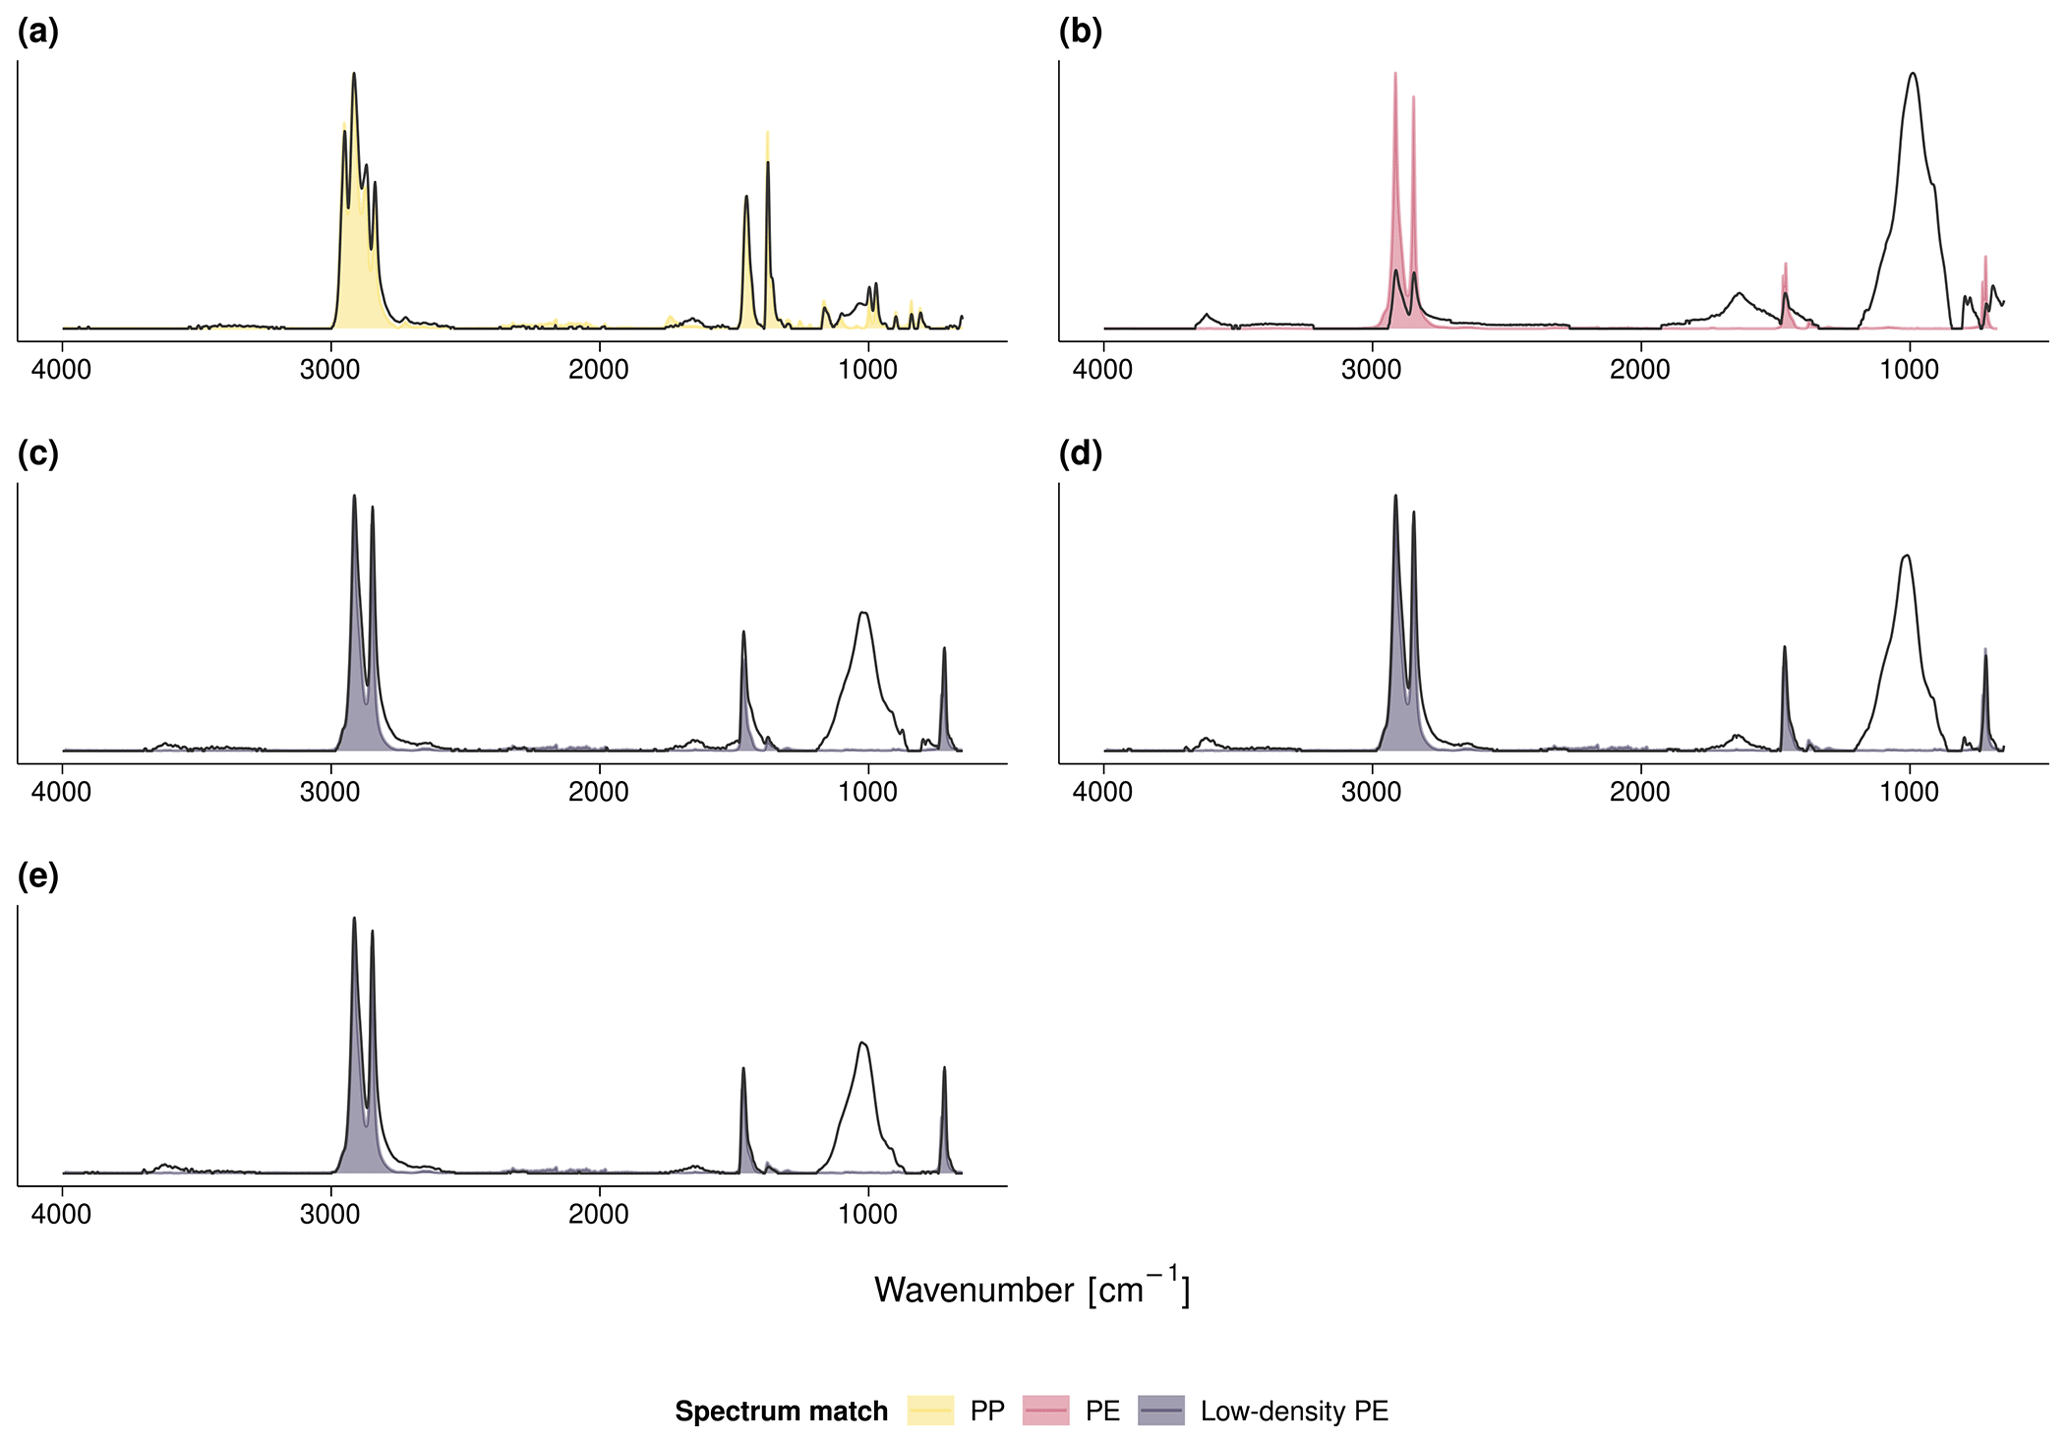
Figure A1Exemplary FTIR spectra of (a) the PP fleece from site 1, (b) the PE mulch from sites 2 and 3, (c) the PE fleece and (d) PE perforated foil from sites 4 and 5, and (e) the PE perforated foil from site 8. The measured FTIR spectra are in gray; the colored shades depict the respective Open Specy library match.
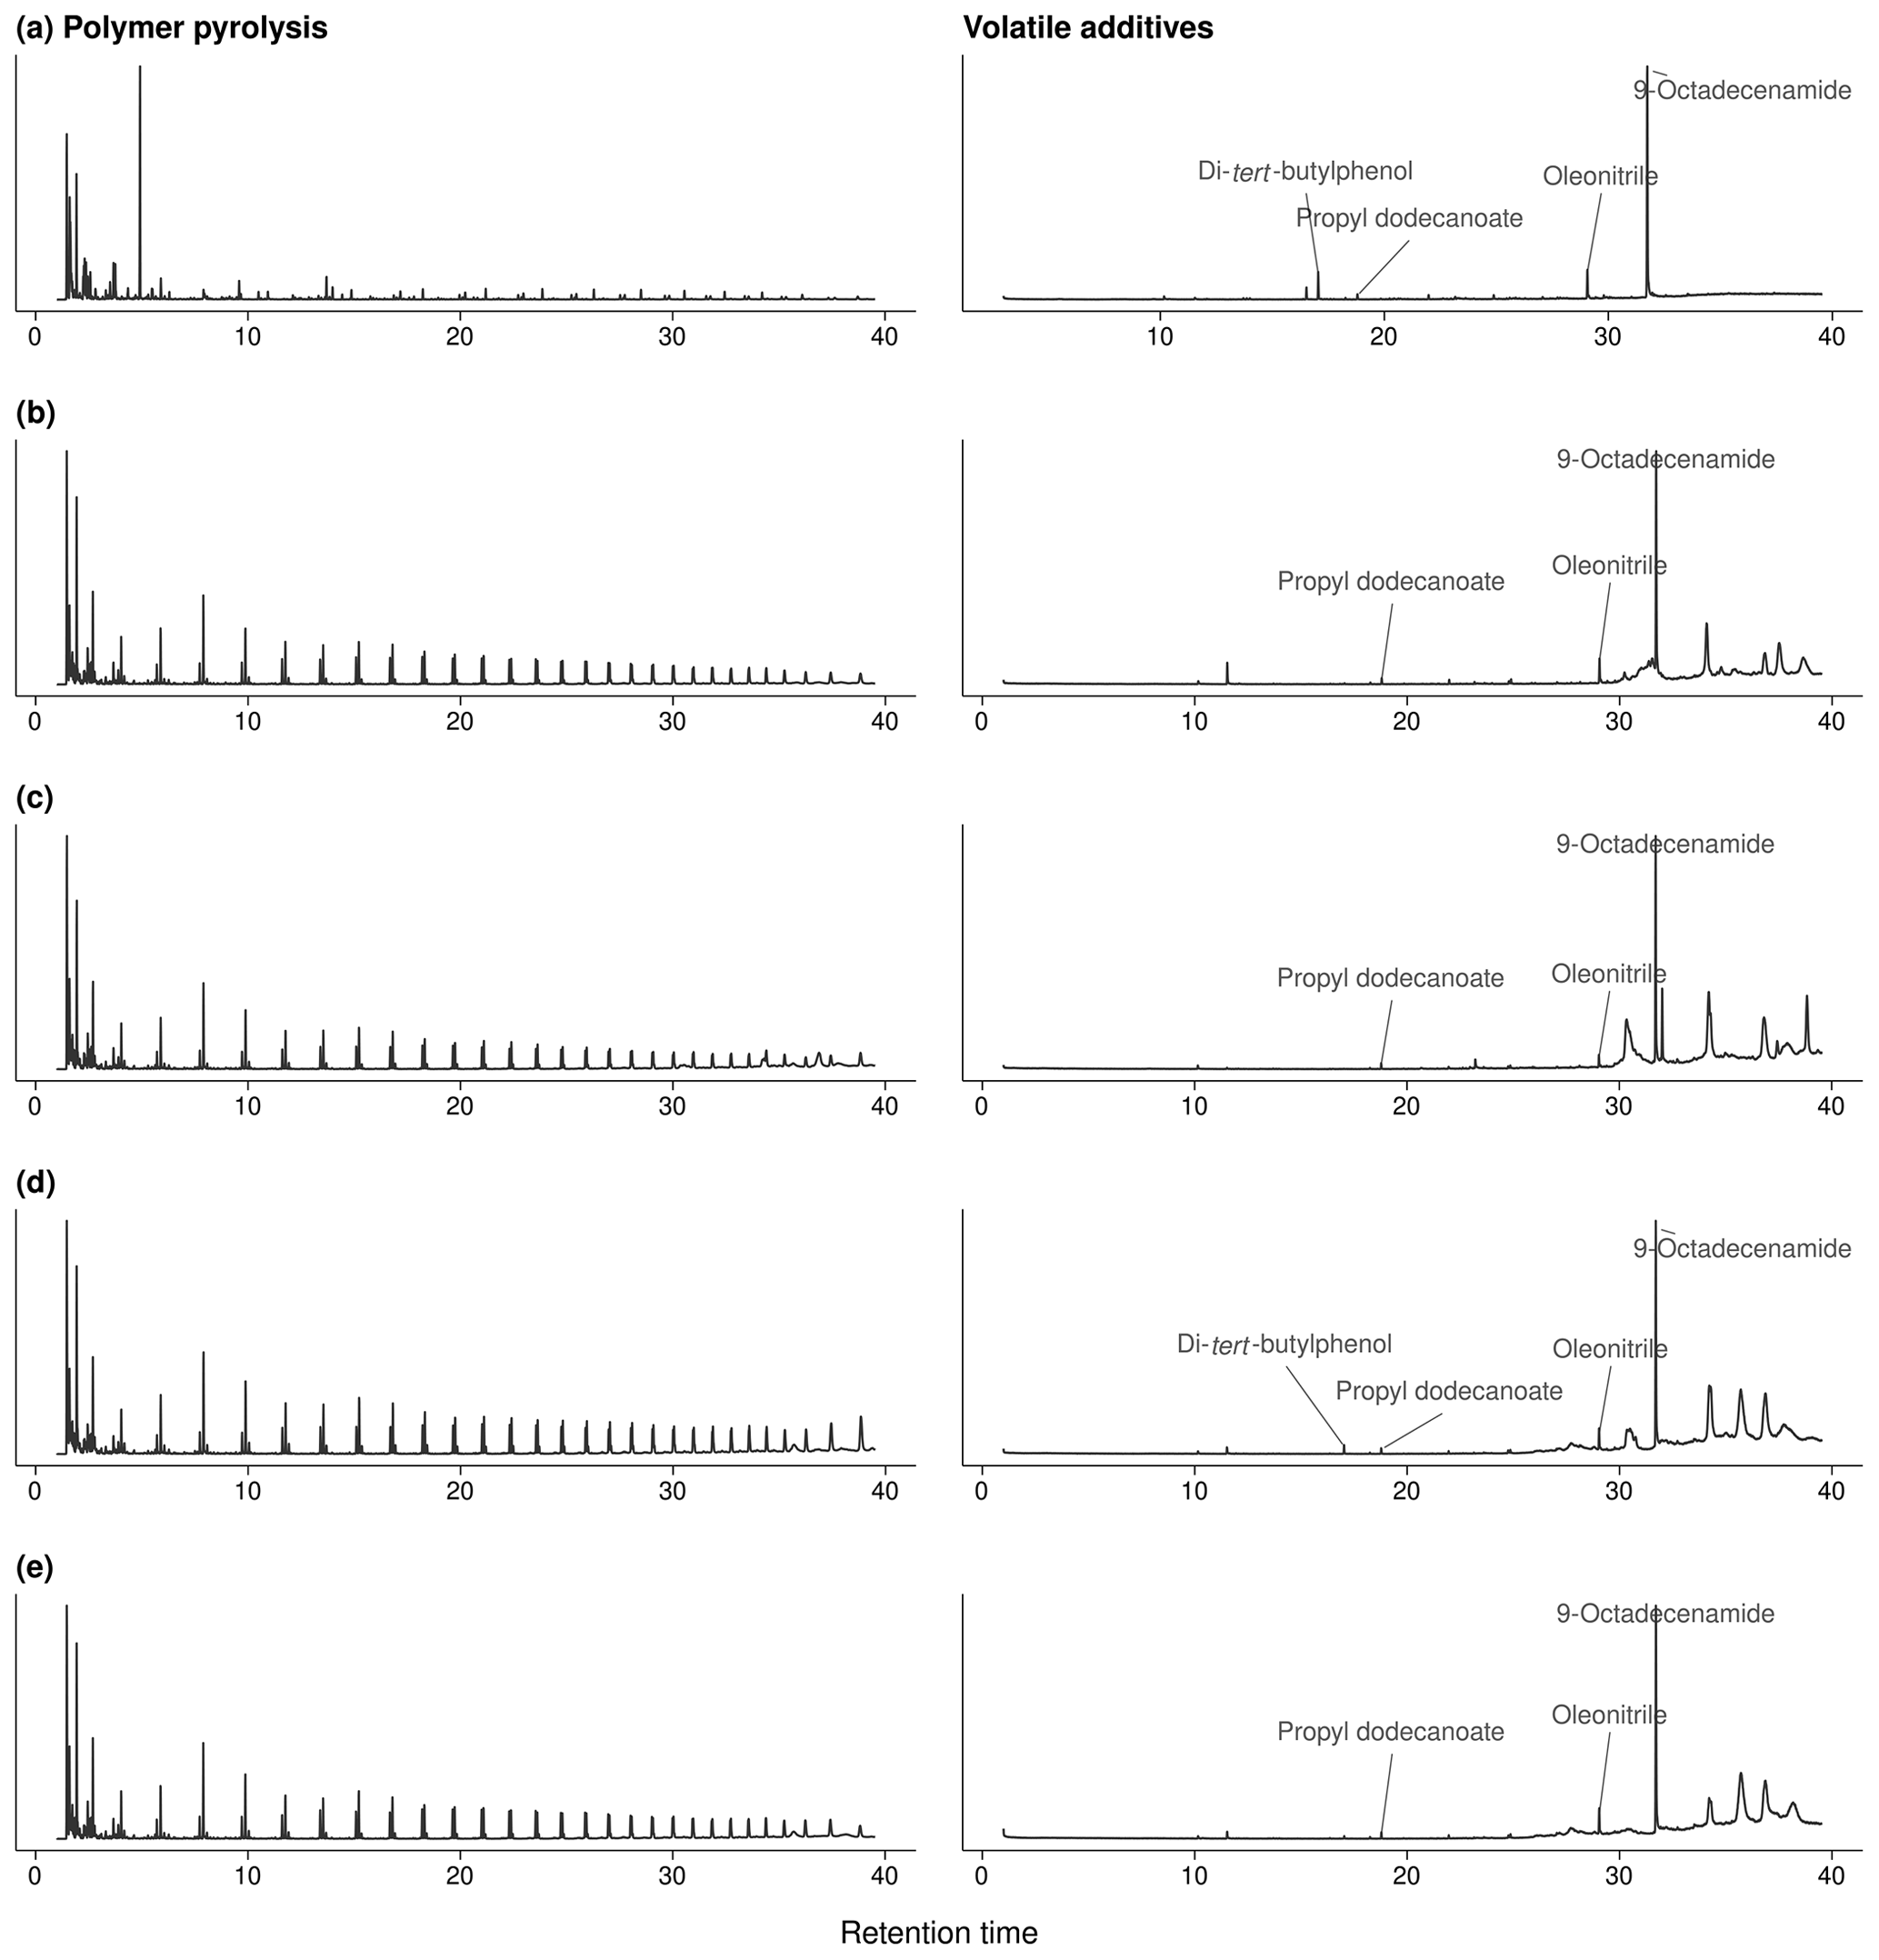
Figure A2Exemplary chromatograms of polymer pyrolyses (750 ∘C, left) and thermal desorption (300 ∘C, right) of polymer additives: (a) PP fleece from site 1, (b) PE mulch from sites 2 and 3, (c) PE fleece and (d) PE perforated foil from sites 4 and 5, and (e) PE perforated foil from site 8; see Fig. A3 for mass spectra.
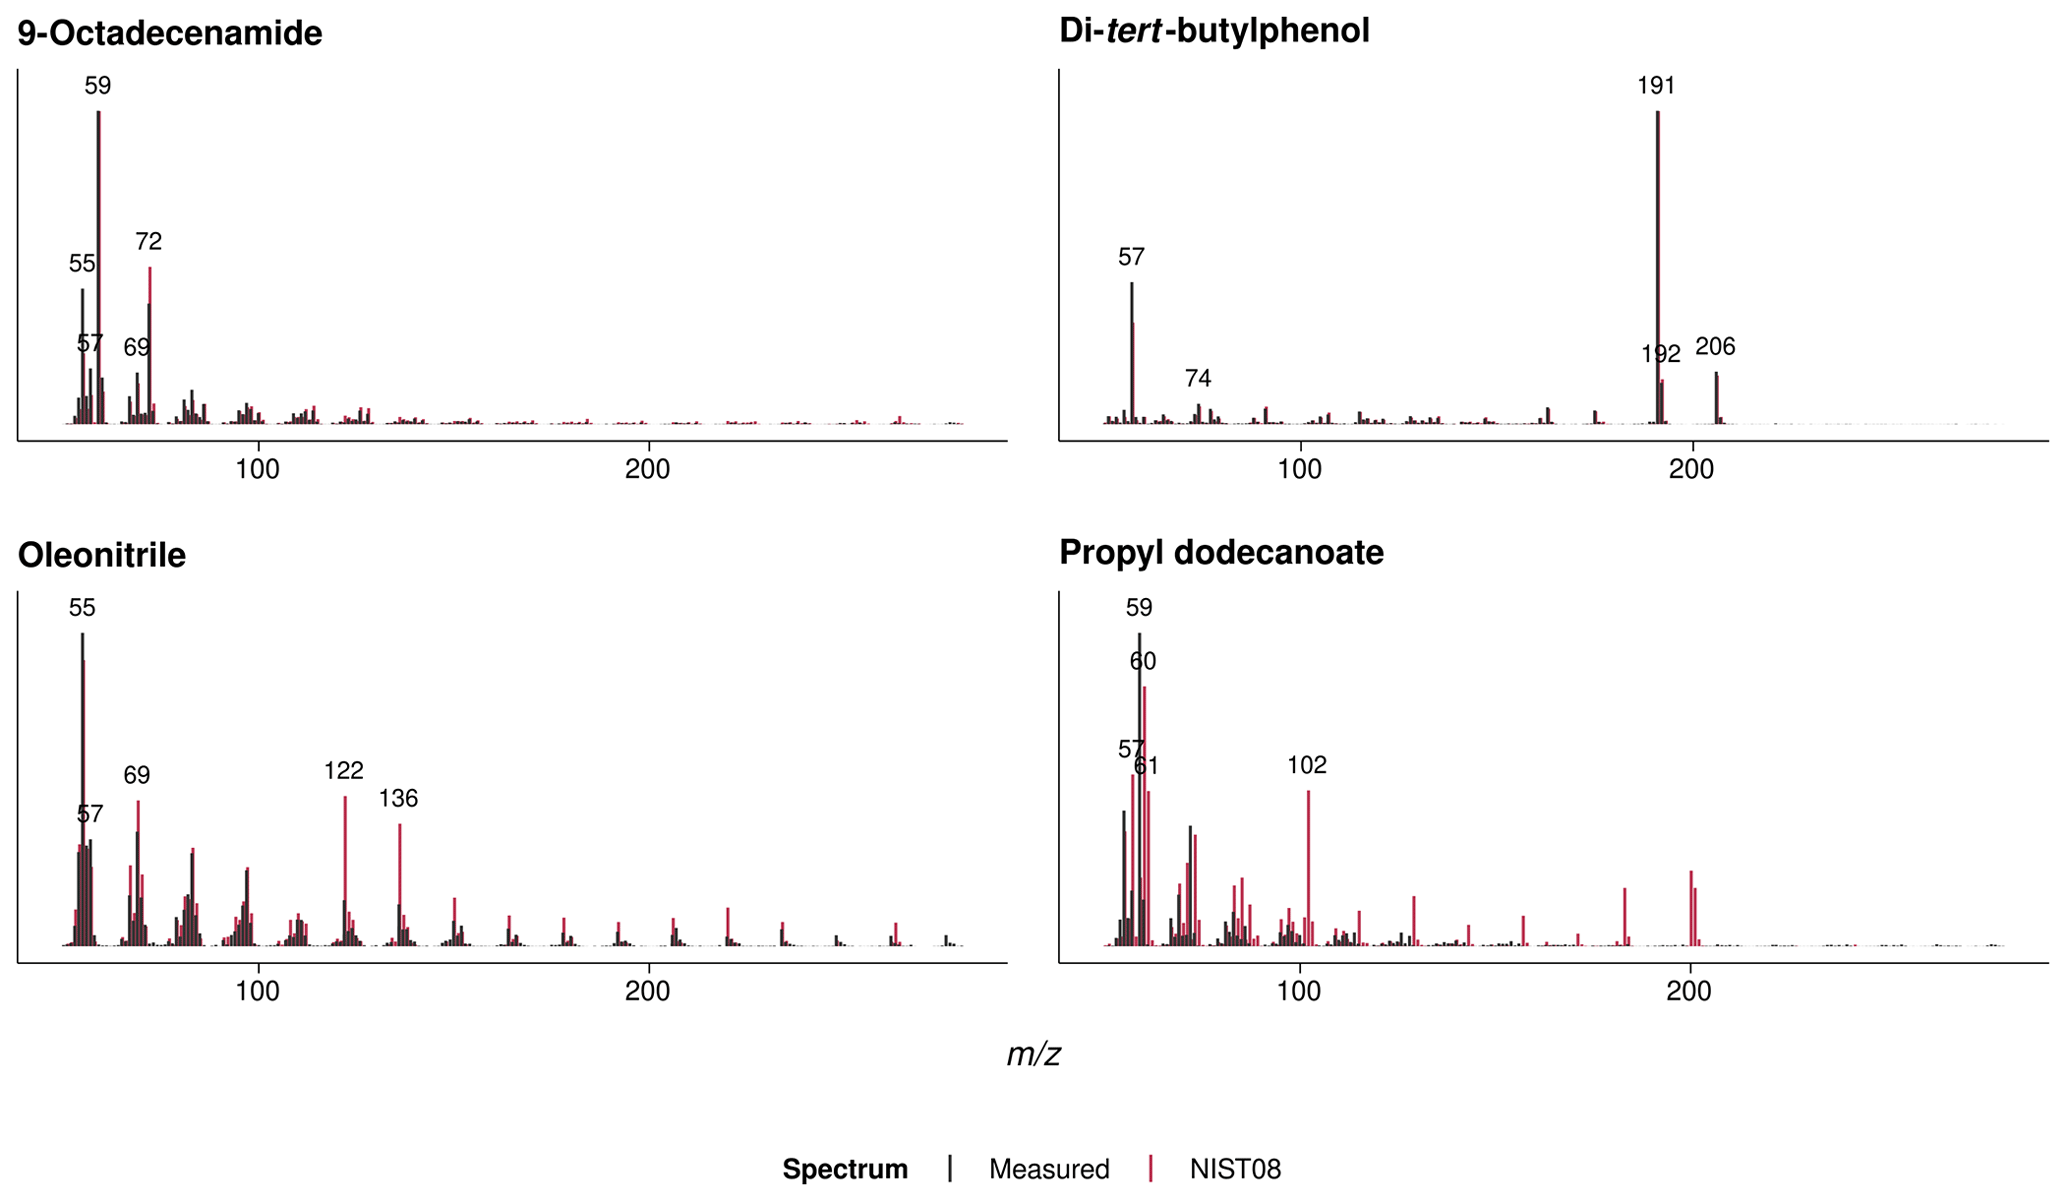
Figure A3Mass spectra and NIST08 library matches of the identified polymer additives that thermally desorbed from the agricultural films; see Fig. A2 for chromatograms.
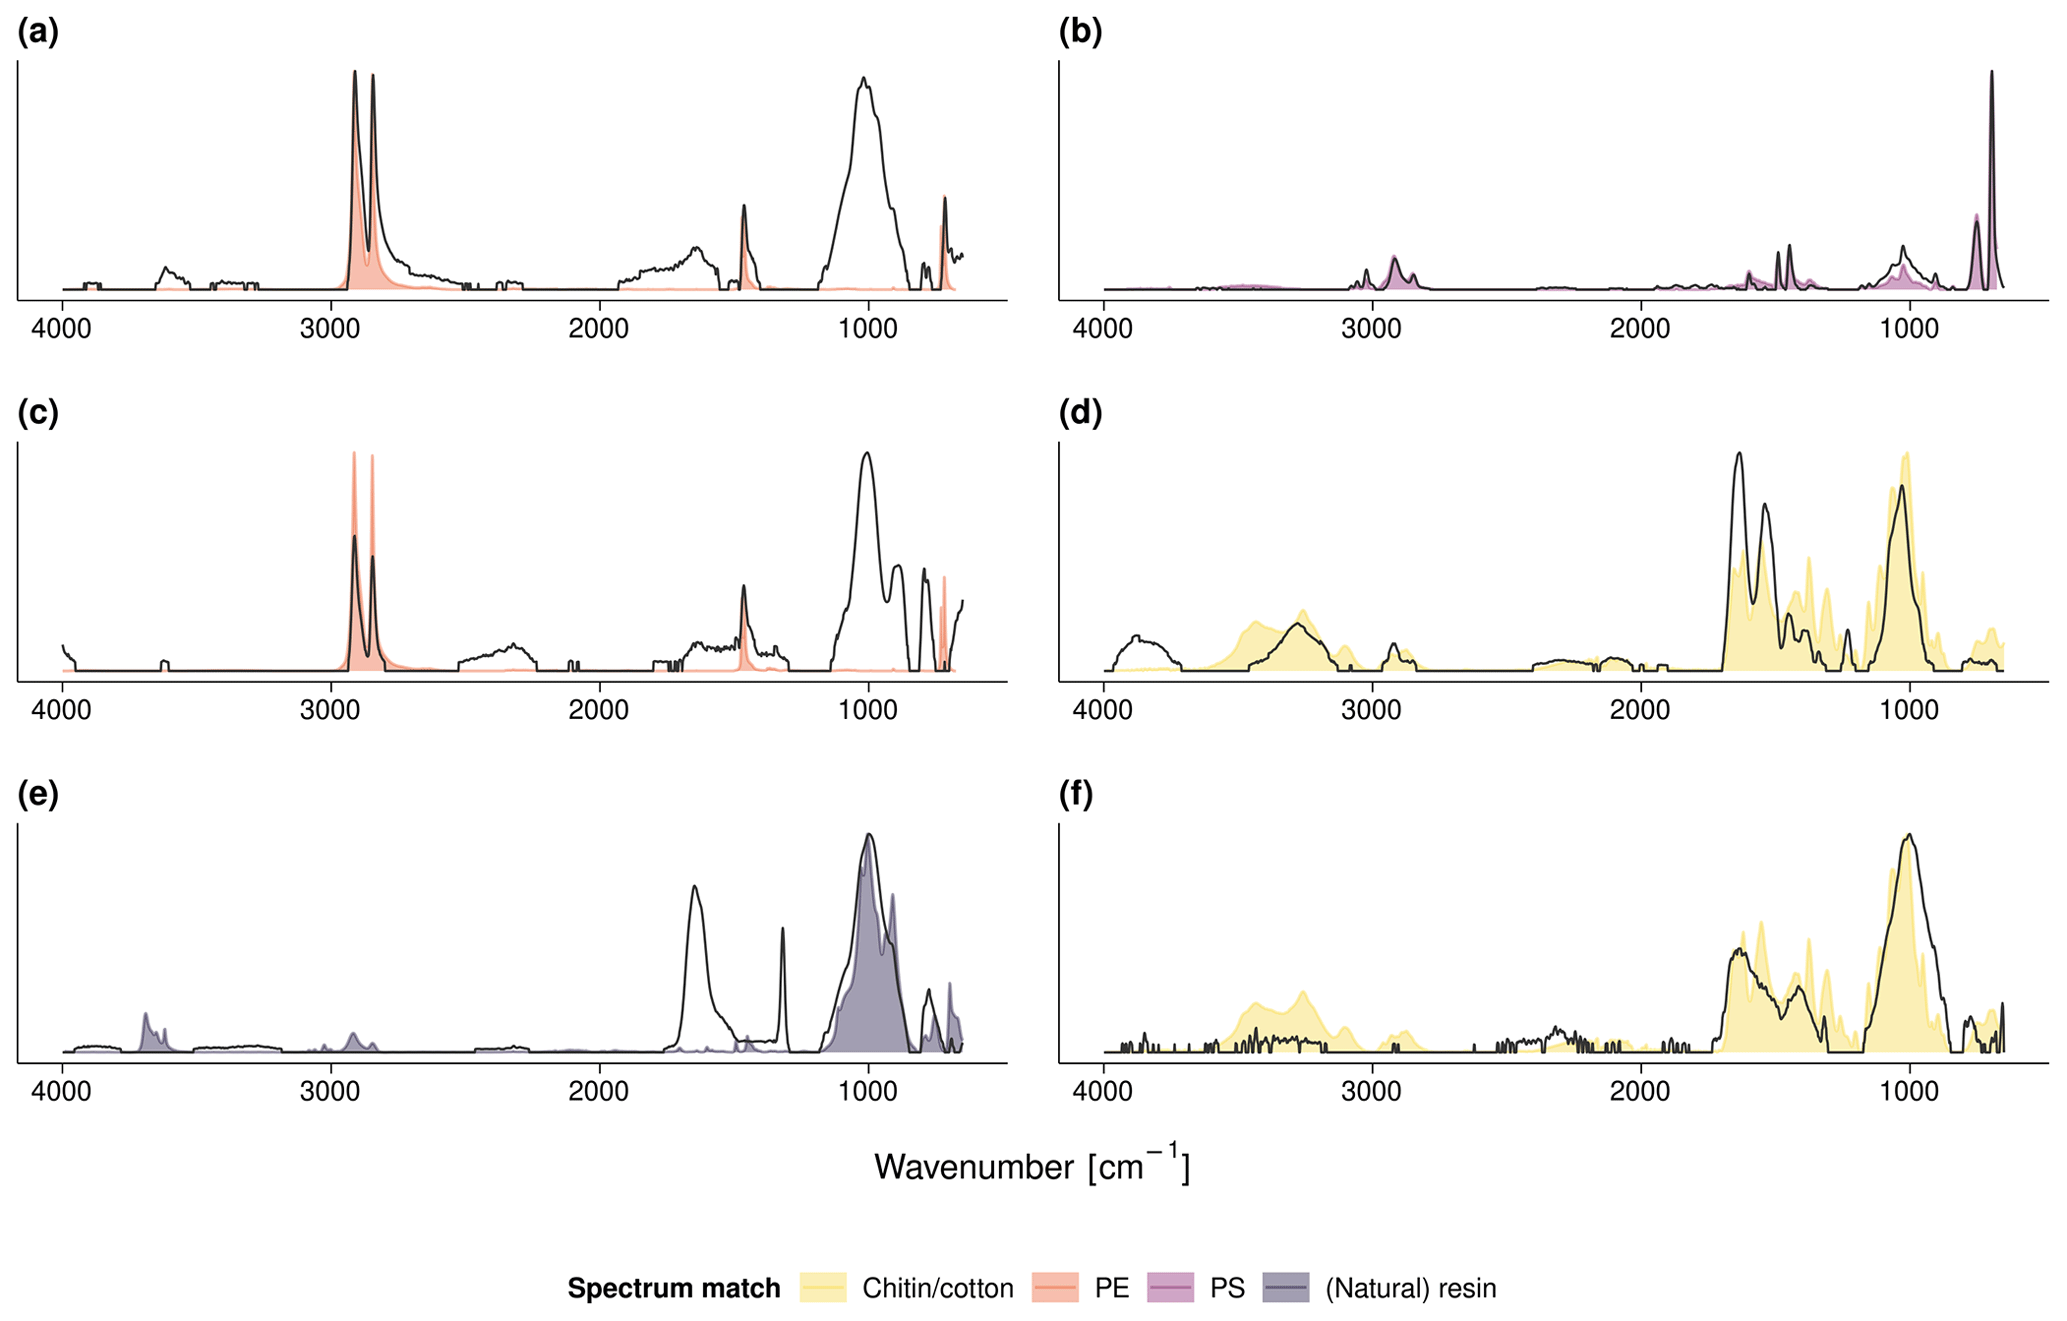
Figure A4FTIR spectra of the debris shown in Fig. 3: (a) PE film and (b) PS fragment from the field center of site 5, (c) PE film and (d) chitin shell from the field center of site 6, and (e) resin or natural fragment and (f) cotton fiber from the field edge of site 7. The measured FTIR spectra are in gray; the colored shades depict the respective Open Specy library match.
All data and code to reproduce data processing and statistical analysis are publicly available from https://doi.org/10.6084/m9.figshare.14742849 (Steinmetz et al., 2022).
ZS conceived the idea, designed the study, performed the analyses, and took the lead in writing the manuscript. PL and SE assisted with sample extractions and Py-GC/MS and FTIR measurements. JD conducted TGA and DSC analyses. KM and GES supervised the project. The manuscript was finalized through contributions of all authors.
The contact author has declared that neither they nor their co-authors have any competing interests.
Publisher’s note: Copernicus Publications remains neutral with regard to jurisdictional claims in published maps and institutional affiliations.
Maximilian Meyer and Aaron Kintzi are acknowledged for their help with soil sampling and preliminary experiments. We further thank Wiebke Mareile Heinze for fruitful discussions and feedback on the manuscript, as well as Wendy Höpp for English editing.
This research was financially supported by the pilot program “Profil3” of the “Bildung Mensch Umwelt” research fund at the University of Koblenz–Landau (project “PLAST” grant) and by the Ministry for Education, Science, Further Education and Culture (MBWWK) of Rhineland-Palatinate in the frame of the Interdisciplinary Research Group for Environmental Studies (IFG Umwelt) of the University of Koblenz–Landau.
This paper was edited by Claudio Zaccone and reviewed by two anonymous referees.
Agrarmeteorologie Rheinland-Pfalz: Wetterdaten Pfalz, available at: https://www.wetter.rlp.de/Agrarmeteorologie/Wetterdaten/Pfalz, last access: 7 May 2021. a
ASTM D422-63: Standard Test Method for Particle-Size Analysis of Soils, Technical standard, ASTM International, West Conshohocken, PA, available at: https://www.astm.org/d0422-63r07.html (last access: 14 January 2022), 2007. a
Beriot, N., Peek, J., Zornoza, R., Geissen, V., and Huerta Lwanga, E.: Low Density-Microplastics Detected in Sheep Faeces and Soil: A Case Study from the Intensive Vegetable Farming in Southeast Spain, Sci. Total Environ., 755, 142653, https://doi.org/10.1016/j.scitotenv.2020.142653, 2021. a
Bertling, J., Zimmermann, T., and Rödig, L.: Kunststoffe in der Umwelt: Emissionen in landwirtschaftlich genutzte Böden, Tech. Rep., Fraunhofer-Gesellschaft, https://doi.org/10.24406/UMSICHT-N-633611, 2021. a, b
Beyler, C. L. and Hirschler, M. M.: Thermal Decomposition of Polymers, in: SFPE Handbook of Fire Protection Engineering, edited by: DiNenno, P. J., National Fire Protection Association Massachusetts, USA, 2nd Edn., ISBN 978-0877654513, 2002. a, b, c
Brandes, E., Henseler, M., and Kreins, P.: Identifying Hot-Spots for Microplastic Contamination in Agricultural Soils – a Spatial Modeling Approach for Germany, Environ. Res. Lett., 16, 104041, https://doi.org/10.1088/1748-9326/ac21e6, 2021. a
Büks, F. and Kaupenjohann, M.: Global concentrations of microplastics in soils – a review, SOIL, 6, 649–662, https://doi.org/10.5194/soil-6-649-2020, 2020. a, b
Cowger, W., Steinmetz, Z., Gray, A., Munno, K., Lynch, J., Hapich, H., Primpke, S., De Frond, H., Rochman, C., and Herodotou, O.: Microplastic Spectral Classification Needs an Open Source Community: Open Specy to the Rescue!, Anal. Chem., 93, 7543–7548, https://doi.org/10.1021/acs.analchem.1c00123, 2021. a
David, J., Steinmetz, Z., Kučerík, J., and Schaumann, G. E.: Quantitative Analysis of Poly(Ethylene Terephthalate) Microplastics in Soil via Thermogravimetry – Mass Spectrometry, Anal. Chem., 90, 8793–8799, https://doi.org/10.1021/acs.analchem.8b00355, 2018. a, b
Dierkes, G., Lauschke, T., Becher, S., Schumacher, H., Földi, C., and Ternes, T.: Quantification of Microplastics in Environmental Samples via Pressurized Liquid Extraction and Pyrolysis-Gas Chromatography, Anal. Bioanal. Chem., 411, 6959–6968, https://doi.org/10.1007/s00216-019-02066-9, 2019. a, b, c, d
DIN 32645: Chemical Analysis – Decision Limit, Detection Limit and Determination Limit under Repeatability Conditions – Terms, Methods, Evaluation, Technical standard, Beuth, Berlin, Germany, https://doi.org/10.31030/1465413, 2008. a
EN 13655: Plastics – Thermoplastic Mulch Films Recoverable after Use, for Use in Agriculture and Horticulture, Tech. Rep., European Committee for Standardization, Brussels, Belgium, 2018. a, b
FAO: World Reference Base for Soil Resources 2014: International Soil Classification System for Naming Soils and Creating Legends for Soil Maps, Tech. Rep. 106, Food and Agriculture Organization, Rome, Italy, available at: http://www.fao.org/3/i3794en/I3794en.pdf (last access: 11 December 2021), 2014. a
Fu, Q., Tan, X., Ye, S., Ma, L., Gu, Y., Zhang, P., Chen, Q., Yang, Y., and Tang, Y.: Mechanism Analysis of Heavy Metal Lead Captured by Natural-Aged Microplastics, Chemosphere, 270, 128624, https://doi.org/10.1016/j.chemosphere.2020.128624, 2021. a
Grause, G., Chien, M.-F., and Inoue, C.: Changes during the Weathering of Polyolefins, Polym. Degrad. Stabil., 181, 109364, https://doi.org/10.1016/j.polymdegradstab.2020.109364, 2020. a, b
Hahladakis, J. N., Velis, C. A., Weber, R., Iacovidou, E., and Purnell, P.: An Overview of Chemical Additives Present in Plastics: Migration, Release, Fate and Environmental Impact during Their Use, Disposal and Recycling, J. Hazard. Mater., 344, 179–199, https://doi.org/10.1016/j.jhazmat.2017.10.014, 2018. a
Haider, N. and Karlsson, S.: Loss of Chimassorb 944 from LDPE and Identification of Additive Degradation Products after Exposure to Water, Air and Compost, Polym. Degrad. Stabil., 74, 103–112, https://doi.org/10.1016/S0141-3910(01)00107-0, 2001. a
Hamouz, K., Lachman, J., Dvořák, P., and Trnková, E.: Influence of Non-Woven Fleece on the Yield Formation of Early Potatoes, Plant Soil Environ., 52, 289–294, https://doi.org/10.17221/3443-PSE, 2011. a
Harms, I. K., Diekötter, T., Troegel, S., and Lenz, M.: Amount, Distribution and Composition of Large Microplastics in Typical Agricultural Soils in Northern Germany, Sci. Total Environ., 758, 143615, https://doi.org/10.1016/j.scitotenv.2020.143615, 2021. a, b, c, d
Hartmann, N. B., Hüffer, T., Thompson, R. C., Hassellöv, M., Verschoor, A., Daugaard, A. E., Rist, S., Karlsson, T., Brennholt, N., Cole, M., Herrling, M. P., Hess, M. C., Ivleva, N. P., Lusher, A. L., and Wagner, M.: Are We Speaking the Same Language? Recommendations for a Definition and Categorization Framework for Plastic Debris, Environ. Sci. Technol., 53, 1039–1047, https://doi.org/10.1021/acs.est.8b05297, 2019. a
Huang, Y., Liu, Q., Jia, W., Yan, C., and Wang, J.: Agricultural Plastic Mulching as a Source of Microplastics in the Terrestrial Environment, Environ. Pollut., 260, 114096, https://doi.org/10.1016/j.envpol.2020.114096, 2020. a, b
Hurley, R. R. and Nizzetto, L.: Fate and Occurrence of Micro(Nano)Plastics in Soils: Knowledge Gaps and Possible Risks, Curr. Opin. Environ. Sci. Health, 1, 6–11, https://doi.org/10.1016/j.coesh.2017.10.006, 2018. a
Kim, S.-K., Kim, J.-S., Lee, H., and Lee, H.-J.: Abundance and Characteristics of Microplastics in Soils with Different Agricultural Practices: Importance of Sources with Internal Origin and Environmental Fate, J. Hazard. Mater., 403, 123997, https://doi.org/10.1016/j.jhazmat.2020.123997, 2021. a
Laermanns, H., Lehmann, M., Klee, M., Löder, M. G. J., Gekle, S., and Bogner, C.: Tracing the Horizontal Transport of Microplastics on Rough Surfaces, Microplastics Nanoplastics, 1, 11, https://doi.org/10.1186/s43591-021-00010-2, 2021. a
Lamont, W. J.: Plastic Mulches for the Production of Vegetable Crops, HortTechnology, 3, 35–39, https://doi.org/10.21273/HORTTECH.15.3.0477, 1993. a
Liu, E. K., He, W. Q., and Yan, C. R.: “White Revolution” to “white Pollution” – Agricultural Plastic Film Mulch in China, Environ. Res. Lett., 9, 091001, https://doi.org/10.1088/1748-9326/9/9/091001, 2014. a
Luo, Y., Zhang, Y., Xu, Y., Guo, X., and Zhu, L.: Distribution Characteristics and Mechanism of Microplastics Mediated by Soil Physicochemical Properties, Sci. Total Environ., 726, 138389, https://doi.org/10.1016/j.scitotenv.2020.138389, 2020. a
Maghchiche, A., Haouam, A., and Immirzi, B.: Use of Polymers and Biopolymers for Water Retaining and Soil Stabilization in Arid and Semiarid Regions, J. Taibah Univ. Sci., 4, 9–16, https://doi.org/10.1016/S1658-3655(12)60022-3, 2010. a
Magnusson, B. and Örnemark, U.: Eurachem Guide: The Fitness for Purpose of Analytical Methods – A Laboratory Guide to Method Validation and Related Topics, 2nd Edn., available at: https://www.eurachem.org/index.php/publications/guides/mv (last access: 16 August 2021), 2014. a, b, c
Newcomb, C. J., Qafoku, N. P., Grate, J. W., Bailey, V. L., and De Yoreo, J. J.: Developing a Molecular Picture of Soil Organic Matter – Mineral Interactions by Quantifying Organo – Mineral Binding, Nat. Commun., 8, 396, https://doi.org/10.1038/s41467-017-00407-9, 2017. a
Okoffo, E. D., Ribeiro, F., O'Brien, J. W., O'Brien, S., Tscharke, B. J., Gallen, M., Samanipour, S., Mueller, J. F., and Thomas, K. V.: Identification and Quantification of Selected Plastics in Biosolids by Pressurized Liquid Extraction Combined with Double-Shot Pyrolysis Gas Chromatography – Mass Spectrometry, Sci. Total Environ., 715, 136924, https://doi.org/10.1016/j.scitotenv.2020.136924, 2020. a
Piehl, S., Leibner, A., Löder, M. G. J., Dris, R., Bogner, C., and Laforsch, C.: Identification and Quantification of Macro- and Microplastics on an Agricultural Farmland, Sci. Rep., 8, 17950, https://doi.org/10.1038/s41598-018-36172-y, 2018. a
Primpke, S., Fischer, M., Lorenz, C., Gerdts, G., and Scholz-Böttcher, B. M.: Comparison of Pyrolysis Gas Chromatography/Mass Spectrometry and Hyperspectral FTIR Imaging Spectroscopy for the Analysis of Microplastics, Anal. Bioanal. Chem., 412, 8283–8298, https://doi.org/10.1007/s00216-020-02979-w, 2020. a
Scarascia-Mugnozza, G., Sica, C., and Russo, G.: Plastic Materials in European Agriculture: Actual Use and Perspectives, J. Agr. Eng., 42, 15–28, https://doi.org/10.4081/jae.2011.3.15, 2011. a
Sponagel, H., Grottenthaler, W., Hartmann, K., Hartwich, R., Janetzko, P., Joisten, H., Kühn, D., Sabel, K., and Traidl, R.: Bodenkundliche Kartieranleitung, Schweizerbart, Stuttgart, 5th Edn., ISBN 978-3-510-95920-4, 2005. a
Steinmetz, Z., Wollmann, C., Schaefer, M., Buchmann, C., David, J., Tröger, J., Muñoz, K., Frör, O., and Schaumann, G. E.: Plastic Mulching in Agriculture. Trading Short-Term Agronomic Benefits for Long-Term Soil Degradation?, Sci. Total Environ., 550, 690–705, https://doi.org/10.1016/j.scitotenv.2016.01.153, 2016. a, b
Steinmetz, Z., Kintzi, A., Muñoz, K., and Schaumann, G. E.: A Simple Method for the Selective Quantification of Polyethylene, Polypropylene, and Polystyrene Plastic Debris in Soil by Pyrolysis-Gas Chromatography/Mass Spectrometry, J. Anal. Appl. Pyrol., 147, 104803, https://doi.org/10.1016/j.jaap.2020.104803, 2020. a, b, c, d, e, f, g, h, i
Steinmetz, Z., Löffler, P., Eichhöfer, S., David, J., Muñoz, K., and Schaumann, G. E.: Data from: Are agricultural plastic covers a source of plastic debris in soil? A first screening study, figshare [data set], https://doi.org/10.6084/m9.figshare.14742849, 2022. a
Thomas, D., Schütze, B., Heinze, W. M., and Steinmetz, Z.: Sample Preparation Techniques for the Analysis of Microplastics in Soil – A Review, Sustainability, 12, 9074, https://doi.org/10.3390/su12219074, 2020. a, b, c, d, e, f
Tocháček, J., Láska, K., Bálková, R., Krmíček, L., Merna, J., Tupý, M., Kapler, P., Poláček, P., Čížková, K., and Buráň, Z.: Polymer Weathering in Antarctica, Polym. Test., 77, 105898, https://doi.org/10.1016/j.polymertesting.2019.105898, 2019. a, b
Tsuge, S., Ohtani, H., and Watanabe, C.: Pyrolysis – GC/MS Data Book of Synthetic Polymers: Pyrograms, Thermograms and MS of Pyrolyzates, Elsevier, Amsterdam, Boston, ISBN 978-0-444-53892-5, 2011. a
Wang, Z., Taylor, S. E., Sharma, P., and Flury, M.: Poor Extraction Efficiencies of Polystyrene Nano- and Microplastics from Biosolids and Soil, PLOS ONE, 13, e0208009, https://doi.org/10.1371/journal.pone.0208009, 2018. a
Wenig, P. and Odermatt, J.: OpenChrom: A Cross-Platform Open Source Software for the Mass Spectrometric Analysis of Chromatographic Data, BMC Bioinformatics, 11, 405, https://doi.org/10.1186/1471-2105-11-405, 2010. a
Wu, X., Lyu, X., Li, Z., Gao, B., Zeng, X., Wu, J., and Sun, Y.: Transport of Polystyrene Nanoplastics in Natural Soils: Effect of Soil Properties, Ionic Strength and Cation Type, Sci. Total Environ., 707, 136065, https://doi.org/10.1016/j.scitotenv.2019.136065, 2020. a
Zhang, D., Liu, H.-B., Hu, W.-L., Qin, X.-H., Ma, X.-W., Yan, C.-R., and Wang, H.-Y.: The Status and Distribution Characteristics of Residual Mulching Film in Xinjiang, China, J. Integr. Agr., 15, 2639–2646, https://doi.org/10.1016/S2095-3119(15)61240-0, 2016. a
Zhang, G. S. and Liu, Y. F.: The Distribution of Microplastics in Soil Aggregate Fractions in Southwestern China, Sci. Total Environ., 642, 12–20, https://doi.org/10.1016/j.scitotenv.2018.06.004, 2018. a, b
Zhang, S., Yang, X., Gertsen, H., Peters, P., Salánki, T., and Geissen, V.: A Simple Method for the Extraction and Identification of Light Density Microplastics from Soil, Sci. Total Environ., 616/617, 1056–1065, https://doi.org/10.1016/j.scitotenv.2017.10.213, 2018. a