


Improved sanitation was a major contributor to mortality decline during the nineteenth and early twentieth centuries (Alsan and Goldin 2019; Chapman Reference Chapman2019).Footnote 1 Yet many towns were reluctant to invest in the infra-structure needed to provide clean water supply or effective sewerage, with considerable variation in the timing and extent of spending on these critical public goods (Cain and Rotella 2001; Cutler and Miller 2005). Several studies have identified the importance of local political fail-ures, particularly taxpayer opposition, in delaying infrastructure devel-opment.Footnote 2 In contrast, the barriers that towns faced in raising the funds for investment—capital market failures—have received relatively little attention.
This study investigates the challenges that confronted towns when borrowing to finance sanitation infrastructure in nineteenth-century Britain. Using a dataset of the annual financial accounts of more than 800 town councils, I demonstrate a strong negative relationship between interest rates and investment, controlling for the town tax base, non-tax revenue sources, demographic characteristics, and town and year fixed effects. Instrumental variable regressions, using earlier borrowing deci-sions as a source of exogenous variation, then show that falling interest rates explain a substantial portion of sanitation investment in the 1890s. Further analysis shows that sanitation investment—instrumented by the fall in interest rates—led to significant declines in infant mortality after 1887. High interest rates had a large deterrent effect on sanitation investment and held back improvements in public health.
These results show that the slow pace of sanitation investment was not due merely to short-sighted bureaucrats and penny-pinching voters. Financing infrastructure projects was both expensive and complicated, with towns issuing a medley of novel financial instruments as they grap-pled with the best way to raise unprecedented sums. Some towns were disadvantaged in accessing capital markets and hence invested later. Similar constraints may well have existed in land and labor markets (Millward and Sheard 1995), while technical difficulties could also hold councils back (Hamlin Reference Hamlin1988). These challenges shaped the growth of Britain’s urban infrastructure.
The paper adds further evidence that sanitation infrastructure was central to Britain’s mortality decline, and suggests a number of ways that Parliament could have expedited improvements in urban sanitary environments. Council investment was frequently impeded by a lack of financial resources, with local taxpayers often opposing higher taxes. Directly subsidizing public goods expenditure was likely politically infeasible, but subsidizing interest rates certainly was not: cheap government loans were available in the 1870s and again after 1897, but in the interim Treasury fears about growing local government debt outweighed the concerns of sanitary reformers. At the same time, the government allowed borrowing from private capital markets only if certain conditions were met, or with a bespoke Local Act of Parliament. Again, these restrictions were removed or weakened in the 1890s; acting earlier could have brought forward town investment.
A simple comparison of trends in town interest rates and sanitation investment provides suggestive evidence that changes in the cost of borrowing had a powerful influence on infrastructure development. In the mid-1880s many British towns were spending little on public goods provision, despite Parliament mandating them to do so in the 1872 and 1875 Public Health Acts, and providing them with subsidized loans for just that purpose (Webster Reference Webster2018). After 1890 however, sanitation investment grew rapidly, with the aggregate value of loans outstanding growing by more between 1890 and 1900 than in the previous 15 years. At the same time, the average interest rate paid by town councils decreased from 4.0 to 3.4 percent. However, this general trend masks considerable inequalities across towns: it was only in 1899 that the interest rate paid by the town at the 75th percentile was as low as that paid by those in the 25th percentile in 1887. Changes in borrowing costs thus offer a potential explanation for the surge in investment at the end of the nineteenth century.
The differences in towns’ borrowing costs are likely explained by differences in access to private capital markets. While all towns had access to borrowing from the central government through the Public Works Loan Board (PWLB), towns varied in their ability to raise funds from private sources. Towns that had the resources to obtain Local Acts of Parliament were able to issue bonds (“stock”) much earlier, allowing them to reach a larger pool of investors and take advantage of declining market interest rates. Further, private investors worried that they could be a lower repayment priority than the government in the event of default, meaning that borrowing from the PWLB could inhibit later borrowing from private lenders. I thus use the extent of town borrowing prior to 1887 as a source of (conditionally) exogenous variation in a town’s ability to benefit from the general fall in interest rates in the 1890s.
The paper concludes by discussing ways in which the British government could have helped towns borrow more cheaply, and hence stim-ulated investment in these critical public goods. Policy towards town council borrowing after 1875 was, at best, muddled. A desire to provide towns with access to credit conflicted with concerns over the unprec-edented scale of the investment required, meaning funds were provided only with a number of restrictions—a confusion exemplified by the fact that borrowing from the government could itself inhibit borrowing from private lenders. Similarly, the success of providing cheap sanitation loans in the 1870s led to the government raising interest rates even as their own cost of borrowing fell. A more coherent strategy could have facilitated town borrowing, incentivized infrastructure investment, and improved Britain’s public health.
DATA
The paper draws extensively on a dataset constructed from the annual accounts of urban councils in England and Wales, reported in the Local Taxation Returns in the Parliamentary Papers collection.Footnote 3 A panel dataset was constructed by hand-matching towns between years to account for variations in place names over time. The annual accounts provide a detailed disaggregation of the sources of revenue and types of expen-diture for each town council in England and Wales, as well as the value of loans outstanding, and the value of the tax base. Per capita figures are constructed using census population data.Footnote 4
The organization of the town accounts improved significantly after 1884 and as a result, most of the analysis begins after that date. Prior to 1884, the reports do not distinguish between current and capital expen-diture, leading to large “spikes” in the spending series due to infrastructure investments. From 1884 onwards, in contrast, the reports separate expenditure “not out of loans” and “out of loans,” allowing me to separate ongoing and investment expenditure. Further, from 1887 the reports distinguish between loan interest payments and principal repayments, allowing me to estimate the interest rate paid by each town. From 1904 these spending categories were again combined—and so 1903 is the final year of analysis.
I focus on towns that existed as sanitary authorities throughout the period 1881 to 1911—avoiding any issues due to changes in the composition of the sample. The resulting sample of 848 towns contained 92 percent of the non-metropolitan urban population of England and Wales in 1891.Footnote 5 The sample is extremely heterogeneous, incorporating both the largest cities (except London) and towns with a population of less than 500.
The paper focuses on investment in sanitation infrastructure, defined as expenditure out of loans on water supply, sewers, and street improve-ments, for three reasons. First, these public goods are of critical importance in improving public health, contributing significantly to Britain’s mortality decline. Clean water supply and sewer systems both directly halt the spread of waterborne disease, while street improvements also had a sanitary impact since paving affects the ease of cleaning streets, and because they were sometimes associated with slum clearance. Second, all the towns in the sample were expected to spend on these public goods by virtue of being urban sanitary authorities, whereas the authority (or requirement) to invest in other infrastructure could vary between municipal boroughs and other towns. Finally, sanitation was the major component of urban investment in this period, accounting on average for 68 percent of the outstanding loan stock—a contemporary measure of sanitary progress.
I estimate towns’ cost of borrowing using the average interest rate paid over each year. That is, I divide the expenditure on interest in each year by the estimated average value of loans outstanding during the year. The measure is noisy, but the overall estimates appear plausible in compar-ison to both the consol rate and the rates of interest charged by the PWLB (see Figure 3 and surrounding discussion). Further, the trend and levels are similar to the local interest rates collected by Webster (Reference Webster2021, table 5) for a sample of local authority loans in the 1880s and 1890s.
I supplement the main financial dataset with additional data regarding the sources of town borrowing. First, I identify the timing of town stock issues—bonds in modern parlance—using the Global Financial Database and Burdett (Reference Burdett1894). Second, I identify borrowing from the PWLB using the annual accounts of the Public Works Loan Commissioners in eight cross-sections between 1882 and 1904. Third, I take advantage of two Parliamentary Papers reporting town borrowing in 1872 (for municipal boroughs) and 1874 (for other towns) to estimate interest rates in the early 1870s.Footnote 6
Finally, some analyses use data on infant mortality constructed from the Quarterly Returns of the Registrar General. This source reports quarterly mortality statistics at the level of Registration subdistricts; I match towns to these subdistricts using census and registration reports. I use data for the third quarter of each year since the waterborne diseases most affected by sanitation infrastructure were particularly likely to strike during these months. As such, this period provides the best test of whether infrastructure had an effect—if it had no impact in the third quarter, it seems unlikely it would have made a substantial contribution in the remainder of the year. Because of the short periods involved, the annual data are very volatile, and so I average across several years.Footnote 7
TRENDS IN INFRASTRUCTURE INVESTMENT
Investment in sanitation infrastructure grew impressively in the second half of the nineteenth century, but even in 1900—half a century after the landmark 1848 Public Health Act—there was considerable variation across the country in the provision of these critical public goods. Under the system introduced in 1848, town councils held responsibility for maintaining urban environments and had the authority to invest in sanitation infrastructure. Prohibitively high costs deterred many town councils from investing, forcing Parliament to make provision obliga-tory through further Public Health Acts in 1872 and 1875—with some, albeit limited, success. However, these legislative changes have limited power to explain the variation in sanitation expenditure across towns or the rapid growth in investment that occurred late in the nineteenth century. Rather, the surge in infrastructure spending in the last decade of the century appears to have been stimulated by falling interest rates.
Figure 1 shows that the imposition of the 1870s Public Health Acts, combined with the provision of subsidized loans, was followed by a spate of infrastructure investment. Loans were required to fund investment and, as a result, local authority borrowing has been used as a measure of sanitary progress by both contemporaries and modern researchers (Wohl Reference Wohl1983, pp. 112-115).Footnote 8 As we can see in the left-hand panel, the stock of loans outstanding increased rapidly after the 1875 Public Health Act, and more than doubled by 1885.
However, the legislative changes in the 1870s cannot explain the fact that much infrastructure investment did not occur until after 1890. By 1885 only 40 percent of towns had invested—in the sense of having loans outstanding—in water supply and only 64 percent had invested in sewers.Footnote 9 Many towns only began to invest in the last decade of the century, with more investment occurring between 1890 and 1903 than in the previous 15 years. As a result, by 1903 the proportions investing in water supply (55 percent) and sewers (80 percent) had significantly increased.
Towns borrowed to finance a wide range of investments of varying sizes. As well as building new infrastructure, towns also used debt to purchase private providers, particularly water companies—more than 100 water suppliers had been publicly acquired by 1907.Footnote 10 Much investment expanded or improved existing sanitation infrastructure and so even the largest towns were continuing to invest in sanitation in the last decade of the nineteenth century (see right-hand panel of Figure 1). While the biggest cities had invested in some infrastructure much earlier—both Liverpool and Manchester established sewer systems in the 1840s, for instance—they were still undertaking new projects in the 1890s.Footnote 11 As a result, their investment in sanitation infrastructure increased at a similar rate to smaller towns.
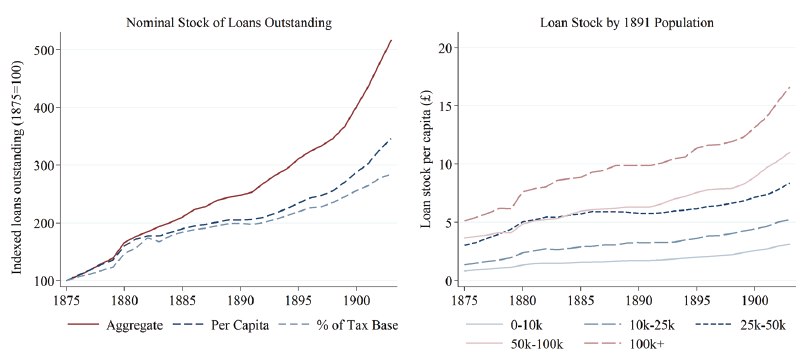
Figure 1 SANITATION SPENDING INCREASED GRADUALLY BETWEEN 1875 AND 1903
Notes: The figure displays trends for towns that were urban sanitary authorities between 1875 and 1904 (N = 721). The lines in the left-hand panel relate to averages across towns. “Aggregate” relates to the value of the loans in the year. The right-hand panel defines town size according to 1891 population. Starting from the smallest category, the number of towns in each group is 450, 154, 61, 33, and 23.
Sources: See section “Data” and the Data Appendix.
Growing town wealth explains a significant part of the growth in town investment but by no means all. Throughout the nineteenth century, town councils were expected to fund their own expenditure, largely through local taxes, meaning that towns varied significantly in their ability to invest. Some towns simply had much greater financial resources—the per capita tax base of the median town was approximately half that of the town at the 95th percentile throughout the period—and this translated into more spending.Footnote 12 Yet, as we can see in Figures 1 and 2, increases in the tax base cannot fully account for the rapid acceleration in spending: the average tax base grew only by around 40 percent between 1887 and 1903, while investment increased several fold.
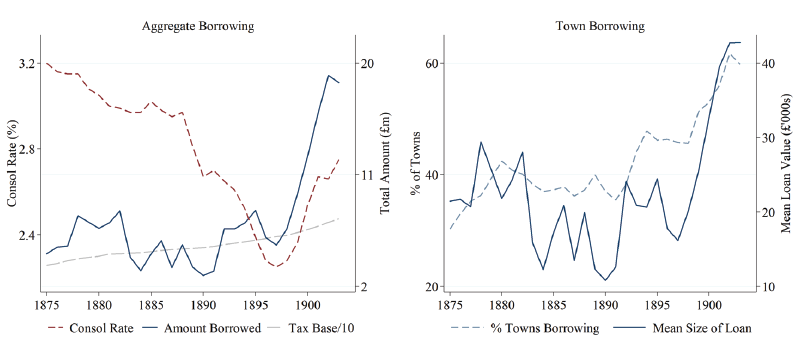
Figure 2 NEGATIVE CORRELATION BETWEEN TOWN BORROWING ACTIVITY AND NATIONAL INTEREST RATES
Notes: The figure displays data for towns that were urban sanitary authorities between 1875 and 1904 (N = 721). Left-hand panel displays the total value of loans received in each year. The right-hand panel shows the mean size of the loans received and the percentage of towns receiving a loan in each year.
Sources: See section “Data” and the Data Appendix.
National interest rates plummeted at exactly the time as sanitation investment increased in the 1890s, providing prima facie evidence that changing borrowing costs can explain the surge in investment at the end of the nineteenth century. There was a clear negative correlation between the long-term interest rate and town borrowing, as we can see in Figure 2. After 1890 the cost of money plunged, with the consol rate falling from 3 percent in 1885 to 2.3 percent in 1897.Footnote 13 At the same time, the value of loans to town councils surged—increasing from £4 million to £18 million between 1887 and 1903. This growth reflected both more towns taking out loans and higher average loan value (see right-hand panel)—in 1903 around 60 percent of towns took out loans, compared to 36 percent in 1887. Prior to 1887, in contrast, there is no clear trend in borrowing, with growth in the late 1870s followed by an 1880s slump.
Figure 3 demonstrates that town councils were able to access cheaper money after 1890, but with considerable variation in borrowing costs. Interest rates began to fall before 1887 (see right-hand panel) alongside the consol rate but this decline became more dramatic in the following 15 years, as investors turned to secure domestic assets following the Barings crisis (Wilson Reference Wilson1997, p. 48). But there was continuing variation throughout the period: the towns at the tenth percentile of the interest rate in 1887 were paying 3.5 percent, compared to 3.9 percent for the median town, and 4.7 percent for a town in the 90th percentile. This range narrowed over the period but remained significant (the figures for 1903 are 2.9, 3.4, and 3.8 percent, respectively) and it was only in 1899 that the rate paid by the town at the 75th percentile was as low as that paid by those in the 25th percentile in 1887. Some towns thus had a significant disadvantage in borrowing that potentially delayed investment. The reasons for this variation, including the advantages held by larger towns, are discussed in the following section.
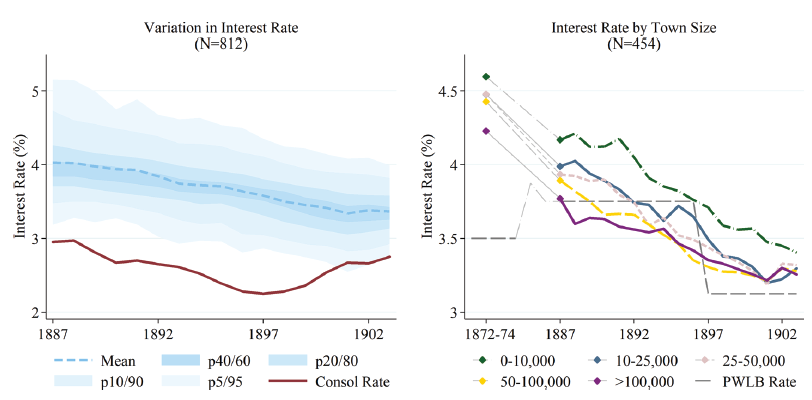
Figure 3 THE COST OF BORROWING VARIED CONSIDERABLY ACROSS TOWNS
Notes: The left-hand panel uses data for all the towns in the regression sample, whereas the right-hand panel uses data only for towns for which we have information from two Parliamentary Papers in the early 1870s. Town size is defined based on 1891 population. “PWLB rate” is the mid-point of the range of interest rates offered by the PWLB for sanitation investment—see footnote 24. Starting from the smallest category, the number of towns in each group is 239, 114, 49, 31, and 21.
Sources: See section “Data,” footnote 13, and Data Appendix.
THE MARKET FOR TOWN BORROWING
The last quarter of the nineteenth century was thus marked by growing town borrowing alongside declining interest rates. The cost of borrowing varied considerably across towns, although with some convergence over time. To better understand these patterns, this section examines the insti-tutional constraints councils faced when looking to borrow, and then discusses the demand for sanitation infrastructure.
Government Policy and Town Council Borrowing
Central government had two major sets of tools to encourage or limit town borrowing. First, they determined the legal conditions under which local authorities could borrow. Second, they lent directly to these bodies through the PWLB. Policy on both dimensions was shaped by two, often conflicting, objectives: sanitary reformers supported large-scale investment, but the Treasury became increasingly nervous about the growing local government debt burden. In consequence, towns were legally able to borrow but faced major practical and financial constraints in doing so.
Under the terms of the 1872 and 1875 Public Health Acts, all councils were able to borrow against the security of local taxes. However, the form of borrowing was tightly prescribed, with limitations on the maximum size of the loan (relative to the tax base) and the terms of repayment. In addition, loans had to be approved by the Local Government Board, requiring a local inquiry by an Engineering Inspector, detailed particulars of how loans would be spent, and how they would be repaid.Footnote 14 One key restriction related to the councils’ ability to raise funds through trade-able stock issues.Footnote 15 The mortgage debt that towns could issue under the Public Health Acts could not be bought and sold on an organized market and was hence relatively unattractive to private investors.Footnote 16 Nor could it be issued to repay earlier debts—and hence take advantage of falling interest rates—whereas stock could.
Towns could borrow more flexibly, including raising stock, using a Local Act of Parliament—but obtaining such an Act was predomi-nately only possible for relatively large and wealthy towns.Footnote 17 The ability to raise stock gave town councils access to cheaper funds, but the cost of obtaining Local Acts meant larger towns were more likely to do so. According to an 1884 Royal Commission “several of the large corpora-tions have been able to issue consolidated stock, the result of which is that those towns can borrow almost as cheaply as the State can lend to them."Footnote 18 Consequently, “the big towns and cities experienced little diffi-culty in raising finance for their ambitious projects…revealing a compara-tive advantage in their access to loans which after 1870 they extensively exploited” (Wilson Reference Wilson1997, p. 35).Footnote 19
After 1890 it became easier for all councils to issue stock, and the number of listed stock issues rapidly expanded.Footnote 20 Model clauses for the issuance of stock were agreed in 1889, reducing the cost of incorporating such powers in any Local Act (Bellamy Reference Bellamy1988, p. 87). The 1890 Public Health Act then allowed any urban authority to issue stock without a Local Act, through obtaining a consent order from the Local Government Board (Page 1985). These changes had a tangible effect: all authorizations to raise stock after 1892 were obtained through a consent order. At the same time, the number of towns with listed stocks grew rapidly—from 60 in 1892 to 86 by 1896. Whereas it was generally the largest towns that issued stocks before 1892, doing so became more common among smaller towns after the policy change.Footnote 21 While favorable market condi-tions no doubt contributed to the growth of stock issuance, the weakening restrictions on borrowing played at least an enabling role.
Larger towns gradually lost their comparative advantage in borrowing costs as stock issuance became more common, as we can see in the right-hand panel of Figure 3. This panel also shows a slow convergence in interest rates across towns: in the early 1870s, towns with an 1891 population of more than 100,000 were paying lower interest rates than all the groups of smaller towns, but by 1897 all but the smallest towns (1891 population fewer than 10,000) had caught up. In fact, even by 1887 towns with populations above 50,000 were paying similar interest rates to their larger counterparts. The smallest towns still faced some disadvantages but were also catching up: in 1887 the largest towns paid 0.33 percentage points less than the smallest towns; by 1903 the gap was only 0.15 percentage points. These patterns provide further evidence that larger towns’ lower borrowing costs were a result of their ability to issue stock.
As well as governing access to private markets, the central government also encouraged town investment through lending directly. The PWLB provided loans for sanitary purposes to urban councils from the 1860s onward, funding almost half of spending by local boards of health on water and sewers between 1872 and 1876.Footnote 22 PWLB loans were attractive at this point both because of the difficulty in raising funds elsewhere and the fact that interest rates offered by the PWLB were below the market rate. As we can see in the right-hand panel of Figure 3, at the start of our period even the larger towns were paying higher interest rates than the middle of the range offered by the PWLB and as a result, even the largest towns took out government loans (e.g., in 1882 both Birmingham and Manchester borrowed from the PWLB).
Over time, however, PWLB loans became relatively unattractive and towns turned to alternative borrowing sources if possible. After the 1870s there was increasing debate over whether offering cheap loans was justifiable, partially explaining the sluggish response to declining market rates (see Bellamy Reference Bellamy1988, chapter 4).Footnote 23 Interest rates payable on PWLB loans were set by the Treasury, and changed only at irregular intervals, meaning that they lagged falls in the market rate of borrowing. In the 1890s, for instance, the falling cost of borrowing led to councils repaying PWLB loans with funds from private markets. Only in 1897— when the consol rate was once again increasing—did the Treasury cut interest rates in response (Bellamy Reference Bellamy1988, p. 94).Footnote 24 A borrowing limit of £100,000 imposed between 1879 and 1897 also prevented the PWLB from financing the most complex projects.Footnote 25
The history of borrowing from the PWLB suggests towns were very responsive to changes in interest rates. In 1897, only 21 of the towns in our sample borrowed from the PWLB—compared to more than 100 in 1882—despite the fact, as we have seen in Figure 1, that more towns were taking out sanitary loans in general. In fact, authorities rushed to repay their loans from the PWLB, forcing the Treasury to implement premia on repayment in November 1895. Towns that were reliant on the PWLB—particularly smaller towns (Wilson Reference Wilson1997, p. 35), or those seen as a high credit risk—were thus forced to pay relatively high interest rates. Eventually, in 1897 the Treasury cut interest rates again and borrowing increased rapidly—164 towns borrowed from the PWLB in 1899, growing to 230 in 1904 with the largest towns once again taking advan-tage of subsidized loans. The uptake of PWLB loans was very sensitive to interest rates, with councils reacting quickly to take advantage of the cheapest available borrowing option.
Loans from the PWLB could inhibit towns’ access to private capital markets for two reasons. First, the limits on repayment discussed in the previous paragraph prevented towns from borrowing more cheaply elsewhere. Second, the existence of a PWLB loan on councils’ books made private lenders more reluctant to lend, as they were worried it could endanger repayment if the town ran into financial difficulties. Institutional investors were attracted to municipal loans because they placed a high premium on security (Webster Reference Webster2021) and thus uncertainty about the possibility of repayment was of great concern. The Secretary of the Prudential Assurance company told a 1902 Select Committee that understanding the priorities on loan repayment was of “great importance” in considering whether to lend and that “it [was] not perhaps generally appreciated by local authorities that in borrowing from the Public Works Loan Commissioners they are in danger, perhaps but I believe the public works authorities claim priority for their loans” (PP 1902 VIII.1, paras 4592-4657). The difficulties caused by early borrowing from the PWLB will be revisited in the instrumental variables analysis.
Overall, policy towards town borrowing was somewhat mixed. A legal framework for borrowing was established, and the PWLB ensured that all towns had some access to borrowing for sanitation purposes. Further, the requirement for auditing provided reassurance to anxious lenders and so facilitated private lending, particularly in the 1870s. As credit markets developed, however, these initial advantages disappeared and the legal framework actively inhibited investment. Further, the government stopped using their power to subsidize interest rates, and so perhaps missed an opportunity to stimulate investment earlier—a question analyzed in detail in the empirical analysis.
The Demand for Loans
Identifying the effect of lower borrowing costs on investment is complicated by the fact that the demand for sanitation and the ability to repay loans are entwined. Towns with fewer financial constraints would be better able to afford public goods and also be less likely to default on their loans—and hence need to pay lower rates of interest. Local taxation (the “rates”) was the most important revenue source for most town councils, and the size of the local tax base was thus critical to their ability to repay loans. In addition, some towns received significant revenue from trading services and, at the end of the period, grants for street improve-ments. Controlling for those constraints is thus an important component of the regression analysis.
The size of the local tax base was the most important constraint for councils seeking to expand local expenditure. Both current expenditure and loan repayment had to be funded out of local revenue, of which local taxation was by far the largest component: on average tax accounted for 60 percent of town revenue (excluding loans). Grants from the central government were small throughout the period and were not directed at infrastructure development. Instead, they were limited to those services deemed “national” in character, such as policing and maintenance of luna-tics, meaning that many towns received nothing at all, and few received an amount exceeding 5 percent of their tax revenue. Rather, towns relied on revenue raised from (essentially) proportional taxes on “immovable” property and consequently, towns were constrained by the value of the property in their district.Footnote 26
Previous studies have shown that some town councils were able to use property or operational profits to alleviate the pressure on tax revenue, but these forms of revenue are generally insignificant in the broad sample used in this paper. Large towns sometimes subsidized the rates using returns from landed estates or profits from gas or other municipal under-takings (Millward and Sheard 1995, pp. 507-509). However, the financial data show that few other towns acted in this way: revenue from prop-erty (sales or rents) accounted for more than 10 percent of loan revenue in fewer than one-tenth of towns. Trading profits were also not a large contributor to the rate burden: less than a fifth of towns operated the undertakings most likely to subsidize other activities—gas, electricity, or tramways—even at the end of the period. Further, even where a profit was made, the contribution was generally less than 10 percent of tax revenue.Footnote 27
Grants for street improvements from county councils provided a more significant source of non-tax revenue after 1890. County authorities began to contribute to “disturnpiked roads” from 1878 onwards, and in 1890 newly established county councils gained responsibility for main-taining “main roads"—changes that necessitated transfers to town councils within their area.Footnote 28 These transfers allowed spending on roads to be funded from sources outside of each town, through either a county-wide tax or funding from the central government. Once transfers from the counties are included, the median town received grants worth more than 20 percent of their tax revenue in 1895, predominantly related to roads. These grants have been largely overlooked in the historical literature,Footnote 29 but accounted for almost 40 percent of the median town’s expenditure on roads—large enough, in principle, to make an important contribution to the development of Britain’s road infrastructure.Footnote 30
EMPIRICAL STRATEGY
I now turn to estimating whether and to what extent falling borrowing costs affected sanitation investment and, consequently, infant mortality. I start by discussing the empirical challenges and the identification strategy underpinning the econometric analysis. The second and third subsections then introduce two empirical strategies—two-way fixed effect panel regressions, and an instrumental variables specification.
Identification
Our main focus is to identify the effect of town interest rates on borrowing and investment. Conceptually, we can consider a town as operating within a market for loans, in which the interest rate they pay is determined by their demand for infrastructure and the supply of funds in the market. Demand curves are downward sloping because higher interest rates reduce the net return on any new investment, and higher interest payments for existing loans may reduce the funds available for further public spending. The late nineteenth-century decline in interest rates reflected towns moving down their demand curve—borrowing a higher quantity at a lower price—as the supply of loans shifted to the right.
The empirical challenge is to distinguish variation in the supply of funds from heterogeneity in the demand for public goods—given that we cannot directly observe differences in towns’ access to credit. The earlier discussion has shown how towns differed in their access to private capital markets due to restrictions on raising stock, the requirement to obtain Local Acts of Parliament to avoid the need for government approval, and private lenders’ assessment of their likelihood of repayment. Alternative potential sources of variation could include the idiosyncrasies of indi-vidual administrators or differences in the depth of local capital markets.
I take two approaches to tackle this problem. First, I implement two-way fixed effects panel regressions, including control variables to capture heterogeneity in demand for public goods. The identifying assumption underlying these regressions is that, after the inclusion of the control variables, changes in the interest rate (i.e., differences in the supply of funds) are uncorrelated with other factors affecting town borrowing. A number of robustness checks, detailed below, support this assumption.
The two-way fixed effects approach has the advantage of capturing both cross-sectional and temporal variation in interest rates but leaves lingering concerns regarding causal identification. The identifying assumption could be violated if other factors are affecting the demand for infrastructure that also affect towns’ access to loans—leading to a spurious correlation. It would also be violated if high demand induced firms to seek private capital, and hence lower interest rates—in that case, reverse causality would be a concern.
To provide a sharper test of the causal effects of falling borrowing costs, I take advantage of one source of exogenous variation in access to private capital markets that we can observe—borrowing from the PWLB before interest rates began to fall in 1886. As discussed previously, private lenders could be deterred by the fact that towns had previously borrowed from the PWLB because of concerns about their repayment priority in the event of default. Further, borrowing from the PWLB could make refinancing loans at cheaper interest rates difficult. Past PWLB borrowing thus hindered towns from taking advantage of the general fall in interest rates shown in Figure 3.
I thus use early borrowing from the PWLB as an instrument for the fall in interest rates between 1887 and 1903—that is, focusing on the temporal component of variation in interest rates. The critical assumption here— required for the exclusion restriction to hold—is that this borrowing was independent of town investment after 1887. This assumption could be threatened if pre-1887 investment replaced (or necessitated) later investment, or if town characteristics affected both the sources of pre-1887 borrowing and post-1887 investment. As such, I control for a range of town-level characteristics and pre-1887 investment in these specifications.
Panel Regressions
I estimate regressions of the following form:
 $${y_{i,t}} = a + \beta \,interestRat{e_i}_t + {\rm{ }}{X_{i,t}}\gamma {\rm{' }} + {\rm{ }}{\delta _t} + [{\lambda _i}]{\rm{ }} + {\rm{ }}{\varepsilon _{i,t}},$$
where i indexes a town, t indexes a year (between 1887 and 1903), and y represents sanitation investment. The variable interestRate is the average interest rate paid in the year. X is a vector of control variables that could plausibly be associated with the demand for public goods expenditure (discussed in detail below). I include year fixed effects (ö) and, in some specifications, town fixed effects (A). See Table A.1 in the Data Appendix for descriptive statistics of the main variables used in the regression analysis.
Table 1 HIGHER BORROWING COSTS ASSOCIATED WITH LOWER SANITATION INVESTMENT
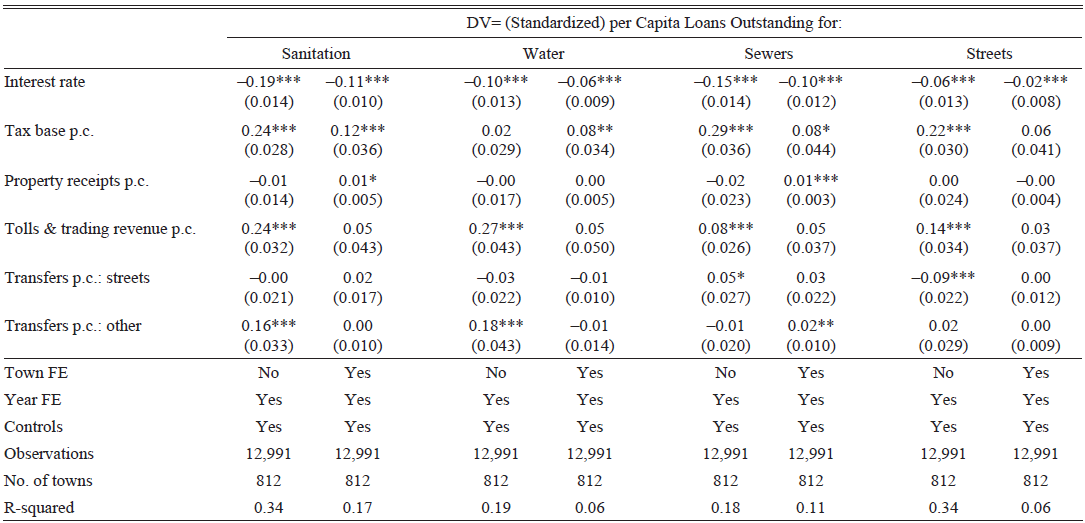
Notes: All variables are standardized. Tax base and loan stock variables are square-root-transformed. Control variables include population and population density. Standard errors are clustered by town and presented in parentheses.
* p < 0.10, ** p < 0.05, *** p < 0.01.
Sources: Author’s estimations; see the text for details.
I use both the stock and flow of sanitation investment as dependent variables (y i.t). To proxy for the stock of sanitation infrastructure, I use the per capita sanitation loans outstanding in the town. This measure captures the outcome of most interest—the level of sanitation infra-structure provided—however, it suffers from the drawback that annual fluctuations in the interest rate can only have a limited impact since much investment would occur in previous years. As such, as a second depen-dent variable I use the per capita expenditure out of loans on sanitation— that is, capital expenditure. This measure directly captures the amount invested in sanitary public goods each year, which we would anticipate being more responsive to interest rates. Both dependent variables are right-skewed, so I apply a square root transformation.Footnote 31
To account for heterogeneity in the demand for public goods, I include a number of time-varying controls, as well as town and year fixed effects. Larger, wealthier towns are likely to have had a greater demand for public goods, and also been lower default risks, and consequently been able to obtain lower borrowing costs. Town fixed effects account for any time-invariant factors affecting demand, such as geographical character-istics. Year fixed effects capture general trends in borrowing over time that could lead to spurious correlation with the fall in interest rates. The time-varying covariates then capture other factors affecting demand that vary across towns and are not stable over time.
The first set of controls capture differences in towns’ financial constraints, and thus provides evidence regarding the potential for government subsidies to have increased sanitation investment. I include controls for both the tax base (rateable value) per capita in each town and non-tax sources of revenue: receipts from transfers (split between those targeted at spending on roads and those for other purposes), receipts from property, and receipts from “tolls and trading.” The latter incorporates all revenue from public services (except water supply) including gas, markets, and other municipal undertakings.
Town size and density could also confound the relationship between investment and the interest rate. Large, densely populated cities may have had higher demand for sanitation since cramped living conditions facilitate the spread of disease. On the other hand, larger cities may have benefited from economies of scale in provision since the fixed costs of (for instance) a water plant would be spread over a wider area. Similarly, densely populated areas may have had lower costs since pipes and streets need to be laid for a smaller distance. To capture these effects I include controls for both population and population density—allowing for a flexible relationship by including them in bins, rather than as linear variables.
Instrumental Variables Analysis
I carry out two instrumental variables analyses. The first estimates the effect of falling interest rates on sanitation investment; the second esti-mates the effect of that investment on infant mortality.
Specifically, to estimate the effect of falling interest rates I estimate the following specification:

The dependent variable is the per capita spending out of loans between 1887 and 1903 (square-rooted), and the key independent variable is the change in interest rates over the same period. I control for town charac-teristics—including the loan stock—at the start of the period, and then use the change in the interest rate as a “shock"—instrumented by earlier borrowing from the PWLB. I exclude the extreme values of the change in interest rate, as these likely reflect measurement error.Footnote 32
Specifically, I construct two instruments: first the percentage of a town’s outstanding loans that were borrowed from the PWLB in 1882 (the earliest date this information is available), and the second a binary variable capturing whether a loan was taken from the PWLB at all between 1882 and 1886. The critical assumption here is that decisions over whether to borrow from the PWLB were made independently of later investment decisions. Therefore I include the stock of loans outstanding in 1886 in all specifications, to control for the fact that pre-existing investments could potentially affect the need for later investments (either positively or nega-tively). Similarly, I also control for other town characteristics—town size and tax base per capita—that could reduce the reliance on PWLB loans and also be associated with higher levels of investment.Footnote 33
A further set of regressions estimate the effect of sanitation investment on infant mortality. I estimate specifications similar to those in Equation (2), but with the change in infant mortality as the dependent variable, and sanitation investment per capita between 1887 and 1903 as the key inde-pendent variable. Unfortunately, mortality data were not reported at town level during this period, so instead, I use registration data for surrounding registration subdistricts to estimate the change in the mortality between a baseline period of 1881-1886 and a post-treatment period of 1904–1911 (see the Data Appendix for further details). Here again, we have an endogeneity problem since investment likely responded to higher infant mortality. As such, I construct an instrument for spending by regressing the change in interest rates on the two pre-1886 PWLB borrowing variables and estimating the predicted values.
The main variables used in these regressions are summarized in Table A.1 in the Data Appendix.
RESULTS
The empirical results are presented in three parts. First, panel regressions show evidence of a clear negative relationship between interest rates and sanitation investment. The second subsection shows that the fall in interest rates after 1887 led to greater town borrowing, using pre-1886 borrowing from the PWLB as a source of exogenous variation. The final subsection then presents evidence that sanitation investment led to lower mortality, and hence that interest rates were an important determinant of Britain’s mortality decline.
Panel Regressions
Higher interest rates were associated with lower investment in sanitation infrastructure, as shown in Table 1. A one standard deviation decrease in the interest rate (approximately 0.7 percentage points) was associated with an increase of approximately 0.15 standard deviations in the stock of sanitation infrastructure—proxied by per capita loans outstanding. Further, specifications (3)-(8) show that lower interest rates were associated with higher investment in each category of sanitation infrastruc-ture: the negative correlation is not driven by demand for particular types of sanitation infrastructure but reflects a willingness to borrow more in general.
The results are robust to alternative specifications and exclude outliers.Footnote 34 Including the lagged stock of loans outstanding as an additional control does not significantly change the estimates, consistent with the argument that the towns had not reached any “saturation” point in the level of investment. The results are also similar when allowing for differential time trends according to baseline infant mortality (flexibly accounting for demand for public goods), limiting the sample to only three cross-sections (1887, 1895, and 1903) to avoid any concerns regarding auto-correlation, and lagging the interest rate to avoid one potential source of reverse causality. They also remain largely unchanged when accounting for outliers through logging the dependent variables, or excluding extreme values of either the independent or the dependent variables. The negative relationship between sanitation investment and the interest rate is strong and very robust.
Reassuringly, the results are even stronger for annual capital expenditure, as shown in specifications (1)-(3) in Table 2.Footnote 35 A one standard deviation increase in the interest rate is associated with a reduction of 0.27 standard deviations in the per capita amount spent out of loans each year. I also estimate a Tobit specification (2) because most towns (around 50 percent) did not invest in sanitation every year, meaning there is a large mass of values at zero for spending out of loans. The average marginal effect, in this case, is even higher.
Table 2 INTEREST RATE ASSOCIATED WITH LOWER CAPITAL, BUT NOT CURRENT, SPENDING
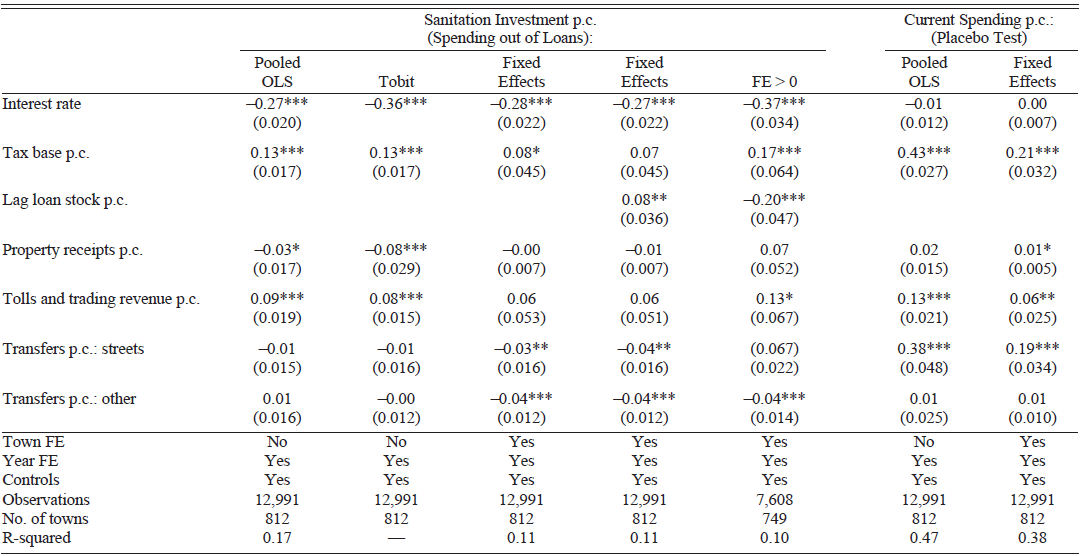
Notes: All variables are standardized. Tax base, expenditure, and loan stock variables are square-root-transformed. Control variables include population and population density.
Coefficients for Tobit specification are average marginal effects.
* p < 0.10, ** p < 0.05, *** p < 0.01.
Sources: Author’s estimations; see the text for details.
The remaining specifications in Table 2 provide reassurance that the negative relationship is causal. Specification (4) conditions on the lagged stock of loans outstanding, accounting for previous differences in levels of investment and access to capital markets. Specification (5) then limits the sample to towns that did decide to borrow, and so identifies the effect of interest rates on the value of loans taken out, conditional on paying any fixed costs associated with borrowing at all. The estimated coefficient is if anything, larger when we condition for previous borrowing activity— indicating that the negative relationships in Table 1 are not due to towns only seeking out (or paying fixed costs to obtain) low interest rates when they had sufficiently high demand.Footnote 36
The results also point to financial constraints as an important deter-minant of infrastructure investment. Town tax base per capita is consis-tently associated with a higher loan stock and higher capital expenditure, as is revenue from tolls and trading activities: towns with more financial resources invested more in infrastructure. Road grants may have partially crowded out investment in streets, although additional specifications show a positive relationship with total expenditure on sanitation, implying that the limited grants for sanitation were effective in raising expenditure. We have to be careful in attributing causal effects here—greater investment could inflate tax bases, increase revenue opportunities, and demand for grants—but these results suggest that towns with fewer resources were less willing to invest.
Finally, specifications (6) and (7) in Table 2 present results of a placebo test, providing further evidence that the coefficient for the interest rate is not simply capturing higher demand for sanitation. There is no evidence of any relationship between the interest rate and current (non-loan) expen-diture on sanitation—a variable that should capture town willingness to spend on public goods, but not be affected by the cost of borrowing. The coefficient on the tax base variable, on the other hand, is large and statis-tically significant, indicating that the null effect is not due to noise in the current expenditure variable. The interest rate does not, therefore, appear to be picking up any heterogeneity in the demand for public goods that is not directly related to borrowing.
Together, these results indicate that falling interest rates had an economically significant impact on the provision of sanitation infrastructure. Between 1887 and 1903, the median interest rate fell 0.6 percentage points; the estimates imply that the associated increase in infrastructure was around 25 percent of the change in the median infrastructure stock over the period. Further, the estimated effect of the interest rate on the stock of infrastructure is a similar magnitude as that for the per capita tax base; for annual investment, it is between two and four times larger than the comparable coefficient. This suggests that the tax base may have had a larger influence on overall investment infrastructure—not surprising since loans had to be repaid from taxes—but fluctuations in the interest rate determined when investments occurred.
If anything, we might expect that the estimates here underestimate the magnitude of the effect of lower interest rates. The average interest rate probably underestimates the interest rate for a marginal loan as we cannot observe any loans turned down because the cost was too high. Further, towns with easy access to credit may have been willing to borrow more, leading to higher (average) interest rates on the loans they did have outstanding. The instrumental variables analysis addresses these issues, as well as any remaining concerns regarding causality.
Two-Stage Least Squares Regressions
To provide a stronger test of causality, the remaining analysis focuses on heterogeneity across towns in the fall in interest rates during the 1890s. The nationwide decline in interest rates (see Figure 3) acts as a shock, which is exogenous to each town. However, the extent to which towns were able to take advantage of falling rates could have been determined by town characteristics. Town borrowing from the PWLB before 1887 provides a source of exogenous variation in the change in town interest rates—we have seen historical evidence that such borrowing restricted access to private credit. I thus construct two instruments for the change in interest rates and estimate the effect of cheaper borrowing on investment first over the whole data period, 1887-1903, and then over a shorter period after rates stabilized in 1897.
The first stage of the Instrumental Variables regressions, reported in Table 3, is very strong.Footnote 37 As anticipated, towns that borrowed more from the PWLB experienced smaller declines in interest rates after 1887, consistent with PWLB loans inhibiting access to private borrowing. The percentage of town loans that had been obtained from the PWLB in 1882 is a particularly strong predictor of the change in rates. The binary variable capturing any borrowing between 1882 and 1886 is weaker, but I include it in the main specifications to allow an over-identification test. Specifications (1), (2), and (6) thus act as the first stages in the two-stage least squares specifications.
Table 3 FIRST STAGE RESULTS
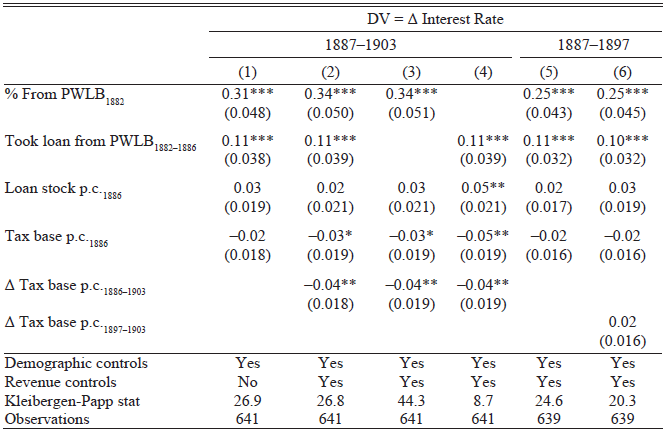
Notes: Tax base and loan stock p.c. are square-root-transformed. Tax base, loan stock p.c., A Tax Base p.c. are standardized. Demographic controls include population, population density, and population growth. Revenue variables include the average per capita revenue from property, grants for roads, other grants, and fees.
* p < 0.10, ** p < 0.05, *** p < 0.01.
Sources: Author’s estimations; see the text for details.
The second stage results, reported in Table 4, show that falling interest rates were associated with large increases in sanitation expenditure. In all cases the coefficients are negative, and imply an economically significant effect: for example, the estimates in specification (4) imply that the median fall in interest rates (0.6 percent) explained around 40 percent of the median investment between 1887 and 1903. I interpret these effects in the context of aggregate infrastructure investment in the following subsection. The outstanding loan stock and tax base in 1886 are also associated with greater subsequent investment, suggesting that there was continued room for improving sanitary environments even in wealthy towns and those with significant early spending.
Table 4 FALLING INTEREST RATES CAUSED HIGHER SANITATION INVESTMENT
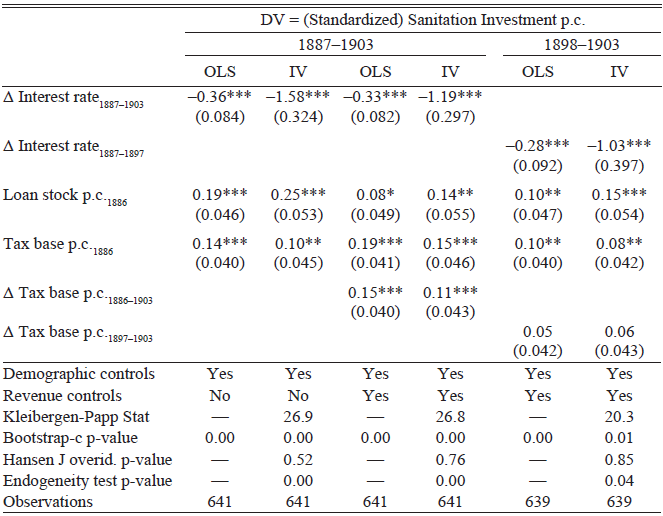
Notes: Tax base, expenditure, and loan stock variables are square-root-transformed. All variables except A interest rate are standardized. Interest variables are instrumented using the percent of Loans from the PWLB in 1882, and any PWLB loan being taken out 1882-1886; see Table 3 specifications (1), (2), and (6) for first stage results. Demographic controls include population, population density, and population growth. Revenue variables include the average per capita revenue from property, grants for roads, other grants, and fees.
* p < 0.10, ** p < 0.05, *** p < 0.01.
Sources: Author’s estimations; see the text for details.
The large difference between the OLS and IV coefficients can be explained by a mixture of reverse causality and measurement error in the interest rate variable. We would expect the OLS estimates to be biased downwards because greater demand for loans would lead to higher interest rates. Further, there is likely to be significant attenuation bias because the change in interest rate combines two noisy estimates—the rate in 1903 and that in 1887. Both of these effects would bias the OLS estimates towards zero. Hansen’s over-identification test, reported in the bottom panel of Table 4, provides reassurance that the exclusion restriction is met, and thus that these are indeed valid instruments. In addition, to check that the IV estimates are not driven by outliers, I implement a coefficient bootstrap (“bootstrap-c”), as suggested by Young (Reference Young2019)—the p-values are similar to the main estimates, and the bootstrapped confidence intervals routinely exclude the OLS point estimate. Nor are the coefficients skewed by the inclusion of large towns—the results are similar when limiting the sample to towns with 1891 populations fewer than 10,000 (see Online Appendix Table B.16). The IV coefficients are thus quite robust to changes in the regression sample and across different specifications.
DV = (Standardized) Sanitation Investment p.c.
1887-1903 1898-1903
OLS IV OLS IV OLS IV
These results provide further evidence that the central government could have facilitated sanitation investment in the last decade of the nine-teenth century. Not only could they have directly subsidized interest rates via the PWLB, the first stage regressions indicate that PWLB borrowing directly hindered access to cheaper loans. A more flexible approach by the Treasury, either in relaxing the insistence that they be a priority for loan repayment, or allowing loans to be repaid more easily, could have aided towns in accessing private capital.
Borrowing Costs and Mortality Decline
The results so far have demonstrated that lower costs of borrowing stimulated investment in sanitation infrastructure after 1887. This final subsection assesses the broader significance of that investment through two questions: How much investment was stimulated by falling interest rates? And did that investment reduce mortality?
The regression estimates suggest that falling interest rates explain a significant part of sanitation investment after 1887, particularly among smaller towns. The results in Table 4 suggest that 13 percent of investment between 1887 and 1903 can be explained by falling rates—8 percent of the 1903 loan stock (or 16 percent of that in 1887). The proportions are much greater in smaller towns: the interest rate explains 16 percent of the 1903 loan stock in towns fewer than 50,000, and 22 percent in towns fewer than 10,000.
The variation by town size reflects the significant investments made by the largest towns before 1887 and suggests that the contribution of falling interest rates was even greater across a longer period. Data constraints mean that the regressions have focused on the period after 1887, but as we have seen (Figure 3), larger towns benefited from lower interest rates even before this point. If we could include this earlier period, borrowing costs could emerge as an even more significant explanatory factor for the growth of Britain’s sanitation infrastructure.
Previous research suggests that this infrastructure made a significant contribution to Britain’s mortality decline. Chapman (Reference Chapman2019) finds—using similar data to that used here—that sanitation infrastructure accounted for approximately 60 percent of urban mortality decline between 1861 and 1900; and approximately 100 percent of the decline in mortality from waterborne diseases.Footnote 38 These results suggest that falling interest rates could explain a significant portion of mortality decline, particularly in smaller towns. However, they do not refer specifically to the investment undertaken here and could overestimate the benefits of sanitation if there were diseconomies to scale, or if investment was less important in smaller towns.Footnote 39 Further, in the case of water supply, towns could have relied on private companies to raise capital (e.g., issuing stock) rather than funding investments themselves.Footnote 40
The results in Table 5 suggest that sanitation investment contributed to declining infant mortality after 1900. The dependent variable in these regressions is the change in infant mortality between a base period of 1881-1886 and a post-treatment period of 1904-1911. The OLS estimates show a strong negative correlation between greater investment and the change in infant mortality. The coefficients are strongly statistically significant, and robust to controlling for earlier investments or the town tax base. The estimated effect magnitude is relatively small, implying around a 5 percent fall in infant mortality in the median town. However, this may be an underestimate due to endogeneity in town decision-making: towns invested in response to (or anticipation of) high mortality. To estimate the causal effect of investment, I thus implement further specifications, instrumenting for the endogenous investment.Footnote 41
Table 5 SANITATION INVESTMENT REDUCED INFANT MORTALITY

Notes: The dependent variable is the difference between infant mortality between 1881-1886 and 19041911. Tax base, expenditure, and loan stock variables are square-root-transformed. Sanitation investment is instrumented using the predicted values from a regression of the 1887 and 1903 change in interest rate on the two instruments used in Table 3 (percent of 1882 loans taken from the PWLB, and borrowing from the PWLB between 1882 and 1886), controlling for 1886 town population, sanitation loan stock per capita, and tax base per capita. Demographic controls include population, population density, and population growth. Revenue controls include the average per capita revenue from property, grants for roads, other grants, and fees. * p < 0.10, ** p < 0.05, *** p < 0.01. Sources: Author’s estimations; see the text for details.
The IV estimates suggest that sanitation investment played a major role in reducing infant mortality, although the results are noisier than the OLS estimates. I use the exogenous part of the fall in interest rates— that predicted by the two measures of pre-1886 PWLB borrowing used in the previous section—to instrument for the level of investment spending between 1887 and 1903. As we would expect given the results in Table 4, the first stage regressions (reported in panel B) are strong with F-statistics above 16 in all cases. Consistent with potential reverse causality, the estimated effect magnitude is much larger than in the OLS specifications: the IV coefficients suggest that spending in the median town reduced infant mortality by 20 percent. We cannot generalize these Local Average Treatment Effects to all investment spending, but they suggest that access to cheaper borrowing made a substantive contribution to mortality decline.
The regressions also suggest that growing income may have reduced infant mortality, although we have to be careful in ascribing causality. Towns with a higher initial tax base, and those with a growing tax base over time, also saw lower mortality. One interpretation of this result is that growing income led to improved nutrition. However, the tax base could also be reflecting town investment in public goods, including sanitation. In that case, including the change in tax base could lead to post-treatment bias—potentially explaining the large standard error and statistical insignificance of the coefficient on spending in the final specification.
Together, these findings suggest that interest rates were an important determinant of sanitation investment in the nineteenth century and that the investment induced by falling interest rates was important in Britain’s mortality decline. Estimates from the previous literature suggest sanitation infrastructure explains a large part of urban mortality decline in general, while the results in Table 5 provide similar evidence for the particular investments undertaken in the 1890s. Infant mortality rates in Britain remained high until the 1900s (Millward Reference Millward, Giuntini, Hertner and Nünez2004): the results here suggest that falling interest rates prompted the start of their eventual decline.
DISCUSSION
The findings in this paper suggest that Parliament could have done more to expedite investment in urban infrastructure and hence improved sanitary environments. The empirical analysis has shown how falling interest rates in the 1890s stimulated borrowing and investment in critical sanitation infrastructure and consequently reduced infant mortality. We have also seen, however, a lack of coherence in government policy toward town indebtedness, with several policy choices that made borrowing more difficult, more costly, or both.
Most straightforwardly, Parliament could have been more consistent in providing subsidized loans to towns. The PWLB offered a mecha-nism to provide cheap loans to town councils following the 1872 Public Health Act, but Treasury qualms regarding local authority indebtedness restricted the generosity of the loans between 1879 and 1897 (Bellamy Reference Bellamy1988, pp. 90-95). Councils were very sensitive to the cost of these loans, and borrowing from the PWLB increased rapidly once rates were cut in 1897. The benefits of lower rates were evident even without the benefit of hindsight: an 1884 Royal Commission went as far as stating that “the general principle…is that the State should lend at the lowest rate possible without loss to the national exchequer."Footnote 42 There was clearly room for loans to be provided more cheaply—the Commission recommended cutting the cost of borrowing to 3.125 percent at a time when the consol rate was 3 percent—and the results here suggest doing so would have been extremely effective.
Even without subsidizing rates, Parliament could have facilitated access to private capital markets through less stringent regulation of town borrowing, particularly stock issues. The confusing mass of statutes and legislative provisions regarding local authority borrowing was not ratio-nalized until the 1930s, despite several opportunities—particularly in 1875—to do so (Page 1985, p. 137). A lack of clarity over the prioritiza-tion on debt repayment deterred investors from lending to towns with outstanding PWLB loans, while administrative barriers made it difficult to issue stock before 1892. A simpler system could have reduced the administrative burden on councils, and hence encouraged investment.
The paper also shows that towns with a lower tax base invested less, suggesting the government could have done more to support investment in poorer towns in particular. In principle, such difficulties could have been overcome through grants from the center to these towns, but polit-ically such a policy would have likely been infeasible. More feasibly, perhaps, cheap loans could have been targeted at those towns with fewer financial resources. Alternatively, large towns could have been encour-aged to raise stock and re-lend funds to their smaller counterparts—a policy with a clear precedent in the Metropolitan Board of Works (and its successor the London County Council), which was the major source of finance for London local authorities.Footnote 43
We should also, however, acknowledge that Parliament had consider-able success in stimulating municipal investment. Despite the drawbacks identified here, it is important to emphasize that due to the PWLB all towns were able to borrow and invest. Furthermore, by enforcing the need for local audits, and for towns to receive approval for their works before borrowing, the legal framework likely facilitated the provision of even private loans. In the United States, it has been argued that constitu-tional provisions to protect municipal bondholders solved the problem of credible commitment and hence reduced town borrowing costs (Troesken Reference Troesken2015, pp. 116-123). These innovations in the United Kingdom seem likely to have served a similar purpose by reassuring lenders that their funds would be spent and managed appropriately.
Further research is required to better understand the difficulties that towns faced in financing infrastructure both in Britain and beyond. A starting point is to understand whether local or national capital markets were sufficiently deep to facilitate investment. A second step is to under-stand how political decisions facilitated—or inhibited—the ability to borrow. Barriers to capital markets could slow improvements in public health; a greater understanding of how, where, and why towns were able to overcome those barriers is thus sorely needed.
DATA APPENDIX
This appendix provides additional details of the construction of the dataset and reports descriptive statistics for the regression sample.
Data Sources and Variable Definitions
DATA FROM LOCAL TAXATION RETURNS (“LTRs”)
From 1873 the LTRs contain annual accounts for the urban sanitary authorities set up under the 1872 Public Health Act. Municipal boroughs (incorporated towns) also reported separate accounts relating to their activities as a borough and as a sanitary authority: I combine the two. The following details the definition of each variable used in the regressions. The precise item headings vary over time in the accounts, requiring some categories to be reconstituted: here I give example headings to convey the main items contained in each variable.
Outstanding loan stock: The LTRs report only total loans outstanding prior to 1884. After 1884, the loan stock is disaggregated into several components: I define “sanitation loans” as those referring to “Waterworks” (on average 25 percent of all loans outstanding), “Sewerage and sewage disposal works” (31 percent), and “Street improve-ments” (13 percent). Table A.1 in the Online Appendix provides more detail on the precise types of infrastructure that are likely to be included, as well as the estimated length of loan repayment, which proxies the expected life of the assets.Footnote 44 The latter fact justifies the assumption that the outstanding loan stock is a good proxy for the infra-structure stock in a town, as the loan term was chosen on the basis that the loan should depreciate at a similar rate to the underlying assets.
Current and capital expenditure: I distinguish between capital and current spending based on whether the expenditure was funded “not out of loans” or “out of loans.” Expenditure on sanitation is comprised of spending in the three categories “Waterworks,” “Sewerage and sewage disposal works,” and “Street improvements.”
Average interest rate: The average interest rate is calculated using expenditure on interest payments, divided by the average of the total outstanding loan stock at the end of the year and the end of the previous year.
Taxes: All revenue from “rates"—including borough rates, general district rates, and other rates—except water and gas rates.
Rateable value: Municipal boroughs report different rateable values as a borough and as a sanitary authority. I use the maximum of the two.
Property revenue: Items such as “Rents and Profits of Property and Land, including Dividends,” “Sales of Land,” and “Sale of Securities in which Sinking Funds were invested.”
Tolls and trading revenue: The variable used in the regressions consists of all revenue from “Market Rents, Tolls, Dues, and Duties,” “Penalties, Fines and Fees,” and revenue from public works and services including “Gas Works,” “Electric Light Undertakings,” “Tramways,” “Public Libraries, Museums, and Schools of Science and Art,” and “Other Public Works and Purposes.”
Transfers: This category consists of payments from both the central government and other local authorities. Payments from central government include (1) “Treasury Subventions and Payments,” which includes items such “Pay and Clothing of Police,” “Prosecutions, Maintenance, and Conveyance of Prisoners, etc,” and “Maintenance of Lunatics chargeable to the Borough” and (2) (from 1898 onward) “Grants under the 1896 Agricultural Rates Act,” which allowed agricultural land to be rated at half its value for poor rates and a quarter for district rates—with the central government making up any shortfall. In addition, after 1890 county boroughs received money directly from the “Exchequer Contribution Account"—money that other councils would receive via county councils.
Prior to 1890, payments from other local authorities include “Receipts from other authorities” and “County Authority Contribution for Main Roads.” After 1890, the transfers discussed in the previous paragraphs were received via County Councils under the “Exchequer Account.” In addition, a further category of “From County Councils: Other receipts” is listed—predominantly consisting of payments for main roads.
I distinguish between grants targeted for road maintenance and other grants. To do so, I estimate transfers for roads as either those for main roads (where available) or as “other” receipts from County Councils after 1890. Unfortunately from 1898 receipts from County Councils are not disaggregated in this way for non-municipal boroughs. As such, I estimate this variable by assuming that the percentage of the total receipts from the County Council accounted for by the “Other” category remains constant for each town after this point.
PWLB DATA
I collect information on PWLB loans to urban authorities from the annual accounts of the PWLB. The two variables used as instruments are defined as follows:
% PWLB loans 1882: The proportion of a town’s loans outstanding owed to the PWLB in 1882. Towns with no loans outstanding are coded as 0 percent.
PWLB loan 1882 1886: Binary variable, equaling one if any loan was taken from the PWLB between 1882 and 1886.
CENSUS INFORMATION
Information regarding town population and area is drawn from the reports of the decennial census between 1851 and 1911. Information for the years 1851-1901 was collected directly. For the 1911 census, I use the parish-level data stored at the U.K. data archive. Intercensal population was estimated using geometric interpolation, adjusting for boundary changes identified in the census reports.
MORTALITY DATA
Mortality data for deaths in registration sub-districts was reported by quarter: I use the third quarter in each year. Infant mortality is measured as the number of deaths for those aged under 1 divided by the number of births.
Baseline infant mortality (1881-86) is measured by linking each town to a registration sub-district (RSD) using information reported in the 1881 census (Volume II) and adjusting for post-census boundary changes. Post-treatment infant mortality (19041911) is measured by linking each town to relevant registration subdistricts using annual reports of the Registrar General.
Descriptive statistics
Table A.1 presents the descriptive statistics for the main regression variables.
Table A.1 DESCRIPTIVE STATISTICS FOR REGRESSION SAMPLE

Notes: Tax base, investment, and loan stock per capita are square-root-transformed. Infant mortality is reported as deaths per 1,000 births.
Sources: See section “Data” and the Data Appendix.


 Open access