the Creative Commons Attribution 4.0 License.
the Creative Commons Attribution 4.0 License.
 | 29 Nov 2021
Reduced effective radiative forcing from cloud–aerosol interactions (ERFaci) with improved treatment of early aerosol growth in an Earth system model
Sara Marie Blichner
Moa Kristina Sporre
Terje Koren Berntsen
Historically, aerosols of anthropogenic origin have offset some of the warming from increased atmospheric greenhouse gas concentrations. The strength of this negative aerosol forcing, however, is highly uncertain – especially the part originating from cloud–aerosol interactions. An important part of this uncertainty originates from our lack of knowledge about pre-industrial aerosols and how many of these would have acted as cloud condensation nuclei (CCN). In order to simulate CCN concentrations in models, we must adequately model secondary aerosols, including new particle formation (NPF) and early growth, which contributes a large part of atmospheric CCN. In this study, we investigate the effective radiative forcing (ERF) from cloud–aerosol interactions (ERFaci) with an improved treatment of early particle growth, as presented in Blichner et al. (2021). We compare the improved scheme to the default scheme, OsloAero, which are both embedded in the atmospheric component of the Norwegian Earth System Model v2 (NorESM2). The improved scheme, OsloAeroSec, includes a sectional scheme that treats the growth of particles from 5–39.6 nm in diameter, which thereafter inputs the particles to the smallest mode in the pre-existing modal aerosol scheme. The default scheme parameterizes the growth of particles from nucleation up to the smallest mode, a process that can take several hours. The explicit treatment of early growth in OsloAeroSec, on the other hand, captures the changes in atmospheric conditions during this growth time in terms of air mass mixing, transport, and condensation and coagulation.
We find that the ERFaci with the sectional scheme is −1.16 W m−2, which is 0.13 W m−2 weaker compared to the default scheme. This reduction originates from OsloAeroSec producing more particles than the default scheme in pristine, low-aerosol-concentration areas and fewer NPF particles in high-aerosol areas. We find, perhaps surprisingly, that NPF inhibits cloud droplet activation in polluted and/or high-aerosol-concentration regions because the NPF particles increase the condensation sink and reduce the growth of the larger particles which may otherwise activate. This means that in these high-aerosol regions, the model with the lowest NPF – OsloAeroSec – will have the highest cloud droplet activation and thus more reflective clouds. In pristine and/or low-aerosol regions, however, NPF enhances cloud droplet activation because the NPF particles themselves tend to activate.
Lastly, we find that sulfate emissions in the present-day simulations increase the hygroscopicity of secondary aerosols compared to pre-industrial simulations. This makes NPF particles more relevant for cloud droplet activation in the present day than the pre-industrial atmosphere because increased hygroscopicity means they can activate at smaller sizes.
- Article
(12020 KB) - Companion paper
-
Supplement
(9772 KB) - BibTeX
- EndNote


Since pre-industrial times, humans have significantly shaped our climate by emitting greenhouse gases to the atmosphere. However, the warming induced from these emissions has been masked by the cooling effects of anthropogenic emissions of aerosols and their precursors (Myhre et al., 2013). This cooling is highly uncertain and dominates the spread in estimates of radiative forcing and observationally based estimates of climate sensitivity (Myhre et al., 2013).
The present-day atmospheric aerosol state is challenging to fully characterize due to its fast-changing nature, making point observations hard to generalize. The pre-industrial atmosphere, however, is even more challenging since we cannot rely on direct observations, and it is thus only accessible by putting our best knowledge of aerosol processes and sources into models. The pre-industrial atmospheric state is furthermore very important for estimating the cooling by aerosol–cloud interactions (Carslaw et al., 2013) because the cloud albedo is more sensitive to perturbations in a “cleaner” atmosphere (Carslaw et al., 2013; Twomey, 1991). There are two main reasons for this. Firstly, cloud droplets form around cloud condensation nuclei (CCN) when the air mass is cooled, normally through adiabatic lifting. The number of particles that will act as CCN and form cloud droplets is dependent on the maximum achieved supersaturation during cloud formation and how many particles can activate at this supersaturation, which is dependent on size and hygroscopicity. If there are many large CCN, then these will activate “early” during cloud formation and constitute a water vapor sink, which limits the maximum supersaturation and therefore the number of CCN that can activate. We will refer to this effect as supersaturation adjustment. Secondly, cloud albedo A increases with a change in cloud droplet number concentration (CDNC) roughly as , which entails a lower increase in albedo with a higher baseline CDNC (Twomey, 1991; Carslaw et al., 2013). Therefore, an initial state with higher CCN concentrations will be less sensitive to CCN perturbations than an initial state with lower CCN concentrations (Twomey, 1959; Bellouin et al., 2020; Carslaw et al., 2013).
One important, but poorly understood, process for adequately simulating the pre-industrial atmosphere is new particle formation (NPF), i.e., the formation and growth of new particles in the atmosphere which can grow to act as CCN. Roughly speaking, the efficiency of NPF – i.e., how “many” particles are formed per available condensate – in the pre-industrial atmosphere will determine if the secondary aerosol mass is distributed as very few, very large particles or many smaller particles. Especially in a clean atmosphere, this can play a large role for CCN and CDNC concentrations. Over recent years, the understanding of the drivers of NPF has increased significantly due to improved instrumentation and extensive research (Kerminen et al., 2018; Lee et al., 2019). However, adequately capturing NPF in climate models is difficult due to the requirement for computational efficiency combined with the fine scale of the governing processes, in addition to incomplete scientific understanding of the mechanisms involved (Kerminen et al., 2018; Lee et al., 2019).
NPF starts with the formation of a cluster of molecules, which must then activate with respect to the condensing atmospheric vapors and grow into larger sizes (∼ 10 nm in diameter) (Kerminen et al., 2018; Semeniuk and Dastoor, 2018). Due to the Kelvin effect, few gases have low enough volatility to participate in the very first stages of NPF, while as the particles grow, more gases contribute (Semeniuk and Dastoor, 2018). During this growth, the particles are subject to coagulation with larger particles, which constitutes a loss in number concentration (Kerminen et al., 2018). The coagulation sink is approximately proportional to , where dp is the particle diameter and m is a parameter dependent on the background aerosol concentrations (typically 1.6–1.8) (Lehtinen et al., 2007). It is therefore important for successful NPF that the growth rate (GR) is high enough for the particles to quickly grow to larger sizes when the coagulation sink is lower (Lehtinen et al., 2007). Both Lee et al. (2013) and Olenius and Riipinen (2017) show that omitting explicit modeling of this early aerosol growth and rather parameterizing the survival percentage of particles (e.g., Kerminen and Kulmala, 2002; Lehtinen et al., 2007) leads to significant overestimation of particles. This is mainly because these parameterizations assume steady-state conditions during growth, i.e., the growth rate and coagulation sink are constant, and changes in chemistry, mixing or emissions cannot be taken into account. This assumption is usually not appropriate, especially since growth can take many hours or even days.
The importance of adequately capturing NPF in modeling the pre-industrial atmosphere is illustrated in a study by Gordon et al. (2016), which shows a major reduction (27 %) in estimated forcing from cloud albedo change when including a nucleation pathway from pure biogenic organics. NPF is subject to several constraints which would indicate more efficient NPF in the pre-industrial atmosphere compared to the present day. Firstly, since the pre-existing aerosol concentrations and thus condensation sink will be lower, the gas-phase precursor concentrations are higher per emission than in the present-day atmosphere. In other words, if an aerosol precursor species were to have the same emissions and production in the pre-industrial and present-day atmosphere, the pre-industrial atmosphere would have higher gas-phase concentrations because the condensation sink would be lower. Secondly, the coagulation sink of the clusters and newly formed particles is smaller in a cleaner atmosphere (Carslaw et al., 2013; Gordon et al., 2017).

Figure 1Illustration of changes from OsloAero to OsloAeroSec. In both versions, the nucleation rate is calculated at around 2 nm followed by a calculation of the formation rate (the particles surviving) at 5 and 23.6 nm in OsloAeroSec and OsloAero, respectively, with Lehtinen et al. (2007). In OsloAero, these particles are inserted directly into the modal scheme, while in OsloAeroSec, the particles are inserted into the sectional scheme wherein they can be affected by growth and coagulation over time and space. Finally, the particles in the sectional scheme are moved from the last bin of the sectional scheme to the modal scheme. * 23.6 nm is the number median diameter of the mode the particles from the sectional scheme are moved to, but particles are actually grown to the volume median diameter before they are moved to the modal scheme in order to conserve mass. From Blichner et al. (2021).
To better capture the early growth of particles from formation to CCN sizes, we have previously implemented a sectional scheme in the aerosol scheme, OsloAero, of the Norwegian Earth System Model (Blichner et al., 2021). We refer to the aerosol scheme with the sectional scheme as OsloAeroSec. OsloAeroSec includes five bins and two condensing species (H2SO4 and low-volatility organics) and treats only the growth and loss of particles from formation at 5 nm up to the pre-existing modal aerosol scheme at 39.6 nm diameter, in which climate (cloud–radiation) interactions are considered. See Fig. 1 for an illustration of the scheme. This work was motivated by (1) the smallest mode in the aerosol scheme, OsloAero6, which is quite large (number median diameter 23.6 nm), meaning that growth up to 23.6 nm is parameterized. As mentioned above, this has been shown to lead to significant overestimates of particle formation (Lee et al., 2013; Olenius and Riipinen, 2017). (2) A sectional scheme explicitly grows the particles and does not a priori assume a shape to the size distribution. In this way it is more physically realistic than including, e.g., a nucleation mode. Additionally, the sectional scheme allows for differentiating which organic vapors can contribute to growth from 5 nm upwards compared to from nucleation up to 5 nm.
Our results presented in Blichner et al. (2021) show considerable improvement in the representation of CCN size particles (>50 nm) compared to observations and significantly reduces the frequent high bias in the original model. This goes in line with Olenius and Riipinen (2017) and Lee et al. (2013). On the other hand, the sectional scheme shows an increase in particle number concentrations in remote areas like the polar regions and the free troposphere.
Motivated by both the improvement to the aerosol scheme and the spatial difference in aerosol formation from the original scheme (remote versus polluted), we investigate the implications of the growth treatment in OsloAeroSec for the pre-industrial and present-day atmosphere, respectively, especially for the estimated cooling from aerosol–cloud interactions since pre-industrial times.
The cooling effect is commonly quantified by the radiative forcing (RF) or effective radiative forcing (ERF), which are measures of the change in the net radiation into the atmosphere with the addition of a climate forcing agent. RF is, according to the International Panel on Climate Change's Assessment Report 5 (IPCC AR5) (Boucher et al., 2013) definition, the change in net downwards radiative flux at the tropopause from perturbing the forcing agent, keeping the state variables in the troposphere fixed but allowing the stratosphere to adjust. However, the ERF is in general considered a better indicator of induced surface temperature change because of so-called “rapid adjustments” in the atmospheric column, which may offset or augment the temperature change from the RF, depending on the forcing agent (Bellouin et al., 2020). In this paper, we therefore use the ERF definition as introduced in IPCC AR5, namely the change in top-of-the-atmosphere downwards net flux while allowing adjustments in clouds, temperature, humidity and so on in the atmospheric column but keeping the sea surface temperature fixed.
The Norwegian Earth System Model v2 (NorESM2) (Seland et al., 2020a; Bentsen et al., 2013; Kirkevåg et al., 2013; Iversen et al., 2013) is developed with a basis in the Community Earth System Model (CESM) (Danabasoglu et al., 2020). Firstly, the ocean component, which is not active in these runs since we use fixed sea surface temperature (fSST), is replaced by Bergen Layered Ocean Model (BLOM) (Seland et al., 2020a). Secondly, the atmospheric component, CAM6-Nor, differs from the Community Atmosphere Model v6 (CAM6) in CESM in that its aerosol scheme is replaced by OsloAero6 (Kirkevåg et al., 2018), which we describe briefly below.
In this study we investigate the sensitivities of our sectional scheme for early growth, which was newly implemented into OsloAero6 by Blichner et al. (2021). Both the original aerosol scheme, referred to as OsloAero, and our version with the sectional scheme implemented, referred to as OsloAeroSec, are described in depth in Blichner et al. (2021). We will therefore only give a brief description of the aerosol scheme here.
All runs are done with CAM6-Nor coupled with the Community Land Model v5 (CLM5) in BGC (biogeochemistry) mode and prognostic crop (Lawrence et al., 2019), with prescribed sea ice and sea surface temperatures.
In the following, we start by describing CAM6-Nor in general with the default aerosol scheme, OsloAero, before describing the changes introduced in OsloAeroSec.
2.1 CAM6-Nor
As mentioned earlier, CAM6-Nor shares many characteristics with CAM6 (Bogenschutz et al., 2018), while the aerosol scheme was exchanged for OsloAero, as described below in Sect. 2.1.1. The cloud macrophysics are treated with The Cloud Layers Unified by Binormals (CLUBB; Bogenschutz et al., 2013) model. The microphysics for stratiform and shallow convection clouds are the two-moment bulk from Gettelman and Morrison (2015) (MG2), while the deep convection microphysics are treated with a simplified single-moment representation based on Zhang and McFarlane (1995). The cloud activation of aerosols is done with Abdul-Razzak and Ghan (2000). See Bogenschutz et al. (2018) for more details about the clouds.
2.1.1 OsloAero
OsloAero is often referred to as a “production-tagged” aerosol module, meaning that the model to a large extent keeps track of the processes that each tracer has gone through (e.g., coagulation, condensation). A key difference to other aerosol modules is that it divides the tracers into “process” tracers and “background” tracers. The idea is that the background tracers decide the number concentration, while the process tracers modify the initial size distribution and chemical composition with a look-up table approach (Bentsen et al., 2013; Kirkevåg et al., 2018, 2013; Iversen et al., 2013; Seland et al., 2020a). The background tracers form initial lognormal modes, but after the process tracers are applied, the distribution of the resulting “mixtures” is not necessarily lognormal anymore. This distribution is then used for the optical properties and cloud activation.
The chemistry scheme in NorESM uses the preprocessor MOZART (Emmons et al., 2010) to produce a simplified scheme for sulfur and organic species. The oxidants considered in the model are the hydroxyl radical (OH), ozone (O3), the nitrate radical (NO3) and hydroperoxyl (HO2). These are read from file and interpolated from the monthly mean. The chemistry scheme treats the oxidation of sulfur dioxide (SO2), dimethyl sulfide (DMS), isoprene and monoterpenes. For a more detailed discussion of the chemistry see Karset et al. (2018), and for a complete overview of reactions and reaction rates, see in particular Table 2 therein.
The aerosol scheme contains three condensing tracers: H2SO4 and two organic species, namely SOAGLV and SOAGSV. The H2SO4 is produced through oxidation or emitted directly into the atmosphere. The two organic tracers are produced through oxidation of monoterpene and isoprene; each reaction has a certain yield of SOAGLV and SOAGSV. The reactions of isoprene with OH, O3 and NO3 all yield 5 % SOAGSV, while monoterpene+OH and monoterpene+NO3 yield 15 % SOAGSV. Finally, monoterpene reacting with monoterpene+O3 yields 15 % SOAGLV, thus being the only reaction yielding SOAGLV. The yields used here are similar to those used in other global models (see, e.g., Tsigaridis et al., 2014; Sporre et al., 2020; Dentener et al., 2006). All these yields are subject to substantial uncertainty (Shrivastava et al., 2017) – see, e.g., Sporre et al. (2020) for an extensive discussion on the sensitivities to these choices.
During condensation these are all treated as non-volatile, but we separate between SOAGLV and SOAGSV because only SOAGLV is considered low-volatility enough to contribute to NPF. In fact, only 50 % of the SOAGLV in each time step is assumed to be low-volatility enough to contribute to nucleation, and we will refer to this fraction of the SOAGLV as extremely low-volatility organic compounds (ELVOCs).
New particle formation is parameterized by using an intermediate concentration of H2SO4 and ELVOCs in each time step to calculate a nucleation rate followed by a calculation of how many particles survive growth up to the background mode keeping the particles from NPF (23.6 nm in number median diameter).
The nucleation rate is calculated using Vehkamäki et al. (2002) for binary sulfuric acid–water nucleation and Eq. (18) from Paasonen et al. (2010) to represent boundary layer nucleation.
This survival of particles from nucleation at dnuc≈ 2 nm, the NPF mode, is parameterized (number median diameter dmode=23.6 nm) by Lehtinen et al. (2007):
where is the formation rate at dmode, dnuc is the diameter of the nucleated particle, CoagS(dnuc) is the coagulation sink of the particles [h−1], GR is the growth rate [nm h−1] of the particle (from H2SO4 and ELVOCs; calculated using Eq. 21 from Kerminen and Kulmala, 2002), and γ is a function of dform and dnuc:
2.1.2 OsloAeroSec
We have implemented a sectional scheme for modeling the growth of particles from nucleation up to the mode which keeps the NPF particles in NorESM (number median diameter 23.6 nm). The scheme is described in detail in Blichner et al. (2021). The scheme contains five bin sizes set according to a discrete geometric distribution (Jacobson, 2005, sec.13.3) and two condensing vapors: H2SO4 and SOAGLV. The condensation of these species is treated as non-volatile, and after condensation the particles are “grown” (moved) to adjacent bins according to a quasi-stationary structure (Jacobson, 1997, 2005). Coagulation is accounted for both between particles in the sectional scheme and with particles in the modal scheme. When two particles in the sectional scheme coagulate, this contributes to growing the particles, while if they coagulate with particles in the modal scheme, their mass is added to a process tracer in OsloAero (see Blichner et al., 2021, for more details).
The sectional scheme starts at 5 nm and extends to 39.6 nm, at which the particles are transferred to the NPF mode in the pre-existing aerosol scheme. The sectional scheme extends to the volume median diameter (39.6 nm) rather than the number median diameter (23.6 nm) in order to preserve both number and mass during the transfer between the schemes.
The boundary layer nucleation parameterization has been updated from Paasonen et al. (2010) to Riccobono et al. (2014) and is now
where A3 = 3.27 × 10⁻²¹ cm6 s−1.
Finally, in this version of the model, we have also added improvements to the diurnal variation of the oxidant concentrations, as described below.
2.2 Chemistry: changes to oxidant diurnal variation
The oxidant concentration in CAM6-Nor is read from prescribed 3D monthly mean fields (Seland et al., 2020a) with a diurnal cycle superimposed on OH, HO2 and NO3. In the case of OH, this is basically a step function based on before vs. after sunrise, which in turn leads to a step function in the H2SO4 concentration and an unrealistic NPF diurnal cycle. In OsloAeroSec, we therefore implemented a simple sine shape on the daily variation in OH to improve the realism of NPF.
Lehtinen et al. (2007)Lehtinen et al. (2007)Lehtinen et al. (2007)Table 1Model version overview.
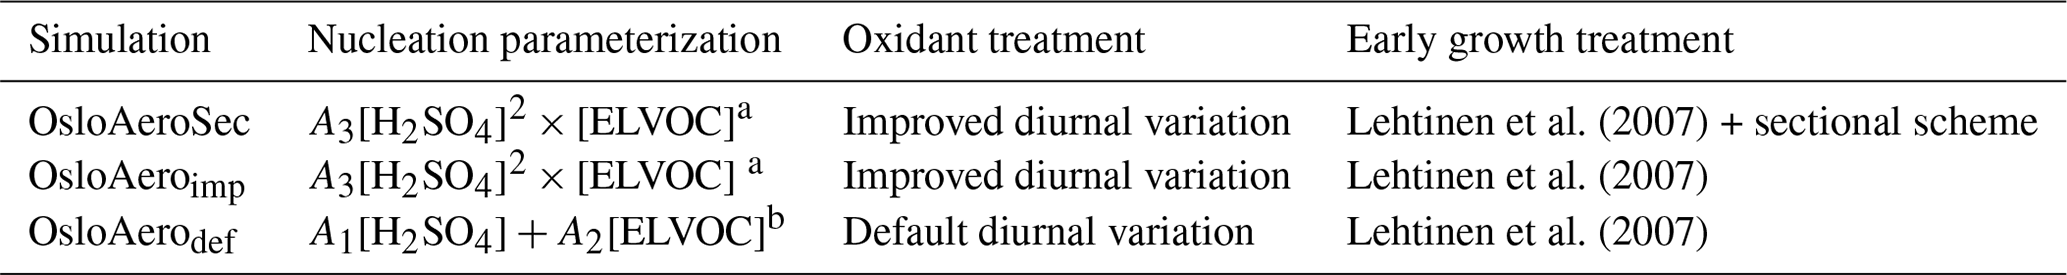
A1 = 6.1 × 10⁻⁷ s−1; A2 = 3.9 × 10⁻⁸ s−1; A3 = 3.27 × 10⁻²¹ cm6 s−1; a Riccobono et al. (2014). b Paasonen et al. (2010).
2.3 Model versions
In the Results section we compare three different model versions: OsloAerodef, OsloAeroimp and OsloAeroSec. The first, OsloAerodef, is the default model used, e.g., in the CMIP6 simulations, as described in Sect. 2.1.1 above. The second version, OsloAeroimp, is the default model but with the same changes to the nucleation scheme and the oxidant diurnal variation as used in OsloAeroSec. The third is with the sectional scheme, OsloAeroSec, as described in Sect. 2.1.2 and by Blichner et al. (2021). This is summarized in Table 1. The motivation for including all these model versions is to be able to distinguish the effect of the sectional scheme from that of the changes in nucleation and oxidants.
All simulations are performed with NorESM2 release 2.0.1 with 1.9∘ (latitude) × 2.5∘ (longitude) resolution with 32 height levels from the surface to ∼ 2.2 hPa in hybrid sigma coordinates. The time step is 0.5 h. We use a configuration with an active atmosphere (CAM6-Nor; Seland et al., 2020a) and land component (CLM5-BGC; Lawrence et al., 2019), while sea ice and sea surface temperatures are read from file. We use the fixed SST method combined with nudging to estimate effective radiative forcing (ERF) from aerosol–cloud interaction, ERFaci, and ERF from aerosol–radiation interactions, ERFari (Hansen et al., 2005; Forster et al., 2016). This means that we use prescribed SST and sea ice and perturb the anthropogenic aerosol emissions.
We use nudging against model-produced meteorology to constrain the natural variability (Kooperman et al., 2012; Zhang et al., 2014; Forster et al., 2016), nudging the horizontal wind components (U, V) and surface pressure with a relaxation time of 6 h (as described in Karset, 2020, Sect. 4.1). Only nudging U, V and surface pressure is preferable over nudging more variables (temperature, humidity, energy fluxes, surface drag) because it allows for rapid adjustments, which should be included in ERFaci. See Karset (2020, Sect. 4.1) for a discussion.
In addition, we use the method proposed by Karset et al. (2018) to estimate the effective radiative forcing; i.e., we use not only the anthropogenic aerosol emissions but also the oxidants from the present-day atmosphere.
To produce the meteorology, we first ran a 7-year simulation (plus 2 years discarded as spin-up), MMET1850, with the default model, OsloAerodef. This was done with standard CMIP6 pre-industrial (here meaning 1850) forcing and emissions.
Two simulations were performed with each model version:
-
PI – pre-industrial (1850) simulation nudged to MMET1850 and
-
PD – simulation with aerosol emissions and oxidant fields from the “present day” (2014) nudged to pre-industrial meteorology (MMET1850).
These are the simulations used to calculate the ERF and which are analyzed in the Results section. Emissions of aerosol and precursors for both the present and pre-industrial are from Hoesly et al. (2018) and van Marle et al. (2017). Oxidant fields are as described in Seland et al. (2020a) from Danabasoglu et al. (2020).
The PI simulations were all initialized from a 2-year simulation with the OsloAerodef model version with pre-industrial conditions and free meteorology (SPINUP_PI). Similarly, the PD simulations were all initialized from a 2-year simulation with the OsloAerodef model version with free meteorology and pre-industrial conditions but present-day aerosol emissions and oxidant fields (SPINUP_PD). MMET_PI, SPINUP_PI and SPINUP_PD were all initialized from a 30-year simulation with PI configuration.
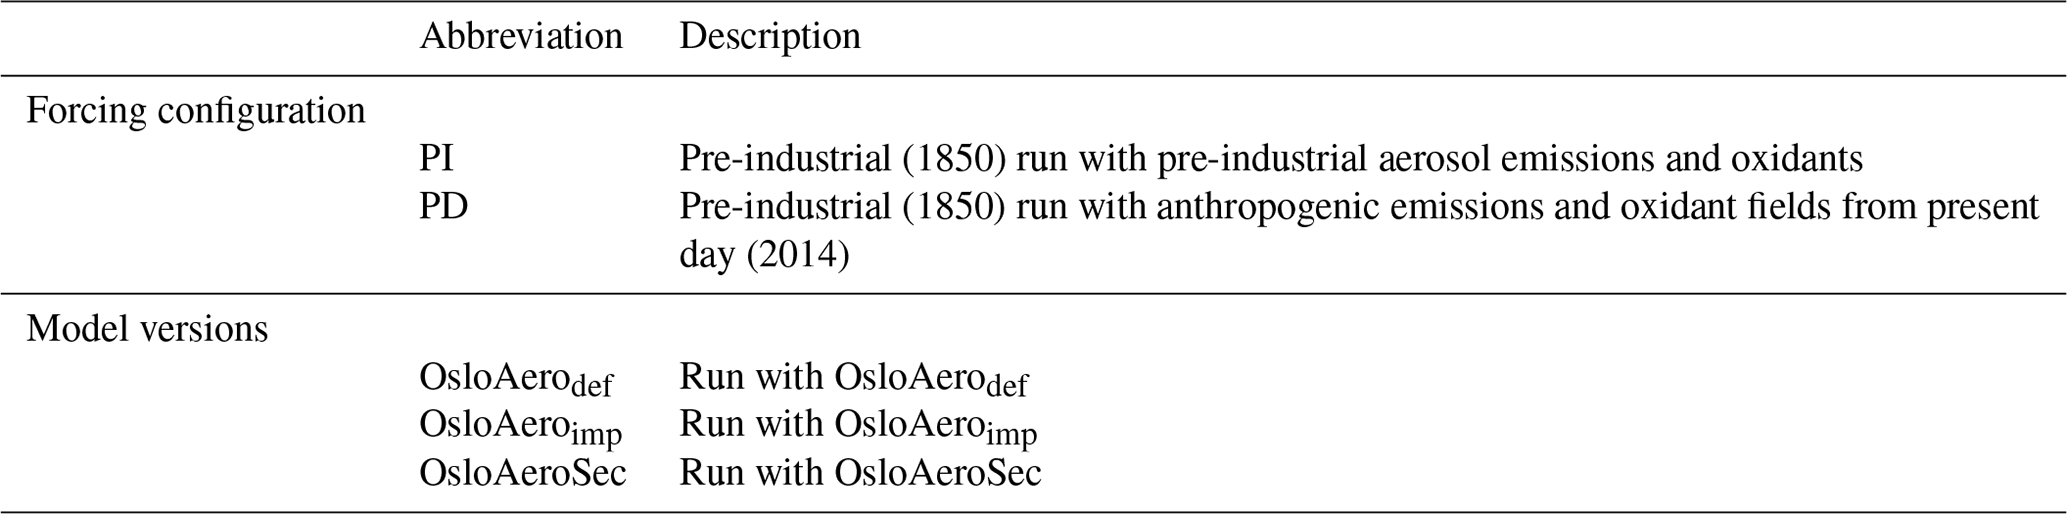
Table 3Description of runs. See Table 2 for abbreviations.
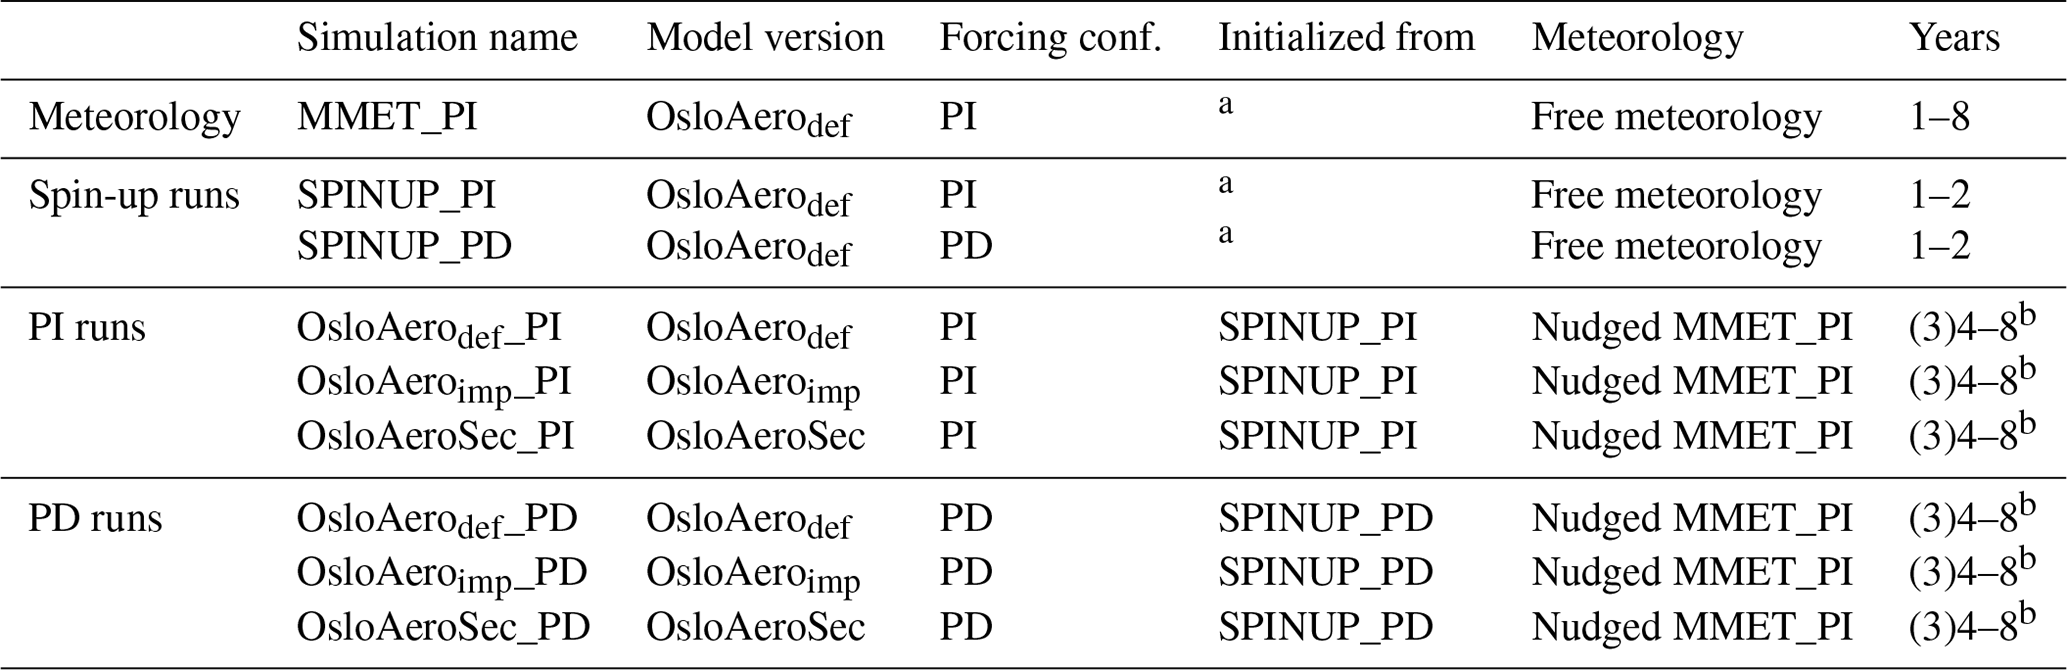
a 30-year run with PI emissions. b Year 3 is discarded as spin-up, and years 4 to 8 are used in the analysis.
Table 3 summarizes the model simulations, and Table 2 summarizes the abbreviations for the model versions and configurations.
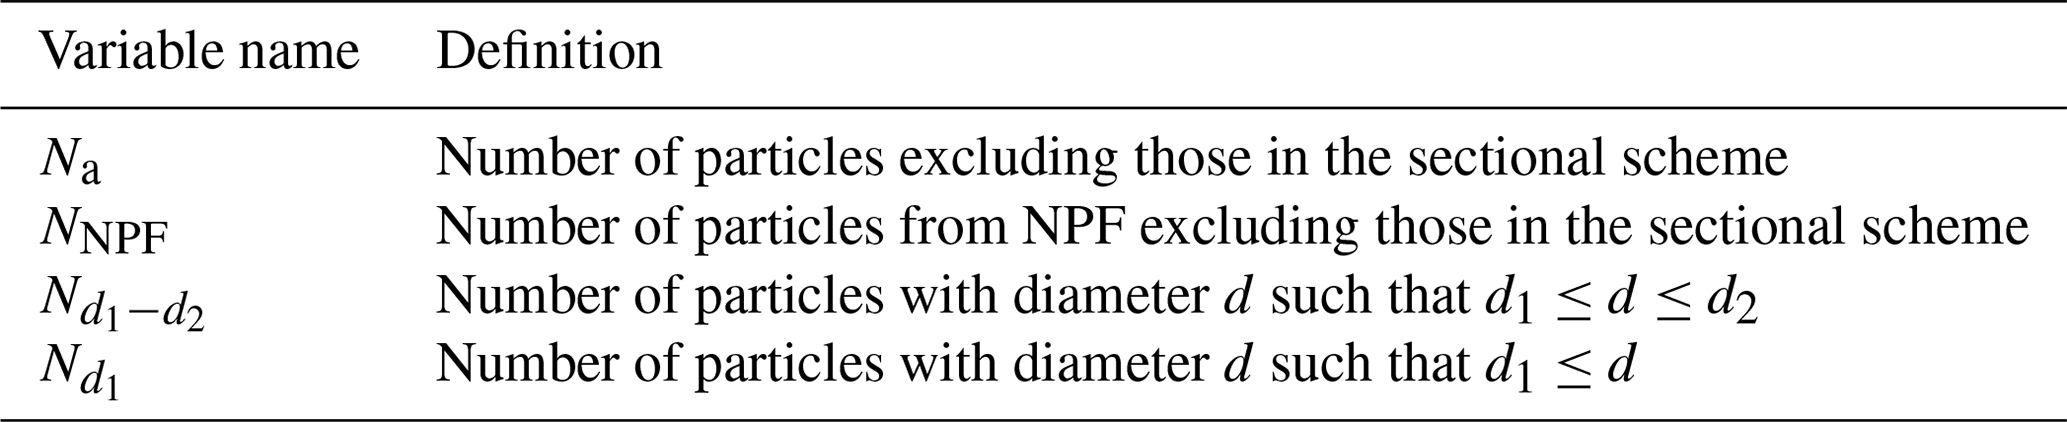
Because we are comparing model versions with and without the sectional scheme, we will only discuss particle number concentrations of particles in the modal OsloAero part of the scheme: that is, excluding the ones still in the sectional scheme. This gives us an apples-to-apples comparison with the original model version. We will use Na to refer to total aerosol concentration, excluding the particles in the sectional scheme, and NNPF for the subset of these particles originating from NPF. Furthermore, we use to refer to the particles with a diameter larger than d1 but smaller than d2. These definitions are summarized in Table 4.
We will use the term NPF efficiency or the efficiency of NPF to describe model-to-model differences in how many NPF particles are produced with the same emissions (PI or PD). If model versions A and B are both run with the same setup (e.g., pre-industrial emissions) and model A produces more NPF particles than model B, we will say that A has higher NPF efficiency than B.
We use the Ghan (2013) method for calculating ERFaci and ERFari, meaning that we output the net radiation at the top of the atmosphere, F, and in addition output calls to the radiation scheme with clean (no aerosols), Fclean, and clean and clear (no aerosol, no clouds), Fclean,clear. Thus, the direct aerosol radiative effect is and the cloud radiative effect is . It follows further that ERFari = ΔDIRGhan = Δ(F−Fclean) and ERFaci = ΔCRE = Δ(Fclean−Fclean,clear), where Δ signifies the difference between PD and PI.
We will start by presenting globally averaged ERFari and ERFaci in the model versions and how these relate to PI to PD changes in globally averaged aerosol and cloud properties (Sect. 5.1). Next, in Sect. 5.2, we present a series of hypotheses for the differences in ERFari and ERFaci between the model versions, which we will use to analyze the results.
In Sect. 5.3, we discuss the PI-to-PD changes on a regional level before discussing the PI and PD simulations separately in Sect. 5.4 and 5.5. We discuss all model versions for which this is helpful to understand the results, but we otherwise focus on OsloAeroSec versus OsloAerodef because OsloAerodef is the version used in CMIP6.
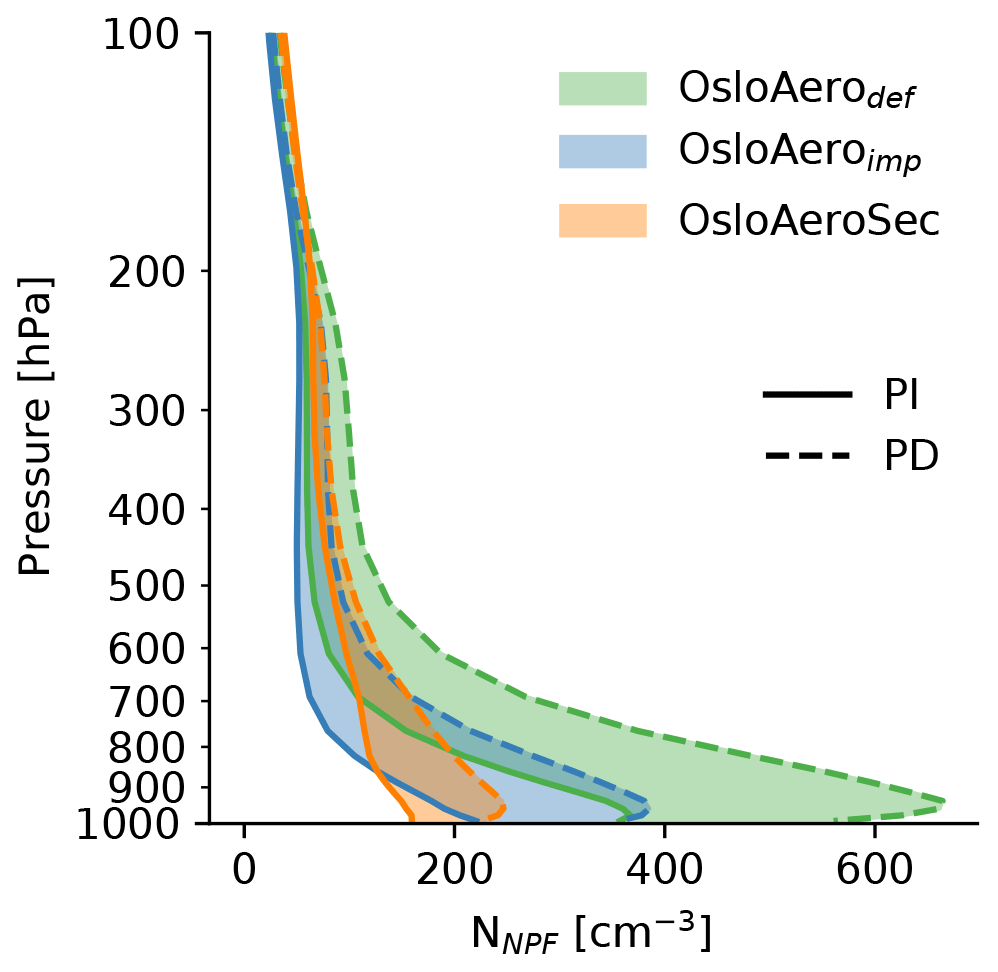
Figure 2Globally averaged concentration of aerosols from NPF. The solid lines show the concentration in the PI simulation, while the dashed lines show the concentration in the PD. The shading signifies the change in each model. Note that the inter-annual variability in the globally averaged NNPF within each simulation is very low (see Fig. S8 in the Supplement).
5.1 Global averages: aerosol number and ERF
5.1.1 Aerosol number
In general, the sectional scheme produces more particles than the original scheme in very pristine environments while producing fewer in areas with high aerosol concentrations (Blichner et al., 2021). This is reflected in the globally averaged profiles of NPF particles, NNPF, for each model version shown in Fig. 2. In the PD simulations, OsloAeroSec mostly has lower NNPF concentrations than the other model versions, surpassing OsloAeroimp only above ∼ 650 hPa. However, in the cleaner PI atmosphere, OsloAeroSec has NNPF concentrations closer to, or even higher than, the other two schemes. OsloAeroSec has higher NNPF concentrations above ∼ 850 and ∼ 700 hPa compared to OsloAeroimp and OsloAerodef, respectively. Close to the surface, where aerosol concentrations in general are higher, OsloAeroSec has lower NNPF that the other two models, even in the PI simulation.
As we shall explain more in-depth later, these changes in NPF in clean remote versus higher-aerosol-concentration areas are important for ERFaci because the NPF particles are more likely to activate in pristine regions, while they may even act to suppress activation in more polluted regions.
Furthermore, note that even though OsloAeroimp is the same as OsloAeroSec, excluding the sectional scheme, the profile is qualitatively different: OsloAeroSec has fewer particles close to the ground and much more further up in the PI atmosphere; see Sect. 5.6.
5.1.2 ERF
The globally averaged ERFaci is significantly influenced by the introduction of the sectional scheme, as seen in Fig. 3, showing total, shortwave and longwave components of ERFaci and ERFari. ERFaci in OsloAeroSec is significantly (p < 0.01) lower than both OsloAerodef and OsloAeroimp, as found using a two-tailed paired Student's t test on the globally averaged monthly output. The ERFaci is 0.13 W m−2 weaker in OsloAeroSec compared to OsloAerodef. The ERFaci with OsloAeroimp and OsloAerodef is roughly the same (difference of 0.01 W m−2). Also, the total radiative effect from aerosols, ERFaci+ari, is ∼ 0.1 W m−2 lower in OsloAeroSec compared to both OsloAerodef and OsloAeroimp. One can further see in Fig. 3 that the difference in the ERFaci between OsloAeroSec and OsloAerodef is completely caused by the difference in the SW forcing. Moreover, even though OsloAeroimp has roughly the same ERFaci as OsloAerodef (not significantly different with p < 0.05) it has a significant strengthening (p < 0.01) of the forcing in both the SW and LW component that end up canceling each other out in the total forcing. Lastly, the direct effective aerosol forcing, ERFari, is also shown in Fig. 3, and the direct effect is slightly closer to zero with OsloAeroSec than OsloAerodef and OsloAeroimp (∼ −0.03 W m−2 smaller than OsloAerodef and OsloAeroimp, significant with p < 0.01). It may seem surprising that both OsloAerodef and OsloAeroimp have positive ERFari. Note that we are using Ghan (2013) to calculate ERFari and that other methods may give a slightly different result. Smith et al. (2020) show comparisons of different estimates of the ERFari for CMIP6 models and find values similar to ours for NorESM with the Ghan (2013) method, while e.g., the approximate partial radiative perturbation (APRP) method gave a negative ERFari for the same simulations. The difference between OsloAeroSec and the default model likely originates from OsloAeroSec producing fewer particles than OsloAerodef in the PD simulation and thus allowing the remaining particles to grow larger and thus scatter radiation more efficiently (Blichner et al., 2021).
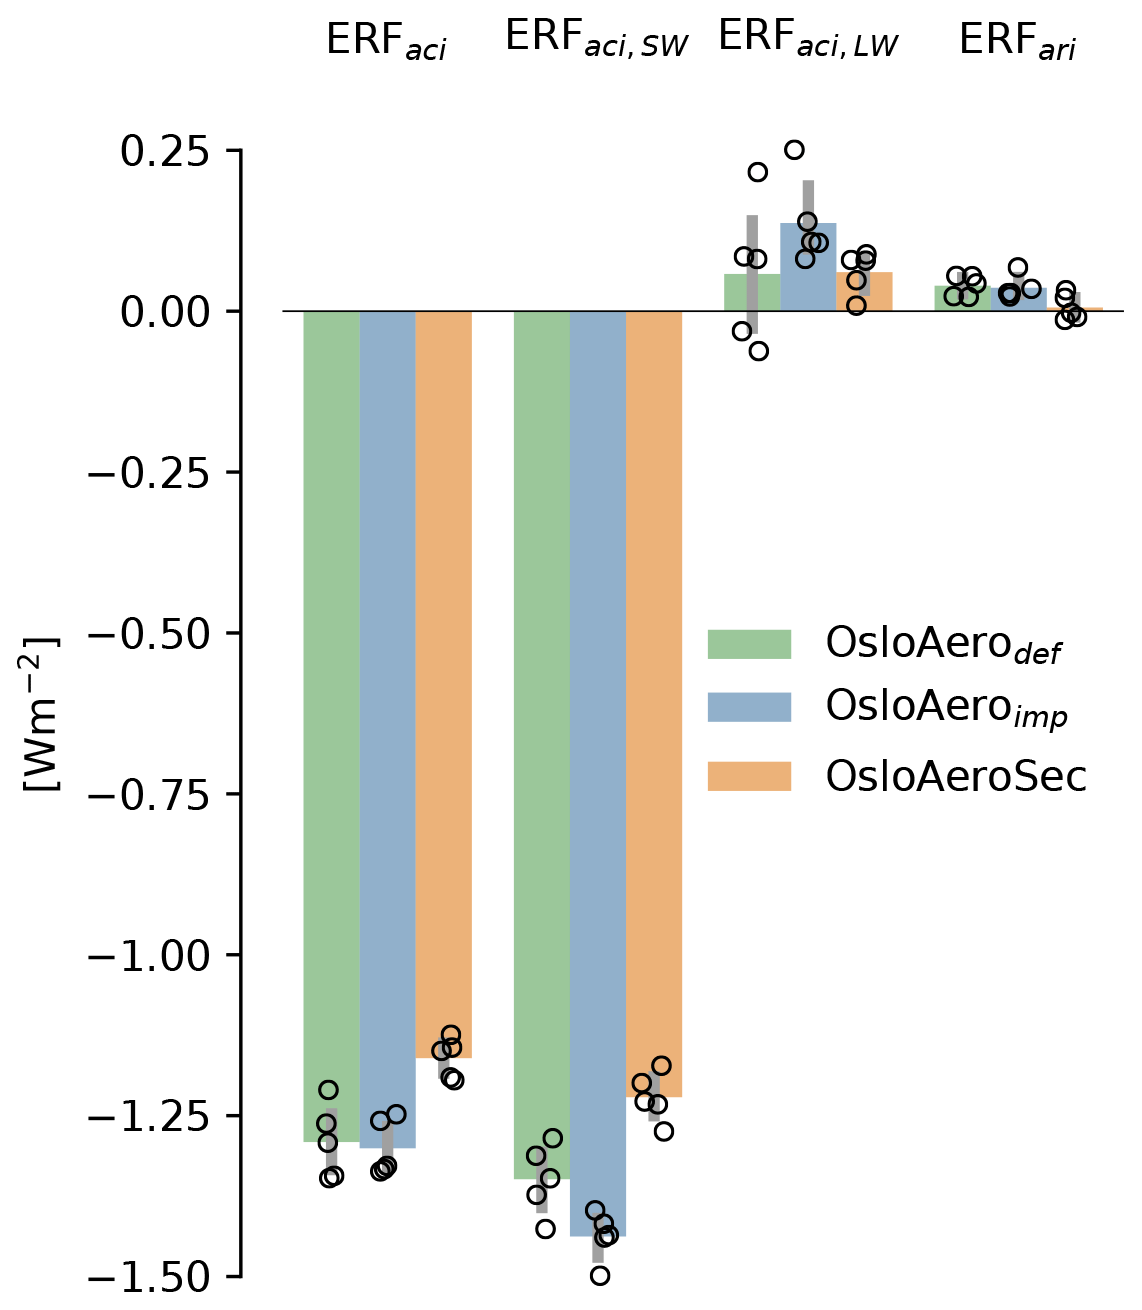
Figure 3Globally averaged effective radiative forcing (ERF) from aerosols. ERFaci is the ERF from aerosol–cloud interaction, ERFaci,SW and ERFaci,LW are the shortwave and longwave component of ERFaci, and ERFari is the ERF from aerosol–radiation interaction alone. All are computed in accordance with Ghan (2013). The circles are the averages for each individual year in the 5-year simulations, and the gray bar indicates the 95 % confidence interval of the mean.
As discussed in the Introduction, ERFaci depends on both the increase in CCN between PI and PD and on the number of CCN in the PI base state. The fewer CCN there are in the base state, the larger the impact of a given increase in CCN will be because the clouds are more susceptible. As OsloAeroSec has much lower particle number concentrations than OsloAerodef in the PI, we might expect OsloAeroSec to have fewer CCN and lower CDNC as well as weaker (less negative) NCREGhan in the PI. In this case OsloAeroSec would have clouds that are more susceptible to change from PI to PD than OsloAerodef. The opposite is in fact the case, as can be seen in Fig. 4, which relates the column burden of NNPF particle mass (which, due to the technical setup of OsloAero, is proportional to the number) to the net cloud radiative effect (NCREGhan). While the column burden of NNPF is lower in OsloAeroSec compared to OsloAerodef, the NCREGhan is stronger (more negative). On the other hand, OsloAeroimp has the lowest column burden of NNPF and the weakest NCREGhan, and it thus follows the logic that a cleaner atmosphere gives a less negative (weaker) NCREGhan. In the PD simulations, OsloAeroSec has the lowest column burden of NNPF of all the models and approximately the same NCREGhan as OsloAerodef, while OsloAeroimp has a less negative NCREGhan than the other two. Since ERFaci = NCREGhan,PD − NCREGhan,PI, it is clear from Fig. 4 that most of the difference between the schemes originates in different NCREGhan in the PI simulations: −0.15 and −0.24 W m−2 compared to OsloAerodef and OsloAeroimp, respectively. The difference in the PD simulations partially compensates for this but is considerably smaller: −0.02 and −0.1 W m−2 compared to OsloAerodef and OsloAeroimp, respectively. Furthermore and maybe surprisingly, this plot shows that the change in NCREGhan per change in column burden NNPF (i.e., the slope of the line in Fig. 4) is much more negative for OsloAeroSec than for the other two model versions.
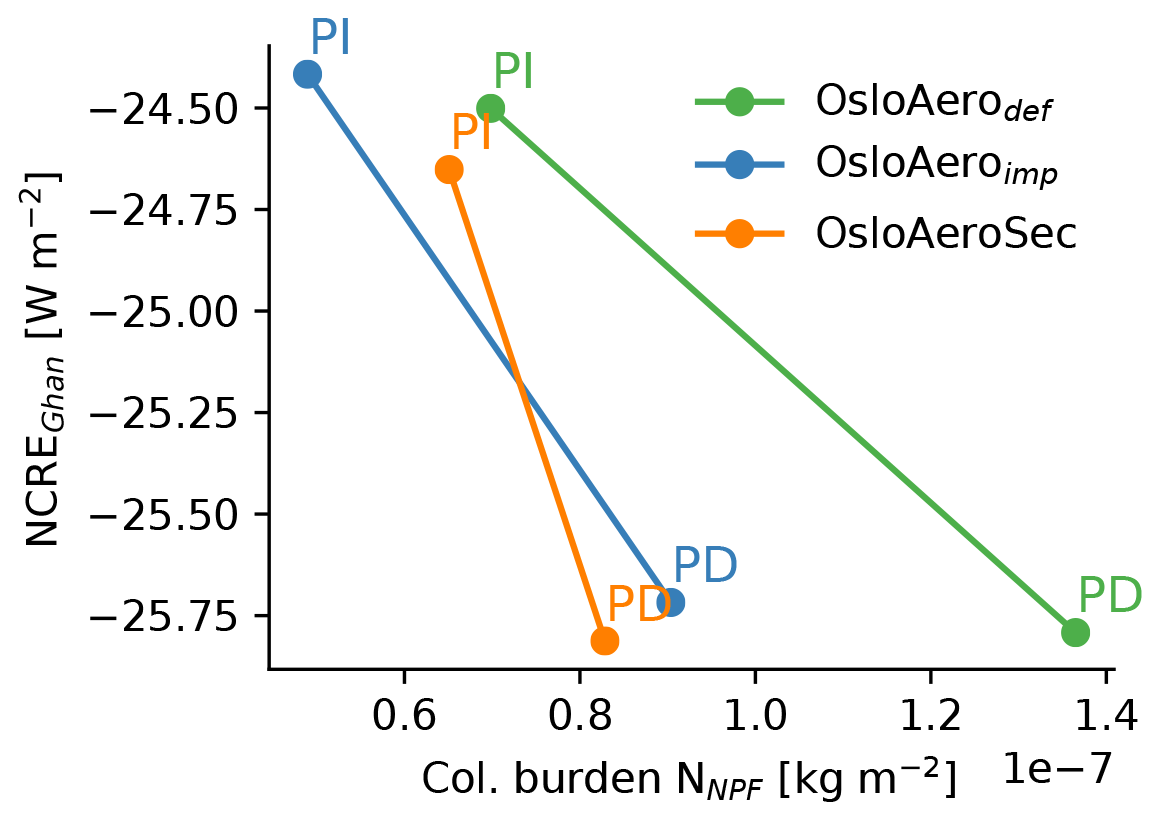
Figure 4Globally averaged aerosol values of NCREGhan (y axis) and column burden of NPF particles (x axis) for the pre-industrial (PI) and present-day (PD) atmosphere. The circles show each annual average and are included to indicate the variability.
5.2 Reasons for differences in ERFaci
From what we have seen so far, it is first of all clear that changes in the PI NCREGhan dominate the difference in ERFaci between the models; i.e., the spread in modeled NCREGhan between the models is larger in PI than in PD. Secondly, we have seen that, at least in globally averaged properties, more efficient NPF, meaning more particles with the same emissions, does not necessarily lead to a stronger negative NCREGhan. To explain the somewhat nonintuitive relationship between particle number and NCREGhan, we must also consider their geographical distributions with respect to where the NPF particles are likely to activate in clouds and contribute to CDNC. In this section we first outline some important processes and then lay out some hypotheses for the difference in NCREGhan with OsloAeroSec compared to the other versions. These will serve to facilitate the rest of the results and discussion.
The cloud droplet activation of particles and resulting CDNC depend on the following factors: (1) the maximum achieved supersaturation (Smax) together with the hygroscopicity of the particles decides the activation diameter of each mode, (2) Smax depends on the updraft velocity but is also influenced by supersaturation adjustment due to the uptake of water vapor from large(r) particles which activate early during lifting, and finally, (3) the absolute number of particles in each mode which are larger than the activation diameter and thus activate.
Furthermore, note that the number of particles from NPF is strongly negatively correlated with the number median diameter of the modes in the size distribution for both the NPF mode and the larger modes. This is because the total available surface area is larger when there are more NPF particles, which means the available condensate is distributed to more numerous but smaller particles. This leads, as we will show, to NPF inhibiting cloud droplet activation in many regions in the model.
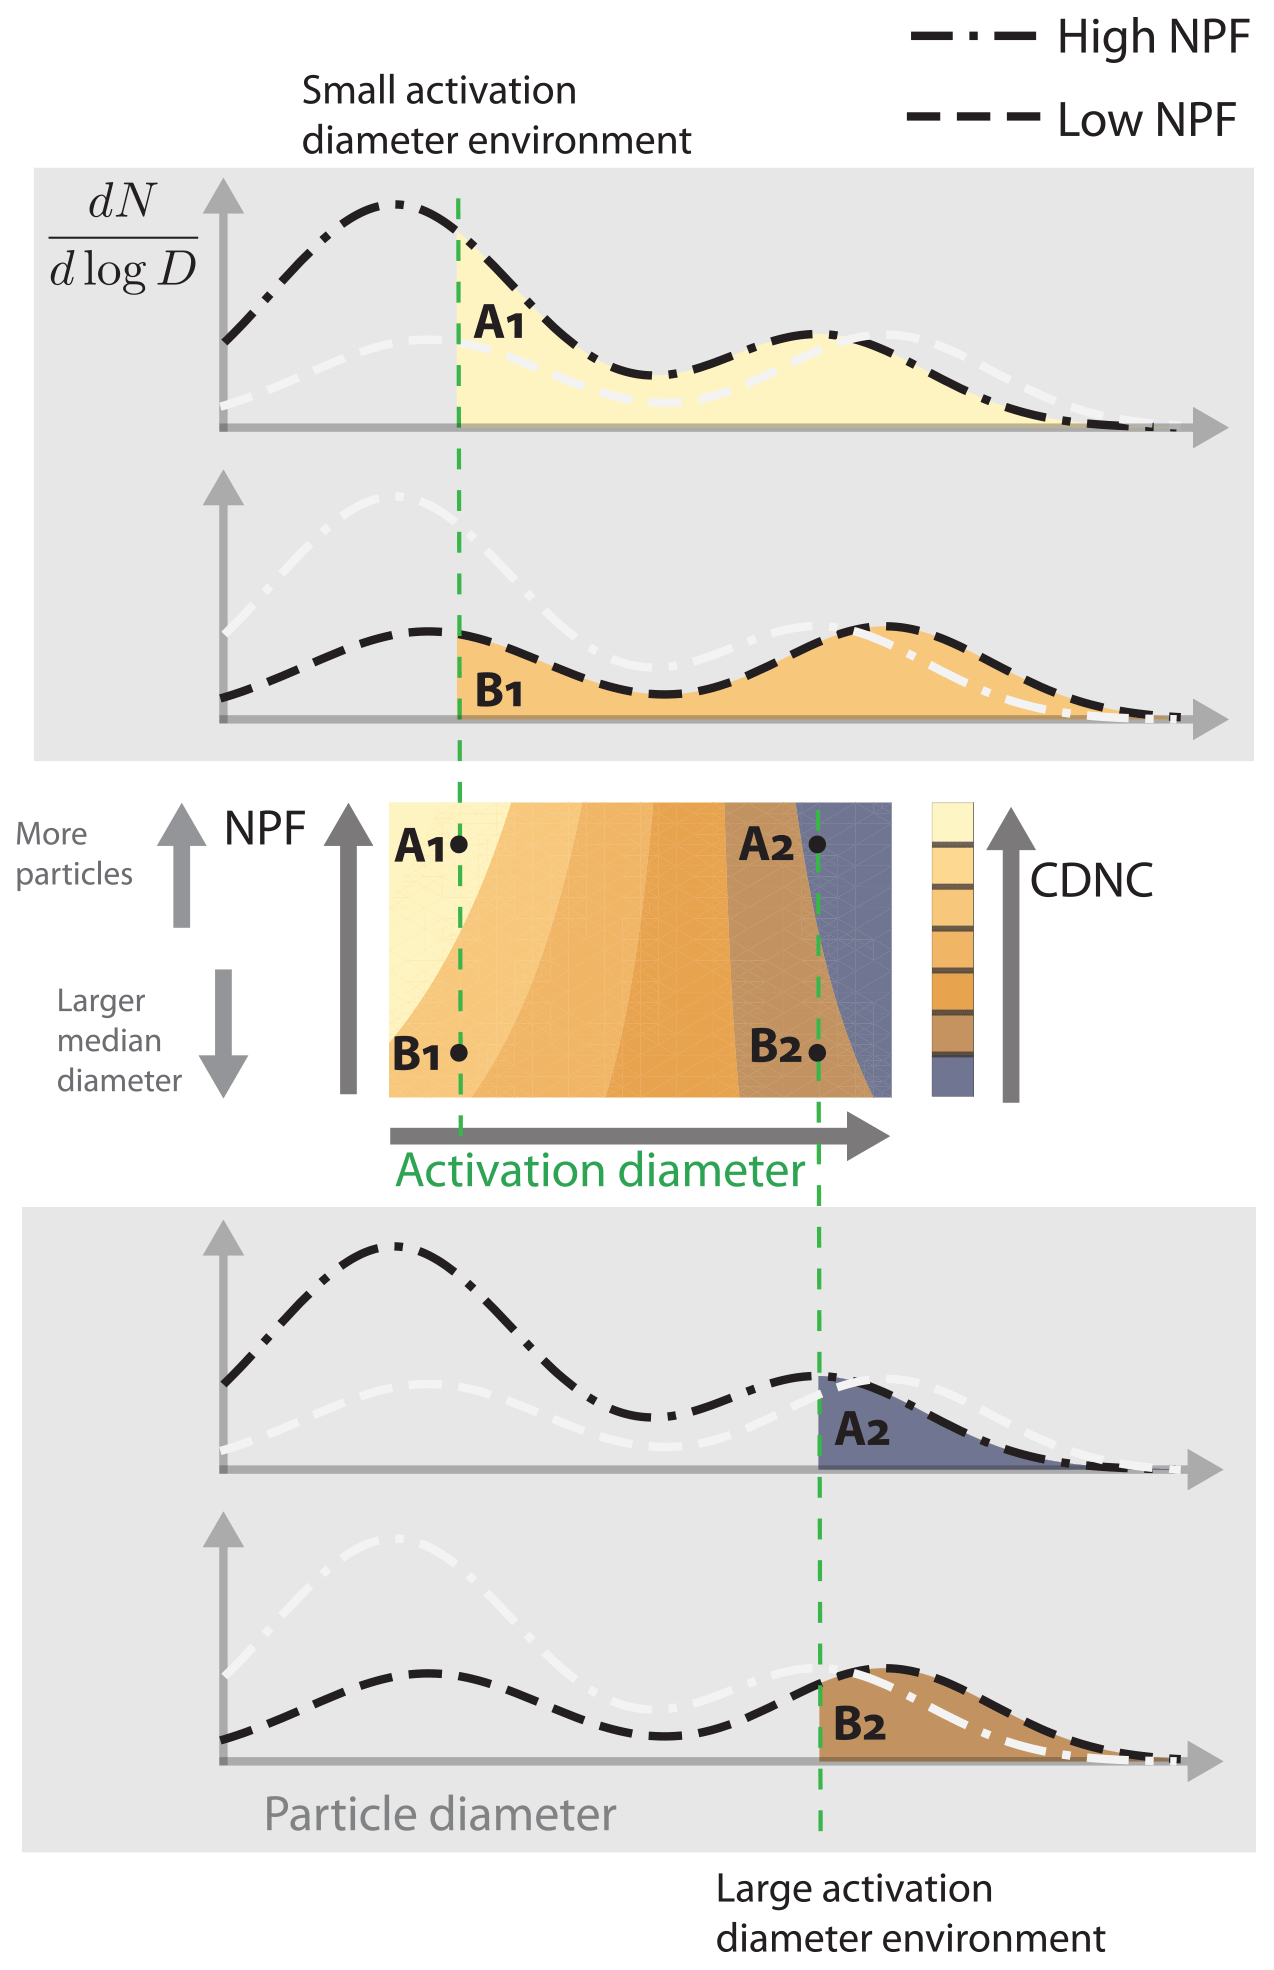
Figure 5Schematic illustrating the influence of NPF on cloud droplet activation and CDNC. The top and bottom panel shows what happens to activation in two different environments (1 and 2) and for two models: one model with high NPF efficiency (A) and one with low NPF efficiency (B). Let us first consider environment 1 (top panels): here the activation diameter is small (either due to strong updrafts, few large particles or high hygroscopicity), and particles all the way down to the mode holding the NPF particles (∼ Aitken mode) activate. In this environment model A will activate more particles than model B and have higher CDNC. Next let us consider environment 2 (bottom panels): here the activation diameter is large (due to weak updrafts, supersaturation adjustment due to larger particles or hygroscopicity), and only the largest particles activate. Here model B will activate more particles than model A because the size of the larger particles is what dominates.
Figure 5 illustrates the effect of changing the NPF efficiency on CDNC in two different environments. For simplicity, let us assume that we are comparing two models with different NPF efficiency: model A with high NPF efficiency and model B with low NPF efficiency. As noted above, model A will have more numerous but smaller particles (A1 and A2 in Fig. 5), while model B will have fewer but larger particles (B1 and B2 in Fig. 5). Furthermore, we will consider two different environments. Environment 1 has a small activation diameter because, e.g., there are few large particles (no early activation) or the updraft is strong (A1 and B1 in Fig. 5). Environment 2 has a large activation diameter because, e.g., it has high emissions of large primary particles which activate early and limit the maximum supersaturation (A2 and B2 in Fig. 5). In this simplification we assume that the activation diameter does not change between model A and B. This is not strictly true, but it is a good assumption because the inter-model changes in Smax (Fig. S21 in the Supplement) and hygroscopicity (Fig. S26 in the Supplement) are small and do not dominate the response in terms of CDNC.
We start with environment 1 wherein the activation diameter is small (e.g., Antarctica). This is illustrated by the two size distributions, A1 and B1, on the top in Fig. 5. In this environment model A (high NPF efficiency, A1) will result in higher cloud droplet activation and higher CDNC than model B (low NPF efficiency, B1). This is because a considerable fraction of the small NPF-mode particles activate, and thus the decrease in the size of the larger particles does not matter.
Next we consider environment 2 wherein the activation diameter is large (e.g., a polluted area like China).This is illustrated by the two size distributions, A2 and B2, at the bottom of Fig. 5. In this environment model A with high NPF efficiency (A2) will result in lower cloud droplet activation and lower CDNC than model B with a low NPF efficiency (B2). This is because the change in the diameter of the larger particles is the only thing which matters for activation, since the smaller particles will not activate anyway.
In this simplified thought example, we can say that in environment 1 (small activation diameter), NPF enhances cloud droplet activation, while in environment 2 (large activation diameter) NPF inhibits cloud droplet activation.
With all this in mind, we can lay out some plausible hypotheses that might contribute to a weaker ERFaci in OsloAeroSec compared to the other model versions.
-
Smaller ΔPD−PINa. The difference in ERFaci is due to a smaller change in number concentration between PI and PD in OsloAeroSec than the other model versions.
-
Higher Na in PI. OsloAeroSec produces more particles under PI conditions, and therefore the clouds are less susceptible to increased anthropogenic emissions.
-
Higher activation in PI. The number of particles that actually act as CCN and activate is higher with OsloAeroSec than the other model versions in the PI simulations, leading to a higher baseline CDNC. This is due to
-
more efficient NPF in remote regions where NPF enhances activation and
-
less efficient NPF in regions where NPF inhibits activation (only larger particles activate).
-
-
Lower activation in PD. The number of particles that actually act as CCN and activate is lower with OsloAeroSec than the other model versions with PD emissions, leading to a weaker ERFaci. This is
-
due to lower NPF efficiency in regions where NPF enhances activation.
-
Hypothesis 2 has already been partly disproven because in terms of global averages, OsloAerodef has higher particle number concentrations than OsloAeroSec all the way up to approximately 700 hPa (with most of the liquid clouds being below this level).
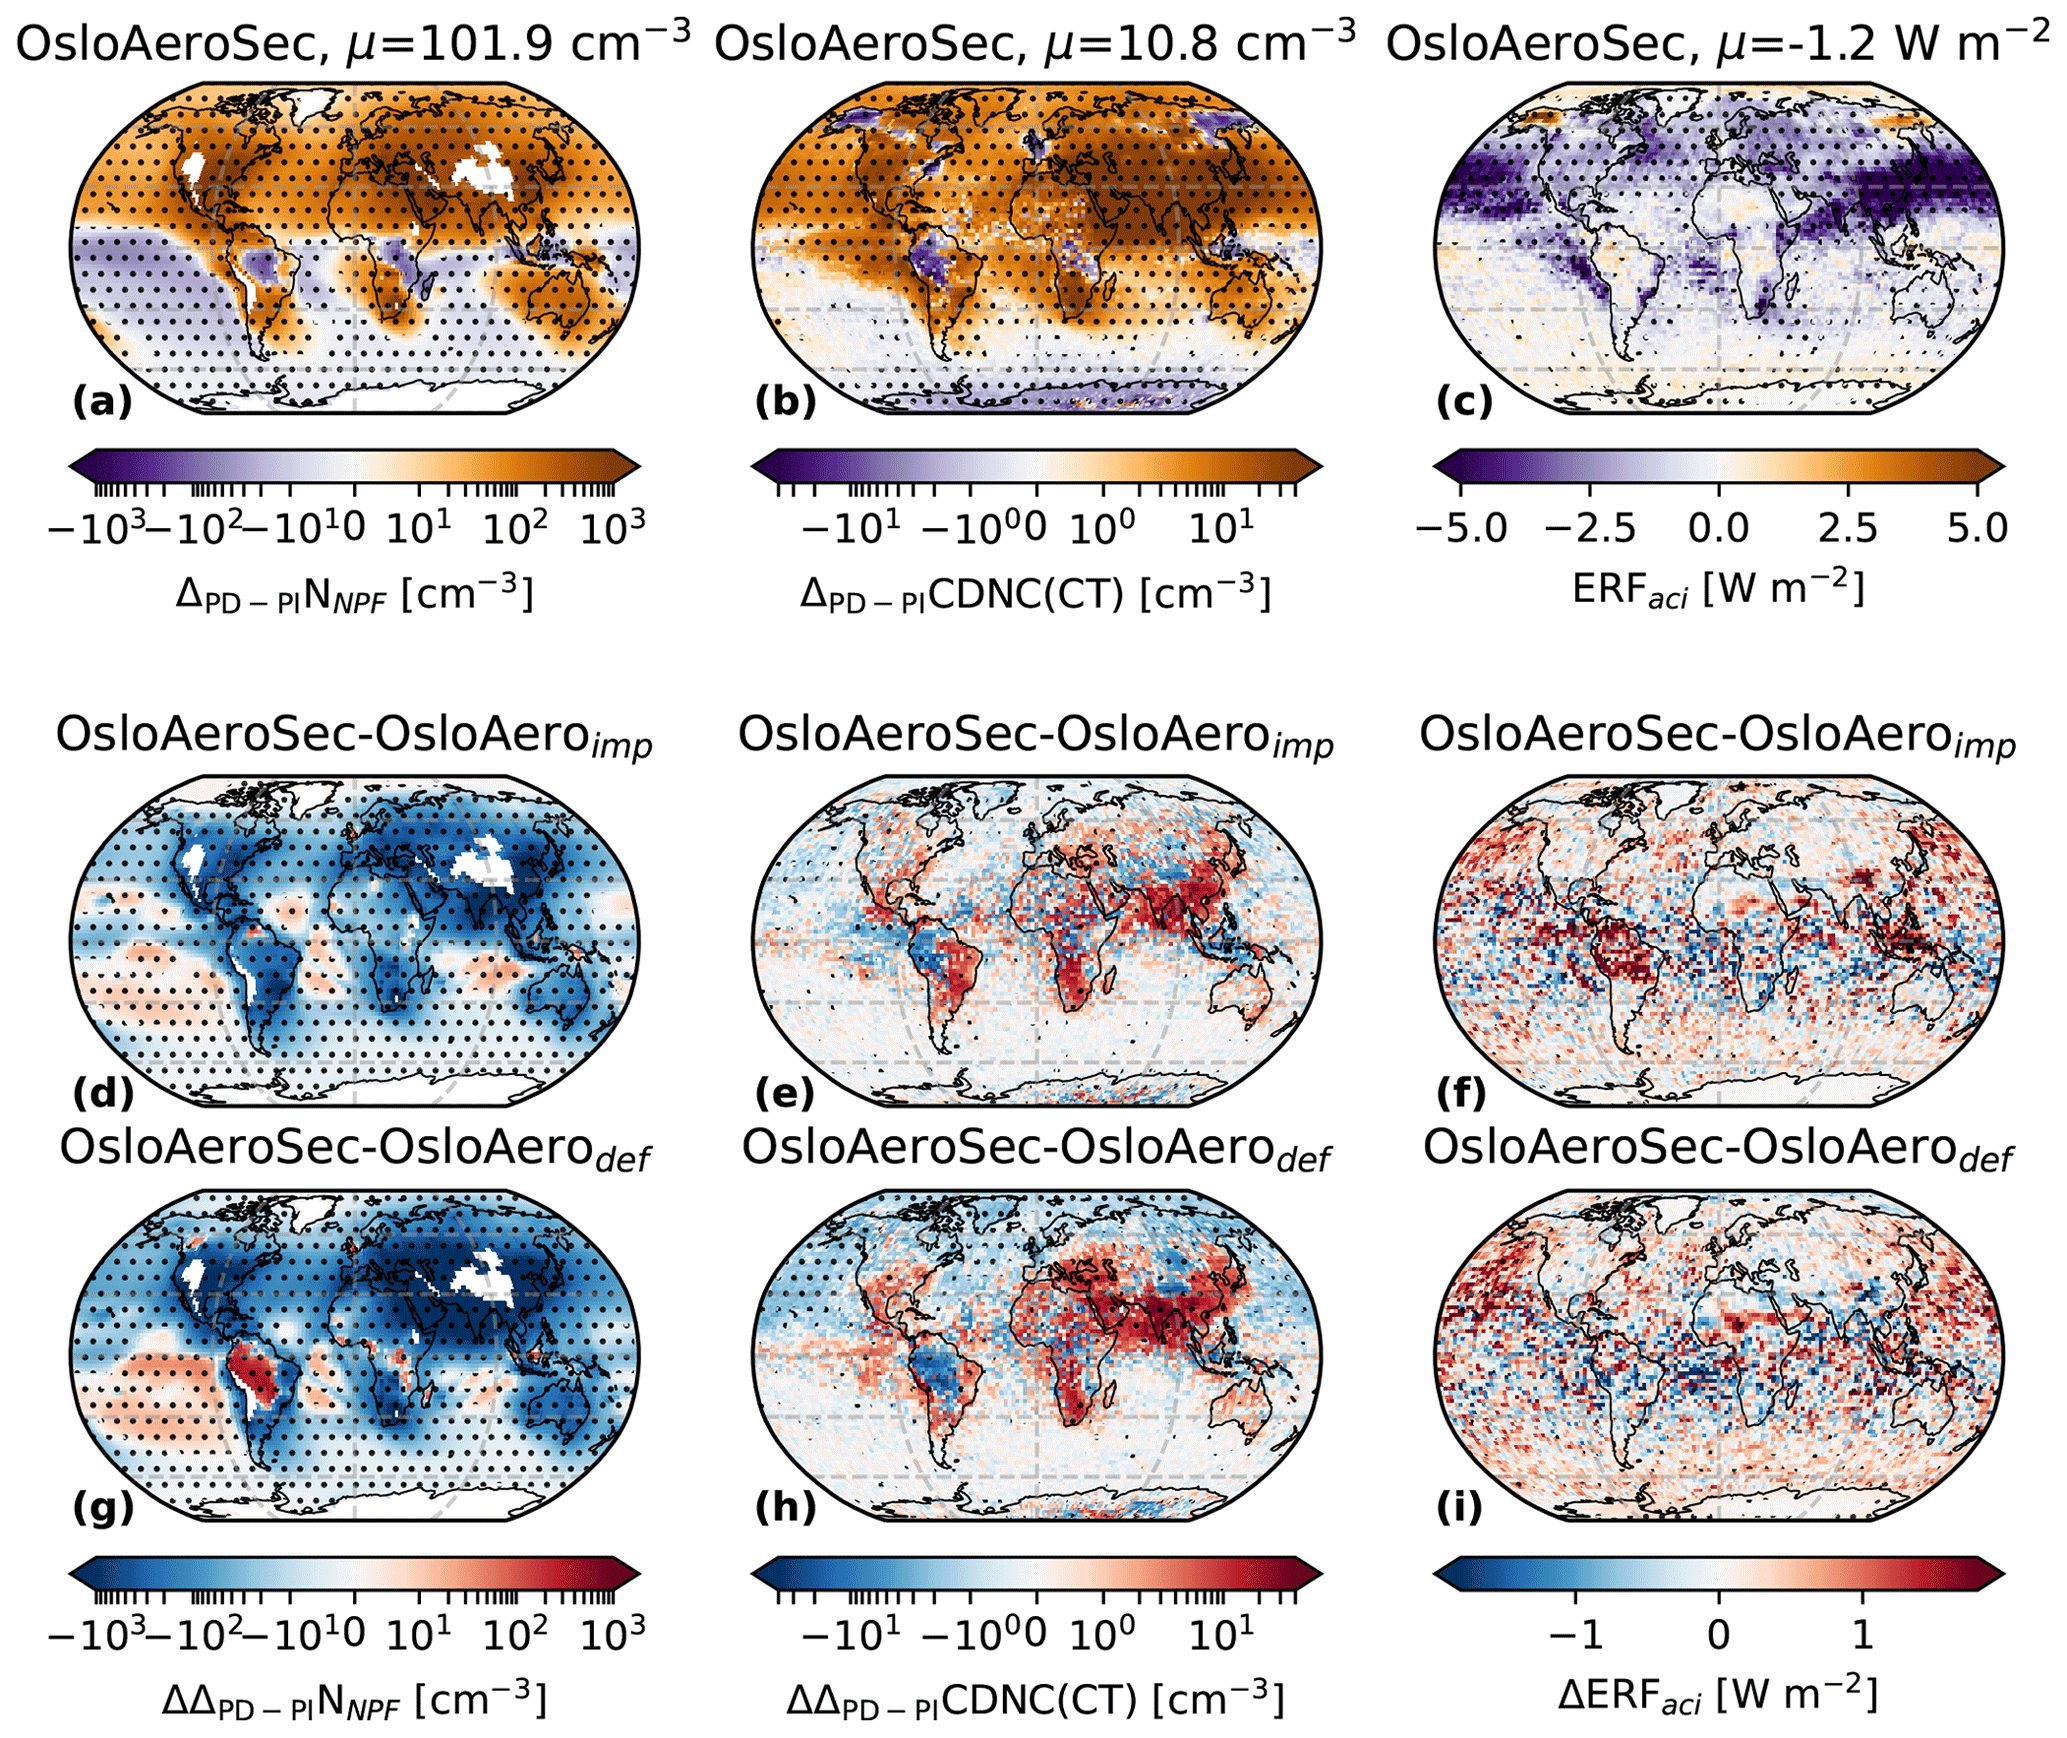
Figure 6Annual average values of near-surface NNPF concentrations (a, d and g), cloud-top droplet number concentration (CDNC(CT), b, e and h) and NCREGhan (c, f and i). The top panel shows the PD − PI for OsloAeroSec, while the second and third rows show the change in this value (PD − PI) from OsloAeroimp (second row) and OsloAerodef (third row) to OsloAeroSec. The NNPF values are averaged up to 850 hPa and weighted by the pressure thickness of each grid cell. Dots are included in the plots to indicate where the difference between the two models is significant with a two-tailed paired Student's t test with 95 % confidence.
5.3 Pre-industrial to present-day changes
We start by considering Hypothesis 1 and how the PI-to-PD change looks on a regional level in OsloAeroSec versus OsloAerodef.
This is shown in Fig. 6 where the first row is the change between PD and PI (ΔPD−PI) for OsloAeroSec and the two subsequent rows show the difference to this first quantity, ΔPD−PI, between the model versions (ΔPD−PI(OsloAeroSec) minus ΔPD−PI(OsloAeroimp) and ΔPD−PI(OsloAeroSec) minus ΔPD−PI(OsloAerodef), denoted ΔΔPD−PI). The first column, showing the near-surface averaged NNPF, shows that, as expected, most of the PI-to-PD change happens in the Northern Hemisphere. This is consistent with the major anthropogenic emission sources being located here. Over ocean regions in the Southern Hemisphere, there is even a small decrease in NPF particles in many places. Comparing to OsloAerodef (row 3) we see that OsloAeroSec has a smaller increase in NNPF from PI to PD, except in the South Pacific and over the Amazon. High-pollution areas over land especially stand out as strongly negative. Note that the first column in Fig. S15 in the Supplement shows the same but for zonal averages and underlines the fact that ΔPD−PINNPF is higher in OsloAerodef than OsloAeroSec all through the atmospheric column.
The second column shows the change in cloud droplet number concentration at cloud top (CDNC(CT)). Again the first row shows ΔPD−PICDNC(CT), which, as expected, shows an increase – in particular in the Northern Hemisphere. Comparing OsloAeroSec to OsloAerodef (row 3), however, the first thing that stands out is that, somewhat surprisingly, ΔΔPD−PICDNC(CT) is positive over polluted regions, meaning that the PI-to-PD increase in CDNC(CT) is stronger with OsloAeroSec than with OsloAerodef, in spite of NNPF increasing less with OsloAeroSec. In other words, in these regions we are in the bottom panel of Fig. 5, where more particles are added with OsloAerodef than OsloAeroSec, but fewer of these extra particles are activating into cloud droplets. Meanwhile, in more remote regions, like the North Pacific and the Arctic, we are in the top panel of Fig. 5 and CDNC(CT) increases less with OsloAeroSec than OsloAerodef, following the more expected logic that a smaller increase in particle number leads to a smaller increase in cloud droplets from PI to PD.
Finally, the last column shows the ERFaci. Here we see (first row, c) that the ERFaci is strongly negative over the North Pacific as well as over China and India. The difference in ERFaci between the models shows that the remote Pacific dominates in making ERFaci more strongly negative in OsloAerodef than in OsloAeroSec. Even though the increase in CDNC(CT) from PI to PD is stronger in polluted regions with OsloAeroSec, these regions seem to have reached saturation with respect to changing albedo, and the ERFaci changes little between the model versions.
To summarize with regard to Hypothesis 1: the change in particle number between PI and PD is indeed smaller with OsloAeroSec than the other model versions, but this can only explain the change in CDNC in remote regions (North Pacific, Siberia, etc.). Furthermore, as mentioned earlier, we need to consider the influence of the baseline aerosol state in PI and not just the change between PI and PD.
5.4 The pre-industrial atmosphere: model-to-model differences
To consider Hypothesis 3, “higher activation in PI”, we now consider differences between OsloAeroSec and the default model versions in the PI separately from PD (covered in the next section).
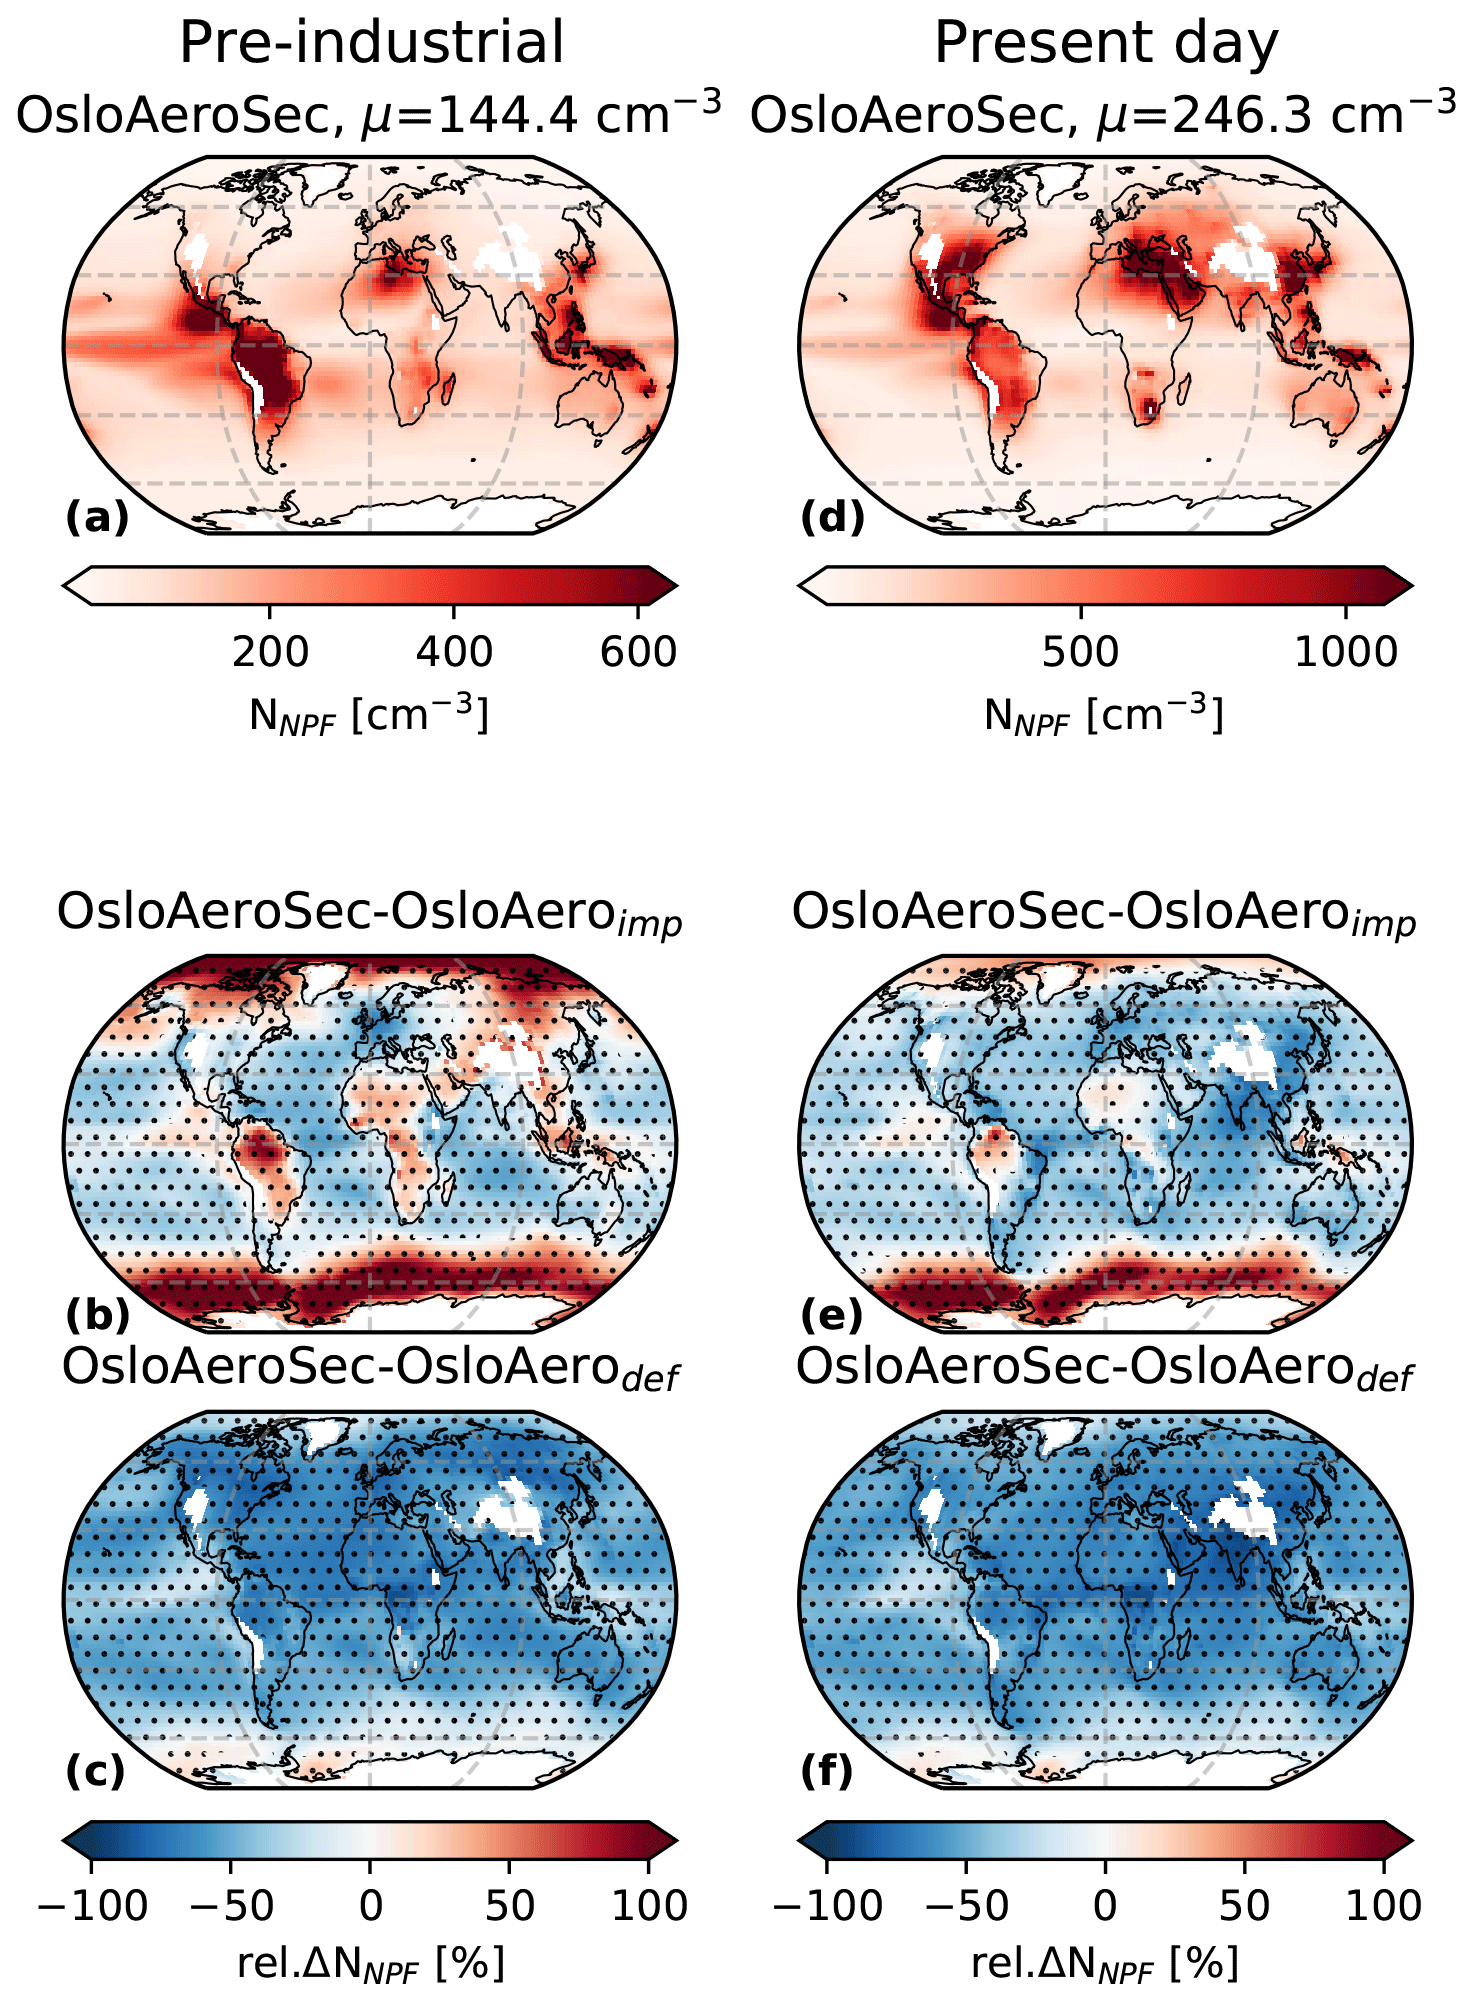
Figure 7(a, d) Annual average near-surface NNPF concentrations for OsloAeroSec for PI (a) and PD (d). Rows 2–3: the relative difference of OsloAeroSec to OsloAeroimp (b, e) and OsloAerodef (c, f) for PI (b, c) and PD (e, f). All values are averaged up to 850 hPa and weighted by the pressure thickness of each grid cell. Dots are included in the plots to indicate where the difference between the two models is significant with a two-tailed paired Student's t test with 95 % confidence.
Figure 7 shows the near-surface concentration of NNPF in the PI simulation (left column) for OsloAeroSec (Fig. 7a) and the relative difference in this value between the model versions (Fig. 7b and c). We see that compared to OsloAerodef, NNPF is lower in OsloAeroSec almost everywhere in PI. However, as seen in Fig. 8c, showing the zonally averaged difference, this decrease with OsloAeroSec is mostly confined to the near-surface areas. The decrease in NNPF with OsloAeroSec near the surface switches to an increase higher up in the atmosphere.
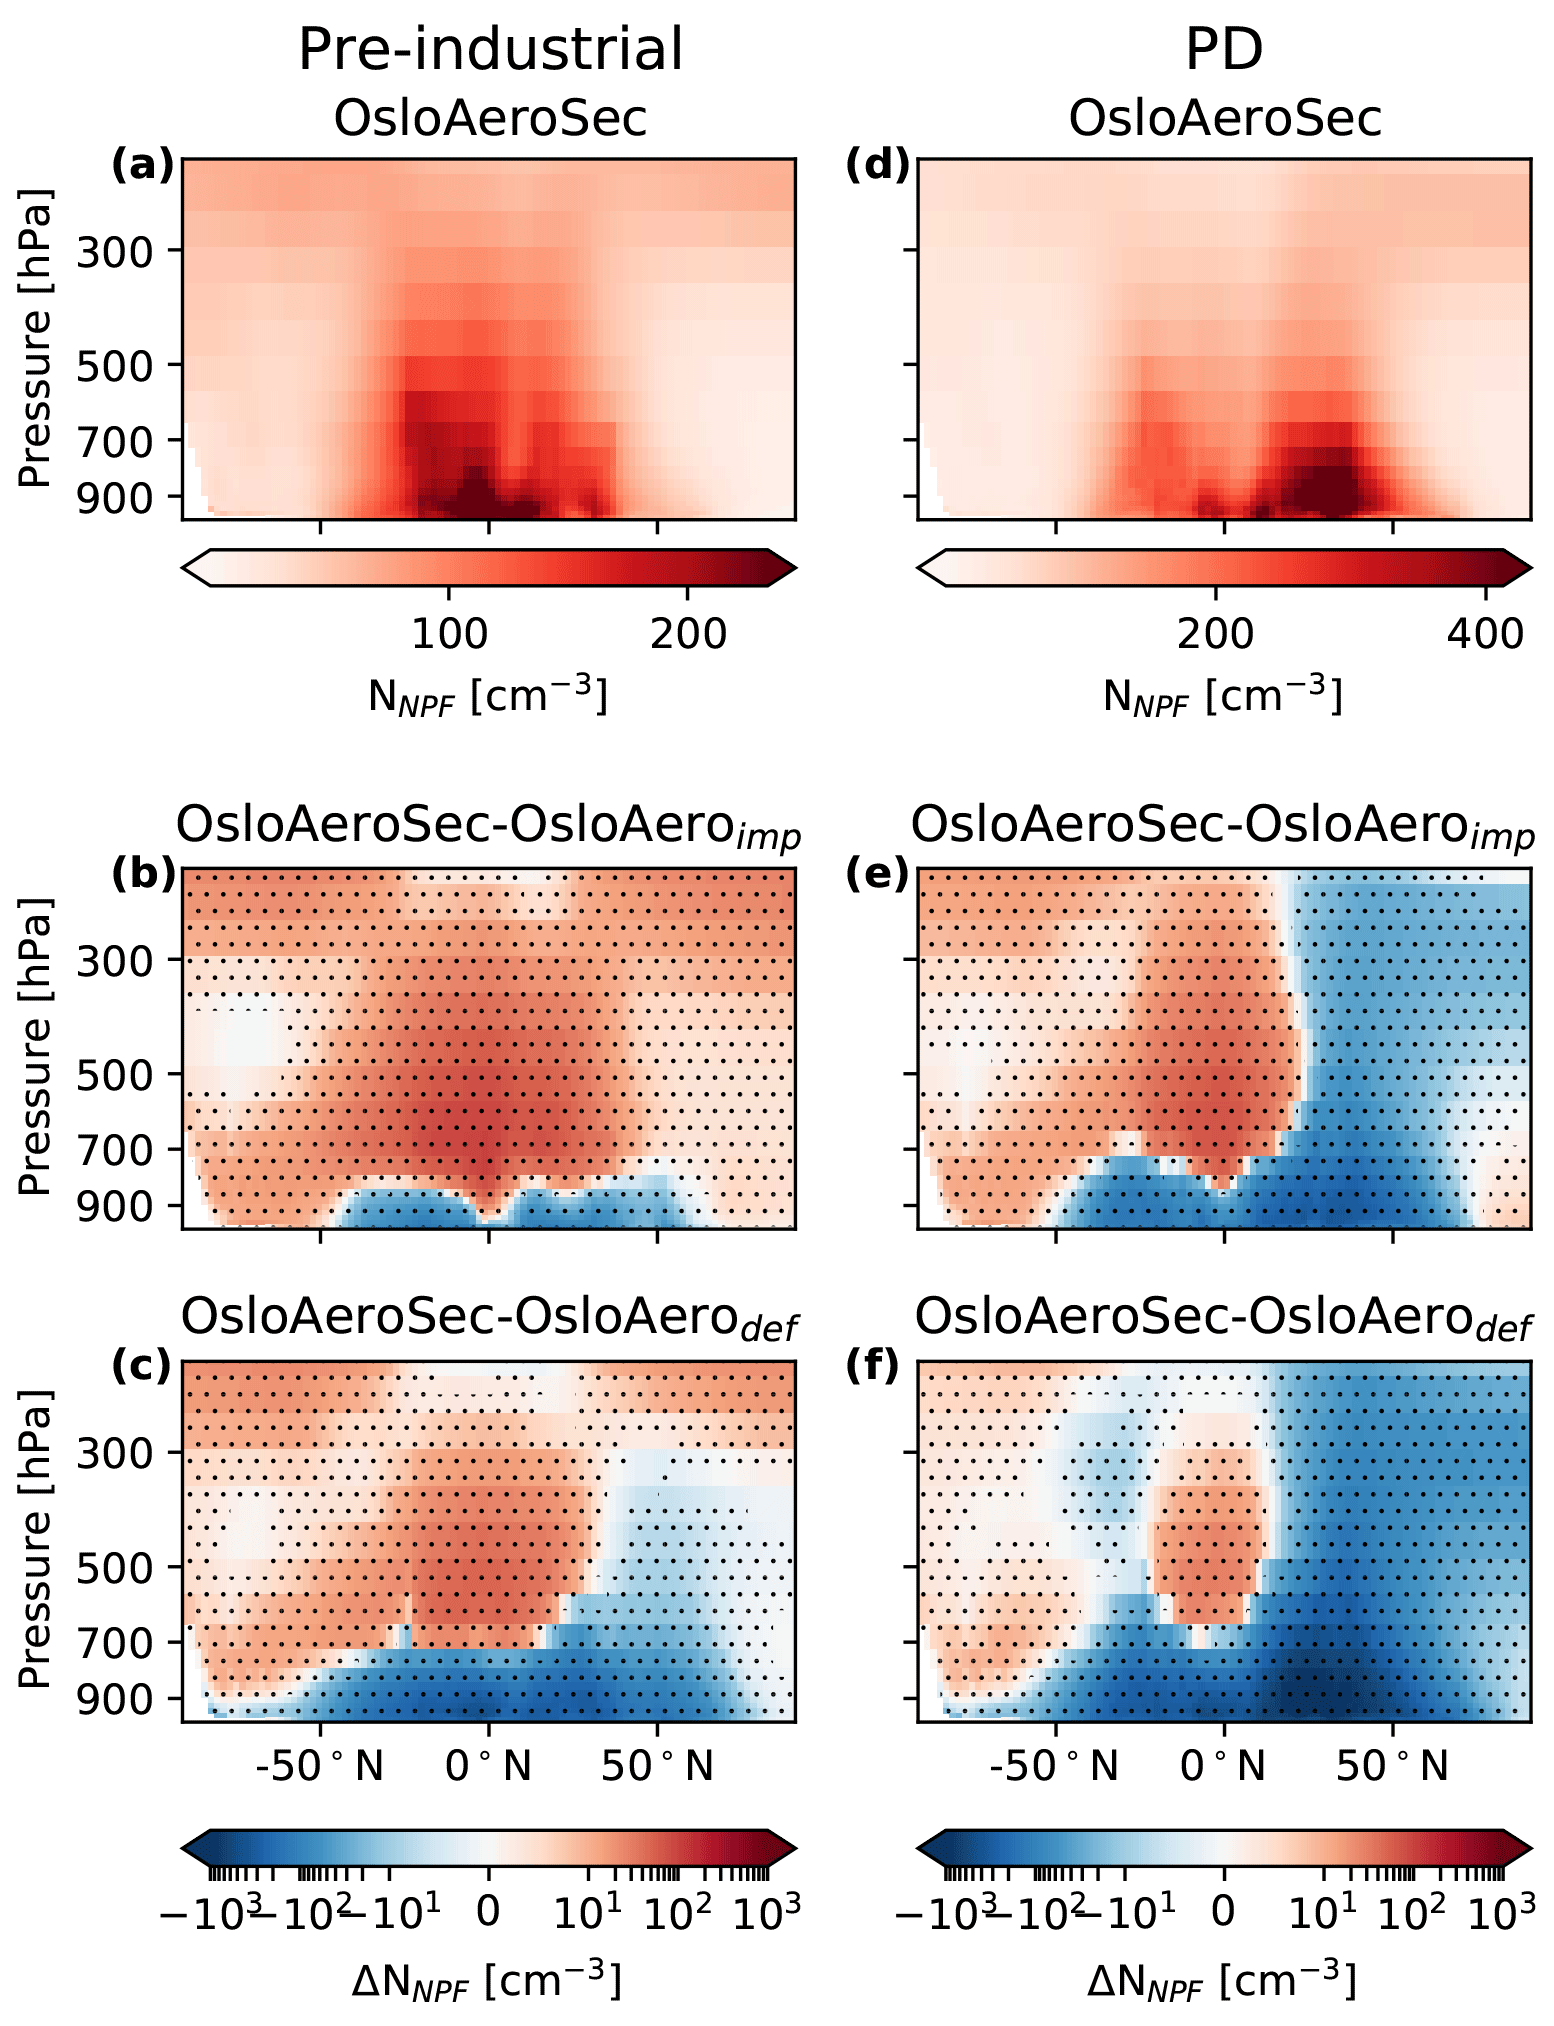
Figure 8(a, d) Zonally and annually averaged concentrations of NNPF for OsloAeroSec for PI (a) and PD (d). Rows 2–3: the absolute difference of OsloAeroSec to OsloAeroimp (b, e) and OsloAerodef (c, f) for PI (b, c) and PD (e, f). Dots are included in the plots to indicate where the difference between the two models is significant with a two-tailed paired Student's t test with 95 % confidence.
5.4.1 Cloud properties
OsloAeroSec has a higher cloud droplet number concentration at cloud top (CDNC(CT)) than OsloAerodef in most of the PI atmosphere, as can be seen in Fig. 9a. This is despite the fact that OsloAeroSec has lower NNPF concentrations in most near-surface areas compared to OsloAerodef. We must therefore investigate what happens to the size distribution rather than just the absolute number. Figure 9c, e and g show the OsloAeroSec-to-OsloAerodef difference in number concentrations of N100, N150 and N200. The N100 concentration (Fig. 9c) is lower in OsloAeroSec than OsloAerodef most places in the PI atmosphere, while N150 (Fig. 9e) and N200 (Fig. 9g) are higher. This follows the mechanism explained in Sect. 5.2 that lower NPF efficiency in OsloAeroSec leads to fewer but larger particles. The higher concentrations in OsloAeroSec of, e.g., N200 come from the modes shifting to higher median diameters when the number of NPF particles is lower. There is also a good correspondence between the difference in N150 and/or N200 and the difference in CDNC in most areas in the atmosphere. Note, for example, the Amazon area, where much lower concentrations of N100 (and NPF efficiency) are associated with much higher concentrations of N200 but not N150. That the CDNC is higher here tells us that the activation diameter is probably usually between 150 and 200 nm. Additionally, the supersaturation is higher in OsloAeroSec due to fewer particles that compete for the water vapor (see Fig. S20 in the Supplement), which has a small positive impact on the number of particles which activate.
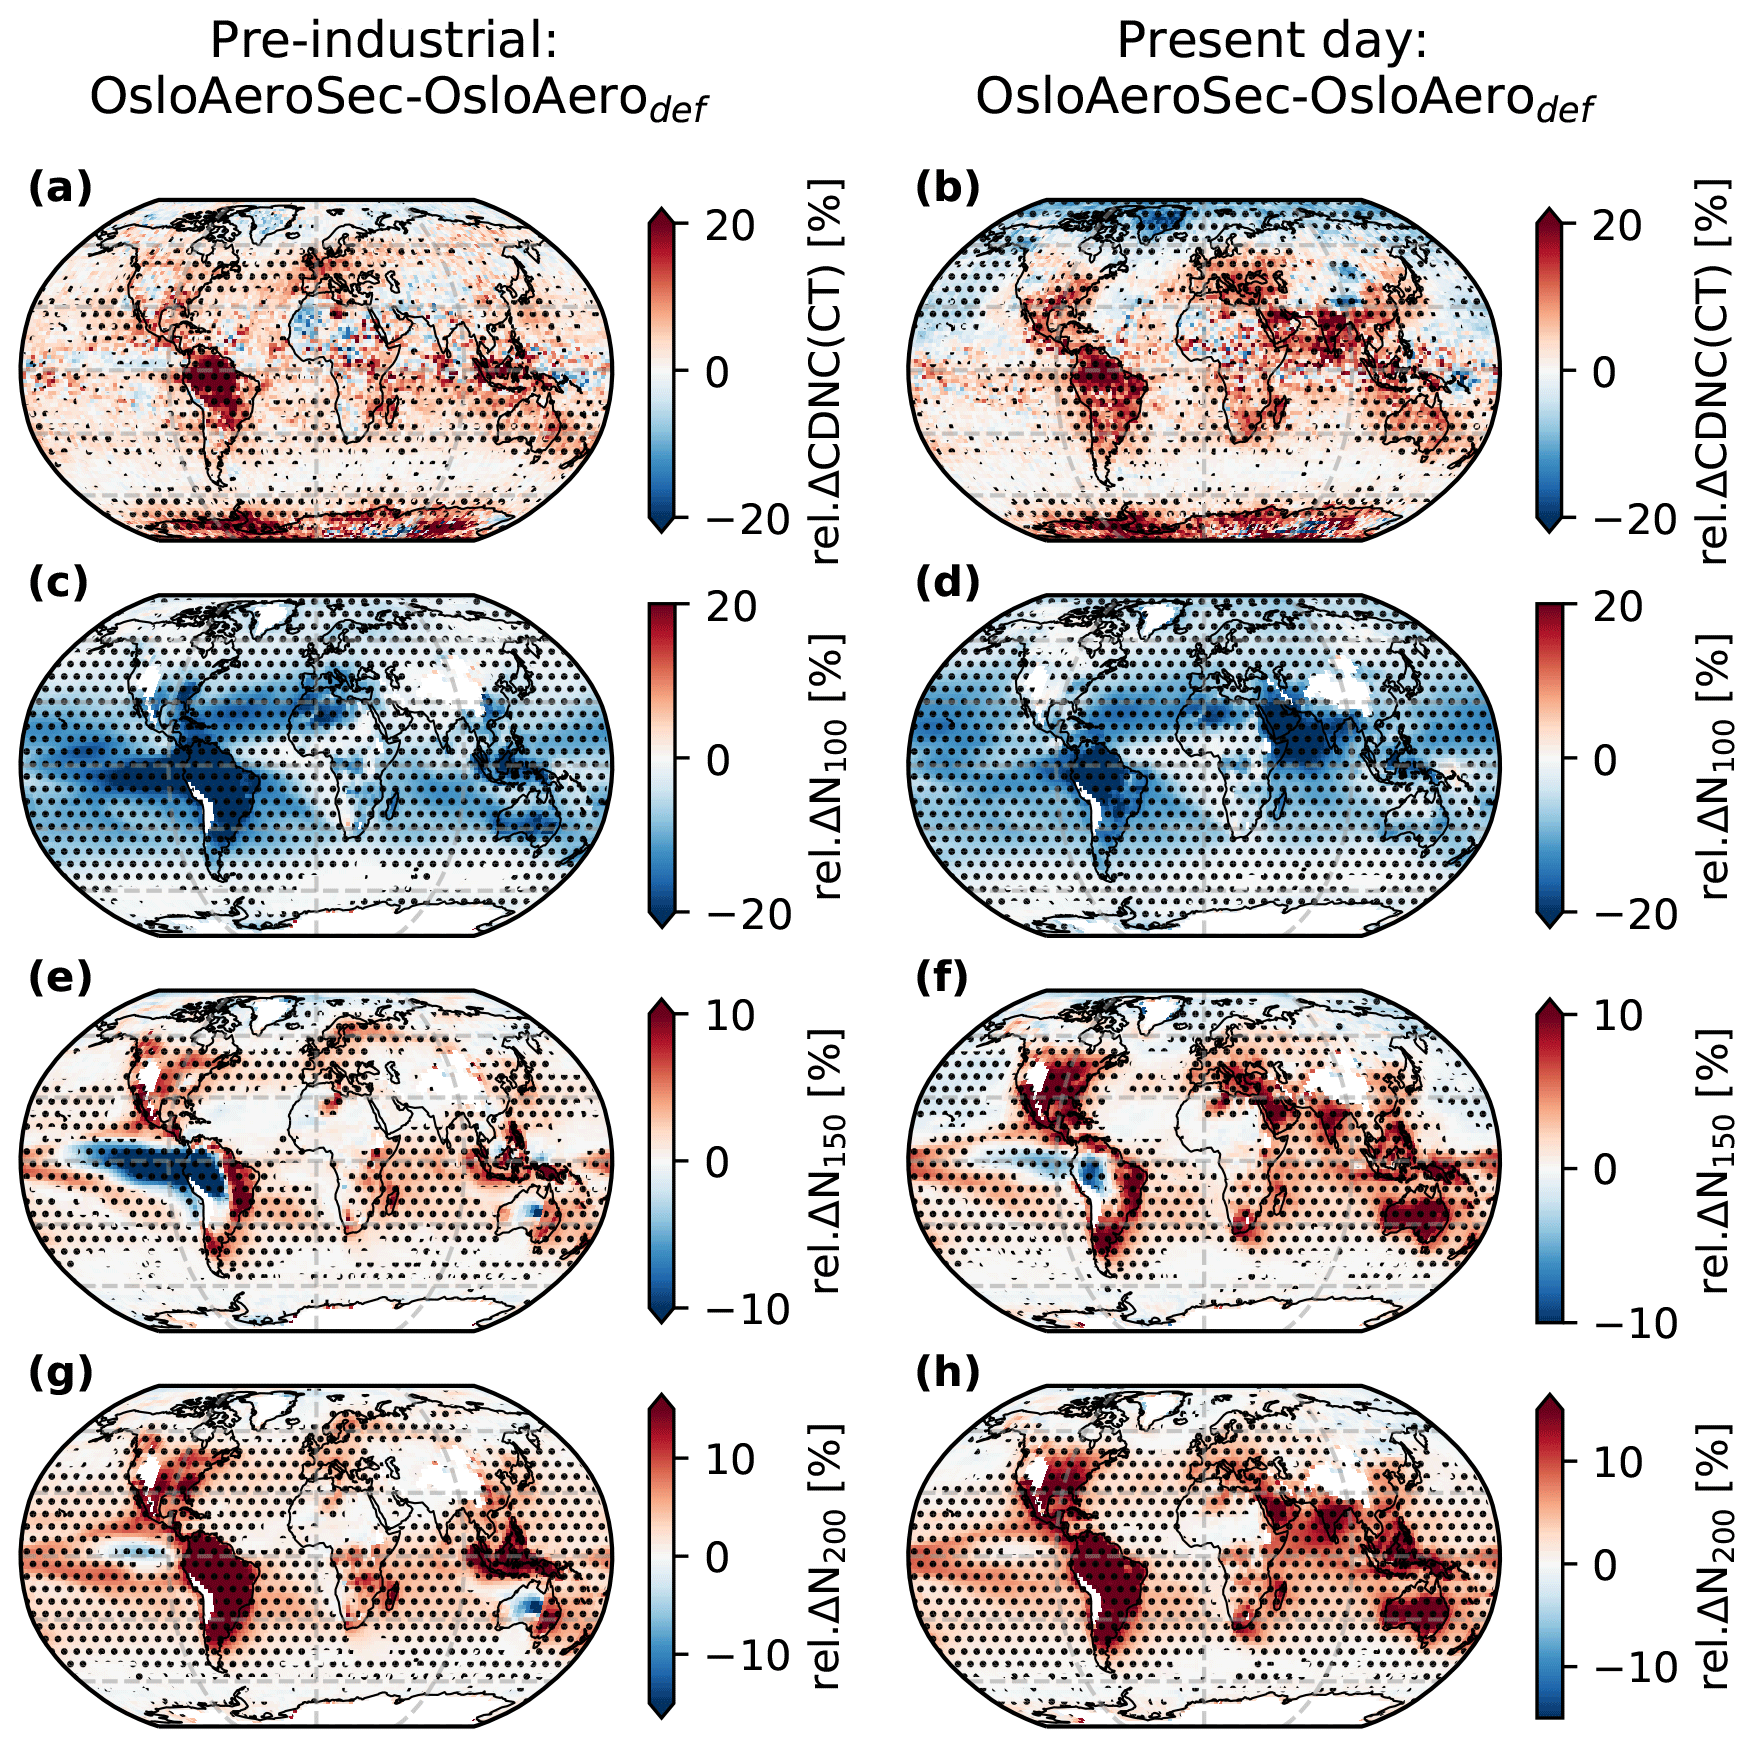
Figure 9(a, b) Relative difference in annual average cloud-top cloud droplet number concentrations (CDNC(CT)) at cloud top between OsloAeroSec and OsloAerodef. Row 2–3: difference in average particle number concentration for particles larger than 100 nm (c, d), 150 nm (e, f) and 200 nm (g, h). The left column shows the difference for the pre-industrial atmosphere, and the right column shows the difference for the present-day atmosphere. The average particle concentrations are calculated by averaging up to 850 hPa and averaging by pressure difference. Dots are included in the plots to indicate where the difference between the two models is significant with a two-tailed paired Student's t test with 95 % confidence.
To further investigate these relationships between changes in Nd and CDNC in the PI simulations, we compute the correlation between ΔCDNC and ΔNd, where Δ signifies the difference between OsloAeroSec and OsloAerodef. First we compute the correlation between ΔCDNC and ΔNNPF over time and longitude, as shown in Fig. 10c. This reveals that close to the surface, ΔCDNC and ΔNNPF are mostly negatively correlated, indicating that in these areas NPF inhibits activation. In remote regions, like the Southern Ocean or high in the free troposphere, there is a positive correlation between ΔNNPF and ΔCDNC, indicating that we are in an NPF-enhanced activation regime and relevant parts of the NPF-mode particles activate.
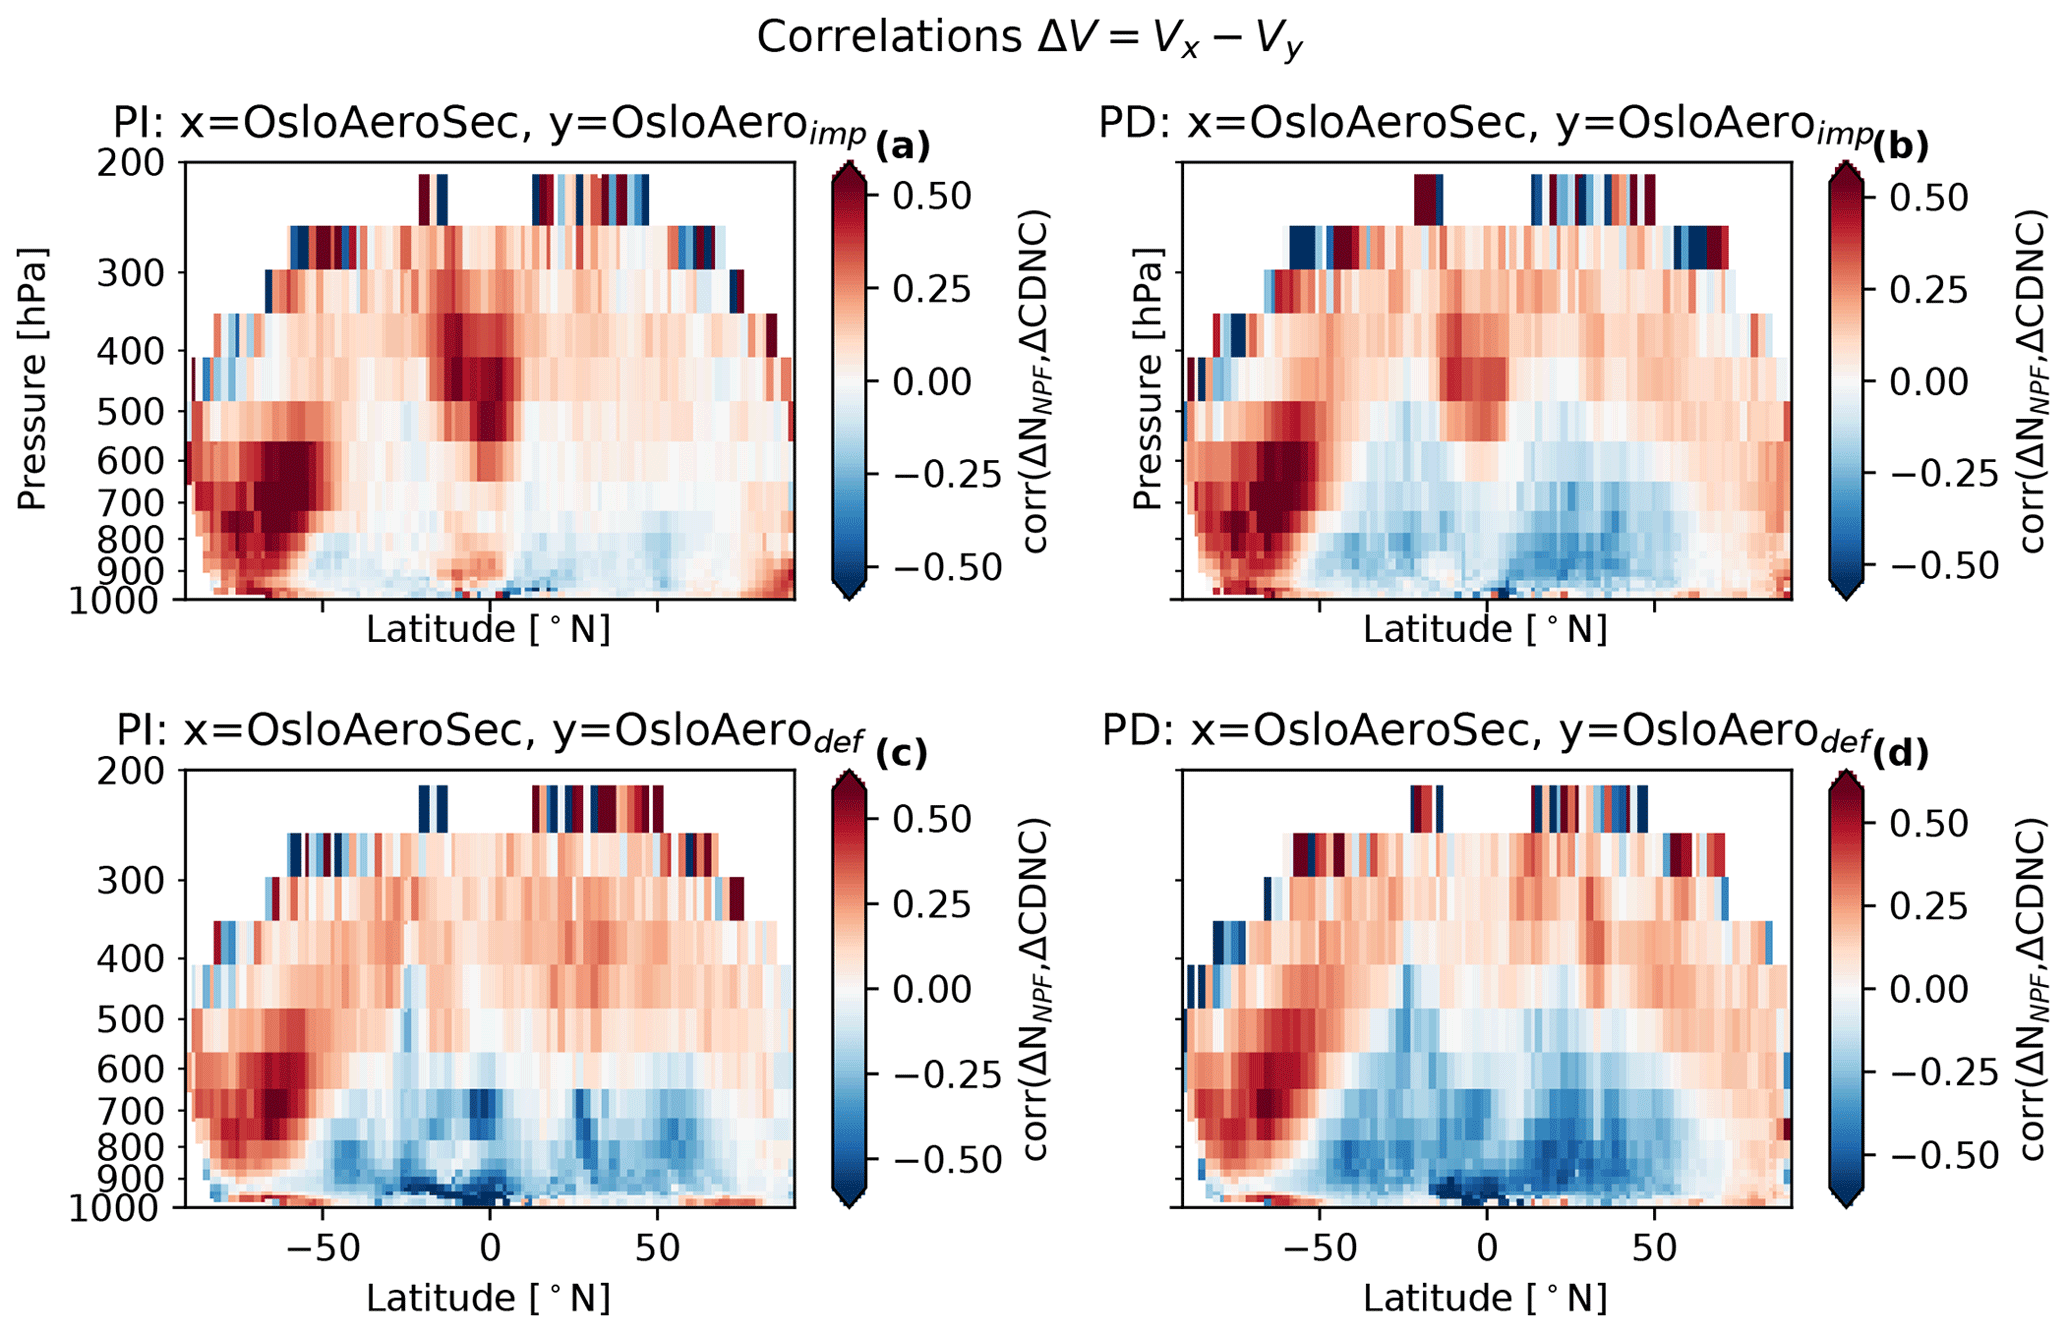
Figure 10Correlations between the absolute difference in CDNC and the absolute difference in NNPF between the model versions, calculated from monthly mean files over time and longitude. The correlations from the difference between OsloAeroSec and OsloAeroimp are shown in panels (a) and (b). The correlations from the difference between OsloAeroSec and OsloAerodef are shown in panels (c) and (d). The correlations in the PI simulations are shown to the left, and the ones for the PD simulations are shown to the right.
Table 5Region overview. These regions are used to create vertical average profiles.
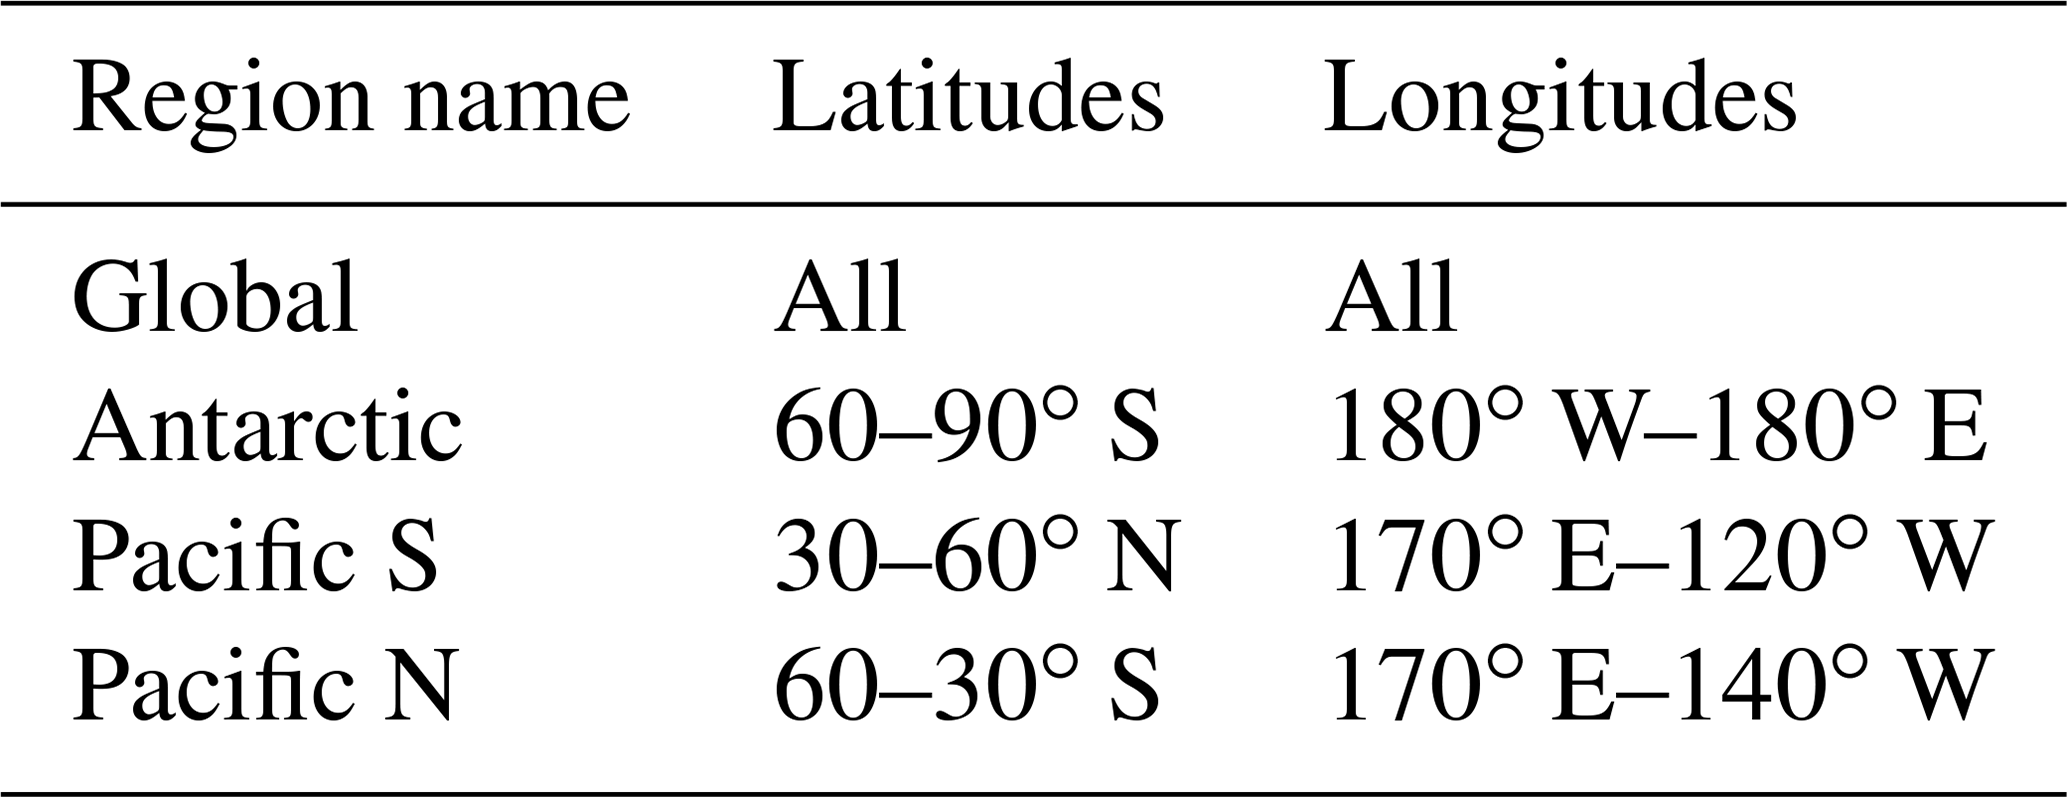
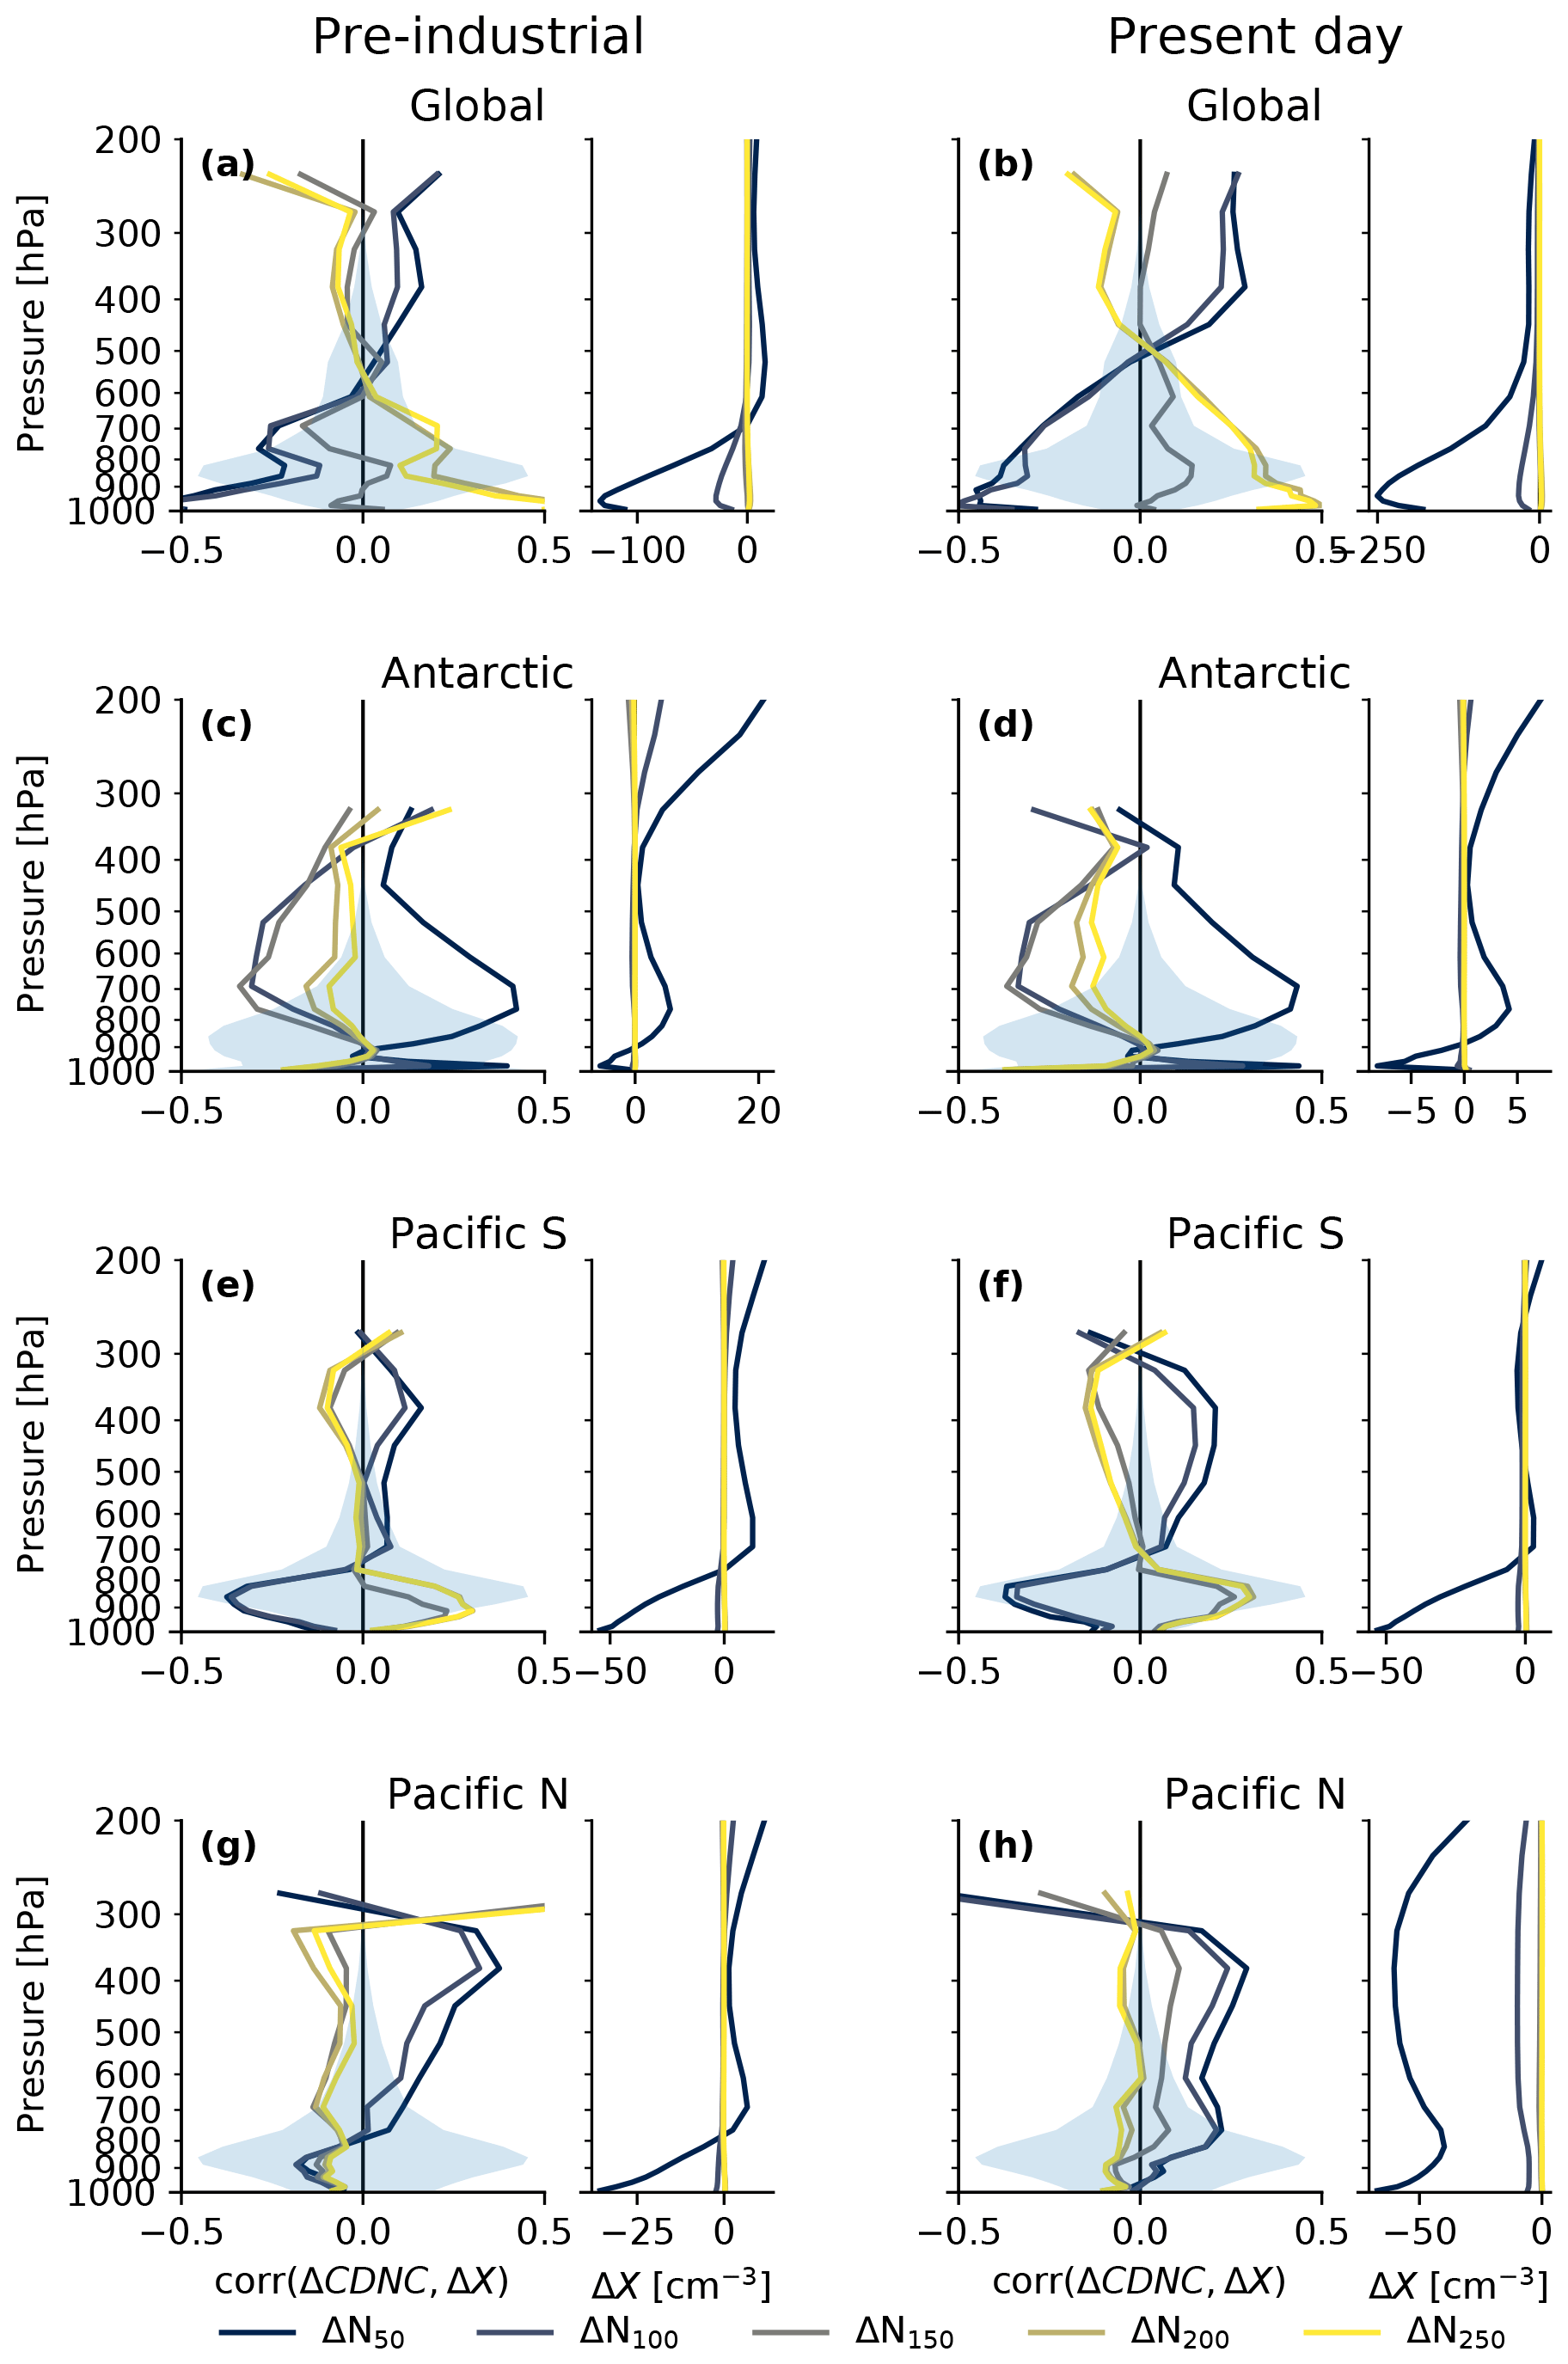
Figure 11Left side of each panel: correlations by pressure level between the absolute difference between OsloAerodef and OsloAeroSec in cloud droplet number concentration (ΔCDNC) and the absolute difference in the number of particles with diameters above 50, 100, 150, 200 and 250 nm for different regions. The blue shading signifies the fractional occurrence of liquid cloud and is included to give an idea of where the aerosols may actually have a noticeable impact on clouds. The right side of each panel shows the change in the aerosol concentration for the relevant region. See Table 5 for definitions of regions.
Second, we compute the correlations between ΔCDNC and ΔN50, ΔN100, ΔN150, ΔN200 and ΔN250 for different regions (see Table 5 for definitions) at different heights. These relationships for the PI simulations are shown in Fig. 11, column 1. If ΔCDNC clearly correlates with the change in the concentration of particles above some diameter d, Nd, this indicates that these particle sizes are relevant for cloud droplet activation in the region. On the other hand, if there is a negative correlation, this indicates that the particles are too small to activate.
Globally, Fig. 11a shows that CDNC correlates most strongly with N200 and N250 close to the surface, with an anticorrelation with N50 and N100. The sign of the correlations switches at around 600 hPa. In the relatively clean Antarctic (here defined as below 60∘ S), the correlation is positive with the smaller particles, i.e., N50, throughout the atmosphere. This indicates that NPF enhances activation in Antarctica and that the number of particles dominates rather than the size of the particles. Figure 11e and g show the South and North Pacific and are included because they show opposite sign in CDNC for the PD simulations; we will discuss them further in the next section. In the PI simulations, however, the South Pacific shows a clear correlation with the larger particles (diameters larger than 150, 200 and 250), while in the North Pacific, the correlation is closer to zero or insignificant.
5.4.2 Summary Hypothesis 3: higher activation in the pre-industrial atmosphere
We do indeed see higher aerosol activation and higher CDNC with OsloAeroSec in the PI simulations. This is due to a combination of two things: (1) in pristine areas, NPF particles are likely to activate and lead to higher CDNC – i.e., NPF enhances activation. In these areas OsloAeroSec in general produces more NPF particles than OsloAerodef, and thus CDNC increases. (2) In areas with higher aerosol number concentrations, NPF particles are unlikely to activate and NPF inhibits cloud droplet activation due to reducing the size of the larger particles. In these regions, OsloAeroSec in general produces fewer NPF particles than OsloAerodef, and thus CDNC increases.
5.5 The present-day atmosphere: model-to-model differences
We now move to consider differences in the PD simulations between OsloAeroSec and OsloAerodef and will discuss Hypothesis 4, “lower activation in PD”.
With PI emissions, there are large regions, especially at higher altitudes, for which OsloAeroSec produced more NPF particles than the other model versions. With PD emissions, these areas shrink, as the atmosphere becomes less pristine overall. This is seen in Fig. 7d–f (near-surface average) and Fig. 8d–f (zonal average). Furthermore, it is interesting to see the impact of emissions in the Northern Hemisphere versus the Southern Hemisphere in the PD simulations. In the Northern Hemisphere, OsloAeroSec produces fewer particles than the other model versions at most heights and latitudes, while the opposite is the case for the Southern Hemisphere. This is likely due to a combination of much higher emissions and more vertical mixing in the Northern than Southern Hemisphere. In other words, larger parts of the Northern Hemisphere pass into a pollution level regime wherein the sectional scheme produces fewer particles than the others.
5.5.1 Cloud properties
Figure 9b shows the difference in CDNC(CT) between OsloAeroSec and OsloAerodef in the PD simulations. The Southern Hemisphere resembles the difference in PI (Fig. 9a) with a widespread increase in CDNC. In the middle to high northern latitudes, on the other hand, CDNC is lower in OsloAeroSec than in OsloAerodef, which is opposite to the PI simulations. In these last pristine northern regions, more NPF particles in OsloAerodef indeed seem to lead to higher CDNC than in OsloAeroSec.
Let us again consider the model-to-model difference in size distribution. Figure 9d, f and h show ΔN100, ΔN150 and ΔN200. Here we see that the pristine Northern Hemisphere ΔCDNC most resembles the change in N100, while in the Southern Hemisphere, ΔCDNC more closely resembles that of the larger particles (N150 andN200). Note how the polluted regions in the PD simulations around India and China have higher concentrations of N200 and N150 in OsloAeroSec than OsloAerodef and corresponding higher CDNC. In these polluted regions, NPF in general inhibits cloud droplet activation because the activation diameter is large (bottom panel in Fig. 5). This is because there are many large particles which activate early and act as a sink for water vapor, thus reducing Smax and increasing the activation diameter (see Fig. S20b). On the other hand, the decreases in CDNC in OsloAeroSec compared to OsloAerodef in the PD northern high latitudes correspond better to the change in the smaller particles, N100 and partially N150. This indicates that in these regions NPF enhances cloud droplet activation due to a smaller activation diameter (top panel in Fig. 5). Note that this is different in the PI and PD simulations: in the PD simulations, the CDNC goes down with OsloAeroSec in the northern high latitudes; in the PI it goes up. The reason for this is that the activation diameter depends on both the maximum supersaturation and the hygroscopicity. The hygroscopicity of the particles almost doubles from the PI to the PD due to increased sulfate emissions (see Fig. S26). More hygroscopic particles in the PD simulations can then activate at smaller diameters (given the same Smax). The regions where CDNC is enhanced by NPF thus spread in the pristine northern latitudes, favoring cloud droplet activation in OsloAerodef over OsloAeroSec. Mark that the difference in hygroscopicity is large between the PI and PD simulations (again, see Fig. S26) but small (∼ 5 %) between the different model versions.
It is thus clear that hygroscopicity plays a role, but only in terms of making the effect of NPF particles different in the PI and PD simulations; with PD emissions the NPF particles are more likely to activate. In other words, because hygroscopicity increases in PD, the areas where NPF enhances cloud activation expand in the PD Northern Hemisphere compared to the pre-industrial atmosphere.
Let us again consider the correlations between ΔCDNC and NNPF, ΔN50, ΔN100, ΔN150, ΔN200 and ΔN250 for different regions, as shown for the PD atmosphere in Figs. 10 and 11b, d, f and h.
Globally, the correlation of ΔCDNC with the change in larger particles is more pronounced in the PD than the PI simulations (Figs. 11b and 10d), possibly indicating a stronger supersaturation adjustment (reduced Smax), with more polluted PD emission conditions leading to a higher activation diameter.
Furthermore, we investigate the North and South Pacific separately in Fig. 11e–h because these two show opposite sign in the PD simulations: in the North Pacific, OsloAeroSec has lower CDNC than OsloAerodef, while in the South Pacific OsloAeroSec has higher CDNC (see Fig. S9b in the Supplement). In the South Pacific (Fig. 11e and f), the CDNC correlates best with the larger particles (diameter above 150 nm) in both PI and PD. In the North Pacific, on the other hand, the correlation is not clear for any particle number in the PI (Fig. 11g) and slightly positive for the smaller particle sizes in PD (Fig. 11h). The likely cause for the difference between the two cases is that (1) the South Pacific has higher concentrations of larger sea salt particles than the North Pacific (not shown), which can limit the maximum supersaturation and thus lead to a higher activation diameter; and (2) as mentioned above, the sulfate emissions are much higher in the PD Northern Hemisphere, leading to more hygroscopic particles and a lower activation diameter. In the South Pacific, we are therefore at the bottom panel of the sketch in Fig. 5, while in the North Pacific, we are more on the top panel. Note again that the hygroscopicity between the model versions with the same emissions (either with PI or PD emissions) changes very little (Fig. S26), which is why we only discuss changes between the PI and PD.
5.5.2 Summary Hypothesis 4: lower activation in the present-day atmosphere
The discussion above shows that regionally, lower cloud droplet activation and CDNC with OsloAeroSec in the PD simulations does indeed play a role in reducing the ERFaci in the pristine high northern latitudes and the North Pacific. Here the CDNC is lower with OsloAeroSec than OsloAerodef, and thus OsloAerodef has a stronger negative cloud radiative effect in the PD simulations. On the other hand, cloud droplet activation and CDNC in more polluted regions are higher with OsloAeroSec than OsloAerodef (see Fig. 9b) in the PD simulations. This, however, does not have as big an impact on radiation (see, e.g., Fig. S16 in the Supplement) firstly because these areas are mostly continental and the cloud radiative effect is larger over dark ocean surfaces (e.g., the North Pacific) and secondly because the CDNC is already high in these regions with OsloAerodef, and thus the clouds are less susceptible to the increase in OsloAeroSec (see the Introduction for a description of this effect). Furthermore, we have found that hygroscopicity changes from PI to PD play a role by reducing the activation diameter and making NPF particles more likely to activate in the PD simulations compared to the PI. This means that the areas where NPF enhances cloud droplet activation expand, and thus there are larger areas where OsloAerodef has higher CDNC than OsloAeroSec. Both these factors result in a lower CDNC in the high northern latitudes with OsloAeroSec and a corresponding lower magnitude in NCREGhan.
5.6 Comparison to OsloAeroimp
We have mostly focused on the comparison of OsloAeroSec to OsloAerodef in the above section, but there are important points to take away from comparing OsloAeroSec to OsloAeroimp as well. Note that OsloAeroimp has the same updates to oxidants and nucleation rate as OsloAeroSec, but it does not have the sectional scheme. Also, remember that OsloAeroimp has much lower NPF efficiency than OsloAerodef, but compared to OsloAeroSec it is more similar; this depends on the region. In general OsloAeroSec produces more NPF particles in pristine regions, while OsloAeroimp produces more particles in regions with higher aerosol concentrations.
When comparing only OsloAeroSec and OsloAerodef, it is not possible to separate the effect that increased NPF efficiency in remote regions has from decreased NPF efficiency in high-aerosol regions with respect to the ERFaci. It is perhaps tempting to think that the reduction in NPF efficiency alone is responsible for the overall effect and that the increase in NPF efficiency in remote regions is negligible. If so, any scheme which reduced NPF efficiency would have the same effect. The OsloAeroimp simulation, however, represents exactly such a scheme which reduces the NPF efficiency compared to OsloAerodef, with roughly the same amount as OsloAeroSec, though without the increases in NPF efficiency in remote regions. However, OsloAeroimp does not weaken ERFaci like OsloAeroSec does but rather slightly strengthens it.
5.7 Summary of hypotheses
We now summarize and relate the results back to the hypotheses presented in Sect. 5.2.
- 1.
Smaller ΔPD−PINa. While it is true that Na increases less from PI to PD with OsloAeroSec than OsloAerodef (and OsloAeroimp), this can only explain the results in remote regions. Furthermore, OsloAeroimp offers as a counter-argument against this hypothesis: it also has a lower PD-to-PI change in Na (ΔPD−PINa) than OsloAerodef, but contrary to OsloAeroSec, OsloAeroimp has a stronger negative ERFaci than OsloAerodef. In sum, this hypothesis does not explain the differences in ERFaci well.
- 2.
Higher Na in PI. OsloAeroSec mostly produces fewer particles than OsloAerodef in the PI simulations, and this is thus only true in remote regions. This hypothesis can therefore not explain the resulting ERFaci.
- 3.
Higher cloud droplet activation in PI. We found that OsloAeroSec has higher CDNC than the other model versions in the PI simulations due to more efficient NPF in remote regions where NPF enhances cloud droplet activation (small activation diameter) and due to less efficient NPF in regions where NPF inhibits cloud droplet activation (large activation diameter). In these last areas, OsloAeroSec indeed has a higher concentration of larger particles than OsloAerodef and OsloAeroimp due to the condensate being distributed to fewer particles in OsloAeroSec. This hypothesis therefore explains the part of the change in ERFaci originating from the difference in NCREGhan in the PI simulations well.
- 4.
Lower cloud droplet activation in PD. We found this hypothesis to play an important role in the northern high latitudes, especially the North Pacific, where sulfate emissions are high in the PD simulations. Due to higher hygroscopicity in the PD simulations compared to the PI, the NPF particles are more likely to activate (smaller activation diameter), and thus the number of particles (which is lower in OsloAeroSec) is more important than the particles sizes. This hypothesis is therefore important to explain the changes in the PD simulations.
Additionally, after the analysis of the results, we may add two more explanations.
- 5.
Hygroscopicity. As explained for Hypothesis 4 above, the change in hygroscopicity from PI to PD results in larger areas in the northern pristine latitudes having an NPF-enhanced cloud droplet activation regime in the PD simulations compared to the PI. This results in stronger NCREGhan with OsloAerodef than OsloAeroSec in the PD simulations, which further leads to a stronger ERFaci in OsloAerodef than OsloAeroSec.
- 6.
Regional differences. The comparison with OsloAerodef shows that regional differences in NPF matter significantly. For reasons discussed above, OsloAeroSec gives higher CDNC in the PI simulation in regions with susceptible clouds and large ERFaci, which dominates the global average.
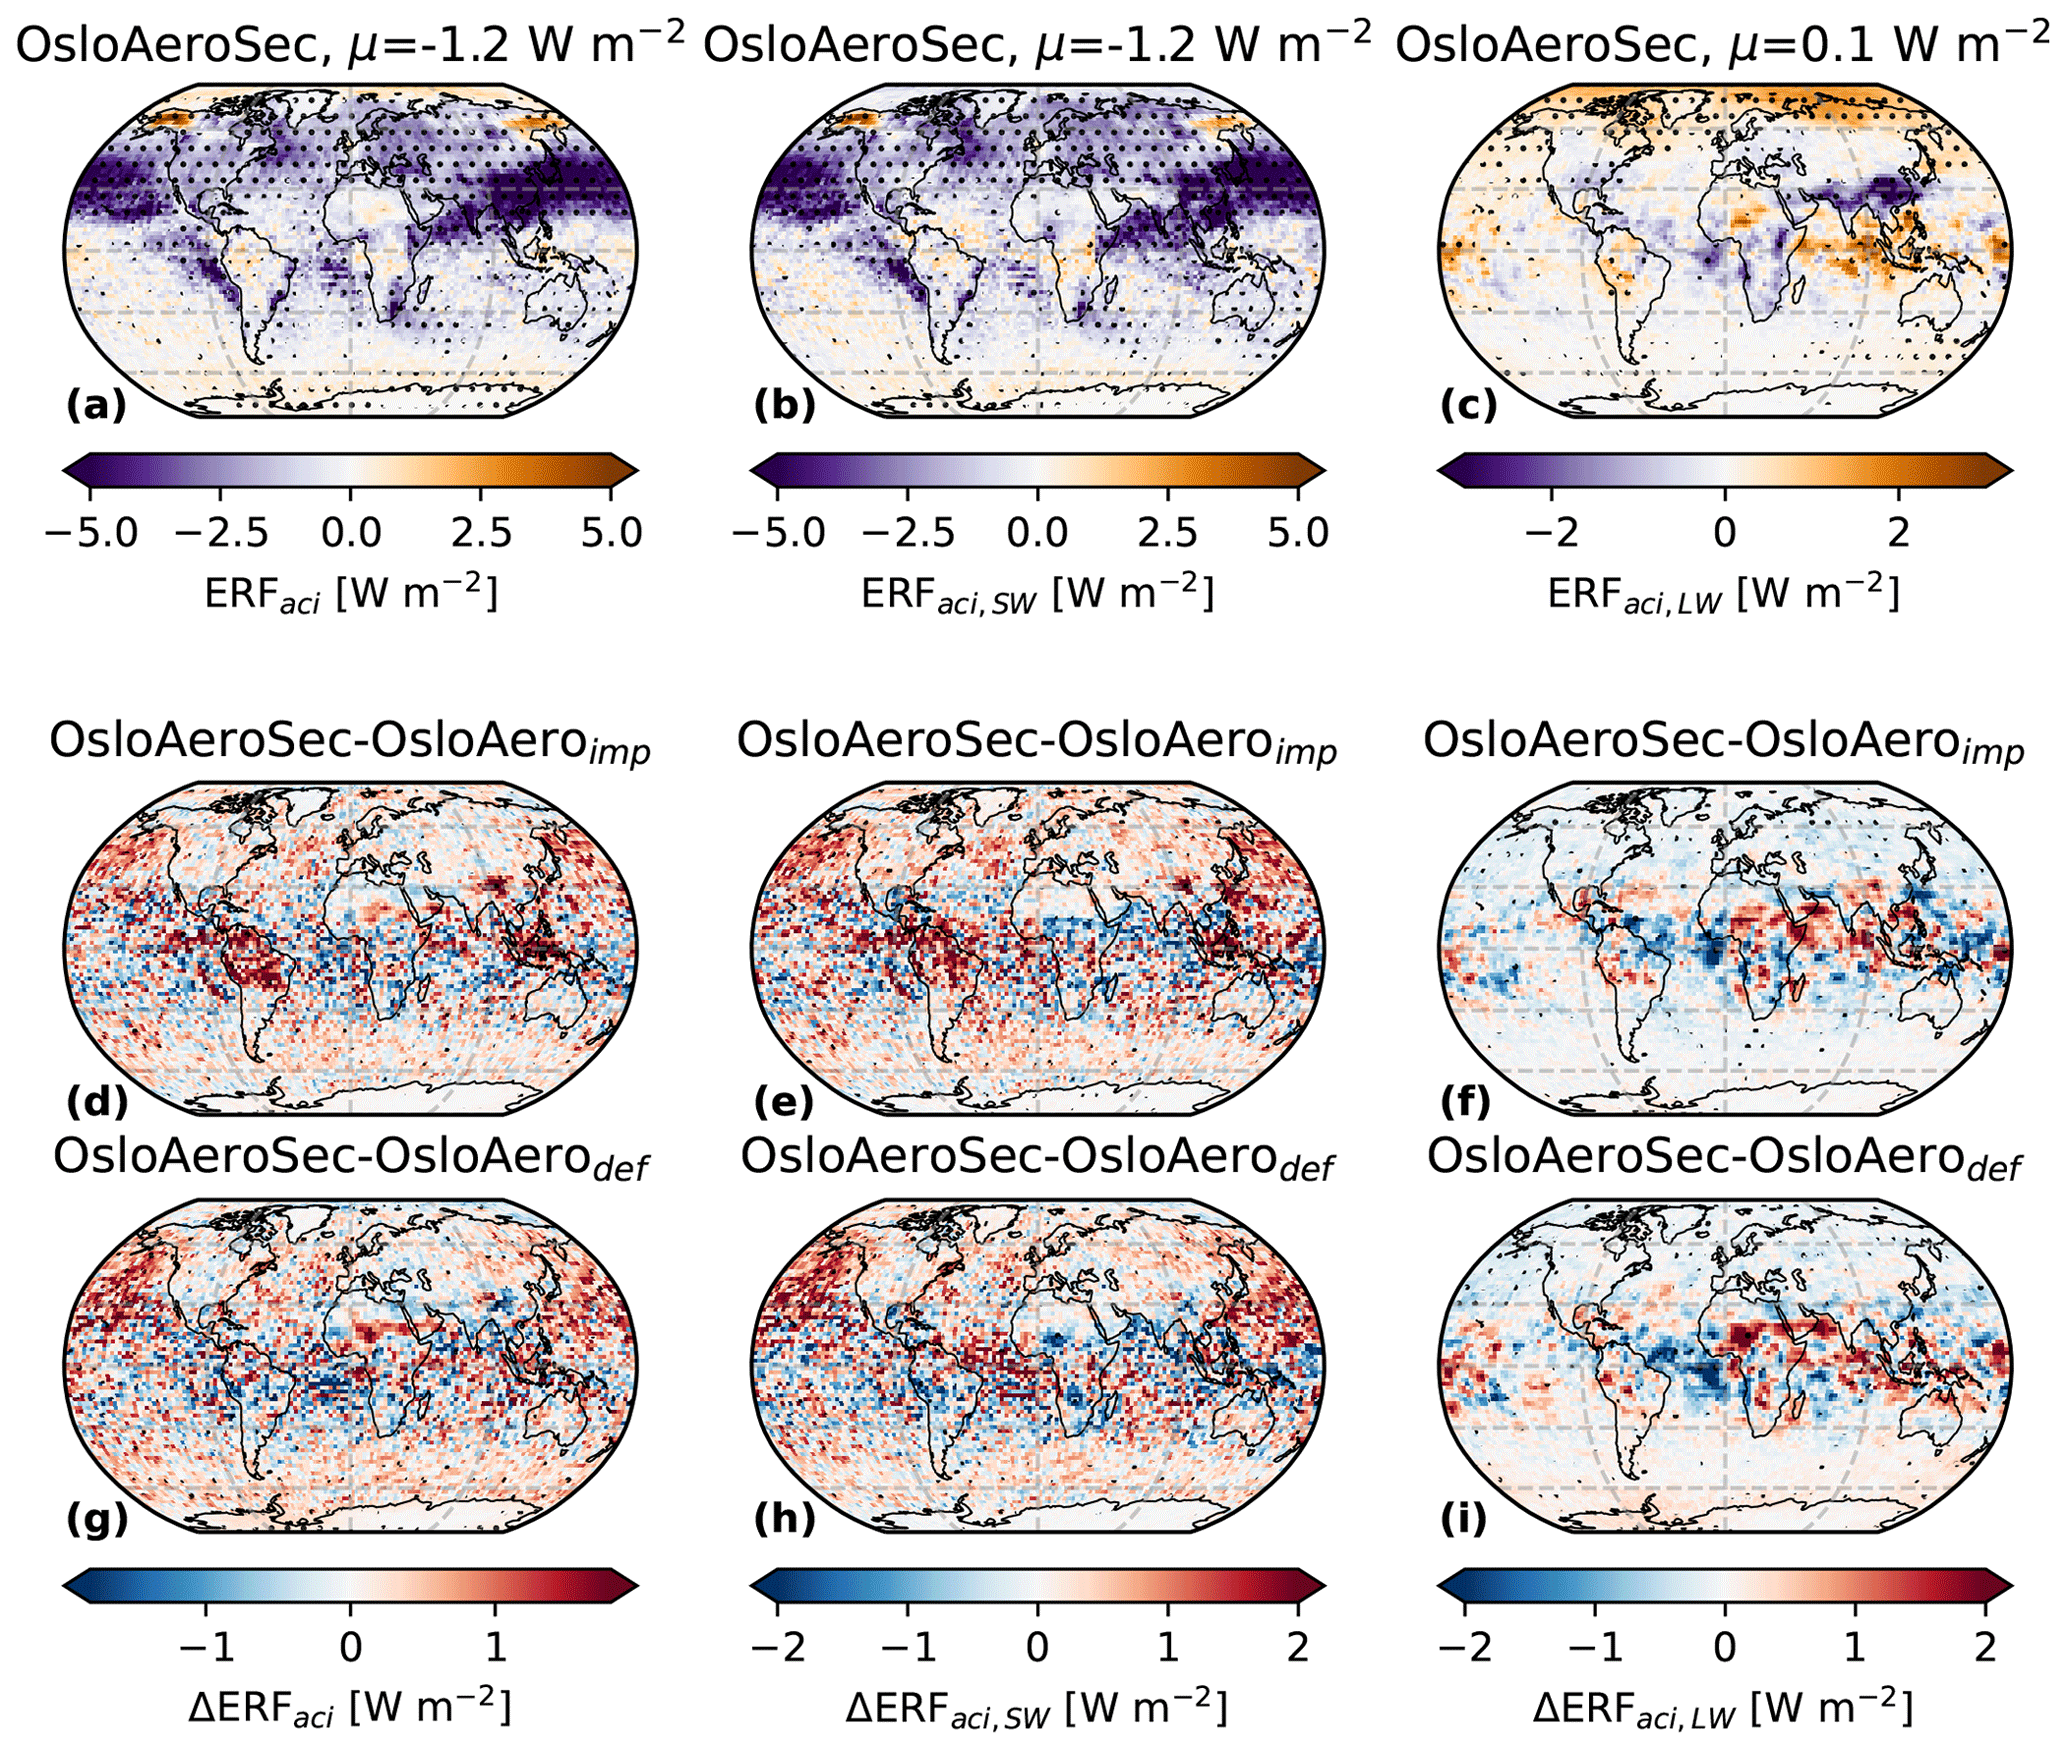
Figure 12Annual averages of the ERFaci (a, d and g), the shortwave component of ERFaci, ERFaci,SW (b, e and h) and the longwave component of the ERFaci, ERFaci,LW (c, f and i). The top panel shows the absolute values for OsloAeroSec, while the second and third rows show the difference of OsloAeroimp minus OsloAeroSec (second row) and OsloAerodef minus OsloAeroSec (third row). Dots are included in the plots to indicate where the difference between the two models is significant with a two-tailed paired Student's t test with 95 % confidence.
The results in this paper go in line with previous work, which shows that the ERFaci is sensitive to the PI aerosol characteristics (e.g., Carslaw et al., 2013) and that changes in the NPF parameterization can highly influence ERFaci (e.g., Gordon et al., 2016). However, the reduction in ERFaci found with OsloAeroSec in our simulations is not a result of increased NPF under PI conditions alone. Rather, the increase in CDNC and NCREGhan in the PI simulation originates from increased NPF efficiency at locations where the NPF enhances cloud droplet activation and decreased NPF efficiency where NPF inhibits particle activation. Additionally, we find that the modeled increase in hygroscopicity from PI to PD from increased sulfate emissions results in a lower activation diameter, and thus more of the NPF particles contribute to CDNC.
The effect of NPF inhibition on cloud droplet activation was also found by Sullivan et al. (2018); they modeled the NPF effect on clouds over the midwestern USA using WRF-Chem v3.6.1 and using a 20-bin sectional aerosol scheme (Model for Simulating Aerosol Interactions and Chemistry, MOSAIC). As in this study, they find that the growth of larger particles is inhibited by the increased condensation sink from the NPF particles. That fact that the same effect is seen in simulations with a completely differently structured aerosol model shows it to be unlikely that this is an artifact of the OsloAero model. However, their study uses the same activation scheme, Abdul-Razzak and Ghan (2000), and we cannot exclude the possibility that this scheme, for example, overestimates the supersaturation adjustment effect.
It is intrinsically difficult to directly evaluate cloud–aerosol interactions in models versus reality. This is partly because we cannot measure the pre-industrial atmosphere, but also due to the noisy nature of clouds. The evaluation of the model versions used in this study therefore focused on particles in sizes relevant for cloud activation and was primarily done in Blichner et al. (2021). We have added further validation using three datasets (Andreae et al., 2015; Wofsy et al., 2018; Andrade et al., 2015) representing different parts of the atmosphere than the previous comparison to the Supplement to this study (see Sect. S2 in the Supplement). Overall, the sectional scheme shows significant improvement in the representation of particles in the CCN size range, and this indicates that our results for ERFaci here represent an improvement.
As mentioned in Sect. 2, the sectional scheme, OsloAeroSec, has a higher contribution from organics to growth from 5 nm than OsloAerodef and OsloAeroimp (only ELVOCs in OsloAero). One could argue that this may be the driving factor of all these results, but in fact this is not the case. We did a test run in which organics were treated in the same way in OsloAeroSec as in OsloAerodef and OsloAeroimp, and the result in terms of particle number changes very little (see Figs. S27 and S28 in the Supplement).
We also investigated the sensitivity of ERFaci to changes in the nucleation rate with both the original model and with the sectional scheme. This investigation is detailed in Sect. S1 in the Supplement. Overall the results show that the change in ERFaci between the sectional and default model is very resistant to changes in nucleation rate. There are small differences within the OsloAero model versions and within the OsloAeroSec versions based on the nucleation rate, but there are larger differences between the two groups.
Note that we have not discussed CCN concentrations in this discussion. There are two reasons for this: firstly, these are not yet available as standard output for CAM6-Nor. Secondly, the CCN concentrations at a given supersaturation matters only when this supersaturation is actually achieved, so focusing on CDNC gives a more complete picture which is more closely related to the actual climatic impact of the particles in question.
These results also illustrate the importance of adequately representing activation when investigating the effect of NPF on climate and not simply considering CCN at fixed supersaturation, as this will omit not only regional changes in updraft velocities, but also supersaturation adjustment by the aerosol population.
In this study, we have shown that including a sectional scheme (OsloAeroSec) for the growth of particles from nucleation up to the original modal scheme reduces the estimated ERFaci by 0.13–0.14 W m−2. The reduction originates from higher CDNC and NCREGhan in the PI simulation, together with a smaller increase from PI to PD. By comparing model versions with different NPF parameterizations in the pre-industrial and present-day atmosphere, we find that NPF in fact inhibits cloud droplet activation in parts of the atmosphere and leads to lower CDNC due to reducing the growth of the larger primary particles. The overall ERFaci therefore depends on in which regions NPF is high or low in both the PI and the PD simulations. The reduction in ERFaci with OsloAeroSec originates partly from higher NPF efficiency in PI areas where NPF enhances cloud droplet activation and lower NPF efficiency in PI areas where NPF inhibits cloud droplet activation. Furthermore, we find that the increase in sulfate from the PI to the PD simulation increases the hygroscopicity of the particles and thus allows more NPF particles to activate. This expands the areas where NPF enhances cloud droplet activation in the PD simulations, which also contributes to a weaker ERFaci for OsloAeroSec than OsloAerodef.
Roughly speaking, we can say that the results in ERFaci originate from OsloAeroSec: adding particles where the NPF particles are likely to act as CCN and removing them where they are unlikely to activate directly and rather act to diminish the size of the other particles.
Overall, this study shows that a more physical representation of the early growth of particles results in a lower ERFaci and that adequately representing early growth on a regional scale is important for estimation of ERFaci.
The model code of NorESM2, release 2.0.1, is available at https://doi.org/10.5281/zenodo.3760870 (Seland et al., 2020b; see Seland et al., 2020a, for details). The code modifications in OsloAeroSec are available at https://doi.org/10.5281/zenodo.4265057 (Blichner, 2020); see Blichner et al. (2021) for details. The post-processing code for creating the figures in this paper is available at https://doi.org/10.5281/zenodo.5559027 (Blichner, 2021b).
The model output is available for download at https://doi.org/10.11582/2021.00087 (Blichner, 2021a). Measurement data used in the Supplement are available for download as follows: the Chacataya data are available for download from the EBAS database (http://ebas-data.nilu.no/DataSets.aspx?nations=BO068BOL&components=particle_number_size_distribution&matrices=aerosol&fromDate=1970-01-01&toDate=2021-12-31, Andrade and Zaratti, 2021). The data from the ATTO were downloaded from the Laboratory of Atmospheric Physics (LFA, IF-USP) at http://ftp.lfa.if.usp.br/ftp/public/LFA_Processed_Data/T0a_ATTO/Level3/SMPS_2014toNov2020_ATTO_60m_InstTower/ (Laboratory of Atmospheric Physics LFA/IF-USP, 2021). The ATom data were accessed from https://doi.org/10.3334/ORNLDAAC/1581 (Wofsy et al., 2018) and https://doi.org/10.3334/ORNLDAAC/1613 (Wofsy and ATom Science Team, 2018).
The supplement related to this article is available online at: https://doi.org/10.5194/acp-21-17243-2021-supplement.
SMB did the model code development and performed the simulations with NorESM. SMB did the data analysis and wrote the paper. SMB, MKS and TKB contributed to discussions regarding the experimental design and data analysis. All authors have contributed to the discussions regarding the paper.
The authors declare that they have no conflict of interest.
Publisher's note: Copernicus Publications remains neutral with regard to jurisdictional claims in published maps and institutional affiliations.
Many thanks to Dirk Oliviè and Alf Kirkevåg at Meteorologisk institutt for answering the many questions, and thanks to Dirk Oliviè, who let us use his simulations as initialization for simulations. Thanks to Diego Aliaga for helping to design the schematic in Fig. 5. For the model evaluation (see the Supplement), we would like to thank the science teams providing the data: we thank the Amazon Tall Tower Observatory (ATTO) science team for providing the SMPS dataset from the site. We thank the Chacaltaya/GAW station science team for providing the SMPS dataset from the site. Finally, we thank the ATom team for providing the dataset, especially Christina Williamson, Charles Brock and Agnieszka Kupc for helpful comments on the analysis.
This work was funded under the LATICE strategic research initiative funded by the Faculty of Mathematics and Natural Sciences at the University of Oslo. This work has been financed by the Research Council of Norway (RCN) through the NOTUR/Norstore project (NN2806K and NS9066K).
This paper was edited by Kostas Tsigaridis and reviewed by two anonymous referees.
Abdul-Razzak, H. and Ghan, S. J.: A Parameterization of Aerosol Activation: 2. Multiple Aerosol Types, J. Geophys. Res.-Atmos., 105, 6837–6844, https://doi.org/10.1029/1999JD901161, 2000. a, b
Andrade, M., Zaratti, F., Forno, R., Gutiérrez, R., Moreno, I., Velarde, F., Ávila, F., Roca, M., Sánchez, M. F., Laj, P., Jaffrezo, J. L., Ginot, P., Sellegri, K., Ramonet, M., Laurent, O., Weinhold, K., Wiedensohler, A., Krejci, R., Bonasoni, P., Cristofanelli, P., Whiteman, D., Vimeux, F., Dommergue, A., and Magand, O.: Puesta En Marcha de Una Nueva Estación de Monitoreo Climático En Los Andes Centrales de Bolivia: La Estación Gaw/Chacaltaya, Revista Boliviana de Física, 26, 06–15, 2015. a
Andreae, M. O., Acevedo, O. C., Araùjo, A., Artaxo, P., Barbosa, C. G. G., Barbosa, H. M. J., Brito, J., Carbone, S., Chi, X., Cintra, B. B. L., da Silva, N. F., Dias, N. L., Dias-Júnior, C. Q., Ditas, F., Ditz, R., Godoi, A. F. L., Godoi, R. H. M., Heimann, M., Hoffmann, T., Kesselmeier, J., Könemann, T., Krüger, M. L., Lavric, J. V., Manzi, A. O., Lopes, A. P., Martins, D. L., Mikhailov, E. F., Moran-Zuloaga, D., Nelson, B. W., Nölscher, A. C., Santos Nogueira, D., Piedade, M. T. F., Pöhlker, C., Pöschl, U., Quesada, C. A., Rizzo, L. V., Ro, C.-U., Ruckteschler, N., Sá, L. D. A., de Oliveira Sá, M., Sales, C. B., dos Santos, R. M. N., Saturno, J., Schöngart, J., Sörgel, M., de Souza, C. M., de Souza, R. A. F., Su, H., Targhetta, N., Tóta, J., Trebs, I., Trumbore, S., van Eijck, A., Walter, D., Wang, Z., Weber, B., Williams, J., Winderlich, J., Wittmann, F., Wolff, S., and Yáñez-Serrano, A. M.: The Amazon Tall Tower Observatory (ATTO): overview of pilot measurements on ecosystem ecology, meteorology, trace gases, and aerosols, Atmos. Chem. Phys., 15, 10723–10776, https://doi.org/10.5194/acp-15-10723-2015, 2015. a
Bellouin, N., Quaas, J., Gryspeerdt, E., Kinne, S., Stier, P., Watson-Parris, D., Boucher, O., Carslaw, K. S., Christensen, M., Daniau, A.-L., Dufresne, J.-L., Feingold, G., Fiedler, S., Forster, P., Gettelman, A., Haywood, J. M., Lohmann, U., Malavelle, F., Mauritsen, T., McCoy, D. T., Myhre, G., Mülmenstädt, J., Neubauer, D., Possner, A., Rugenstein, M., Sato, Y., Schulz, M., Schwartz, S. E., Sourdeval, O., Storelvmo, T., Toll, V., Winker, D., and Stevens, B.: Bounding Global Aerosol Radiative Forcing of Climate Change, Rev. Geophys., 58, e2019RG000660, https://doi.org/10.1029/2019RG000660, 2020. a, b
Bentsen, M., Bethke, I., Debernard, J. B., Iversen, T., Kirkevåg, A., Seland, Ø., Drange, H., Roelandt, C., Seierstad, I. A., Hoose, C., and Kristjánsson, J. E.: The Norwegian Earth System Model, NorESM1-M – Part 1: Description and basic evaluation of the physical climate, Geosci. Model Dev., 6, 687–720, https://doi.org/10.5194/gmd-6-687-2013, 2013. a, b
Blichner, S. M.: Model Output for “Reduced Effective Radiative Forcing from Cloud-Aerosol Interactions (ERFaci) with Improved Treatment of Early Aerosol Growth in an Earth System Model”, Norstore [data set], https://doi.org/10.11582/2021.00087, 2021a. a
Blichner, S. M.: Sarambl/OAS-ERF: Publication Release, Zenodo [code], https://doi.org/10.5281/zenodo.5559027, 2021b. a
Blichner, S. M.: Sarambl/OAS-Code-Setup: Pre-Publication Release, Zenodo [code], https://doi.org/10.5281/zenodo.4265057, 2020. a
Blichner, S. M., Sporre, M. K., Makkonen, R., and Berntsen, T. K.: Implementing a sectional scheme for early aerosol growth from new particle formation in the Norwegian Earth System Model v2: comparison to observations and climate impacts, Geosci. Model Dev., 14, 3335–3359, https://doi.org/10.5194/gmd-14-3335-2021, 2021. a, b, c, d, e, f, g, h, i, j, k, l, m
Bogenschutz, P. A., Gettelman, A., Morrison, H., Larson, V. E., Craig, C., and Schanen, D. P.: Higher-Order Turbulence Closure and Its Impact on Climate Simulations in the Community Atmosphere Model, J. Climate, 26, 9655–9676, https://doi.org/10.1175/JCLI-D-13-00075.1, 2013. a
Bogenschutz, P. A., Gettelman, A., Hannay, C., Larson, V. E., Neale, R. B., Craig, C., and Chen, C.-C.: The path to CAM6: coupled simulations with CAM5.4 and CAM5.5, Geosci. Model Dev., 11, 235–255, https://doi.org/10.5194/gmd-11-235-2018, 2018. a, b
Boucher, O., Randall, D., Artaxo, P., Bretherton, C., Feingold, G., Forster, P., Kerminen, V.-M., Kondo, Y., Liao, H., Lohmann, U., Rasch, P., Satheesh, S., Sherwood, S., Stevens, B., and Zhang, X.: Clouds and Aerosols, in: Climate Change 2013: The Physical Science Basis. Contribution of Working Group I to the Fifth Assessment Report of the Intergovernmental Panel on Climate Change, edited by: Stocker, T., Qin, D., Plattner, G.-K., Tignor, M., Allen, S., Boschung, J., Nauels, A., Xia, Y., Bex, V., and Midgley, P., Cambridge University Press, Cambridge, UK and New York, NY, USA, pp. 571–658, 2013. a
Carslaw, K. S., Lee, L. A., Reddington, C. L., Pringle, K. J., Rap, A., Forster, P. M., Mann, G. W., Spracklen, D. V., Woodhouse, M. T., Regayre, L. A., and Pierce, J. R.: Large Contribution of Natural Aerosols to Uncertainty in Indirect Forcing, Nature, 503, 67–71, https://doi.org/10.1038/nature12674, 2013. a, b, c, d, e, f
Danabasoglu, G., Lamarque, J.-F., Bacmeister, J., Bailey, D. A., DuVivier, A. K., Edwards, J., Emmons, L. K., Fasullo, J., Garcia, R., Gettelman, A., Hannay, C., Holland, M. M., Large, W. G., Lauritzen, P. H., Lawrence, D. M., Lenaerts, J. T. M., Lindsay, K., Lipscomb, W. H., Mills, M. J., Neale, R., Oleson, K. W., Otto-Bliesner, B., Phillips, A. S., Sacks, W., Tilmes, S., van Kampenhout, L., Vertenstein, M., Bertini, A., Dennis, J., Deser, C., Fischer, C., Fox-Kemper, B., Kay, J. E., Kinnison, D., Kushner, P. J., Larson, V. E., Long, M. C., Mickelson, S., Moore, J. K., Nienhouse, E., Polvani, L., Rasch, P. J., and Strand, W. G.: The Community Earth System Model Version 2 (CESM2), J. Adv. Model. Earth Sy., 12, e2019MS001916, https://doi.org/10.1029/2019MS001916, 2020. a, b
Dentener, F., Kinne, S., Bond, T., Boucher, O., Cofala, J., Generoso, S., Ginoux, P., Gong, S., Hoelzemann, J. J., Ito, A., Marelli, L., Penner, J. E., Putaud, J.-P., Textor, C., Schulz, M., van der Werf, G. R., and Wilson, J.: Emissions of primary aerosol and precursor gases in the years 2000 and 1750 prescribed data-sets for AeroCom, Atmos. Chem. Phys., 6, 4321–4344, https://doi.org/10.5194/acp-6-4321-2006, 2006. a
Emmons, L. K., Walters, S., Hess, P. G., Lamarque, J.-F., Pfister, G. G., Fillmore, D., Granier, C., Guenther, A., Kinnison, D., Laepple, T., Orlando, J., Tie, X., Tyndall, G., Wiedinmyer, C., Baughcum, S. L., and Kloster, S.: Description and evaluation of the Model for Ozone and Related chemical Tracers, version 4 (MOZART-4), Geosci. Model Dev., 3, 43–67, https://doi.org/10.5194/gmd-3-43-2010, 2010. a
Forster, P. M., Richardson, T., Maycock, A. C., Smith, C. J., Samset, B. H., Myhre, G., Andrews, T., Pincus, R., and Schulz, M.: Recommendations for Diagnosing Effective Radiative Forcing from Climate Models for CMIP6, J. Geophys. Res.-Atmos., 121, 12460–12475, https://doi.org/10.1002/2016JD025320, 2016. a, b
Gettelman, A. and Morrison, H.: Advanced Two-Moment Bulk Microphysics for Global Models. Part I: Off-Line Tests and Comparison with Other Schemes, J. Climate, 28, 1268–1287, https://doi.org/10.1175/JCLI-D-14-00102.1, 2015. a
Ghan, S. J.: Technical Note: Estimating aerosol effects on cloud radiative forcing, Atmos. Chem. Phys., 13, 9971–9974, https://doi.org/10.5194/acp-13-9971-2013, 2013. a, b, c, d
Gordon, H., Sengupta, K., Rap, A., Duplissy, J., Frege, C., Williamson, C., Heinritzi, M., Simon, M., Yan, C., Almeida, J., Tröstl, J., Nieminen, T., Ortega, I. K., Wagner, R., Dunne, E. M., Adamov, A., Amorim, A., Bernhammer, A.-K., Bianchi, F., Breitenlechner, M., Brilke, S., Chen, X., Craven, J. S., Dias, A., Ehrhart, S., Fischer, L., Flagan, R. C., Franchin, A., Fuchs, C., Guida, R., Hakala, J., Hoyle, C. R., Jokinen, T., Junninen, H., Kangasluoma, J., Kim, J., Kirkby, J., Krapf, M., Kürten, A., Laaksonen, A., Lehtipalo, K., Makhmutov, V., Mathot, S., Molteni, U., Monks, S. A., Onnela, A., Peräkylä, O., Piel, F., Petäjä, T., Praplan, A. P., Pringle, K. J., Richards, N. A. D., Rissanen, M. P., Rondo, L., Sarnela, N., Schobesberger, S., Scott, C. E., Seinfeld, J. H., Sharma, S., Sipilä, M., Steiner, G., Stozhkov, Y., Stratmann, F., Tomé, A., Virtanen, A., Vogel, A. L., Wagner, A. C., Wagner, P. E., Weingartner, E., Wimmer, D., Winkler, P. M., Ye, P., Zhang, X., Hansel, A., Dommen, J., Donahue, N. M., Worsnop, D. R., Baltensperger, U., Kulmala, M., Curtius, J., and Carslaw, K. S.: Reduced Anthropogenic Aerosol Radiative Forcing Caused by Biogenic New Particle Formation, P. Natl. Acad. Sci. USA, 113, 12053–12058, https://doi.org/10.1073/pnas.1602360113, 2016. a, b
Gordon, H., Kirkby, J., Baltensperger, U., Bianchi, F., Breitenlechner, M., Curtius, J., Dias, A., Dommen, J., Donahue, N. M., Dunne, E. M., Duplissy, J., Ehrhart, S., Flagan, R. C., Frege, C., Fuchs, C., Hansel, A., Hoyle, C. R., Kulmala, M., Kürten, A., Lehtipalo, K., Makhmutov, V., Molteni, U., Rissanen, M. P., Stozkhov, Y., Tröstl, J., Tsagkogeorgas, G., Wagner, R., Williamson, C., Wimmer, D., Winkler, P. M., Yan, C., and Carslaw, K. S.: Causes and Importance of New Particle Formation in the Present-Day and Preindustrial Atmospheres: CAUSES AND ROLE OF NEW PARTICLE FORMATION, J. Geophys. Res.-Atmos., 122, 8739–8760, https://doi.org/10.1002/2017JD026844, 2017. a
Hansen, J., Sato, M., Ruedy, R., Nazarenko, L., Lacis, A., Schmidt, G. A., Russell, G., Aleinov, I., Bauer, M., Bauer, S., Bell, N., Cairns, B., Canuto, V., Chandler, M., Cheng, Y., Genio, A. D., Faluvegi, G., Fleming, E., Friend, A., Hall, T., Jackman, C., Kelley, M., Kiang, N., Koch, D., Lean, J., Lerner, J., Lo, K., Menon, S., Miller, R., Minnis, P., Novakov, T., Oinas, V., Perlwitz, J., Perlwitz, J., Rind, D., Romanou, A., Shindell, D., Stone, P., Sun, S., Tausnev, N., Thresher, D., Wielicki, B., Wong, T., Yao, M., and Zhang, S.: Efficacy of Climate Forcings, J. Geophys. Res.-Atmos., 110, D18104, https://doi.org/10.1029/2005JD005776, 2005. a
Hoesly, R. M., Smith, S. J., Feng, L., Klimont, Z., Janssens-Maenhout, G., Pitkanen, T., Seibert, J. J., Vu, L., Andres, R. J., Bolt, R. M., Bond, T. C., Dawidowski, L., Kholod, N., Kurokawa, J.-I., Li, M., Liu, L., Lu, Z., Moura, M. C. P., O'Rourke, P. R., and Zhang, Q.: Historical (1750–2014) anthropogenic emissions of reactive gases and aerosols from the Community Emissions Data System (CEDS), Geosci. Model Dev., 11, 369–408, https://doi.org/10.5194/gmd-11-369-2018, 2018. a
Iversen, T., Bentsen, M., Bethke, I., Debernard, J. B., Kirkevåg, A., Seland, Ø., Drange, H., Kristjansson, J. E., Medhaug, I., Sand, M., and Seierstad, I. A.: The Norwegian Earth System Model, NorESM1-M – Part 2: Climate response and scenario projections, Geosci. Model Dev., 6, 389–415, https://doi.org/10.5194/gmd-6-389-2013, 2013. a, b
Jacobson, M. Z.: Development and Application of a New Air Pollution Modeling System — Part III. Aerosol–Phase Simulations, Atmos. Environ., 31, 587–608, https://doi.org/10.1016/S1352-2310(96)00201-4, 1997. a
Jacobson, M. Z.: Fundamentals of Atmospheric Modeling, second edn., Cambridge University Press, Cambridge, https://doi.org/10.1017/CBO9781139165389, 2005. a, b
Karset, I. H. H.: Enhancing the Confidence in Estimates of Effective Radiative Forcing by Aerosol through Improved Global Modelling, PhD thesis, University of Oslo, Oslo, 2020. a, b
Karset, I. H. H., Berntsen, T. K., Storelvmo, T., Alterskjær, K., Grini, A., Olivié, D., Kirkevåg, A., Seland, Ø., Iversen, T., and Schulz, M.: Strong impacts on aerosol indirect effects from historical oxidant changes, Atmos. Chem. Phys., 18, 7669–7690, https://doi.org/10.5194/acp-18-7669-2018, 2018. a, b
Kerminen, V.-M. and Kulmala, M.: Analytical Formulae Connecting the “Real” and the “Apparent” Nucleation Rate and the Nuclei Number Concentration for Atmospheric Nucleation Events, J. Aerosol Sci., 33, 609–622, https://doi.org/10.1016/S0021-8502(01)00194-X, 2002. a, b
Kerminen, V.-M., Chen, X., Vakkari, V., Petäjä, T., Kulmala, M., and Bianchi, F.: Atmospheric New Particle Formation and Growth: Review of Field Observations, Environ. Res. Lett., 13, 103003, https://doi.org/10.1088/1748-9326/aadf3c, 2018. a, b, c, d
Kirkevåg, A., Iversen, T., Seland, Ø., Hoose, C., Kristjánsson, J. E., Struthers, H., Ekman, A. M. L., Ghan, S., Griesfeller, J., Nilsson, E. D., and Schulz, M.: Aerosol–climate interactions in the Norwegian Earth System Model – NorESM1-M, Geosci. Model Dev., 6, 207–244, https://doi.org/10.5194/gmd-6-207-2013, 2013. a, b
Kirkevåg, A., Grini, A., Olivié, D., Seland, Ø., Alterskjær, K., Hummel, M., Karset, I. H. H., Lewinschal, A., Liu, X., Makkonen, R., Bethke, I., Griesfeller, J., Schulz, M., and Iversen, T.: A production-tagged aerosol module for Earth system models, OsloAero5.3 – extensions and updates for CAM5.3-Oslo, Geosci. Model Dev., 11, 3945–3982, https://doi.org/10.5194/gmd-11-3945-2018, 2018. a, b
Kooperman, G. J., Pritchard, M. S., Ghan, S. J., Wang, M., Somerville, R. C. J., and Russell, L. M.: Constraining the Influence of Natural Variability to Improve Estimates of Global Aerosol Indirect Effects in a Nudged Version of the Community Atmosphere Model 5, J. Geophys. Res.-Atmos., 117, D23204, https://doi.org/10.1029/2012JD018588, 2012. a
Laboratory of Atmospheric Physics LFA/IF-USP: Particle size distribution measurements at the ATTO tower site, LFA [data set], available at: http://ftp.lfa.if.usp.br/ftp/public/LFA_Processed_Data/T0a_ATTO/Level3/SMPS_2014toNov2020_ATTO_60m_InstTower/, last access: 15 August 2021. a
Lawrence, D. M., Fisher, R. A., Koven, C. D., Oleson, K. W., Swenson, S. C., Bonan, G., Collier, N., Ghimire, B., van Kampenhout, L., Kennedy, D., Kluzek, E., Lawrence, P. J., Li, F., Li, H., Lombardozzi, D., Riley, W. J., Sacks, W. J., Shi, M., Vertenstein, M., Wieder, W. R., Xu, C., Ali, A. A., Badger, A. M., Bisht, G., van den Broeke, M., Brunke, M. A., Burns, S. P., Buzan, J., Clark, M., Craig, A., Dahlin, K., Drewniak, B., Fisher, J. B., Flanner, M., Fox, A. M., Gentine, P., Hoffman, F., Keppel-Aleks, G., Knox, R., Kumar, S., Lenaerts, J., Leung, L. R., Lipscomb, W. H., Lu, Y., Pandey, A., Pelletier, J. D., Perket, J., Randerson, J. T., Ricciuto, D. M., Sanderson, B. M., Slater, A., Subin, Z. M., Tang, J., Thomas, R. Q., Martin, M. V., and Zeng, X.: The Community Land Model Version 5: Description of New Features, Benchmarking, and Impact of Forcing Uncertainty, J. Adv. Model. Earth Sy., 11, 4245–4287, https://doi.org/10.1029/2018MS001583, 2019. a, b
Lee, S.-H., Gordon, H., Yu, H., Lehtipalo, K., Haley, R., Li, Y., and Zhang, R.: New Particle Formation in the Atmosphere: From Molecular Clusters to Global Climate, J. Geophys. Res.-Atmos., 124, 7098–7146, https://doi.org/10.1029/2018JD029356, 2019. a, b
Lee, Y. H., Pierce, J. R., and Adams, P. J.: Representation of nucleation mode microphysics in a global aerosol model with sectional microphysics, Geosci. Model Dev., 6, 1221–1232, https://doi.org/10.5194/gmd-6-1221-2013, 2013. a, b, c
Lehtinen, K. E. J., Dal Maso, M., Kulmala, M., and Kerminen, V.-M.: Estimating Nucleation Rates from Apparent Particle Formation Rates and Vice Versa: Revised Formulation of the Kerminen–Kulmala Equation, J. Aerosol Sci., 38, 988–994, https://doi.org/10.1016/j.jaerosci.2007.06.009, 2007. a, b, c, d, e, f, g, h
Myhre, G., Shindell, D., Bréon, F.-M., Collins, W., Fuglestvedt, J., Huang, J., Koch, D., Lamarque, J.-F., Lee, D., Mendoza, B., Nakajima, T., Robock, A., Stephens, G., Takemura, T., and Zhang, H.: Anthropogenic and Natural Radiative Forcing, in: Climate Change 2013: The Physical Science Basis. Contribution of Working Group I to the Fifth Assessment Report of the Intergovernmental Panel on Climate Change, edited by: Stocker, T., Qin, D., Plattner, G.-K., Tignor, M., Allen, S., Boschung, J., Nauels, A., Xia, Y., Bex, V., and Midgley, P., Cambridge University Press, Cambridge, UK and New York, NY, USA, pp. 659–740, 2013. a, b
Andrade, M. and Zaratti, F.: Ground based in situ observations of particle_number_size_distribution at Mount Chacaltaya (BO0001R) using smps, EBAS [data set], available at: http://ebas-data.nilu.no/DataSets.aspx?nations=BO068BOL&components=particle_number_size_distribution&matrices=aerosol&fromDate=1970-01-01&toDate=2021-12-31, last access: 15 August 2021. a
Olenius, T. and Riipinen, I.: Molecular-Resolution Simulations of New Particle Formation: Evaluation of Common Assumptions Made in Describing Nucleation in Aerosol Dynamics Models, Aerosol Sci. Tech., 51, 397–408, https://doi.org/10.1080/02786826.2016.1262530, 2017. a, b, c
Paasonen, P., Nieminen, T., Asmi, E., Manninen, H. E., Petäjä, T., Plass-Dülmer, C., Flentje, H., Birmili, W., Wiedensohler, A., Hõrrak, U., Metzger, A., Hamed, A., Laaksonen, A., Facchini, M. C., Kerminen, V.-M., and Kulmala, M.: On the roles of sulphuric acid and low-volatility organic vapours in the initial steps of atmospheric new particle formation, Atmos. Chem. Phys., 10, 11223–11242, https://doi.org/10.5194/acp-10-11223-2010, 2010. a, b, c
Riccobono, F., Schobesberger, S., Scott, C. E., Dommen, J., Ortega, I. K., Rondo, L., Almeida, J., Amorim, A., Bianchi, F., Breitenlechner, M., David, A., Downard, A., Dunne, E. M., Duplissy, J., Ehrhart, S., Flagan, R. C., Franchin, A., Hansel, A., Junninen, H., Kajos, M., Keskinen, H., Kupc, A., Kürten, A., Kvashin, A. N., Laaksonen, A., Lehtipalo, K., Makhmutov, V., Mathot, S., Nieminen, T., Onnela, A., Petäjä, T., Praplan, A. P., Santos, F. D., Schallhart, S., Seinfeld, J. H., Sipilä, M., Spracklen, D. V., Stozhkov, Y., Stratmann, F., Tomé, A., Tsagkogeorgas, G., Vaattovaara, P., Viisanen, Y., Vrtala, A., Wagner, P. E., Weingartner, E., Wex, H., Wimmer, D., Carslaw, K. S., Curtius, J., Donahue, N. M., Kirkby, J., Kulmala, M., Worsnop, D. R., and Baltensperger, U.: Oxidation Products of Biogenic Emissions Contribute to Nucleation of Atmospheric Particles, Science, 344, 717–721, https://doi.org/10.1126/science.1243527, 2014. a, b
Seland, Ø., Bentsen, M., Olivié, D., Toniazzo, T., Gjermundsen, A., Graff, L. S., Debernard, J. B., Gupta, A. K., He, Y.-C., Kirkevåg, A., Schwinger, J., Tjiputra, J., Aas, K. S., Bethke, I., Fan, Y., Griesfeller, J., Grini, A., Guo, C., Ilicak, M., Karset, I. H. H., Landgren, O., Liakka, J., Moseid, K. O., Nummelin, A., Spensberger, C., Tang, H., Zhang, Z., Heinze, C., Iversen, T., and Schulz, M.: Overview of the Norwegian Earth System Model (NorESM2) and key climate response of CMIP6 DECK, historical, and scenario simulations, Geosci. Model Dev., 13, 6165–6200, https://doi.org/10.5194/gmd-13-6165-2020, 2020a. a, b, c, d, e, f, g
Seland, Ø., Bentsen, M., Olivié, D., Toniazzo, T., Gjermundsen, A., Graff, L. S., Debernard, J. B., Gupta, A. K., He, Y., Kirkevåg, A., Schwinger, J., Tjiputra, J., Aas, K. S., Bethke, I., Fan, Y., Gao, S., Griesfeller, J., Grini, A., Guo, C., Ilicak, M., Karset, I. H. H., Landgren, O., Liakka, J., Moree, A., Moseid, K. O., Nummelin, A., Spensberger, C., Tang, H., Zhang, Z., Heinze, C., Iversen, T., and Schulz, M.: NorESM2 source code as used for CMIP6 simulations (2.0.1), Zenodo [code], https://doi.org/10.5281/zenodo.3760870, 2020b. a
Semeniuk, K. and Dastoor, A.: Current State of Aerosol Nucleation Parameterizations for Air-Quality and Climate Modeling, Atmos. Environ., 179, 77–106, https://doi.org/10.1016/j.atmosenv.2018.01.039, 2018. a, b
Shrivastava, M., Cappa, C. D., Fan, J., Goldstein, A. H., Guenther, A. B., Jimenez, J. L., Kuang, C., Laskin, A., Martin, S. T., Ng, N. L., Petaja, T., Pierce, J. R., Rasch, P. J., Roldin, P., Seinfeld, J. H., Shilling, J., Smith, J. N., Thornton, J. A., Volkamer, R., Wang, J., Worsnop, D. R., Zaveri, R. A., Zelenyuk, A., and Zhang, Q.: Recent Advances in Understanding Secondary Organic Aerosol: Implications for Global Climate Forcing, Rev. Geophys., 55, 2016RG000540, https://doi.org/10.1002/2016RG000540, 2017. a
Smith, C. J., Kramer, R. J., Myhre, G., Alterskjær, K., Collins, W., Sima, A., Boucher, O., Dufresne, J.-L., Nabat, P., Michou, M., Yukimoto, S., Cole, J., Paynter, D., Shiogama, H., O'Connor, F. M., Robertson, E., Wiltshire, A., Andrews, T., Hannay, C., Miller, R., Nazarenko, L., Kirkevåg, A., Olivié, D., Fiedler, S., Lewinschal, A., Mackallah, C., Dix, M., Pincus, R., and Forster, P. M.: Effective radiative forcing and adjustments in CMIP6 models, Atmos. Chem. Phys., 20, 9591–9618, https://doi.org/10.5194/acp-20-9591-2020, 2020. a
Sporre, M. K., Blichner, S. M., Schrödner, R., Karset, I. H. H., Berntsen, T. K., van Noije, T., Bergman, T., O'Donnell, D., and Makkonen, R.: Large difference in aerosol radiative effects from BVOC-SOA treatment in three Earth system models, Atmos. Chem. Phys., 20, 8953–8973, https://doi.org/10.5194/acp-20-8953-2020, 2020. a, b
Sullivan, R. C., Crippa, P., Matsui, H., Leung, L. R., Zhao, C., Thota, A., and Pryor, S. C.: New Particle Formation Leads to Cloud Dimming, npj Climate and Atmospheric Science, 1, 1–9, https://doi.org/10.1038/s41612-018-0019-7, 2018. a
Tsigaridis, K., Daskalakis, N., Kanakidou, M., Adams, P. J., Artaxo, P., Bahadur, R., Balkanski, Y., Bauer, S. E., Bellouin, N., Benedetti, A., Bergman, T., Berntsen, T. K., Beukes, J. P., Bian, H., Carslaw, K. S., Chin, M., Curci, G., Diehl, T., Easter, R. C., Ghan, S. J., Gong, S. L., Hodzic, A., Hoyle, C. R., Iversen, T., Jathar, S., Jimenez, J. L., Kaiser, J. W., Kirkevåg, A., Koch, D., Kokkola, H., Lee, Y. H., Lin, G., Liu, X., Luo, G., Ma, X., Mann, G. W., Mihalopoulos, N., Morcrette, J.-J., Müller, J.-F., Myhre, G., Myriokefalitakis, S., Ng, N. L., O'Donnell, D., Penner, J. E., Pozzoli, L., Pringle, K. J., Russell, L. M., Schulz, M., Sciare, J., Seland, Ø., Shindell, D. T., Sillman, S., Skeie, R. B., Spracklen, D., Stavrakou, T., Steenrod, S. D., Takemura, T., Tiitta, P., Tilmes, S., Tost, H., van Noije, T., van Zyl, P. G., von Salzen, K., Yu, F., Wang, Z., Wang, Z., Zaveri, R. A., Zhang, H., Zhang, K., Zhang, Q., and Zhang, X.: The AeroCom evaluation and intercomparison of organic aerosol in global models, Atmos. Chem. Phys., 14, 10845–10895, https://doi.org/10.5194/acp-14-10845-2014, 2014. a
Twomey, S.: The Nuclei of Natural Cloud Formation Part II: The Supersaturation in Natural Clouds and the Variation of Cloud Droplet Concentration, Geofisica pura e applicata, 43, 243–249, https://doi.org/10.1007/BF01993560, 1959. a
Twomey, S.: Aerosols, Clouds and Radiation, Atmos. Environ. A-Gen., 25, 2435–2442, https://doi.org/10.1016/0960-1686(91)90159-5, 1991. a, b
van Marle, M. J. E., Kloster, S., Magi, B. I., Marlon, J. R., Daniau, A.-L., Field, R. D., Arneth, A., Forrest, M., Hantson, S., Kehrwald, N. M., Knorr, W., Lasslop, G., Li, F., Mangeon, S., Yue, C., Kaiser, J. W., and van der Werf, G. R.: Historic global biomass burning emissions for CMIP6 (BB4CMIP) based on merging satellite observations with proxies and fire models (1750–2015), Geosci. Model Dev., 10, 3329–3357, https://doi.org/10.5194/gmd-10-3329-2017, 2017. a
Vehkamäki, H., Kulmala, M., Napari, I., Lehtinen, K. E. J., Timmreck, C., Noppel, M., and Laaksonen, A.: An Improved Parameterization for Sulfuric Acid–Water Nucleation Rates for Tropospheric and Stratospheric Conditions, J. Geophys. Res.-Atmos., 107, 4622, https://doi.org/10.1029/2002JD002184, 2002. a
Wofsy, S. C. and ATom Science Team: ATom: Aircraft Flight Track and Navigational Data, ORNL DAAC [data set], Oak Ridge, Tennessee, USA, https://doi.org/10.3334/ORNLDAAC/1613, 2018. a
Wofsy, S., Afshar, S., Allen, H., Apel, E., Asher, E., Barletta, B., Bent, J., Bian, H., Biggs, B., Blake, D., Blake, N., Bourgeois, I., Brock, C., Brune, W., Budney, J., Bui, T., Butler, A., Campuzano-Jost, P., Chang, C., Chin, M., Commane, R., Correa, G., Crounse, J., Cullis, P. D., Daube, B., Day, D., Dean-Day, J. M., Dibb, J., DiGangi, J., Diskin, G., Dollner, M., Elkins, J., Erdesz, F., Fiore, A., Flynn, C., Froyd, K., Gesler, D., Hall, S., Hanisco, T., Hannun, R., Hills, A., Hintsa, E., Hoffman, A., Hornbrook, R., Huey, L., Hughes, S., Jimenez, J., Johnson, B., Katich, J., Keeling, R., Kim, M., Kupc, A., Lait, L., Lamarque, J.-F., Liu, J., McKain, K., Mclaughlin, R., Meinardi, S., Miller, D., Montzka, S., Moore, F., Morgan, E., Murphy, D., Murray, L., Nault, B., Neuman, J., Newman, P., Nicely, J., Pan, X., Paplawsky, W., Peischl, J., Prather, M., Price, D., Ray, E., Reeves, J., Richardson, M., Rollins, A., Rosenlof, K., Ryerson, T., Scheuer, E., Schill, G., Schroder, J., Schwarz, J., St.Clair, J., Steenrod, S., Stephens, B., Strode, S., Sweeney, C., Tanner, D., Teng, A., Thames, A., Thompson, C., Ullmann, K., Veres, P., Vieznor, N., Wagner, N., Watt, A., Weber, R., Weinzierl, B., Wennberg, P., Williamson, C., Wilson, J., Wolfe, G., Woods, C., and Zeng, L.: Atmospheric Tomography Mission (ATom)ATom: Merged Atmospheric Chemistry, Trace Gases, and Aerosols, p. 0 MB, https://doi.org/10.3334/ORNLDAAC/1581, 2018. a, b
Zhang, G. J. and McFarlane, N. A.: Sensitivity of Climate Simulations to the Parameterization of Cumulus Convection in the Canadian Climate Centre General Circulation Model, Atmos. Ocean, 33, 407–446, https://doi.org/10.1080/07055900.1995.9649539, 1995. a
Zhang, K., Wan, H., Liu, X., Ghan, S. J., Kooperman, G. J., Ma, P.-L., Rasch, P. J., Neubauer, D., and Lohmann, U.: Technical Note: On the use of nudging for aerosol–climate model intercomparison studies, Atmos. Chem. Phys., 14, 8631–8645, https://doi.org/10.5194/acp-14-8631-2014, 2014. a