
Abstract
Extracellular vesicles (EVs) are very promising biomarkers for the diagnosis of various diseases, including cardiovascular, infectious and neurodegenerative disorders. Of particular relevance is their importance in cancer liquid biopsy, where they play a key role in the early detection and monitoring of the tumour. A number of technologies have recently been developed to improve the performance of current EV detection methods, but a technique that can provide high resolution, high accuracy and a multiplexing capability for the detection of several biomarkers in parallel remains a challenge in this field. Here, we demonstrate the detection of large unilamellar vesicles, which are excellent models of EVs, down to a concentration <103 EV ml−1 (<10 pM) using a dielectric resonant metasurface. This result represents an improvement in performance and functionality compared to competing plasmonic and electrochemical modalities and is due to the strong resonance amplitude and high Q-factor of our metasurface. We also verify the selectivity of the approach by detecting vesicles that have been surface-functionalised with a CD9 protein. The ease of integration of our method into a point-of-care instrument offers a path towards personalised cancer medicine.
Export citation and abstract BibTeX RIS

Original content from this work may be used under the terms of the Creative Commons Attribution 4.0 license. Any further distribution of this work must maintain attribution to the author(s) and the title of the work, journal citation and DOI.
1. Introduction
The use of liquid biopsy techniques that do not rely on tissue samples has seen a significant rise in interest because of a number of advantages offered for cancer detection and screening. Liquid biopsy relies on the analysis of cancer biomarkers from bodily fluids (e.g. blood, urine, saliva), which affords minimal invasiveness and avoids pain and possible infections for patients, thereby overcoming the main disadvantages of tissue biopsy [1, 2]. This ease of accessibility of cancer biomarkers represents a significant improvement for cancer monitoring and prognosis, because it allows for continuous screening and prompt detection of the possible recurrence of tumours and metastasis [3, 4]. Furthermore, many biomarkers are expressed in bodily fluids even at an early stage of cancer, enabling early diagnosis and treatment. Despite these evident advantages, the technique has not yet been adapted as a standard tool in clinical oncology, because of the limited sensitivity and specificity of currently used modalities [5].
A number of cancer biomarkers have already been identified as possible targets, including circulating tumour cells (CTCs), nucleic acids (circulating tumour DNA (Deoxyribonucleic acid) and micro-ribonucleic acid (RNA)) and, more recently, extracellular vesicles (EVs) [6, 7]. The main challenge with CTCs is their heterogeneity and sparse concentration, which makes them very difficult to isolate and characterise. The issue with nucleic acids is their short-term stability in the bloodstream [8]. In contrast, EVs, and in particular exosomes, carry the molecular content of their parent cells in lipid vesicles of about 50–150 nm size, which leads to a much higher stability [9]. They are abundantly secreted into bodily fluids and their expression is already observed at an early stage of cancer. Furthermore, the correlation of EVs with many other human diseases, including neurodegenerative, infectious and cardiovascular ones, has recently also been verified [10–12]. Standard analytical methods, such as enzyme-linked immunosorbent assay (ELISA) and Western blot, reach a sensitivity of order 106 and 108 EV ml−1, respectively, which is sufficient for detecting EVs in established and metastatic tumours, but not at the lower concentrations associated, for example, with early phases of tumour growth and relapse [13], also requiring a large amount of biological sample.
Other sensing modalities have been recently been introduced to improve the sensitivity. In particular, electrochemical and optical sensors stand out because they can be integrated with microfluidic systems that allow EV enrichment and only require a minimal sample volume [14]. In terms of sensitivity, electrochemical sensors have reached an impressive performance down to 103 EV ml−1; their main challenge is the multiplexing capability, which limits integration to a few sensors on a single chip [15]. Although electrochemical sensors have demonstrated high diagnostic accuracy for a specific tumour, it is challenging to realise a diagnostic tool to predict different types of cancer with a single sensing platform due to the requirement of detecting a large number of biomarkers in parallel.
Optical biosensors have been proposed for vesicles detection [16–18] and have demonstrated to reach similar performance also offering multiplexing capability. In particular, plasmonic nanostructures have achieved a resolution of about 3 × 10³ EV ml−1 with the possibility of integrating tens or more sensors on the same chip [19]. However, the main issue of plasmonic configurations arises from the intrinsic losses of metals, which limit both the Q-factor and the signal-to-noise ratio of the collected signal, thereby affecting the accuracy of detecting small changes as already verified for protein detection [20]. A sensing platform that allows high sensitivity, high accuracy and a multiplexing capability in a label-free fashion is therefore still an open challenge.
In order to address these requirements, we have developed a dielectric metasurface based on a nanohole array geometry, which optimises the Q-factor, the resonance amplitude and the surface sensitivity. We have previously verified the surface sensitivity of this structure, which has enabled us to detect protein biomarkers down to 1 pg ml−1 (<10 fM) [21, 22]. We now exploit this capability to detect EVs at low concentrations and verify an LOD < 103 EV ml−1 (<10 pM), which improves on the performance of the plasmonic and electrochemical sensors, while also offering the accurate detection of small changes in concentration. We also demonstrate the integration of the sensors into four separate microfluidic channels in order to demonstrate the multiplexing capability of the approach.
2. Design and realisation
The nanohole array (figure 1(a)) is realised in oxygen-enriched hydrogenated amorphous silicon (a-SiOx :H). The array is one of the family of structures supporting guided mode resonances. We chose the quasi-TM mode as most suitable for vesicle detection [21] because the mode is strongly confined to the silicon surface in the out-of-plane direction (figure 1(b)). The evanescent tail of the guided mode only extends approximately 100 nm into the medium, which leads to a strong interaction with the surface-bound vesicles that are of similar size. The use of a-SiOx :H with its relatively high refractive index and low absorption loss in the near-infrared range (n = 2.4 and k ∼ 5 × 10⁻⁴ at λ = 700 nm) allows us to obtain high Q-factors (Q ≈ 400) and strong resonance amplitudes (Rmax ≈ 0.6). We use a chirped configuration of the nanohole array by spatially tuning the period in order to simplify the readout system and to minimise the optical noise [21, 23, 24]. The period of the nanohole array is chirped from an initial value of Λ1 = 410 nm to Λ2 = 430 nm over a length of 500 μm. Since the Bragg condition for a guided mode resonance sensor (λres = neff × Λ) defines the resonance position and we use a single wavelength input, the resonance condition will only be satisfied in the region of the grating for which the period satisfies the Bragg condition. The resonance then appears as a bright line in reflection, whose width depends on the combination of the Q-factor, the degree of chirp we apply to the period and the bandwidth of the optical source.

Figure 1. Dielectric metasurface for vesicle detection. (a) SEM micrograph of a nanohole array in a-SiOx :H. (b) Resonant mode confinement of a transverse magnetic (TM) mode with Λ = 420 nm, t = 120 nm and R = 60 nm. (c) Schematic of the chirped nanohole array, with the yellow line representing the resonance condition (top). Camera image obtained with the array for an input beam at λ = 680 nm, corresponding to a Fano-shaped resonance (red curve) in the central area of the nanohole array (bottom). (d) Operation principle of vesicle sensing with a chirped array with a shift of the initial resonance position (top) to shorter periods (bottom), due to an increase of the effective index following the binding of vesicles for a fixed operating wavelength. The resonance positions in the camera image for both cases are shown on the right side, with Δ as the relative shift following the binding of vesicles.
Download figure:
Standard image High-resolution imageAny change of the effective index due to the binding of the vesicles corresponds to a spatial shift of the resonance in the chirped sensor because the Bragg condition will be satisfied for a different period, because the input wavelength is fixed. The spatial shift of the resonance allows us to quantify the effective index change and, therefore, the vesicle concentration. While the period changes along the length of the grating, the hole radius r and waveguide thickness t are kept constant with r = (60 ± 5) nm and t = (120 ± 5) nm. Standard fabrication involving e-beam lithography (Voyager; Raith GmbH) and reactive ion-etching are used to fabricate the structure, for details see [18].
We characterise the structure with an optical setup based on an inverted microscope and excite the resonant mode with a normally incident collimated beam from a halogen source (ScienceTech) filtered by a monochromator (ScienceTech) (figure 2(a)) [20], in order to produce a single wavelength input. In particular, the monochromator selects a wavelength with a spectral resolution of 0.7 nm to match the resonance wavelength of the nanohole array (λ ∼ 680 nm) in the central region of the chirped grating. The reflected signal is then collected by a camera (Quantalux sCMOS, THORLABS), which shows the central bright line corresponding to the resonance. The change of the resonance position is tracked with the camera and related to the concentration of the vesicles (figure 1(d)).

Figure 2. System configuration and sensitivity of the chirped nanohole array. (a) Optical setup and ((b) and (c)) photograph and schematic of the optofluidic system. (d) Resonance shift for a bulk refractive index change from n = 1.3329 (water solution) to n = 1.3441 (glucose solution). (e) Spectra with a Fano-shape fitting for both concentrations with a spatial shift of (39 ± 0.12) μm with Δn = 0.011 ± 1 × 10⁻⁴, corresponding to a spatial sensitivity of the chirped nanohole array of about 3600 μm RIU−1. The grey lines represent the measured data along different sections of the chirped grating, while the dotted and continuous lines represent the measured data obtained by the integration along the whole chirped structures and the correspondent fits, respectively. For reference, the size of the window of 104 µm corresponds to an equivalent wavelength window of Δλ = 6.7 nm.
Download figure:
Standard image High-resolution imageThe sensitivity of the chirped configuration is determined via the spatial shift of the resonance position by exposing the sensor to different glucose concentrations. The chirped configuration provides a high value of signal-to-noise ratio up to SNR = 180. The high SNR value can be reached by averaging multiple Fano-shaped spectra taken along different horizontal lines (grey lines) of the whole chirped configuration in order to achieve a single resonant response (dotted lines), as shown in figure 2(e), which serves to average any spatial variation due to fabrication tolerances. Moreover, by applying the Fano-fit on the measured data integrated in the whole sensor area (continuous lines), it is possible to further decrease the system noise with an improvement of the accuracy in the resonance tracking. We find a resonance shift of Δ = (39 ± 0.24) μm (camera pixel size is 1.4 μm) for a refractive index change of (0.011 ± 1 × 10⁻⁴) (figure 2(d)), which translates into a sensitivity for the chirped sensor of about 3600 μm RIU−1. Due to the large amplitude of the resonance, the error in determining the resonance position is very low (σ = 0.24 µm), which leads to a limit of detection of 7 × 10⁻⁵ RIU (figure 2(e)).
3. Sensing of vesicles with dielectric metasurface
3.1. Detection of biotinylated vesicles
In order to evaluate the performance of our structure for the detection of vesicles, we use synthetic biotinylated vesicles as a model system; the creation of the vesicles is described below. We then functionalise the sensor surface with avidin immobilised on biotinylated bovine serum albumin (BSA). In this way, we can exploit the strong binding affinity of the biotin-avidin pair in order to calibrate the sensor and to determine the limit of detection for the concentration of vesicles.
The sensors are integrated in a microfluidic system made in polydimethylsiloxane elastomer (Dow Corning) (figures 2(b) and (c)). The system consists of four microchannels connected to a multi-syringe pump (World Precision Instrument) aligned to the chirped sensors. The mould for the channels is made in SU-8 (Microchem) and defined by direct ultraviolet (UV) laser writing (Kloé Dilase 650). Each channel has the same width (350 ± 15) μm and thickness (80 ± 5) μm, and the gap between successive channels is (150 ± 30) μm. The first step of the surface functionalisation protocol involves flowing a solution of 0.1 mg ml−1 of biotinylated BSA mixed with 1 mg ml−1 BSA in each channel. The unbound molecules are then removed by rinsing the channels with 50 mM Tris buffer (pH 8.0). The functionalisation process then follows, by flowing 0.1 mg ml−1 avidin solution in 50 mM Tris buffer (pH 8.0) for 20 min, and finally rinsing in Tris buffer for 15 min [25]. The surface functionalisation protocol is described in figure 3(a). Large unilamellar vesicles are prepared in buffer solution (50 mM Tris, pH 8) via extrusion. Briefly, resuspended lipids are passed through a polycarbonate membrane filter to force the formation of ∼100 nm sized vesicles with low polydispersity. Their composition is 99 molar% 1,2-dimyristoyl-sn-glycero-3-phosphocholine phospholipid (12.5 mg ml−1) (Avanti) and 1 molar% 1-oleoyl-2-(12-biotinyl(aminododecanoyl))-sn-glycero-3-phosphoethanolamine (biotin-PE) (Avanti Polar Lipids) (0.06 mg ml−1).
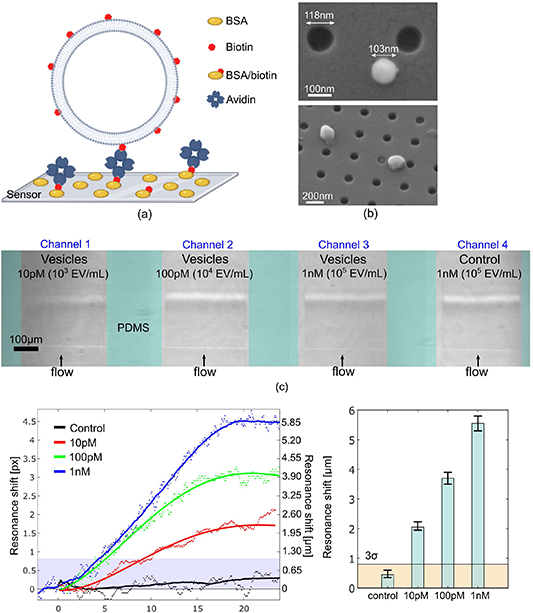
Figure 3. Real-time sensing of vesicle immobilisation via biotin-avidin interactions. (a) Schematic of the immobilisation scheme for biotinylated vesicles on the surface of the optical sensor using biotin-avidin interaction. The dimensions are not to scale. Created with BioRender.com (b) SEM micrographs of biotinylated vesicles on the nanohole array. (c) Configuration of chirped nanohole arrays with multiple parallel channels. (d) Binding assay for different concentrations of biotinylated vesicles with avidin-coated surface, 10 pM (red curve), 100 pM (green curve) and 1 nM (blue curve) including a control measurement with lipid vesicles without surface functionalisation (black curve). The measured data (dots) are fitted with the modified Gompertz model (continuous lines) [26]. (e) Histograms of the resonance shift for different concentrations of functionalised vesicles. The error bars represent the maximum deviation from the average value for each concentration, with three measurements taken for each concentration. The 3σ value is indicated by the light orange area.
Download figure:
Standard image High-resolution imageThe size distribution of the prepared vesicles in buffer solution is evaluated by dynamic light scattering using a Zetasizer μV molecular size detector (Malvern Instruments Ltd, UK), whereby a mean polydispersity index <0.3 is observed [25, 27]. When the vesicles are doped with 0.1 molar% of the fluorescent membrane stain 1,1'-dioctadecyl-3,3,3',3'-tetramethylindocarbocyanine perchlorate, wide-field total internal reflection fluorescence microscopy (λex = 532 nm, λem = 570 nm) is used to quantify the number and concentration of surface-immobilised vesicles per 25 × 50 μm field of view [27]. Scanning electron microscope (SEM) micrographs confirm the vesicles have an expected size of about 100 ± 20 nm, presenting a spherical and intact shape without fusing on the surface (figure 2(b)), confirming the possibility to use them as excellent model for exosomes.
Three different concentrations of vesicles, i.e. 103, 104 and 105 EV ml−1 are prepared in 50 mM TRIS buffer (PH 8.0), corresponding to 10 pM, 100 pM and 1 nM concentrations, respectively, and introduced into the microfluidic channels at 20 μl min−1 (figure 3(a)). The binding assay for biotinylated vesicles in figure 3(d) shows the possibility of detecting vesicle concentrations even lower than 103 EV ml−1, given that the saturation value for 103 EV ml−1 is more than twice above the 3σ noise level; by extrapolating the concentration vs resonance shift curve of figure 3(c), we can estimate an LOD of 400 CFU ml−1, which presents a clear improvement over other approaches such as plasmonic structures and electrochemical detection, both of which have reported LODs > 103 EV ml−1. The control experiment, for which the same functionalisation procedure was used, but flowing a solution with vesicles without biotin, returns a resonance shift within the noise level, confirming the strong selectivity of our sensors. By taking multiple data points for each concentration of vesicles to verify the reliability of the measurement, we note how the strong resonance and correspondingly high SNR (=180) allows us to track even very small changes of concentrations over a wide biological range (from a few pM to nM), which is important for the screening and prognosis of disease.
3.2. Detection of CD9 functionalised vesicles
In order to validate the suitability of the sensing modality for the detection of exosomes that contain proteins for cancer liquid biopsy, we have also functionalised the surface of the vesicles with the transmembrane protein CD9, which is one of the most common biomarkers for exosomes [28]. Its strong expression on a variation of vesicles allows us to use this protein as useful and versatile marker for quantifying the presence of vesicles and correlate it to the stage of disease. CD9 is considered relevant for many types of cancer, such as pancreatic [29], prostate [30], breast [31] and ovarian cancer [32].
To improve the binding efficiency between the vesicles functionalised with CD9 protein and the specific antibody (α-CD9), the sensor surface is initially coated in sulfhydryl groups via the salinisation with (3-mercapto-propyl)trimethoxysilane (MPTS) for 6 h. The thiolated sensor surface can bind to the maleimide terminated SM(PEG)6, which presents an N-hydrox-ysuccinimide (NHS) ester group on the other termini. We use the monolayer of NHS esters in order to form a covalent bond with free amines on the antibody surface. The SM(PEG)6 monolayer is formed during an overnight process with a 1 mM PEG in Dimethyl Sulfoxide (DMSO) solution. A rinse in DMSO allows to remove the excess SM(PEG)6 not bound to MPTS. The functionalisation protocol is described in detail in [33]. The sensor surface is then covered with the α-CD9 (Fisher Scientific) antibody introduced into the sensor channels for 30 min at 20 μl min−1, followed by casein at the same flow for 30 min and a rinse in phosphate-buffered-saline (PBS) for another 15 min to remove the excess casein.
The vesicles are immersed in PBS solution with a mixture of 100 nm phosphatidylcholine (POPC, 8.75 mg ml−1) and 200.8 μM CD9 (EnQuireBio) to functionalise the membrane surface with CD9 proteins. The vesicles are then purified by size exclusion chromatography in order to remove any free CD9 protein in solution not bound on their surface. A schematic of the immobilisation scheme is shown in figure 4(a). The binding of the CD9-functionalised vesicles is then analysed similarly for four channels as described for biotinylated vesicles (figure 3(a)).
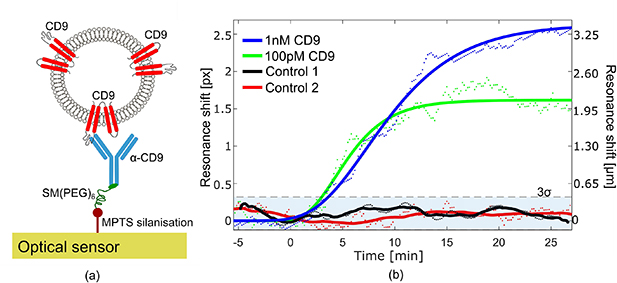
Figure 4. Sensing of vesicles functionalised with CD9. (a) Schematic of the immobilisation scheme for CD9-functionalised vesicles on the surface of the optical sensor using the α-CD9 antibody. The dimensions are not to scale. (b) Binding assay of CD9-functionalised vesicles with a concentration of 1 nM (blue curve) and 100 pM (green curve). The control experiments conducted with vesicles functionalised with CD9 and an unspecific α-IgG antibody (black curve) as well as with vesicles without functionalisation (red curve) confirm a negligible resonance shift below the 3σ noise level (blue shaded area). The measured data (dots) are fitted with the modified Gompertz model (continuous lines) [26].
Download figure:
Standard image High-resolution image
Two different concentrations of CD9-functionalised vesicles of concentrations 100 pM (green curve, figure 4(b)) and 1 nM (blue curve, figure 4(b)) respectively, are introduced to the two sensors with a flow of 20 μl min−1. The other two sensors are used for control experiments, the first with vesicles without attached CD9 protein (control 1, black curve, figure 4(b)) and the second with CD9-functionalised vesicles with the sensor surface being covered by the unspecific α-IgG antibody (control 2, red curve, figure 4(b)). A clear shift of the resonance is observed with a concentration of 100 pM, confirming the ability to detect a vesicle concentration as low as 10 pM (∼103 EV ml−1) or even lower, as already observed with biotinylated vesicles. The negligible changes observed for both control experiments provide a clear indication of the high specificity of our sensors.
4. Discussion and conclusion
Overall, we have introduced a dielectric metasurface for the detection of EVs and have demonstrated a limit of detection of LOD < 103 EV ml−1 for such vesicles, which represents an improvement compared to other techniques, in particular with respect to the plasmonic counterpart. This advantage is evidenced by the high sensitivity together with a higher resonance amplitude and Q-factor [21], because of negligible losses in dielectric materials. Moreover, we have verified similar performance to another dielectric metasurfaces previously proposed for EV detection (<10 pM) operating in the near-infrared region [34], instead we use a complete label-free fashion and work in the visible range, where it is possible to use low cost sources and detectors.
This high sensitivity, combined with the demonstrated high rejection of non-specific binding and the ability to detect small changes in concentration are key requirements for cancer detection at an early stage [7, 35]. We have used CD9 as a surface protein that indicates a range of cancers. We note, however, that other surface proteins could be used to diagnose specific types of cancers and to differentiate between metastatic and non-metastatic tumours, e.g. lung (lipopolysaccharide‐binding proteins) [36] and ovarian (integrin α5β1/AEP complex) [28] cancer that are expressed at even lower concentrations of few ng ml−1. Such concentrations are also accessible to the detection range of our dielectric metasurface (e.g. a concentration of 10 pM corresponds to a concentration of 10 ng ml−1 assuming a molar mass of vesicles of 1000 kDa [37]). Interestingly, the ability to provide high precision exosome detection is also emerging as a powerful tool for the prediction and differentiation of a number of other diseases, including infectious [12] and neurodegenerative (Alzheimer's and Parkinson's) diseases [38, 39]. In particular, in the context of neurodegerative diseases, it has been recently suggested that exosomes are responsible for the spread of toxic β-amyloid and hyperphosphorylated tau between cells, which represents the main cause of apoptosis with a consequent neuronal loss in the early stages of Alzheimer's disease [40]. Therefore, due to the important role assumed by exosomal proteins in pathogenesis, a prompt and accurate detection of exosome biomarkers could improve the current limitations in diagnostics of neurodegenerative diseases even before clinical signs appear, which may offer opportunities for early therapeutic intervention.
Although the CD9 protein is the only biomarker considered in this study, we have already demonstrated the capability to detect at least four different biomarkers [33], which would allow an even more accurate diagnosis of the type and stage of cancer observed.
We have also previously verified the ability of our technology to achieve a very high sensitivity for protein detection both in urine and in buffer solutions [33] as well as the possibility to integrate this modality into a low-cost portable instrument [41]. These advantages could enable performing patient-centric clinical diagnosis and facilitate the widespread use of point-of-care devices for cancer screening thereby improving disease prognosis and patient survival.
Acknowledgments
D C and T F K acknowledge financial support by the EPSRC of the UK (EP/P030017/1). S D Q thanks Alzheimer's Research UK (ARUK-RF2019A-001) for support.
Data availability statement
The data that support the findings of this study are available upon reasonable request from the authors.