the Creative Commons Attribution 4.0 License.
the Creative Commons Attribution 4.0 License.
 | 13 Oct 2021
Nitrogen deposition in the UK at 1 km resolution from 1990 to 2017
Edward J. Carnell
Anthony J. Dore
Ulrike Dragosits
An atmospheric chemistry transport model (FRAME) is used here to calculate annual UK N deposition for the years 1990–2017, at a 1 km × 1 km resolution. Reactive nitrogen (N) deposition is a threat that can lead to adverse effects on the environment and human health. In Europe, substantial reductions in N deposition from nitrogen oxide emissions have been achieved in recent decades. This paper quantifies reductions in UK N deposition following the N emissions peak in 1990. In the UK, estimates of N deposition are typically available at a coarse spatial resolution (typically 5 km × 5 km grid resolution), and it is often difficult to compare estimates between years due to methodological changes in emission estimates. Through efforts to reduce emissions of N from industry, traffic, and agriculture, this study predicts that UK N deposition has reduced from 465 kt N in 1990 to 278 kt N in 2017. However, as part of this overall reduction, there are non-uniform changes for wet and dry deposition of reduced N (NHx) and oxidised N (NOy). In 2017, it is estimated 59 % of all N deposition is in the form of reduced N, a change from 35 % in 1990. This dataset uses 28 years of emissions data from 1990 to 2017 to produce the first long-term dataset of 28 years of N deposition at 1 km × 1 km resolution in the UK. Full data are available at https://doi.org/10.5285/9b203324-6b37-4e91-b028-e073b197fb9f (Tomlinson et al., 2020).
- Article
(3519 KB) - Full-text XML
- BibTeX
- EndNote


The emissions and subsequent atmospheric deposition of nitrogen (N) have a well-documented list of effects on the global and local environment (e.g. Stevens et al., 2018). N deposition is associated with impacts on ecosystem biodiversity (Nowak et al., 2015; Payne et al., 2017), eutrophication (Greenwood et al., 2019), soil acidification (Aggenbach et al., 2017), changes in carbon stocks (Britton et al., 2019) and human health (Nowak et al., 2018).
These threats are driven by anthropogenic emissions of oxides of nitrogen (NOx) from sources such as fuel combustion including from road transport, and emissions of ammonia (NH3), to which agriculture contributes around 85 % annually in the UK (NAEI, 2019). Previous studies generally show total deposition of N in the UK peaking around 1990, following the peak in emissions. Fowler et al. (2004) estimate around 430 kt N was deposited to the UK in 1990, with a 54 % proportion of reduced N (predominantly ammonia). Using newer data, the Review of Transboundary Air Pollution report (RoTAP, 2012) re-estimated the total N deposition budget for 1990 in the UK to be ca. 380 kt N, and finally Levy et al. (2020) estimated 410 kt N deposited. Since the beginning of the 1990s, deposition has reduced as mitigation policies have sought to curb emissions of nitrogenous compounds, predominantly NH3 and NOx, but has stabilised at around 300 kt N yr−1 from ca. 2010.
In order to study the many effects of N deposition and its trends over time, there must be appropriately detailed and consistent deposition estimates to use, across time and space. N deposition data in the UK are typically available at a 5 km × 5 km resolution (e.g. Levy et al., 2020). It is very likely, however, that this relatively coarse spatial resolution smooths out significant variation at higher resolutions, which could be useful for studying effects. Smart et al. (2020) highlight this point by exploring the variance of a 5 km × 5 km and 1 km × 1 km N deposition output from the same model run, within a 10 km square. They found the variance within the 1 km × 1 km product to be up to 4 times higher than that of the 5 km × 5 km product (within the same 10 km square). The main driver for this increased variance of N deposition at higher spatial resolutions, compared to lower resolutions (within the same study area), is the more granular representation of dry N deposition from agricultural sources such as livestock houses and busy roads or local combustion sources. Dry deposition of N from reduced nitrogen (“NHx”) is very local to the emissions sources, which a 1 km × 1 km resolution can more easily reflect. Furthermore, the increased definition in a 1 km × 1 km rainfall map (for wet deposition) has more variation than a smoothed 5 km × 5 km rainfall map, while land cover is more readily represented in higher resolutions (which can determine deposition velocities and therefore N deposition).
Another facet of N deposition to consider is that of cumulative loading and whether the impacts develop over time, and whether they develop linearly (Payne et al., 2019, 2020). Payne et al. (2019) showed that N deposition effects on sensitive habitats should not only take account of the most recent best estimate, but that cumulative N deposition should be considered, e.g. over a period of 30 years. To enable such an approach, it is necessary to have a suitable consistent N deposition data series available. In the past, time series were often constructed by piecing together historical products that were using the best knowledge and datasets available at the time, rather than a single time series where all model output years are produced with consistent model input data from the latest back-cast inventory dataset, and with the same version of the model and calibration methodology.
This new dataset consists of 28 years of 1 km × 1 km resolution N deposition data on the UK terrestrial surface, from 1990 to 2017, using a consistent approach to inputs and model calibration. It is the first time annual N deposition data has been released at this resolution over this number of years in the UK, using a consistent methodology throughout. The consistent methodology means that the latest knowledge for emission distributions across the whole period can be used, with the latest emission factors used to back-cast the entire time series at a high spatial resolution. In addition, model parameters and calibrations for each time step use the same most up-to-date model version. It is envisaged that studying the effects of N deposition on the environment can be aided by such an increase in detail, as suggested by Hallsworth et al. (2010). This has been made available as part of The ASSIST programme (Achieving Sustainable Agricultural Systems; see https://assist.ceh.ac.uk, last access: 1 December 2020).
2.1 Atmospheric chemistry transport modelling
The Fine Resolution Multi-pollutant Exchange (FRAME) is an atmospheric chemistry transport model (ACTM) used to calculate annual deposition of reduced and oxidised nitrogen (N) over the United Kingdom. The model is fully described elsewhere (Aleksankina et al., 2018; Dore et al., 2012, 2016; Vieno et al., 2010; Singles et al., 1998), and only the relevant information for this work is reported here. The domain of the model covers Europe at 50 km × 50 km resolution to provide the boundary conditions for the UK model domain with a grid resolution of 1 km × 1 km. The UK model domain is represented by the British National Grid (EPSG:27700) projected coordinate system. A column of air with a depth of 2500 m is used to represent the relevant atmospheric processes. The column of air is advected across the model domain from all edge grid points and all wind directions with an angular resolution of 1∘. Figure 1 shows the 1 km × 1 km UK model domain – which captures both the UK and the Republic of Ireland to allow for high-resolution modelling of the closest neighbouring territory – in the European context. Further figures in this work did not show lines of latitude or longitude.
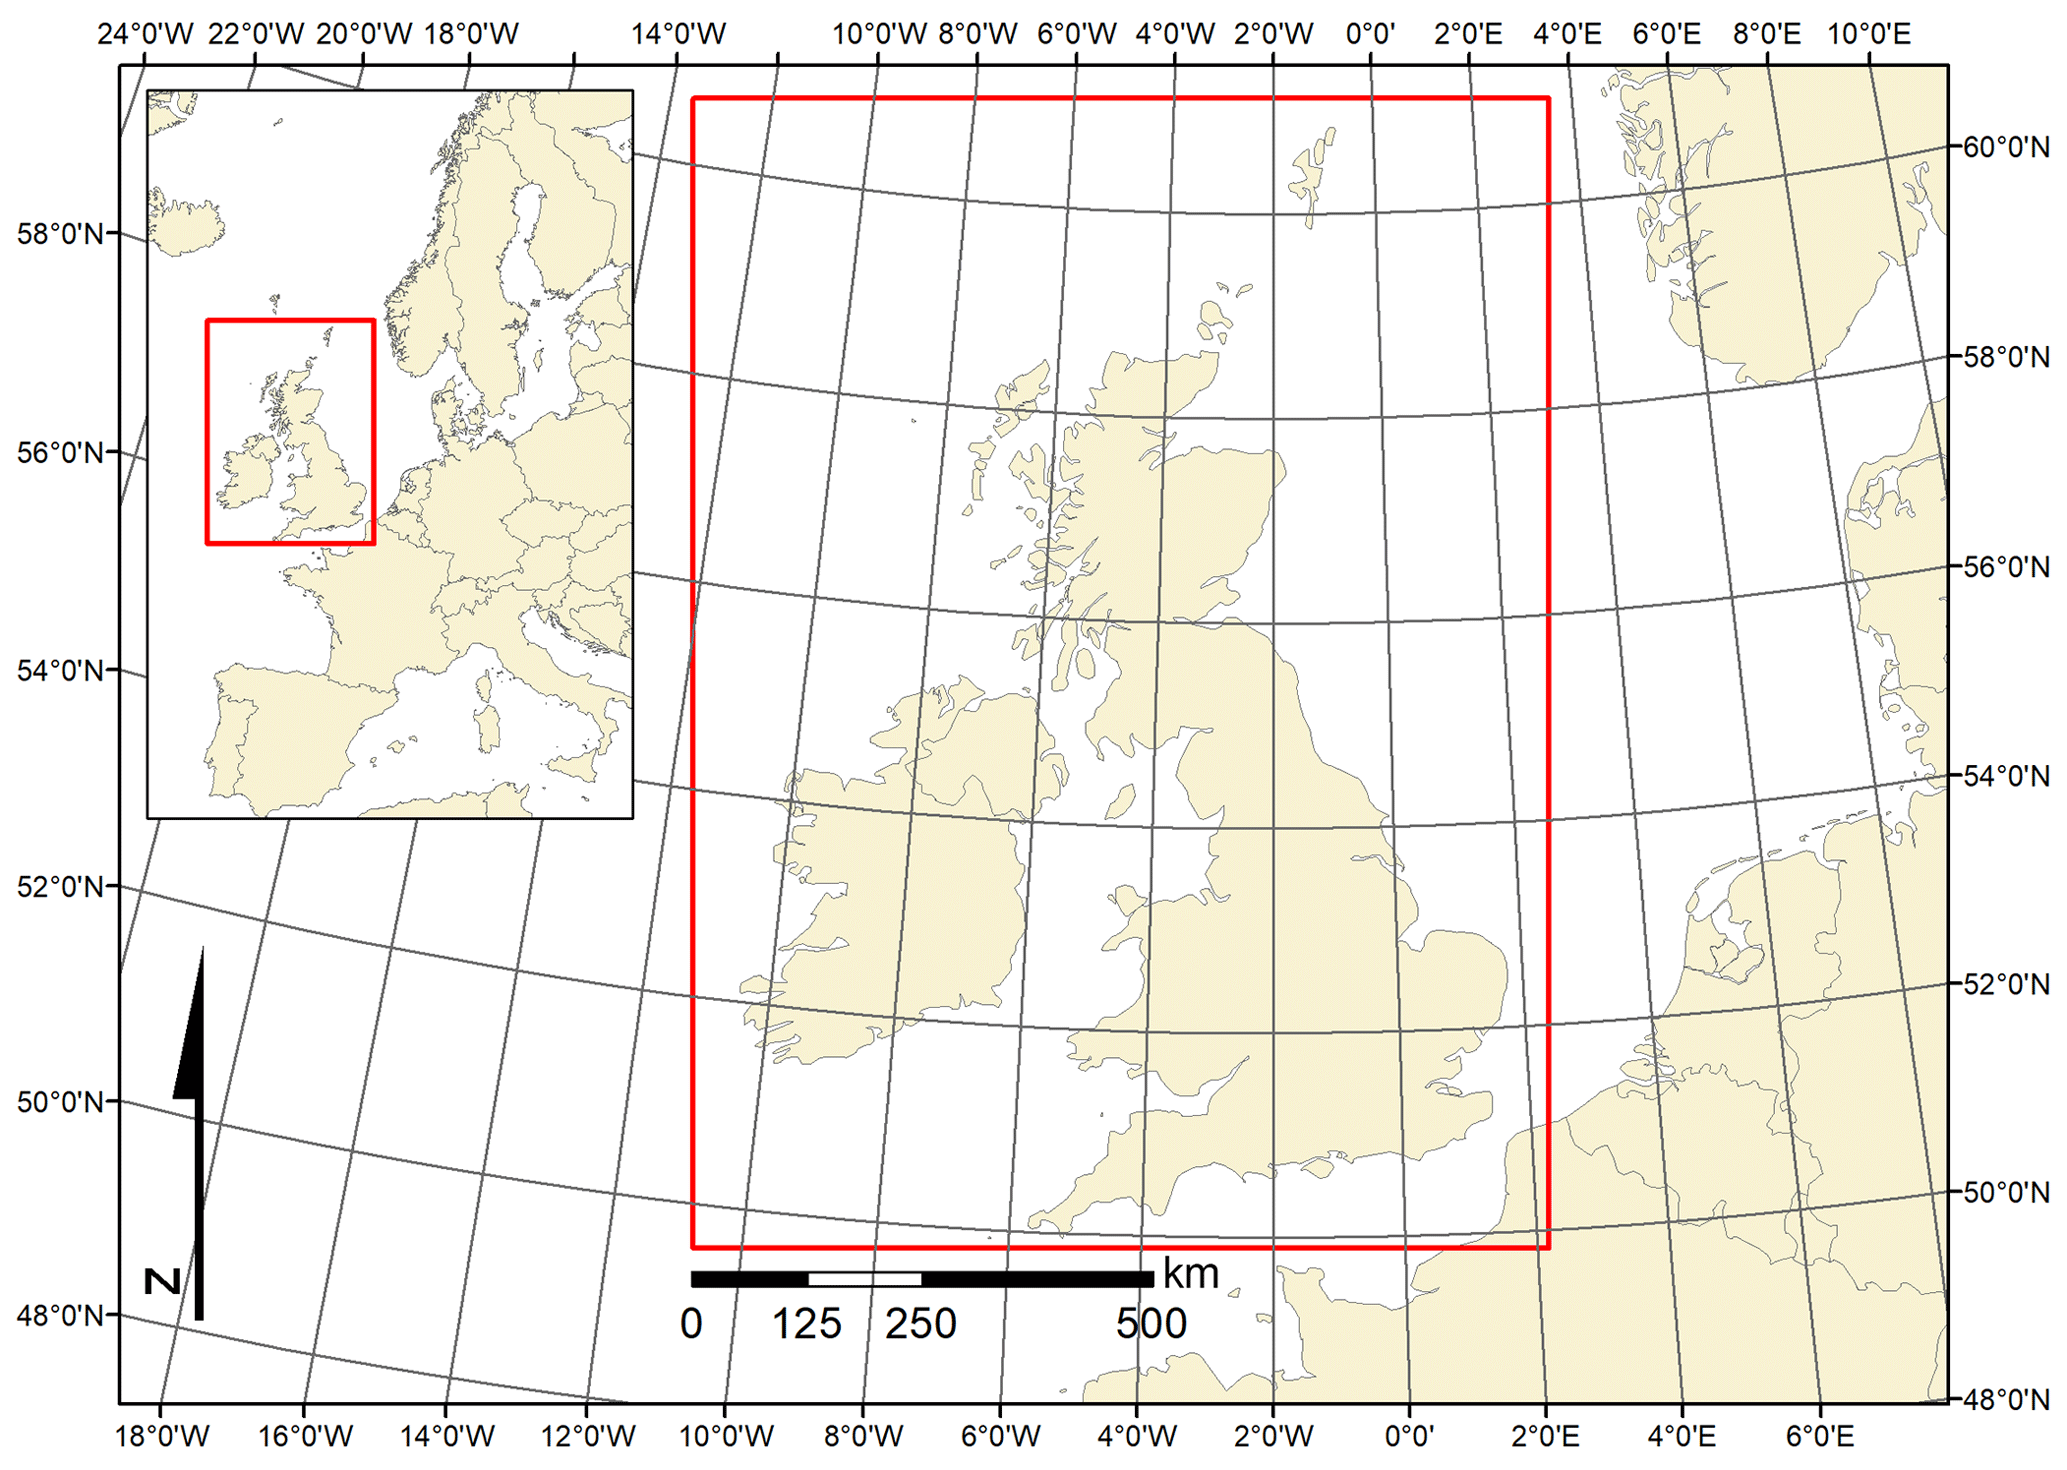
Figure 1The UK FRAME modelling domain, shown by a red rectangle, within which 1 km × 1 km estimates of N deposition are made. The inset shows the context within Europe and lines of latitude and longitude are also shown, while the inputs and outputs of the model are in the British National Grid projected coordinate system.
Emission of gaseous pollutants, vertical diffusion, chemical transformation, and wet and dry removal processes take place within the air column. The model has 33 vertical layers with thickness varying from 1 m at the surface to 100 m in the upper layers. The model requires input data of both diffuse and point source emissions of ammonia (NH3), oxides of nitrogen (NOx) and sulfur dioxide (SO2) (Vieno et al., 2010).
FRAME uses land-cover-specific deposition velocities to generate dry deposition for up to five land cover categories: woodland, low-growing semi-natural vegetation, improved grassland, arable and urban (Land Cover Map 2015; Rowland et al., 2017). The model uses different scavenging coefficients for soluble gases and particles and assumes constant drizzle for calculation of wet deposition. An annual precipitation map (Tanguy et al., 2019; Walsh, 2012) is used to drive the spatial variation in wet removal rate.
The FRAME model used for this work uses long-term radiosonde mean wind speed (Dore et al., 2006) for all the years included here (1990–2017). The wind frequency is derived from modelled data from the Weather and Research Forecast model (Skamarock et al., 2019). The wind frequency used here is kept constant to a 2001–2012 mean for the years 1990–2001, and the specific years afterwards (2001–2017).
The FRAME model, for both the European and British Isles domains, was run for each year from 1990 to 2017, using the corresponding emission and wind–rainfall data. The land cover was kept constant throughout. The FRAME model version used was 9.15.0.
2.2 Emissions data
2.2.1 Data sources
Input data were extracted and processed from the most recently available national emission inventory submissions from both the UK and the Republic of Ireland (EMEP, 2019; E-PRTR, 2019; NAEI, 2019). Emissions for the European domain were taken from Convention on Long-Range Transboundary Air Pollution (CLRTAP) submissions (EMEP, 2019). For agricultural NH3 emissions, the latest set of annual emission maps from 1990–2017 was used, as derived for the UK's national atmospheric emission inventory. This inventory work utilises annual activity data at the holding level from the devolved authorities in the UK, i.e. Defra (England), the Scottish Government (Scotland), Welsh Assembly (Wales) and Daera (Northern Ireland) (see Carnell et al., 2019a, for details).
Emissions data are routinely made available via sectors (e.g. energy production) and to create a consistent structure for all data sources. NOx and SO2 emissions were restructured into the 11 Selected Nomenclature for sources of Air Pollution (SNAP) sectors (Table 1), developed by the European Topic Centre on Air Emissions (ETC/AE). Given the dominance of agriculture in NH3 emissions, the FRAME model requires agricultural data to be split into livestock fertiliser emissions, with all non-agricultural sources as one sector (see Sect. 2.1.3).
The SNAP system is used in the UK for the annual updates to the National Atmospheric Emissions Inventory (NAEI, 2019). This corresponds to the main area of interest for the deposition outputs, and the Irish and wider European emissions were reformatted to match that reporting system. Whilst the UK, Ireland and the collated European data all use the Nomenclature for Reporting system (NFR, ca. 240 sectors – EEA, 2019), the UK collate the fine-resolution categories into SNAP sectors whereas the latter two report via the aggregated Generalised/Gridded Nomenclature for Reporting (GNFR). Table 1 also shows how these two aggregated reporting systems broadly relate to each other.
Table 1Selected Nomenclature for sources of Air Pollution (SNAP) sectors for emissions inventory reporting as outlined by CORINAIR, alongside the Generalised/Gridded Nomenclature for Reporting (GNFR) sectors (broadly matched).
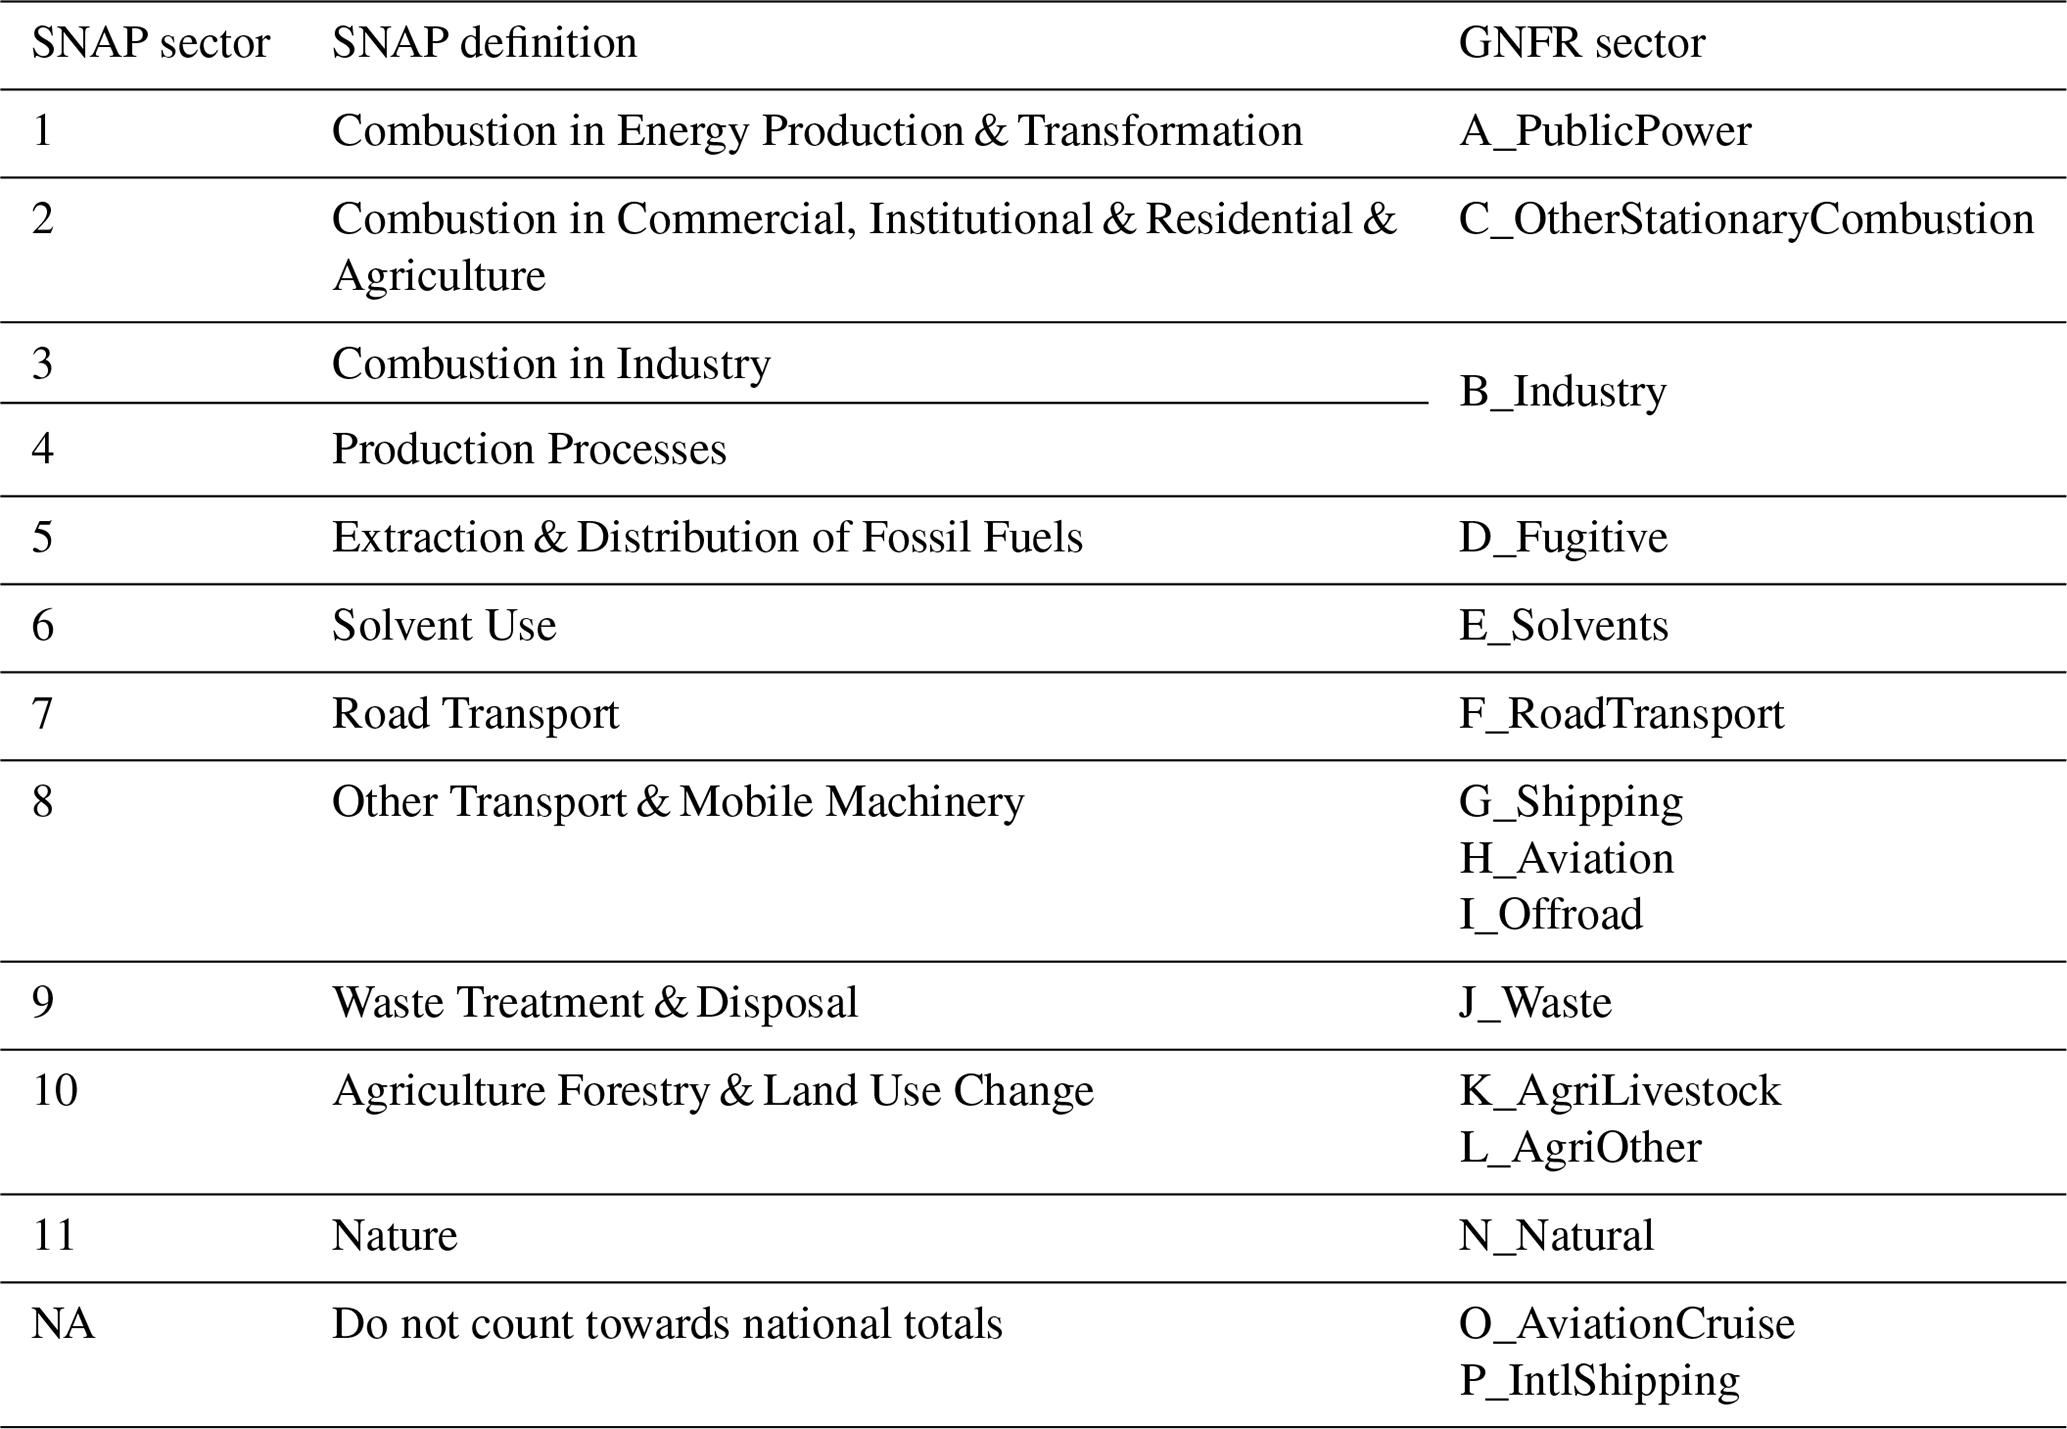
It is worth noting that emissions data for “international shipping” and “aviation cruise” do not count within a specific national inventory but are reported into a “pooled” total by all countries. Separate totals for national shipping, airports, and the take-off and landing of aircraft are reported on a country basis. Finally, emissions data should ideally be translated between the aggregated classification systems using the NFR codes upon which they are built (which still has some one-to-many relationships) but spatial data are not available at this level, and therefore the aggregated spatial data should not be broken down in an attempt to make the NFR level data.
2.2.2 Point and diffuse emissions of NOx, SO2 and NH3
NH3, NOx and SO2 emission inputs were produced for the years 1990 to 2017, for both diffuse and point source emissions. Diffuse sources are those deemed to be areal, non-exact locations such as agriculture, vehicles, population-related sources, etc. Point sources can be located by exact coordinates, for example the actual chimney/exhaust stacks of power stations and industry (Vieno et al., 2010). Point source information in the UK is nearly (but not totally) exclusive to energy generation and industry.
Figure 2 shows an overview of the processes to combine the various spatial and tabulated emissions data that are required for the 28 annual model runs. There are some important methodological details, for both diffuse and point emissions, worth noting. In the UK, diffuse data are produced and published for 11 SNAP sectors for the latest emissions inventory year, superseding any previous data. This is principally due to the fact that every year in the inventory compilation, minor to major changes are made to the way the data are compiled – this could be changes to emission factors with the latest research being incorporated or how underlying spatial methods and datasets are updated. While the non-spatial data are “back-cast” to 1990 (or earlier, depending on the pollutant), the maps are not currently updated as a time series. Consequently, it is unwise to compare previous years' gridded emissions surfaces to the latest available. For this reason, at the time of publication, only the latest 2017 emissions maps were used in the UK for the entire time series and were scaled back through the time series using the annual tabulated NFR totals, for SO2, NOx and non-agricultural NH3. For agricultural NH3, the latest mapped time series (using annual livestock and crop data) was used (Carnell et al., 2019a). For point sources – which in the more recent data number in the thousands – some earlier data were obtained back to 1990 but only for a subset of major polluters and not for all years (missing years were linearly interpolated). For the very largest emitters, information (when known) regarding the stack/chimney height, stack/chimney diameter and emission exit velocities is also used by the model to create plume characteristics. It is the non-coordinate parameters that are important in determining to what height into the atmosphere the emissions travel, and therefore what subsequent chemical interactions occur, which is important for the deposition modelling.
Table 2Deposition outputs as provided in this dataset from the Fine Resolution Multi-pollutant Exchange (FRAME) atmospheric chemistry transport model.

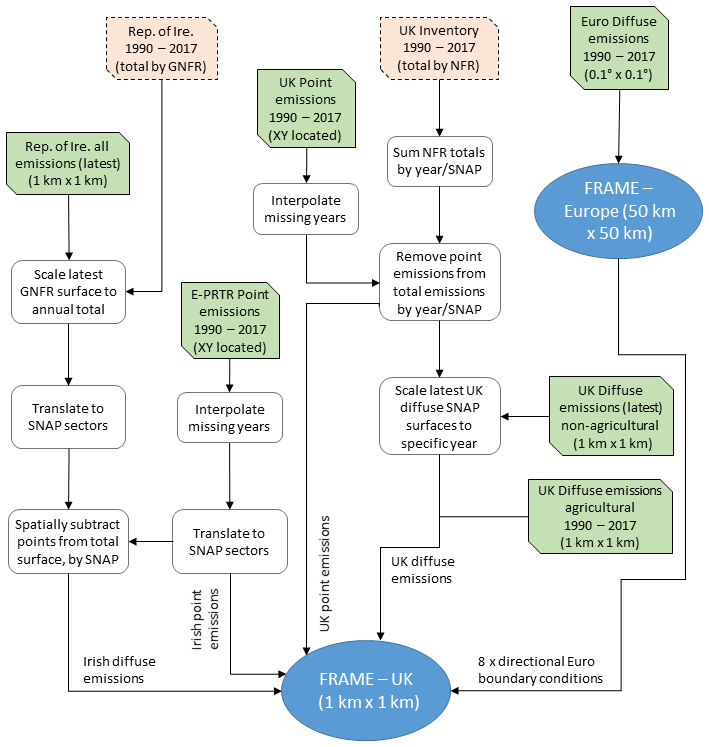
Figure 2Visualised methodology of steps to create inputs for the Fine Resolution Multi-pollutant Exchange (FRAME) atmospheric chemistry transport model: rectangle with corners missing (solid border) denotes spatial data, rectangle with corners missing (dashed border) denotes tabulated data, rectangle with rounded corners denotes process and oval denotes model.
Emissions from the Republic of Ireland influence the deposition of N species in the UK. To allow for similarly high-resolution emissions inputs, the outputs from the National Mapping of Greenhouse Gas and Non-greenhouse Gas Emissions Sources project (MapEire, 2019; Pjeldrup et al., 2018) were used in a similar manner to the latest emissions surfaces produced for the UK in the NAEI. The MapEire project produced 1 km × 1 km resolution gridded emissions for all GNFR sectors for the year 2016, which were scaled to other years by the totals reported to the CLRTAP by the Republic of Ireland. These surfaces were then transformed to SNAP sectors (see Table 2) to be joined to the UK data. One important difference to note is that the MapEire gridded data include all sources of emissions, including point sources (the UK data do not). Therefore, the major emitting point sources, as reported to the European Pollutant Release and Transfer Register (E-PRTR, 2019), were extracted for NOx and SO2 for all available years back to 1990 (gaps were linearly interpolated). To conserve totals, Irish point values were removed from the Irish total gridded surface by subtracting the point value from the grid cell in which it was located, with any surplus emissions removed from the surrounding eight cells on an equal-share basis (if required). This created a diffuse surface and a point source input, consistent with the UK data.
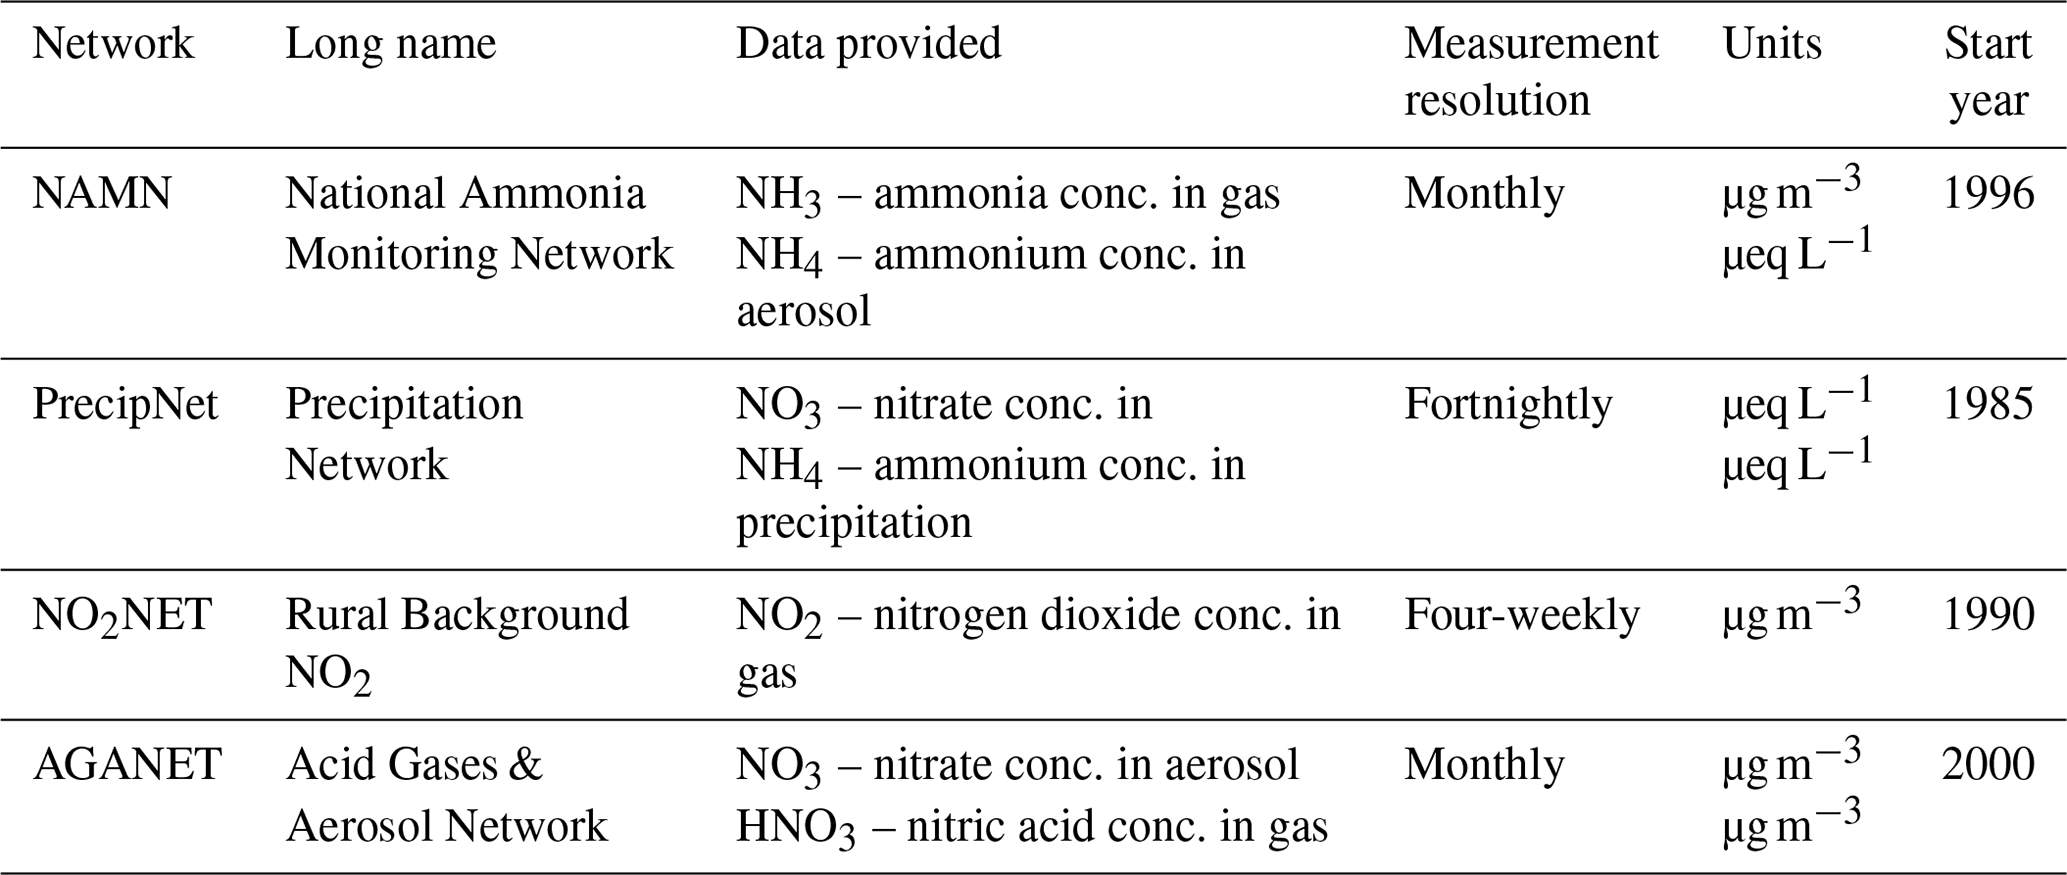
Table 3Four measurement networks used within the UK Acidifying and Eutrophying Atmospheric Pollutants (UKEAP) network, along with the 10 compounds used to evaluate the atmospheric modelling.
A consistent time series of UK agricultural NH3 emission estimates was created at a 1 km × 1 km grid resolution for the years 1990–2017. These high-resolution agricultural NH3 emission maps are produced annually for the NAEI, using an agricultural emission model jointly developed by the UK Centre for Ecology & Hydrology, Rothamsted Research, ADAS and Cranfield University. The emission model uses annual agricultural census data (e.g. livestock numbers and crop areas – see Carnell et al., 2019a) at the holding level, agricultural practice information (e.g. fertiliser application rates, stocking densities) and emission source strength data from the UK emissions inventories for agriculture (e.g. Brown et al., 2019; Richmond et al., 2019). Emission estimates are output for each individual emission source at a 10 km × 10 km grid resolution, which are spatially disaggregated to a 1 km × 1 km grid resolution using land cover data (Rowland et al., 2017) and methods outlined in Dragosits et al. (1998), Hellsten et al. (2008) and Carnell et al. (2019a). Emissions sources are numerous and include grazing, storage, spreading and housing for cattle, pigs, poultry, sheep and minor livestock (plus all sub-types) as well as differing fertiliser applications for varying crop and grass types.
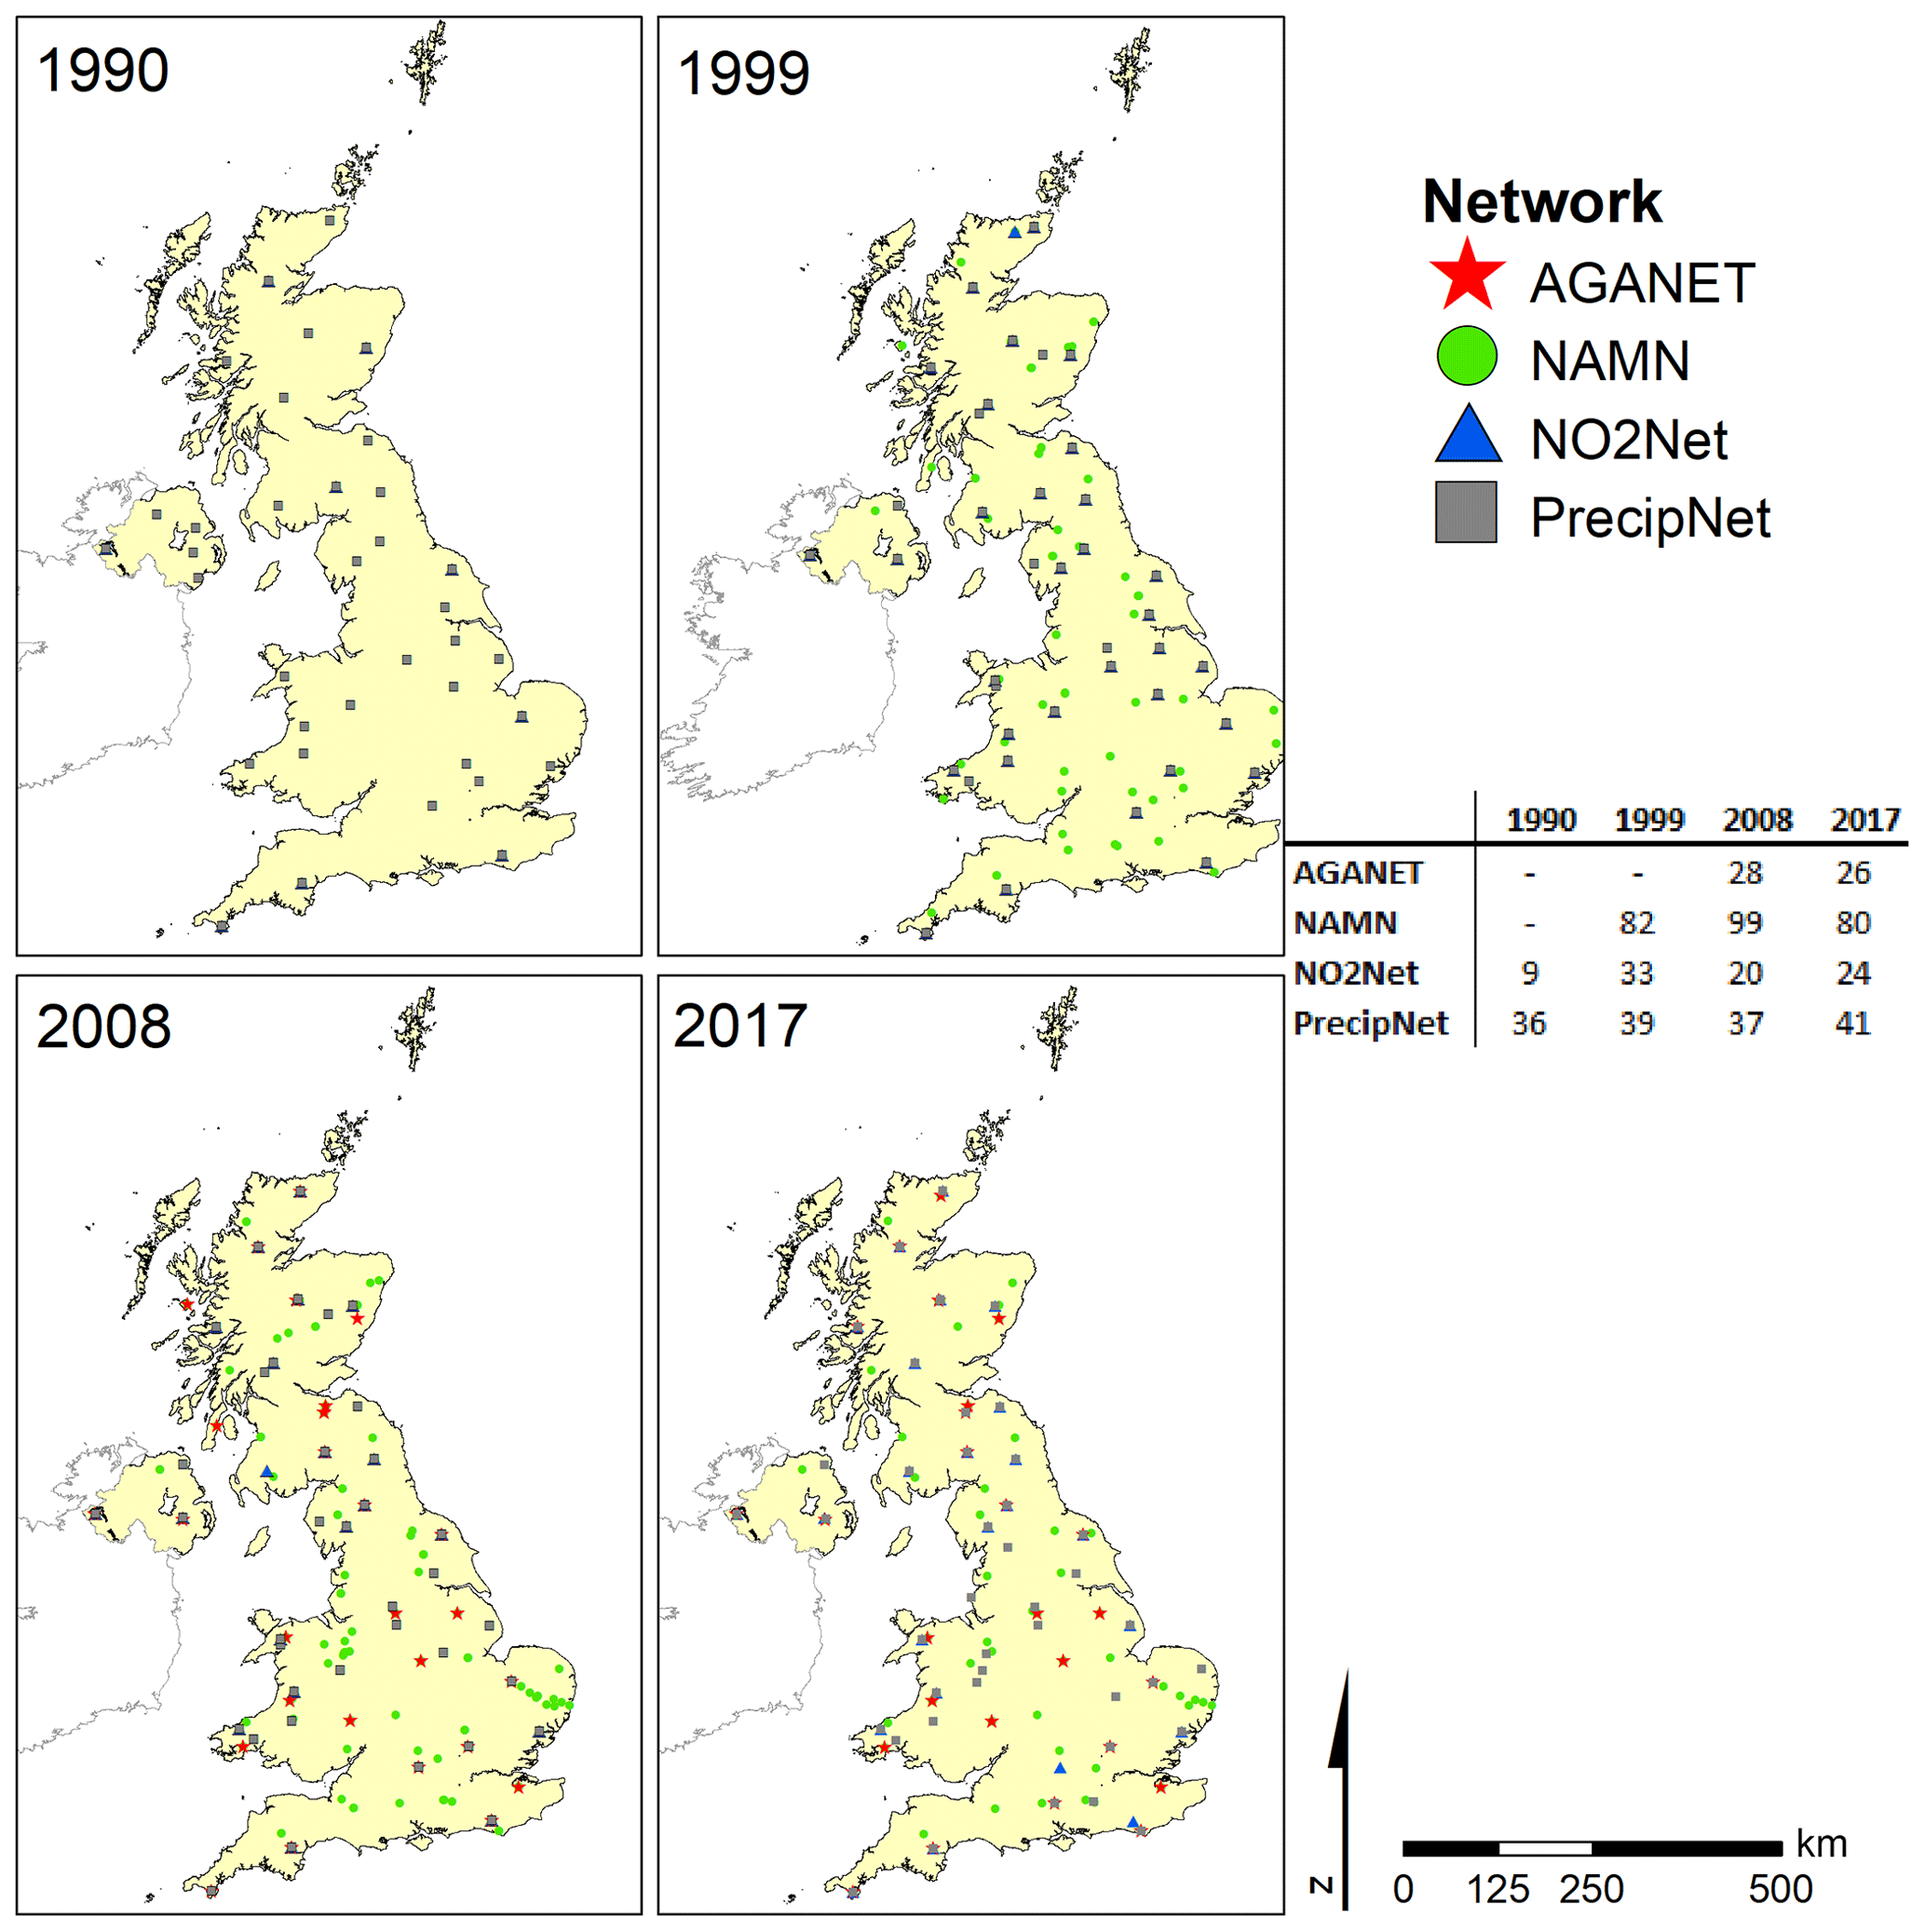
Figure 3Locations of sites in four measurement networks, across four periods of the time series in this study: Acid Gases & Aerosol Network (AGANET), National Ammonia Monitoring Network (NAMN), Rural Background NO2 (NO2NET) and Precipitation Network (PrecipNet). Some sites from different networks are co-located, and therefore not all dots represented in the table are visible in the maps.
2.3 Outputs
Outputs from the model as presented in this dataset are the annual values of wet and dry deposition of reduced nitrogen (“NHx”) and wet and dry deposition of oxidised nitrogen (“NOy”) as a weighted mean of all land cover types within a given cell, as well as vegetation-specific values for both forest and moorland – Table 2 provides more detail.
Deposition data are provided on a 1 km × 1 km resolution surface, using the British National Grid projection (same domain as the emission files) for UK terrestrial cells (no. of cells = 259 436). Other land cover types used in the calculations (but not output) are arable, urban and improved grassland.
2.4 Evaluation
2.4.1 Observation data
ACTM results were evaluated using measured annual mean concentrations from rural background monitoring stations throughout the UK, via the UK Acidifying and Eutrophying Atmospheric Pollutants (UKEAP) network (UK AIR, 2020). Mean annual data were used (as the FRAME model output is an annual mean) if there was a data capture greater than 50 % across the measurements for a given site in a given year, which allows not only for direct comparison between modelled and measured data but also a certain amount of smoothing of potential variability in the measured data due to natural factors (Chang and Hanna, 2004). Table 3 outlines the available measurement networks and the data they provide, while Fig. 3 shows the spatial distribution of the observation sites with measurements in 1990, 1999, 2008 and 2017 (the first year of measurements for each observation network is noted in Table 3). It is believed that this is the first time model evaluation for gases, aerosols and concentration in precipitation has been done across a long time series at multiple points in time on the same dataset.
2.4.2 Evaluation metrics
It is unlikely for an ACTM to perfectly reproduce reality due to errors in, but not limited to, input data, model physics and chemistry schema, uncertainty in meteorological data, and the random effects of the real world. However, using methods outlined in Chang and Hanna (2004), several statistical metrics may be used to evaluate the agreement between the modelled predictions and the real-world observations: fraction of predictions within a factor of 2 of observations (FAC2), the fractional bias (FB), the normalised mean square error (NMSE) and the geometric mean bias (MG). These metrics are defined in the following way:
where Co represents measured observations and Cp represents model predictions, the former being paired with the latter spatially. A perfect reproduction of measurement data would have FAC2 = 1, FB = 0, NMSE = 0 and MG = 1.
FAC2 is a robust measure of performance, not overly influenced by outliers, indicating the proportion of modelled–measured pairs falling within a factor of 2 of each other. FB is a linear metric that measures the mean systematic bias of the model and may have predictions out of phase with measurements but still return a value of 0 due to cancelling errors. NMSE is a measure of mean relative scatter and reflects both systematic and random errors. Finally MG is also a measure of mean systematic bias, but is less influenced by extreme values as it is a logarithmic metric (see Chang and Hanna, 2004, for more detail). Hanna and Chang (2012) suggest that a model should satisfy at least 50 % of the criteria used (two of four in this study), while the acceptability criteria for each metric are as defined in Theobald et al. (2016): FAC2 > 0.5, |FB| < 0.3, NMSE < 1.5 and 0.7 < MG < 1.3.
Table 4Evaluation metrics of modelled concentrations of six nitrogen compounds in gas, aerosol and precipitation in the UK for 2017 (see Table 3 for definitions). Bold numbers represent where that metric has been satisfied (see Sect. 2.4.2 for metric definitions).
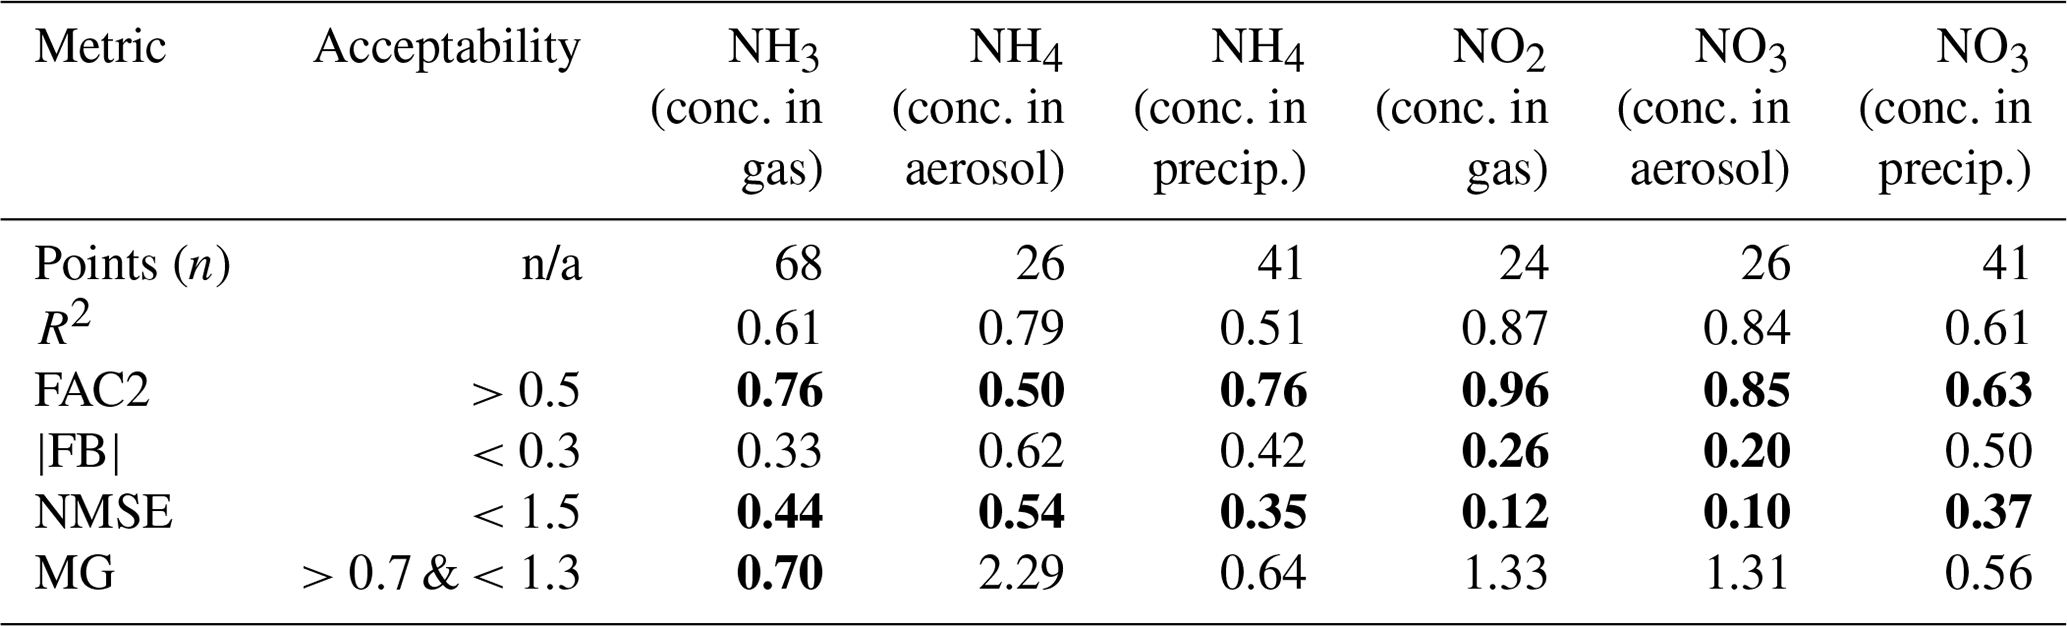
n/a stands for not applicable.
3.1 Emissions
In the UK, stricter air pollution policies, improving technology and changes in fuel use, have all contributed to the reduction of emissions. Initially, mitigation strategies concentrated on SO2 emissions, but the focus was extended to nitrogen compounds such as NOx (as well as VOCs) in an attempt to abate acidification and, latterly, to NH3 (Grennfelt and Hov, 2005; Carnell et al., 2019b). Within the model domain, emissions of NH3 and NOx have decreased by ∼12 % and ∼64 % respectively from 1990 to 2017 (Fig. 4).

Figure 4Emissions (in kt) of ammonia (NH3), nitrogen oxides (NOx) and sulfur dioxide (SO2) in the model domain, covering the UK and Ireland, from 1990 to 2017, split into the main broad reporting sectors.
Much of the decrease in emissions of NOx in the UK has been driven by the decline of coal use in power stations (95% decrease in emissions over the time series) and the improvement and modernisation of petrol combustion in road transport (98 % decrease in emissions over the time series). Decreases in NOx have been offset by increases in emissions from DERV (diesel fuels) and aviation fuels. With regard to NH3 emissions, which are dominated by agriculture, changes in farm practices have seen a patchwork of decreases and increases to various emissions sources, with a generally decreasing trend that has plateaued from ca. 2001. It is the non-agricultural sources, however, that have shown marked increases from 1990 to 2017, including those activities associated with the circular economy: anaerobic digestion, composting of organic materials, application of sewage sludge to land and the combustion of biomass for industry (total increase: ∼5 to ∼26 kt). Finally, SO2 emissions have reduced by ∼94 % in the same time period (mean of ∼5 % yr−1), which is a direct result of the decline of coal use, especially in power stations, and restrictions being placed on the sulfur content of various fuels.
As all three pollutants are reactive in the atmosphere, differing rates of emissions reductions have varying effects on chemical reactions and subsequent deposition. Changes to emissions over time vary in space and so does, therefore, N deposition (Fowler et al., 2007).
3.2 Model evaluation
Scatter plots of the modelled predictions vs. measurements in 2017, for data collected in Table 3, are shown in Fig. 5. The associated performance metrics are given in Table 4.
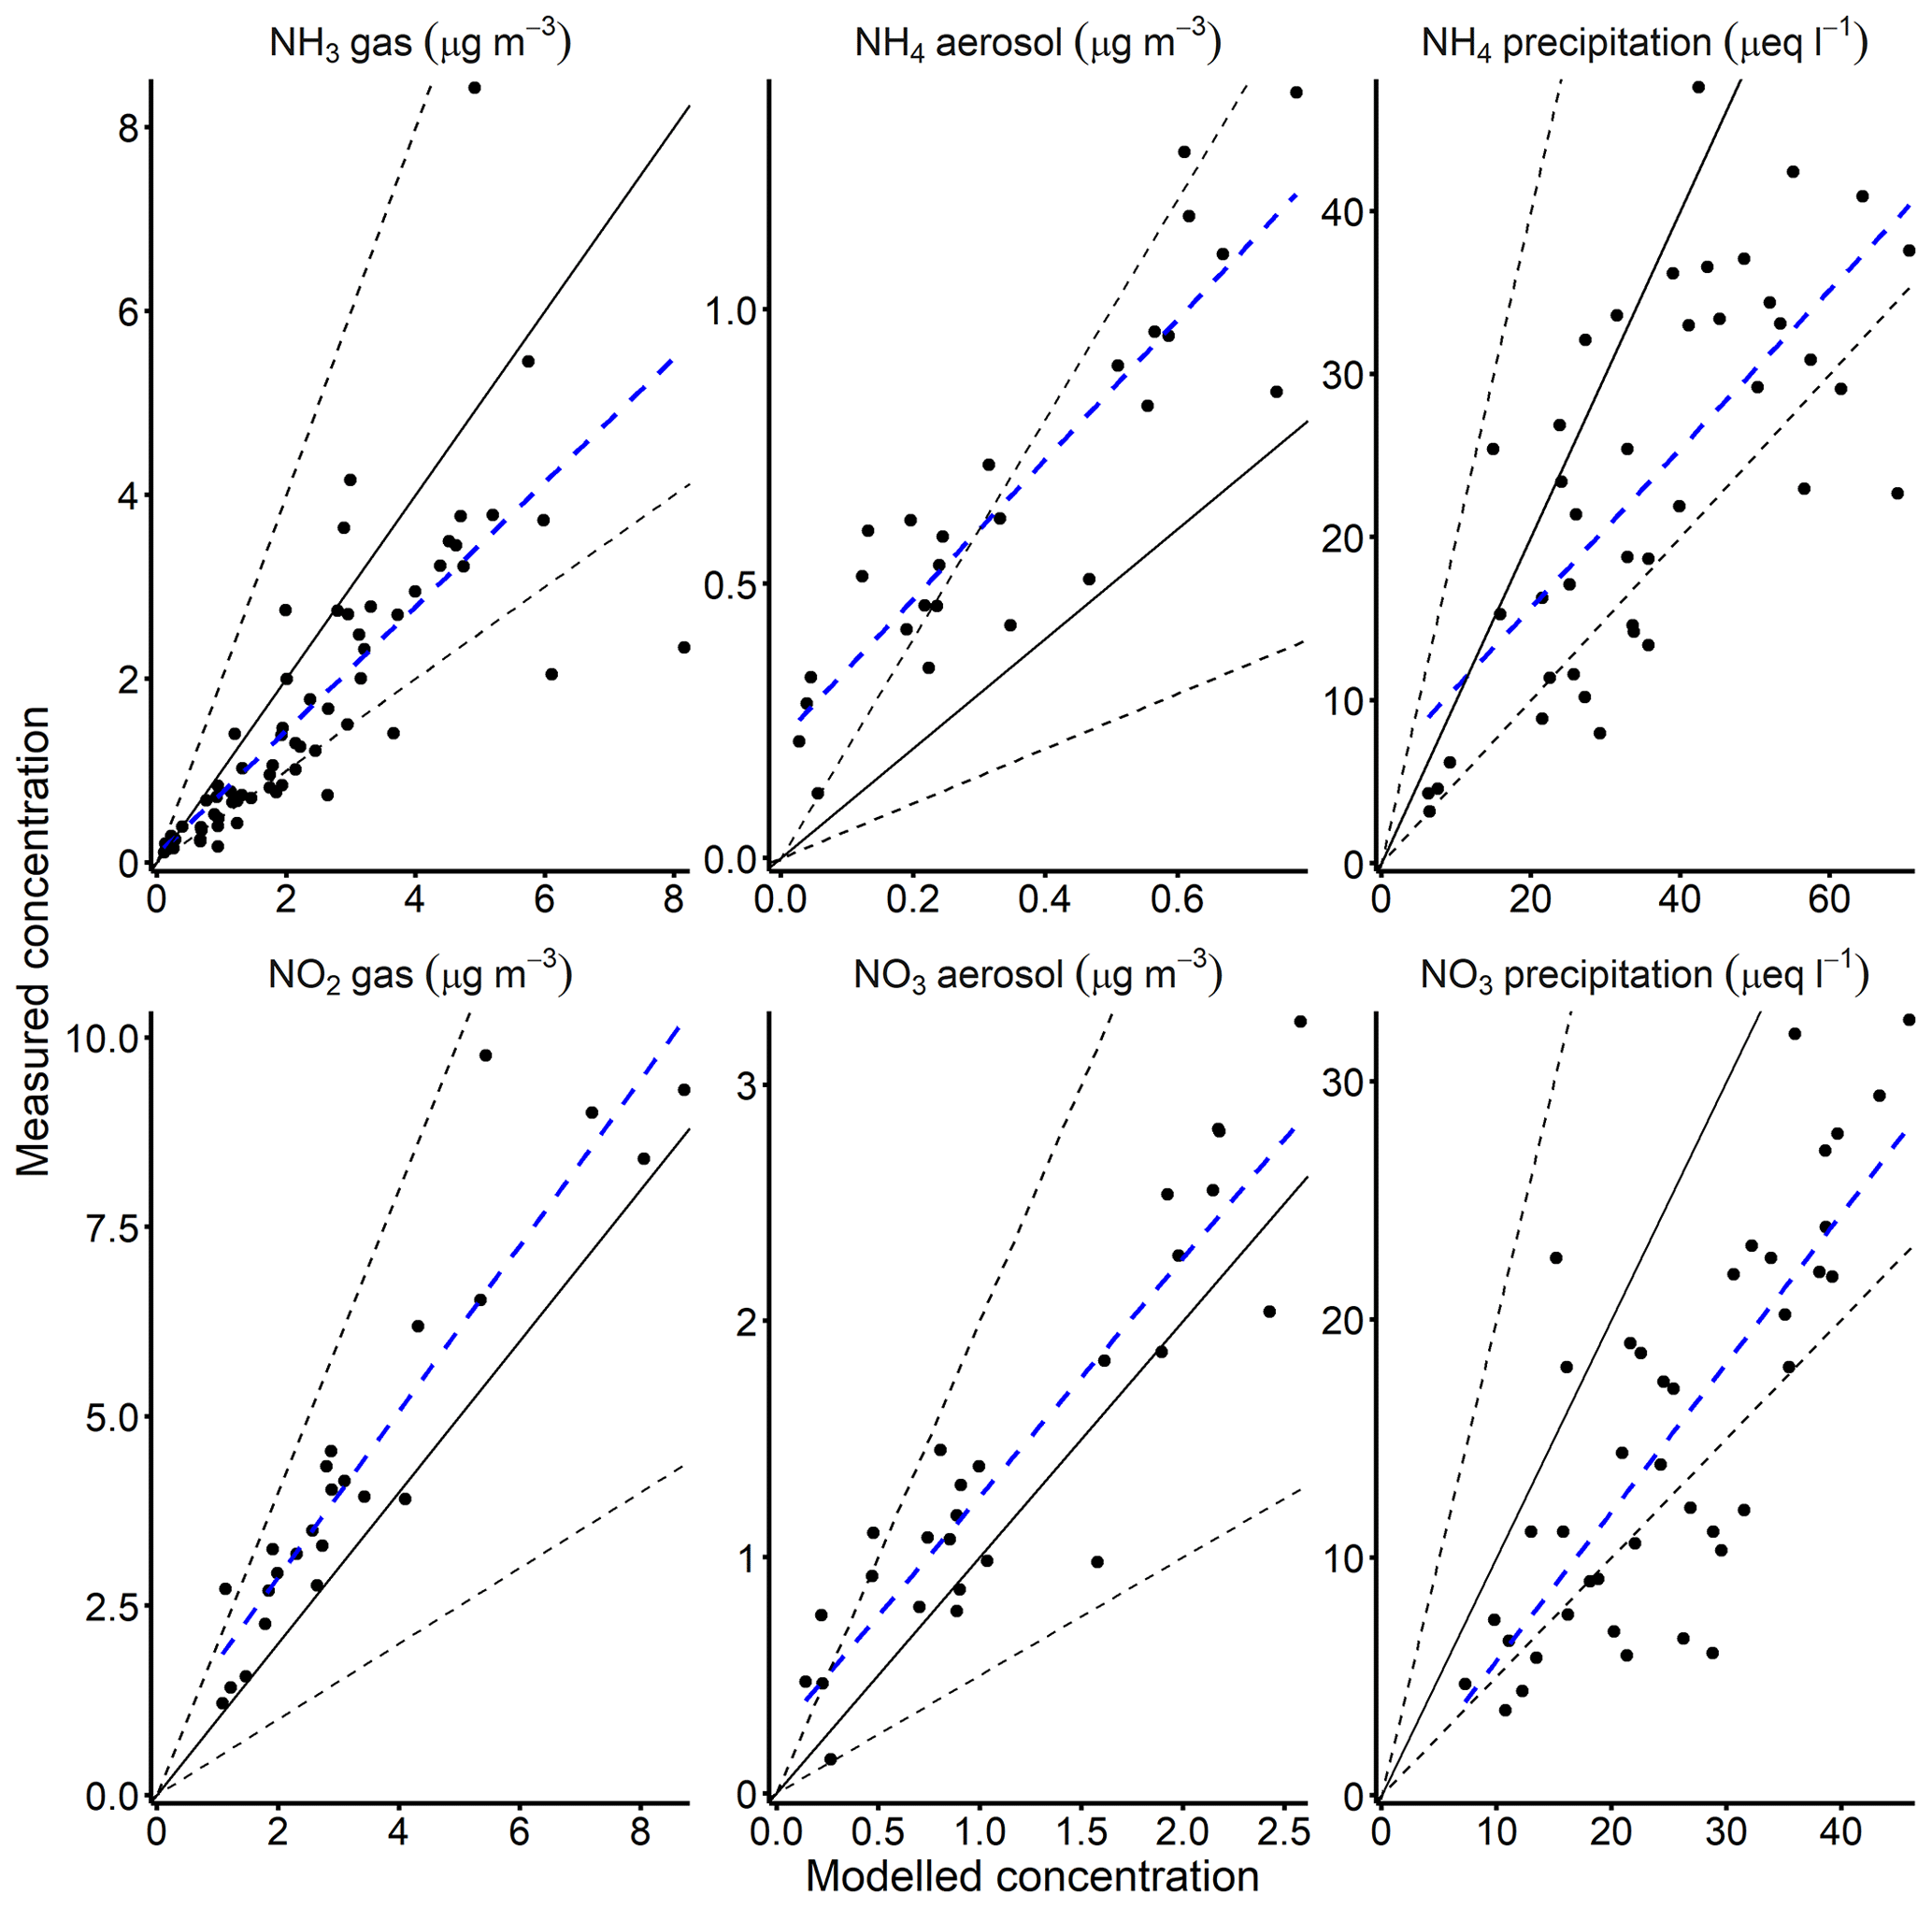
Figure 5Evaluation of modelled (x axis) and measured (y axis) concentrations of six nitrogen compounds in the UK for 2017 (see Table 3 for definitions). The solid black line represents a 1:1 relationship, and the dotted lines represent a factor of 2 (FAC2) relationship; the blue dashed lines are linear regressions.
For the latest year included in this study, all six N forms in Table 4 comply with the FAC2 metric and all six comply with the recommended NMSE limit of 1.5. FB and MG are met with less success, though all are close to the recommended thresholds, aside from NH4 in aerosol (which contributes to dry deposition). FB and MG measure the systematic bias of the model, and for both NH4 and NO3, the model slightly under-predicts the aerosol phase and over-predicts the aqueous phase. Not shown in Fig. 5 and Table 4 is the evaluation of HNO3 in gas, which similarly fulfils recommendations for FAC2 (0.54) and NMSE (0.48), but not for |FB| (0.48) or MG (0.56). Modelled predictions were also evaluated for 2016, with all seven compounds achieving 50 % compliance, with NH3 in gas, NO2 in gas and HNO3 in gas satisfying all four. It is not fully known why 2016 achieves better evaluation scores; it may be random variations in real-world conditions, but one reason may be that 2017 was a relatively warm year by annual mean temperature standards (and fourth warmest on record for England only). It is known that NH3 emissions are affected by temperature (e.g. Hempel et al., 2016; Sutton et al., 2013; Riddick et al., 2018), and, as temperature fluctuations are not factored into the model or into the underlying emission inventories, this may have driven higher spring–summer emissions of NH3 and therefore higher dry deposition episodes.
For context, Carslaw (2011) undertook a model inter-comparison exercise for the UK Department for Environment, Food & Rural Affairs (Defra), with a specific focus on deposition from the CMAQ, EMEP4UK, FRAME, HARM and NAME models. Respectively, those models (at the time) were run at resolutions of 12, 5, 5, 10 and 12 km. In Carslaw (2011), the models performed with a similar correlation coefficient (“r”) for all N compounds, aside from NH4 and NO3 in precipitation, for which the 2017 model run in this study had a weaker correlation (0.51–0.61 compared to 0.7–0.88).
The evaluation for 2017 would indicate that total wet deposition was over-predicted and total dry deposition was under-predicted. To provide further context and evaluation, measurement data were obtained for three previous years spanning the time series at equal intervals; 1990, 1999 and 2008. Data for historic years, especially prior to ∼1998, are limited, and so scatter plots in Fig. 6 show the relationship between modelled predictions and measured data for four N compounds while Table 5 shows the associated performance metrics.

Figure 6Evaluation of modelled (x axis) and measured (y axis) concentrations of four nitrogen compounds in the UK for 1990, 1999 and 2008 (see Table 3 for definitions; no NH3 gas data exist for 1990). The solid black line represents a 1:1 relationship, and the dotted lines represent a factor of 2 (FAC2) relationship. The blue, green and red dashed lines are linear regressions.
Table 5Evaluation metrics of modelled concentrations of six nitrogen compounds in the UK for 1990, 1999 and 2008 (see Table 3 for definitions). Dashed lines represent no available data. Bold numbers represent where that metric has been satisfied (see Sect. 2.4.2 for metric definitions).

All N forms for which data were available in 1990, 1999 and 2008 satisfy at least two of the four evaluation metrics, with four gas and aerosol N compounds fulfilling all metrics in 2008. An example of the benefit of multiple evaluation metrics is shown in Fig. 6 when looking at NO2 and NH3 in gas in 2008. Both have very low FB values (indicating very low mean bias) due to the cancelling effect around the 1:1 line, but the scatter of predictions to measurements of NH3 is clearly much larger than for NO2. Information of the NMSE and the FAC2, plus visual inspection of the plots, helps to illustrate that NH3 has a larger error than NO2.
From the perspective of model sensitivity and/or uncertainty, there were no further runs made with adjusted emissions inputs or adjusted deposition parameters within this study. However, Aleksankina et al. (2018) employed statistical techniques to obtain uncertainty estimates of the FRAME model, representing model runs with a ±40 % variation range for the UK emissions of SO2, NOx and NH3. They found that the sensitivity of concentrations of primary precursors NOx and NH3, plus the deposition of N, was dominated by emissions. However, concentrations of secondary species such as particulate and were more geographically dependent.
3.3 Nitrogen deposition
Grid average N deposition – NHx wet and dry, NOy wet and dry – is plotted in Fig. 7 at a 1 km × 1 km resolution over the UK terrestrial surface, for 2017. The total N deposition over the UK is 278.3 kt N ( = 10.7 kg N ha−1 yr−1, SD = 4.5 kg N ha−1 yr−1), with a maximum of 74.3 kg N ha−1 yr−1. Such high deposition values are reasonably rare (no. of cells > 30 kg N ha−1 yr; no. of cells > 50 kg N ha−1 yr) and are a direct result of the increased resolution of the model, when compared to the maximum deposition of 5 km × 5 km resolution N deposition.

Figure 7Four forms of nitrogen (N) deposition over the UK terrestrial surface in 2017 at 1 km × 1 km resolution, for grid average land cover: wet and dry deposition of reduced N (NHx) and wet and dry deposition of oxidised N (NOy) (kg N ha−1 yr−1).
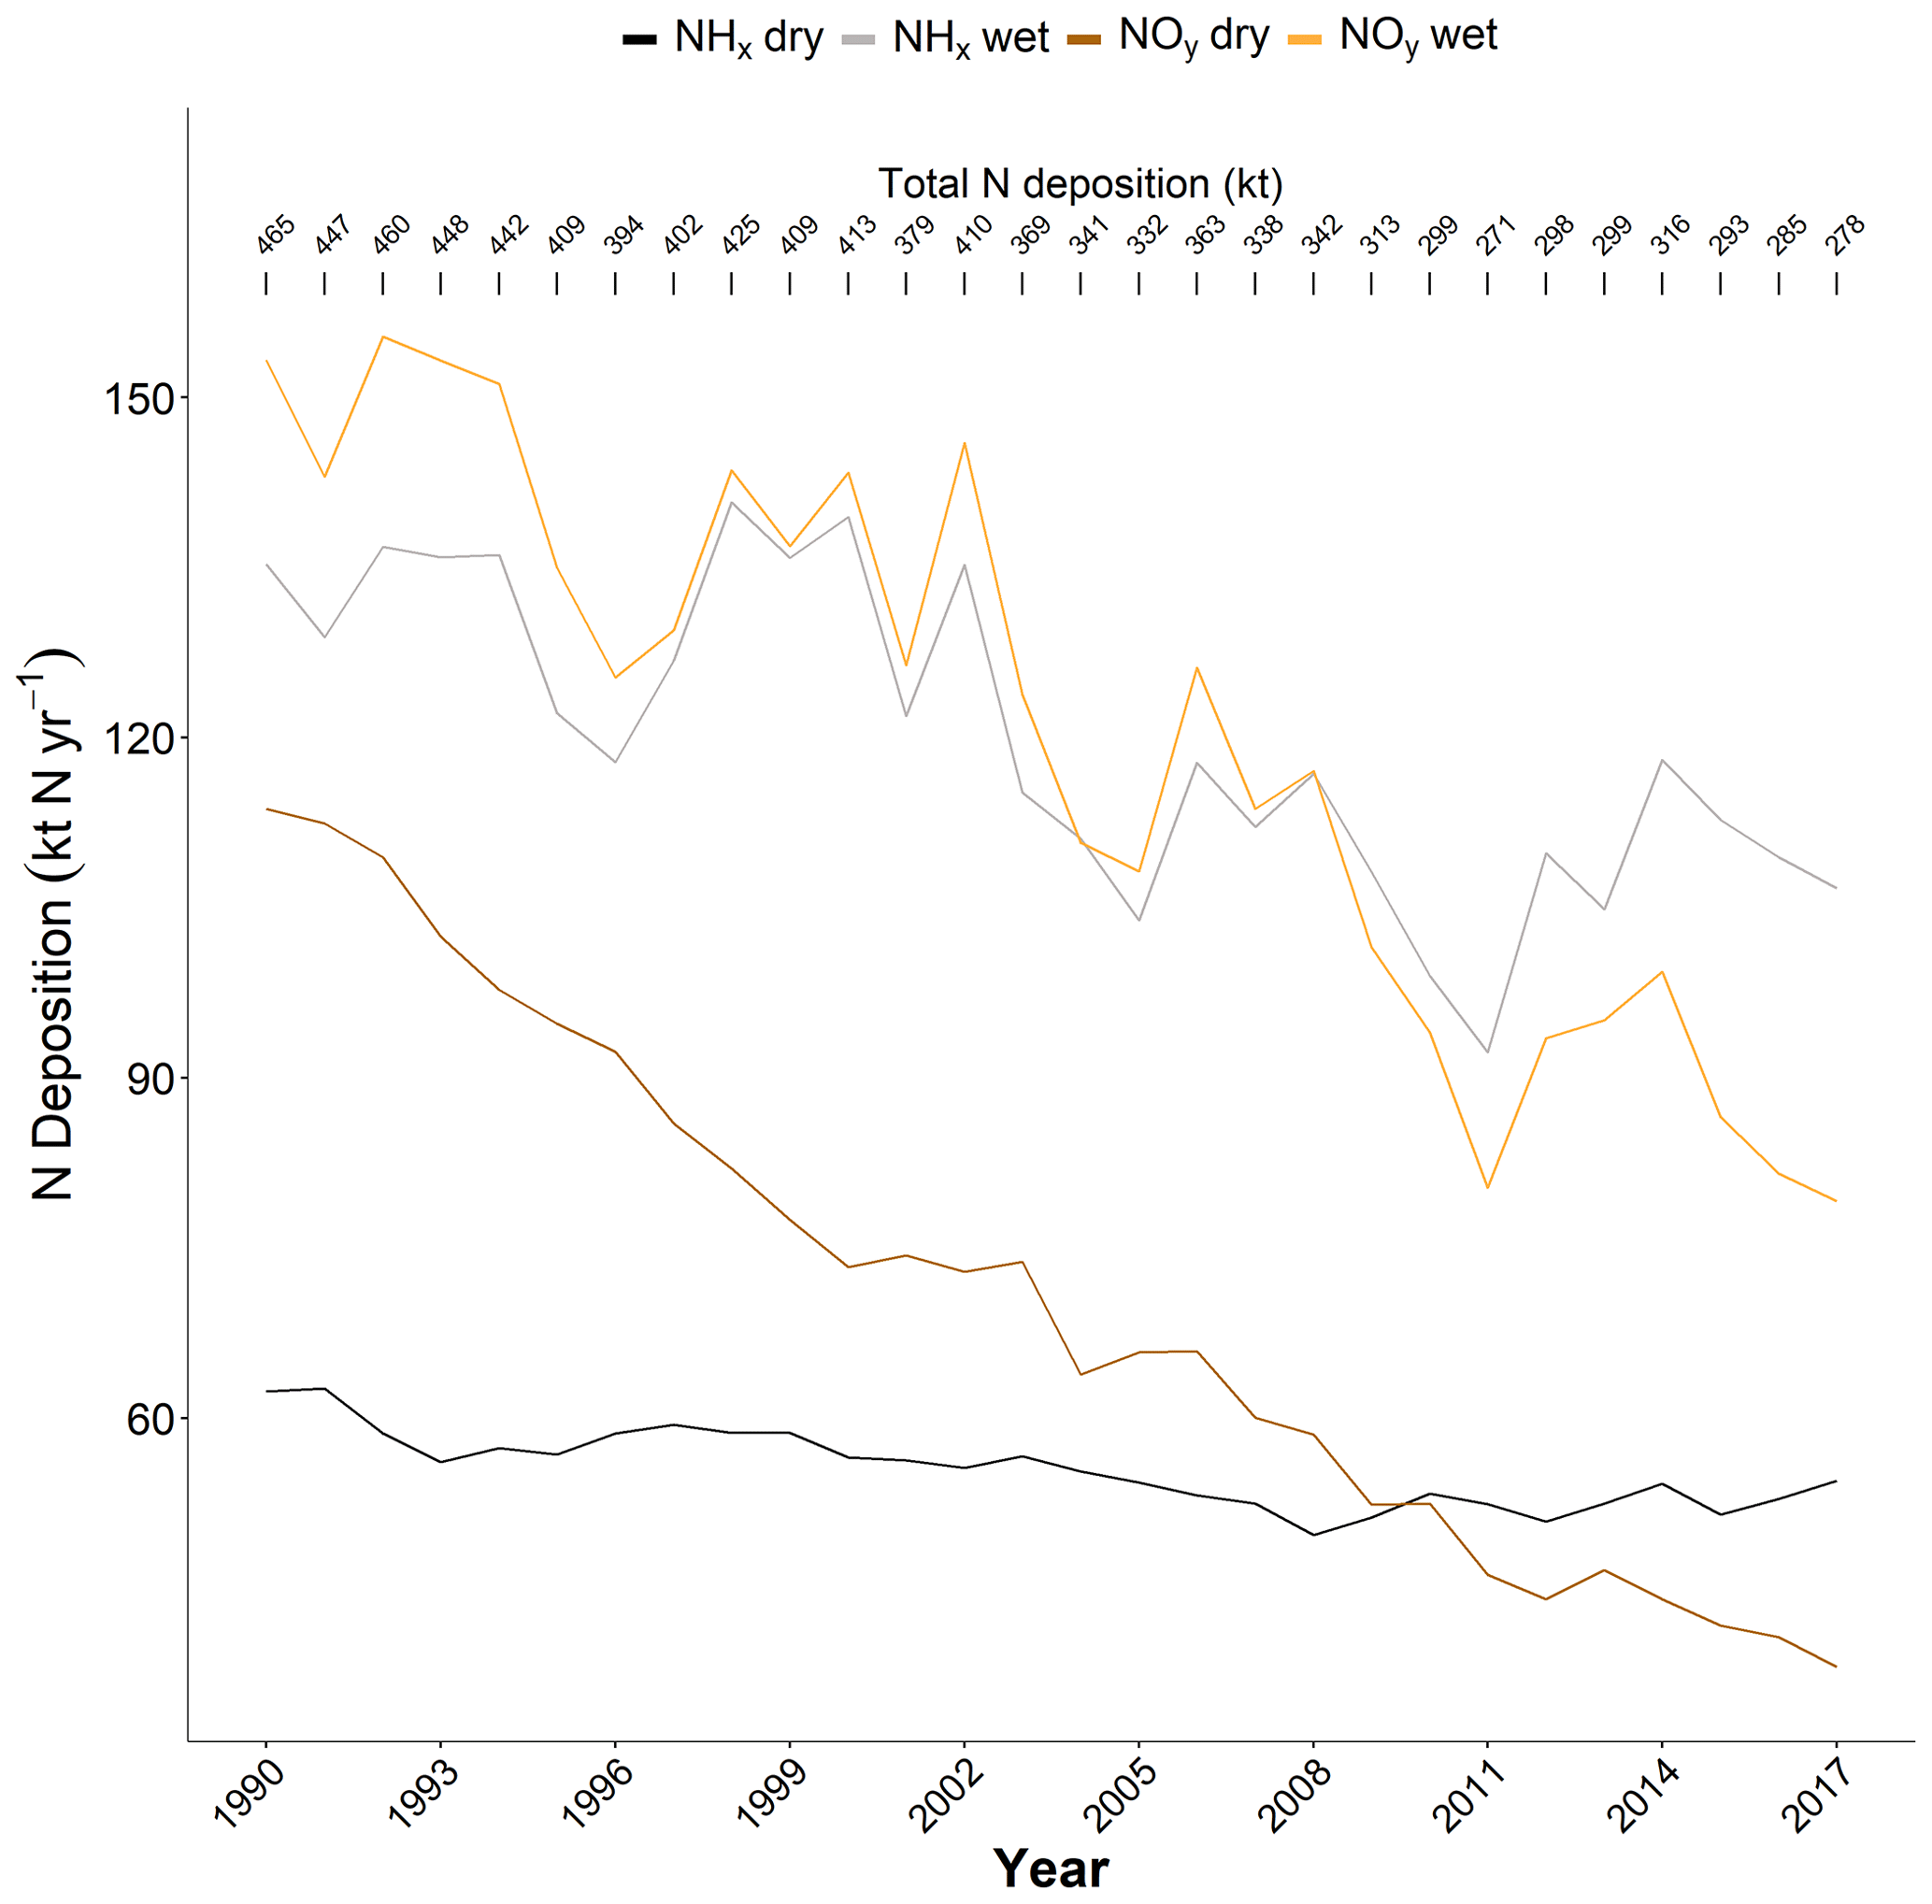
Figure 8Four forms of total nitrogen (N) deposition over the UK terrestrial surface from 1990 to 2017, for grid average land cover: total wet and dry deposition of reduced N (NHx) and wet and dry deposition of oxidised N (NOy) (kt N yr−1).
The two wet deposition surfaces in Fig. 7 exhibit smoother spatial distributions and less heterogeneity (compared to dry deposition), a reflection of the precipitation surface across the UK, and they constitute ∼67 % of the total deposition. Wet deposition is nearly always of a longer-range than dry deposition, due to the transport in more elevated atmospheric layers, but some enhanced local washout around strong sources is also represented. This longer range transport acts as a smoothing effect on the deposition field due to the increased distance from the emission source. It should be noted that, as shown in Figs. 5 and 6, deposition in precipitation of both NH4 and NO3 is consistently overpredicted by the model throughout the time series. Upland areas are subject to the highest values of wet deposition, and most of the highest value cells between 25 and 50 kg total N ha−1 yr−1 are dominated by wet deposition. Dry deposition of NOy, as modelled in this study, is the smallest contributor to total N deposition (∼14 %) and is dominated by NO2 and HNO3, which both follow their respective concentration fields closely (RoTAP, 2012). Dry deposition of NO2, therefore, is largest in urban areas and close to road networks such as motorways. Dry deposition of NHx, ∼20 % of total N deposition, is a highly heterogeneous surface with the highest values associated with areas of intensive livestock farming (including beef, dairy, pigs and poultry). Gaseous NH3 has a short atmospheric lifetime and so is deposited close to the sources. The very highest values of total N deposition (>50 kg N ha−1 yr−1) are all dominated by dry deposition of NHx and are located near high agricultural emissions. An important factor in the deposition of NHx is the presence of oxidised SO2, sulfuric acid (H2SO4), to form the aerosol (NH4)2SO4. With decreasing SO2 available to create H2SO4, more NH3 is deposited within short distances as dry deposition. This effect is further enhanced by the increased rate of dry deposition of the available SO2, a result of the increase in the concentration ratio of NH3 : SO2, which increases surface water pH, which further limits the available SO2 to oxidise to H2SO4 (Baek and Aneja, 2004; Fowler et al., 2007; RoTAP, 2012; Tan et al., 2020).
Looking at the pattern of modelled N deposition from 1990 to 2017, Fig. 8 shows a steady decrease in wet and dry NOy deposition, a slow decrease in wet NHx deposition, and no apparent decrease in dry NHx deposition. The latter is due to the change in atmospheric chemistry with declining sulfur emissions due to successful policy implementation. Total N deposition over the UK has decreased from 465 to 278 kt N, though no significant reductions in the total have occurred since around 2011.
Total oxidised N deposition has decreased by ∼56 % from 1990 to 2017, while reduced N deposition has decreased by ∼19 %. This reflects the larger emissions reductions achieved for NOx than for NH3 from 1990. Mean deposition values for all four N forms have changed in a similar fashion to their respective totals from 1990, but the standard deviation across all 5 km × 5 km cells for oxidised N (both wet and dry) has decreased over time, possibly due to the heavy reductions in emissions sources such as road traffic and power stations, which previously created very high localised dry deposition. Figure 9 shows every year of total N deposition from 1990 to 2017 and highlights the non-linear relationship between decreasing emissions and deposition.
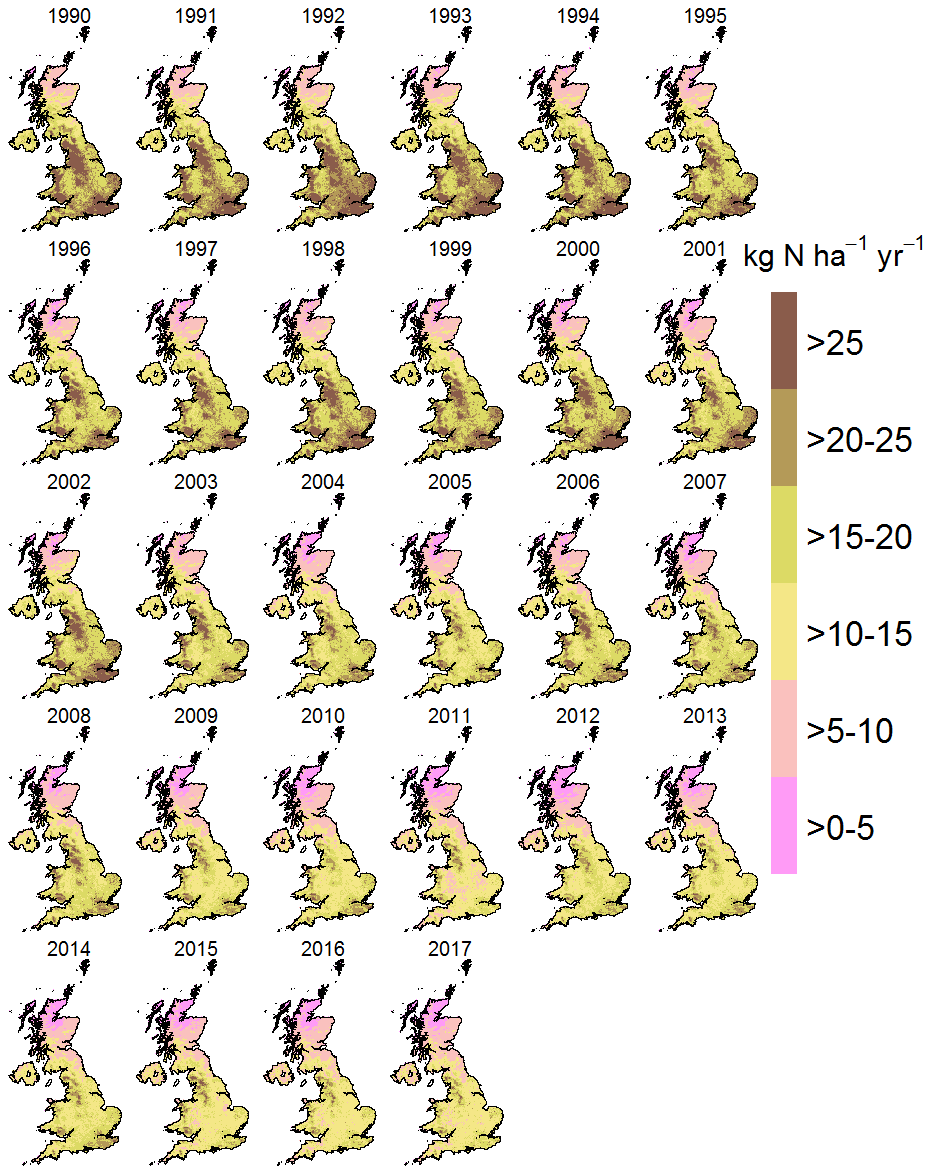
Figure 9Spatial distribution of total nitrogen (N) deposition over the UK terrestrial surface, 1 km × 1 km resolution, from 1990 to 2017, for grid average land cover (kt N yr−1).
Some of the areas with the highest N deposition in later years are remote upland areas, which are principally affected by longer-range wet deposition (and transboundary deposition) and have seen much lower relative decreases in N deposition than lowland areas such as southeast England. NOx emissions have decreased by ∼64 % across the time series and resulted in wet and dry NOy deposition decreases of ∼48 % and ∼66 %, respectively. This illustrates the non-linear processes involved with the chemical processing of NOx emissions, in particular the resulting concentrations of NO3 in precipitation which are not decreasing at the same rate as gas and/or aerosol forms of oxidised N (see Fowler et al., 2007; Sickles and Shadwick, 2015; Feng et al., 2020). It must be recognised again, however, that the model over-estimates wet deposition of N to a degree.
As a result of emissions changes and non-linear chemistry, estimates of modelled dry deposition have decreased as a percentage of the total N deposition ( %, %) (see Fig. 10). This dataset models wet deposition as the dominant source of total N deposition.

Figure 10Fraction of the total nitrogen (N) deposition over the UK terrestrial surface for four forms of nitrogen (N) deposition, for grid average land cover, from 1990 to 2017: total wet and dry deposition of reduced N (NHx) and wet and dry deposition of oxidised N (NOy).
As a result of the large decreases in NOx emissions, and fewer regulations on most NH3 emission sources in the UK compared to NOx, reduced N is now the major component of N deposition. In this dataset, the proportion of dry deposition has moved from being dominated by oxidised N in 1990 (∼65 %) to reduced N in 2017 (∼59 %). This has resulted in a highly heterogeneous spatial distribution of N deposition that is more reflective of both agricultural practice and rainfall patterns.
The deposition data described in this paper are made available via the NERC Environmental Information Data Centre at https://doi.org/10.5285/9b203324-6b37-4e91-b028-e073b197fb9f (Tomlinson et al., 2020).
This new dataset provides a consistent time series of modelled wet and dry deposition of both reduced and oxidised N (plus total N) for the whole UK terrestrial surface on a 1 km × 1 km resolution (no. of cells = 259 436), from 1990 to 2017. Atmospheric modelling was undertaken for all 28 years, and there is good agreement between modelled predictions and measured observations of various compounds of N not only for 2016 and 2017 but also for selected prior years when tests were carried out (1990, 1999 and 2008). It is estimated within this dataset that N deposition has undergone large decreases across the time period, from 465 to 278 kt N, but that a cessation in the decrease in NH3 emissions (plus vast reductions in SO2 emissions) has seen reduced N become the dominant fraction of all N deposition. Higher-resolution data enable more detailed effect studies across a wide range of disciplines, as well as cumulative effects from the annual time series. Further work should be aimed at improving the long-term spatial distribution of emissions.
SJT designed and coded the methodology to combine all data sources into compatible input data, quality assurance and quality control work, compiled a time series of rainfall data, reformatted FRAME Europe outputs to FRAME Europe inputs and analysed all model outputs, including historic model performance. EJC performed all of the agricultural emissions mapping for the time series, updated the FRAME UK land use files and undertook QAQC work. AJD undertook all atmospheric modelling requirements, principally the model runs and most recent evaluations. MV provided expert knowledge and advice with regard to atmospheric chemistry and modelling. UD managed the atmospheric modelling task and offered expert advice on the spatial distribution of emissions and N deposition. SJT prepared the manuscript with contributions from all co-authors. All co-authors commented on the draft manuscript.
The authors declare that they have no conflict of interest.
Publisher's note: Copernicus Publications remains neutral with regard to jurisdictional claims in published maps and institutional affiliations.
This research was funded by the Natural Environment Research Council (NERC) under research programme NE/N018125/1 ASSIST – Achieving Sustainable Agricultural Systems (https://assist.ceh.ac.uk/, last access: 1 December 2020). ASSIST is an initiative jointly supported by NERC and the Biotechnology and Biological Sciences Research Council (BBSRC).
This research has been supported by the Natural Environment Research Council (grant no. NE/N018125/1).
This paper was edited by Giulio G. R. Iovine and reviewed by two anonymous referees.
Aggenbach, C. J. S., Kooijman, A. M., Fujita, Y., van der Hagen, H., van Til, M., Cooper, D., and Jones, L.: Does atmospheric nitrogen deposition lead to greater nitrogen and carbon accumulation in coastal sand dunes?, Biol. Conserv., 212, 416–422, https://doi.org/10.1016/j.biocon.2016.12.007, 2017.
Aleksankina, K., Heal, M. R., Dore, A. J., Van Oijen, M., and Reis, S.: Global sensitivity and uncertainty analysis of an atmospheric chemistry transport model: the FRAME model (version 9.15.0) as a case study, Geosci. Model Dev., 11, 1653–1664, https://doi.org/10.5194/gmd-11-1653-2018, 2018.
Baek, B. H. and Aneja, V. P.: Measurement and analysis of the relationship between ammonia, acid gases, and fine particles in eastern North Carolina, Air Waste Manage. Assoc., 54, 623–633, https://doi.org/10.1080/10473289.2004.10470933, 2004.
Britton, A. J., Gibbs, S., Fisher, J. M., and Helliwell, R. C.: Impacts of nitrogen deposition on carbon and nitrogen cycling in alpine Racomitrium heath in the UK and prospects for recovery, Environ. Pollut., 254, 112986, https://doi.org/10.1016/j.envpol.2019.112986, 2019.
Brown, P., Broomfield, M., Cardenas, L., Choudrie, S., Jones, L., Karagianni, E., Passant, N., Thistlethwaite, G., Thomson, A., Turtle, L., and Wakeling, D.: UK Greenhouse Gas Inventory, 1990 to 2017: Annual Report for submission under the Framework Convention on Climate Change, available at: https://unfccc.int/sites/default/files/resource/gbr-2019-nir-15apr19.zip (last access: 1 November 2020), 2019.
Carnell, E. J., Thomas, I. N., Tomlinson, S. J., Leaver, D., and Dragosits, U.: The spatial distribution of ammonia, methane and nitrous oxide emissions from agriculture in the UK 2017, Contribution to the UK National Atmospheric Emission Inventory and Greenhouse Gas Inventory, Annual Report on Defra Project SCF0107, CEH Report, 13 pp., available at: http://nora.nerc.ac.uk/id/eprint/529856/ (last access: 15 October 2020), 2019a.
Carnell, E. J., Vieno, M., Vardoulakis, S., Beck, R., Heaviside, C., Tomlinson, S., Dragosits, U., Heal, M. R., and Reis, S.: Modelling public health improvements as a result of air pollution control policies in the UK over four decades – 1970 to 2010, Environ. Res. Lett., 14, 074001, https://doi.org/10.1088/1748-9326/ab1542, 2019b.
Carslaw, D.: Defra deposition model evaluation analysis – Phase 1, available at: https://uk-air.defra.gov.uk/assets/documents/reports/cat20/1105091512_DepsotionFinal.pdf (last access: 15 January 2020), 2011.
Chang, J. C. and Hanna, S. R.: Air quality model performance evaluation, Meteorol. Atmos. Phys., 87, 167–196, https://doi.org/10.1007/s00703-003-0070-7, 2004.
Dore, A. J., Kryza, M., Hall, J. R., Hallsworth, S., Keller, V. J. D., Vieno, M., and Sutton, M. A.: The influence of model grid resolution on estimation of national scale nitrogen deposition and exceedance of critical loads, Biogeosciences, 9, 1597–1609, https://doi.org/10.5194/bg-9-1597-2012, 2012.
Dore, A., Reis, S., Oxley, T., ApSimon, H., Hall, J., Vieno, M., Kryza, M., Green, C., Tsagatakis, I., Tang, S., Braban, C., and Sutton, M.: Calculation of Source-Receptor Matrices for Use in an Integrated Assessment Model and Assessment of Impacts on Natural Ecosystems, in: Air Pollution Modeling and Its Application Xxiv, edited by: Steyn, D. G. and Chaumerliac, N., Springer, Cham, 107–112, 2016.
Dore, A. J., Vieno, M., Fournier, N., Weston, K. J., and Sutton, M. A.: Development of a new wind-rose for the British Isles using radiosonde data, and application to an atmospheric transport model, Q. J. Roy. Meteorol. Soc., 132, 2769–2784, 2006.
Dragosits, U., Sutton, M. A., Place, C. J., and Bayley, A. A.: Modelling the spatial distribution of agricultural ammonia emissions in the UK, Environ, Pollut,, 102, 195–203, https://doi.org/10.1016/S0269-7491(98)80033-X, 1998.
EEA – European Environment Agency: EMEP/EEA air pollutant emission inventory guidebook 2019 – Technical guidance to prepare national emission inventories, EEA Report No. 13/2019, Luxembourg, 2019.
EMEP – European Monitoring and Evaluation Programme: The Emissions Database, available at: https://www.ceip.at/webdab-emission-database (last access: 20 August 2019), 2019.
E-PRTR – European Pollutant Release and Transfer Register: Welcome to the Industrial emissions portal, available at: https://industry.eea.europa.eu/, last access: 20 August 2019.
Feng, J., Chan, E., and Vet, R.: Air quality in the eastern United States and Eastern Canada for 1990–2015: 25 years of change in response to emission reductions of SO2 and NOx in the region, Atmos. Chem. Phys., 20, 3107–3134, https://doi.org/10.5194/acp-20-3107-2020, 2020.
Fowler, D., O'Donoghue, M., Muller, J. B. A., Smith, R. I., Dragosits, U., Skiba, U., Sutton, M. A., and Brimblecombe, P.: A Chronology of Nitrogen Deposition in the UK Between 1900 and 2000, Water Air Soil Pollut., 4, 9–23, https://doi.org/10.1007/s11267-004-3009-1, 2004.
Fowler, D., Smith, R. I., Muller, J. B. A., Cape, J. N., Sutton, M. A., Erisman, J. W., and Fagerli, H.: Long Term Trends in Sulphur and Nitrogen Deposition in Europe and the Cause of Non-linearities, Water Air Soil Pollut., 7, 41–47, https://doi.org/10.1007/s11267-006-9102-x, 2007.
Greenwood, N., Devlin, M. J., Best, M., Fronkova, L., Graves, C. A., Milligan, A., Barry, J., and van Leeuwen, S. M.: Utilizing Eutrophication Assessment Directives From Transitional to Marine Systems in the Thames Estuary and Liverpool Bay, UK, Front. Mar. Sci., 6, 116, https://doi.org/10.3389/fmars.2019.00116, 2019.
Grennfelt, P. and Hov, Ø.: Regional air pollution at a turning point, Ambio, 34, 2–10, https://doi.org/10.1579/0044-7447-34.1.2, 2005.
Hallsworth, S., Dore, A. J., Bealey, W. J., Dragosits, U., Vieno, M., Hellsten, S., Tang, Y. S., and Sutton, M. A.: The role of indicator choice in quantifying the threat of atmospheric ammonia to the `Natura 2000' network, Environ. Sci. Policy, 13, 671–687, https://doi.org/10.1016/j.envsci.2010.09.010, 2010.
Hanna, S. R. and Chang, J.: Setting Acceptance Criteria for Air Quality Models, Air Pollut. Model. Appl., 5, 479–484, 2012.
Hellsten, S., Dragosits, U., Place, C. J., Vieno, M., and Sutton, M. A.: Modelling and assessing the spatial distribution of ammonia emissions in the UK. Environ. Pollut., 154, 370–379, https://doi.org/10.1016/j.envpol.2008.02.017, 2008.
Hempel, S., Saha, C. K., Fiedler, M., Berg, W., Hansen, C., Amon, B., and Amon, T.: Non-linear temperature dependency of ammonia and methane emissions from a naturally ventilated dairy barn, Biosyst. Eng., 145, 10–21, https://doi.org/10.1016/j.biosystemseng.2016.02.006, 2016.
Levy, P. E., Martin Hernandez, C., Smith, R. I., Dore, A. J., Tang, Y. S., and Stedman, J. R.: Sulphur and nitrogen atmospheric Concentration Based Estimated Deposition (CBED) data for the UK 2016–2018, NERC Environmental Information Data Centre, https://doi.org/10.5285/5999d471-fe1d-45fa-889d-3156edb785a7, 2020.
MapEire: National mapping of GHG and non-GHG emissions sources, available at: https://projects.au.dk/mapeire/ (last access: 1 November 2020), 2019.
NAEI – National Atmospheric Emissions Inventory: Data, available at: https://naei.beis.gov.uk/data/ (last access: 1 November 2020), 2019.
Nowak, D., Jovan, S., Branquinho, C., Augusto, S., Ribeiro, M. C., and Kretsch, C. E.: Chapter 4: Biodiversity, air quality and human health, in: Connecting Global Priorities – Biodiversity and Human Health: A State of Knowledge Review, edited by: Romanelli, C., Cooper, D., Campbell-Lendrum, D., Maiero, M., Karesh, W. B., Hunter, D., and Golden, C. D., World Health Organization and Secretariat of the Convention on Biological Diversity, WHO Press, Geneva, 63–74, 2015.
Nowak, D. J., Hirabayashi, S., Doyle, M., McGovern, M., and Pasher, J.: Air pollution removal by urban forests in Canada and its effect on air quality and human health, Urban Forest. Urban Green., 29, 40–48, https://doi.org/10.1016/j.ufug.2017.10.019, 2018.
Payne, R. J., Dise, N. B., Field, C., Dore, A., Caporn, S. J. M., and Stevens, C. J.: Nitrogen deposition and plant biodiversity: past, present, and future, Front. Ecol. Environ., 15, 431–436, https://doi.org/10.1002/fee.1528, 2017.
Payne, R. J., Campbell, C., Britton, A. J., Mitchell, R. J., Pakeman, R. J., Jones, L., Ross, L. C., Stevens, C. J., Field, C., Caporn, S. J. M., Carroll, J., Edmondson, J. L., Carnell, E. J., Tomlinson, S. J., Dore, A. J., Dise, N. B., and Dragosits, U.: What is the most ecologically-meaningful metric of nitrogen deposition?, Environ. Pollut., 247, 319–331, https://doi.org/10.1016/j.envpol.2019.01.059, 2019.
Payne, R. J., Campbell, C., Stevens, C. J., Pakeman, R. J., Ross, L. C., Britton, A. J., Mitchell, R. J., Jones, L., Field, C., Caporn, S. J. M., Carroll, J., Edmondson, J. L., Carnell, E. J., Tomlinson, S. J., Dore, A., Dragosits, U., and Dise, N. B.: Disparities between plant community responses to nitrogen deposition and critical loads in UK semi-natural habitats, Atmos. Environ., 239, 117478, https://doi.org/10.1016/j.atmosenv.2020.117478, 2020.
Plejdrup, M. S., Nielsen, O.-K., and Bruun, H. G.: Spatial high-resolution mapping of national emissions, WIT Trans. Ecol. Environ., 230, 399–408, https://doi.org/10.2495/AIR180371, 2018.
Richmond, B., Misra, A., Broomfield, M., Brown, P., Karagianni, E., Murrells, T. P., Pang, Y., Passant, N. R., Pearson, B., Stewart, R., Thistlethwaite, G., Wakeling, D., Walker, C., Wiltshire, J., Hobson, M., Gibbs, M., Misselbrook, T., Dragosits, U., and Tomlinson, S.: UK Informative Inventory Report (1990 to 2017), available at: https://uk-air.defra.gov.uk/library/reports?report_id=978 (last access: 15 December 2020), 2019.
Riddick, S. N., Dragosits, U., Blackall, T. D., Tomlinson, S. J., Daunt, F., Wanless, S., Hallsworth, S., Braban, C. F., Tang, Y. S., and Sutton, M. A.: Global assessment of the effect of climate change on ammonia emissions from seabirds, Atmos. Environ., 184, 212–223, https://doi.org/10.1016/j.atmosenv.2018.04.038, 2018.
RoTAP – Review of Transboundary Air Pollution: Acidification, Eutrophication, Ground Level Ozone and Heavy Metals in the UK, Defra Contract Number AQ0703, UK Centre for Ecology & Hydrology, available at: https://uk-air.defra.gov.uk/library/reports?report_id=701 (last access: 10 April 2020), 2012.
Rowland, C. S., Morton, R. D., Carrasco, L., McShane, G., O'Neil, A. W., and Wood, C. M.: Land Cover Map 2015 (1 km dominant aggregate class, GB), NERC Environmental Information Data Centre, https://doi.org/10.5285/711c8dc1-0f4e-42ad-a703-8b5d19c92247, 2017.
Sickles II, J. E. and Shadwick, D. S.: Air quality and atmospheric deposition in the eastern US: 20 years of change, Atmos. Chem. Phys., 15, 173–197, https://doi.org/10.5194/acp-15-173-2015, 2015.
Singles, R., Sutton, M. A., and Weston, K. J.: A multi-layer model to describe the atmospheric transport and deposition of ammonia in Great Britain, Atmos. Environ., 32, 393–399, https://doi.org/10.1016/S1352-2310(97)83467-X, 1998.
Skamarock, W. C., Klemp, J. B., Dudhia, J., Gill, D. O., Liu, Z., Berner, J., Wang, W., Powers, J. G., Duda, M. G., Barker, D. M., and Huang, X.-Y.: A Description of the Advanced Research WRF Version 4, NCAR Tech. Note NCAR/TN-556+STR, National Center forAtmospheric Research, Boulder, Colorado, 145 pp., https://doi.org/10.5065/1dfh-6p97, 2019.
Smart, S. M., Stevens, C. J., Tomlinson, S. J., Maskell, L. C., and Henrys, P. A.: Comment on Pescott & Jitlal 2020: Failure to account for measurement error undermines their conclusion of a weak impact of nitrogen deposition on plant species richness, Peer J., 9, e10632, https://doi.org/10.7717/peerj.10632, 2020.
Stevens, C. J., David, T. I., and Storkey, J.: Atmospheric nitrogen deposition in terrestrial ecosystems: Its impact on plant communities and consequences across trophic levels, Funct. Ecol., 32, 1757–1769, https://doi.org/10.1111/1365-2435.13063, 2018.
Sutton, M. A., Reis, S., Riddick, S. N., Dragosits, U., Nemitz, E., Theobald, M. R., Tang, Y. S., Braban, C. F., Vieno, M., Dore, A. J., Mitchell, R. F., Wanless, S., Daunt, F., Fowler, D., Blackall, T. D., Milford, C., Flechard, C. R., Loubet, B., Massad, R., Cellier, P., Coheur, P. F., Clarisse, L., van Damme, M., Ngadi, Y., Clerbaux, C., Skjøth, C. A., Geels, C., Hertel, O., Wickink Kruit, R. J., Pinder, R. W., Bash, J. O., Walker, J. D., Simpson, D., Horvath, L., Misselbrook, T., Bleeker, A., Dentener, F., and de Vries, W.: Toward a climate-dependent paradigm of ammonia emission & deposition, P. Roy. Soc. B, 368, 1621, https://doi.org/10.1098/rstb.2013.0166, 2013.
Tan, J., Fu, J. S., and Seinfeld, J. H.: Ammonia emission abatement does not fully control reduced forms of nitrogen deposition, P. Natl. Acad. Sci. USA, 117, 9771–9775, https://doi.org/10.1073/pnas.1920068117, 2020.
Tanguy, M., Dixon, H., Prosdocimi, I., Morris, D. G., and Keller, V. D. J.: Gridded estimates of daily and monthly areal rainfall for the United Kingdom (1890–2017) [CEH-GEAR], NERC Environmental Information Data Centre, https://doi.org/10.5285/ee9ab43d-a4fe-4e73-afd5-cd4fc4c82556, 2019.
Theobald, M. R., Simpson, D., and Vieno, M.: A sub-grid model for improving the spatial resolution of air quality modelling at a European scale, Geosci. Model Dev., 9, 4475–4489, doi10.5194/gmd-9-4475-2016, 2016.
Tomlinson, S. J., Carnell, E. J., Dore, A. J., and Dragosits, U.: Nitrogen deposition in the UK at 1 km resolution, 1990–2017, NERC Environmental Information Data Centre, https://doi.org/10.5285/9b203324-6b37-4e91-b028-e073b197fb9f, 2020.
UK AIR – Air Information Resource: United Kingdom Eutrophying & Acidifying Network (UKEAP), available at: https://uk-air.defra.gov.uk/networks/network-info?view=ukeap (last access: 2 February 2021), 2020.
Vieno, M., Dore, A. J., Bealey, W. J., Stevenson, D. S., and Sutton, M. A.: The importance of source configuration in quantifying footprints of regional atmospheric sulphur deposition, Sci. Total Environ., 408, 985–995, https://doi.org/10.1016/j.scitotenv.2009.10.048, 2010.
Walsh, S.: A Summary of Climate Averages 1981–2010 for Ireland, Climatological Note No. 14, Met Éireann, Dublin, 2012.