Article Text

Abstract
Transdiaphragmatic (Pdi) and oesophageal pressures (Pes) are useful in understanding the pathophysiology of the respiratory system. They provide insight into respiratory drive, intrinsic positive end-expiratory pressure, diaphragmatic fatigue and weaning failure.
Background The use of Pdi and Pes in clinical practice is restricted due to the invasiveness of the technique and the cumbersome equipment needed. On the other hand, diaphragmatic displacement is non-invasively and easily assessed with M-mode ultrasound.
Purpose We observed striking similarities in shape and magnitude between M-mode diaphragmatic displacement, Pes and Pdi pressures. The study aimed to evaluate if the information provided by these two pressures could be obtained non-invasively from the diaphragmatic displacement curve.
Material and methods In 14 consecutive intubated patients undergoing a weaning trial, simultaneous recordings of Pes and Pdi pressures and the diaphragmatic displacement were assessed while breathing spontaneously and during a sniff-like manoeuvre. Moreover, the slope of the diaphragmatic displacement curve during relaxation was compared with the maximal relaxation rate (MRR) obtained from the Pdi curve.
Results More than 200 breaths were analysed in pairs. Diaphragmatic displacement significantly correlated with Pdi (R2=0.33, p<0.001) and Pes (R2=0.44, p<0.001), and this correlation further improved during sniff (R2=0.47, p<0.001) and (R2=0.64, p<0.001), respectively. Additionally, a significant correlation was found between the relaxation slope derived from the diaphragmatic displacement curve and the MRR derived from the Pdi curve, both in normal breathing (R2=0.379, p<0.001) and during the sniff manoeuvre (R2=0.71, p<0.001).
Conclusions M-mode diaphragmatic displacement parameters correlate well with the ones obtained from oesophageal pressure and Pdi, particularly during sniffing. Diaphragmatic displacement assessment possibly offers an alternative non-invasive solution for understanding and clinically monitoring the diaphragmatic contractile properties and weaning failure due to diaphragmatic fatigue.
- respiratory muscles
- respiratory measurement
- imaging/CT MRI etc
Data availability statement
The study data are not publicly available as per an agreement with the data custodian.
This is an open access article distributed in accordance with the Creative Commons Attribution Non Commercial (CC BY-NC 4.0) license, which permits others to distribute, remix, adapt, build upon this work non-commercially, and license their derivative works on different terms, provided the original work is properly cited, appropriate credit is given, any changes made indicated, and the use is non-commercial. See: http://creativecommons.org/licenses/by-nc/4.0/.
Statistics from Altmetric.com
Key messages
Could we obtain information given from transdiaphragmatic and oesophageal pressures from the diaphragmatic displacement curve?
Parameters obtained from diaphragmatic displacement curve offer an alternative non-invasive solution for monitoring the diaphragmatic contractile properties particularly during sniff.
This study represents the first successful attempt to use the M-mode diaphragmatic ultrasound as an alternative to oesophageal and gastric balloons in order to monitor direct in real-time contractile properties of the diaphragm and assess diaphragmatic fatigue.
Introduction
Oesophageal pressure (Pes) and transdiaphragmatic pressure (Pdi) are particularly useful in understanding the physiology of the respiratory system, in health and disease. However, to obtain these parameters, it is necessary to introduce oesophageal and gastric balloons, to use special equipment and software, thus limiting their use in everyday clinical practice. Measurements derived from Pes and Pdi (peak values and consecutive decay) provide insight into weaning failure and patient-ventilator asynchrony, measure respiratory drive and intrinsic positive end-expiratory pressure (PEEP), evaluate contractile properties of the diaphragm and assess diaphragmatic fatigue.1–5
M-mode diaphragmatic ultrasound allows direct, real-time observation of the diaphragmatic displacement over time, providing information regarding the magnitude and duration of diaphragmatic contraction and relaxation.6–9 Diaphragmatic sonography software also provides an easy measurement of the relaxation slope from the diaphragmatic displacement curve, which represents the velocity of diaphragmatic relaxation, given as distance over time (cm/s), a possible alternative to maximal relaxation rate (MRR) obtained from the Pdi waveform.10–13
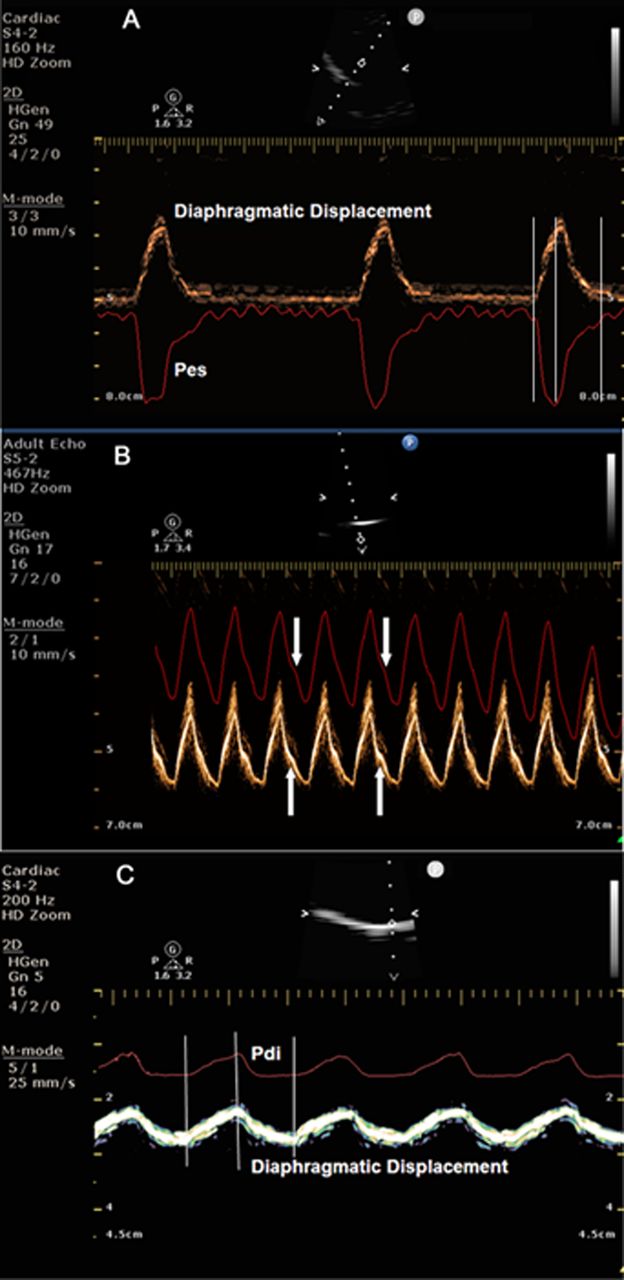
When Pes and Pdi curves are superimposed on the diaphragmatic displacement curve obtained by M-mode diaphragmatic sonography, a striking similarity in shape and magnitude is observed (figure 1). Based on this observation, one can assume that, if there is a good relationship between these two pressures and diaphragmatic displacement, diaphragmatic sonography may be an alternative solution to Pes and Pdi pressures in clinical practice.

(A) Simultaneous recording of diaphragmatic displacement and oesophageal pressure (Pes). Note that the two curves start, peak and end simultaneously. Vertical lines indicate the simultaneous start, peak and termination of the two curves. (B) Pes has been inverted in the ultrasound machine screen to better visualise the similarity of the two curves. Note the concordance and similarity in shape of the two curves, particularly the small bump present in the descending part of both curves (white arrows). (C) Simultaneous recording of diaphragmatic displacement and transdiaphragmatic pressure (Pdi). The two curves start, peak and terminate simultaneously. Note the similarity in shape of the two curves. Vertical lines indicate the simultaneous start, peak and termination of the two curves.
The aim of this study was to identify if valuable information provided from Pes and Pdi can be obtained non-invasively from the diaphragmatic displacement curve. The study was conducted in intubated intensive care unit (ICU) patients undergoing a spontaneous breathing trial. We examined the relationship between the magnitude of Pes and Pdi and the magnitude of the diaphragmatic displacement. Additionally, we looked into the relationship between the diaphragmatic MRR, measured from the Pdi waveform and the relaxation slope obtained from the diaphragmatic displacement curve.
Methods
Subjects
Fourteen consecutive intubated patients undergoing a weaning trial were enrolled in the study. Patients were screened for enrolment when judged by the attending physicians as eligible for a spontaneous breathing trial according to the usual weaning guidelines; briefly, that presupposes resolution of the cause of ICU admission, adequate gas exchange, haemodynamic stability, and ability to cough and obey commands. Patients after thoracic, gastric/oesophageal surgery, with known neuromuscular diseases, obese or without adequate acoustic window were excluded from the study. During the study protocol, patients were breathing spontaneously on a pressure support ventilation (PSV) mode with 0 cmH2O of pressure and 0 cmH2O of PEEP. We used this mode of weaning trial, in order to monitor the respiratory parameters employing the ventilator’s in-built pneumotachograph and to enable patients to perform sniff-like manoeuvres while interrupting the inspiratory flow.
Flow and pressure measurements
Airflow was recorded with a pneumotachograph (TSD 127, Biopac Systems, Goleta, California, USA) in connection with a signal amplifier (DA 100C, Biopac Systems, Goleta, California, USA). The airflow waveform was integrated for calculation of the Tidal volume, by applying zero value at the beginning of each inhalation.
Pdi was recorded using a double-balloon feeding catheter (Nutrivent, Mirandola, Italy) which was positioned for feeding purposes before the onset of the spontaneous breathing trial. The correct position of the catheter was adjusted after the performance of a dynamic occlusion test; the balloon was taped at the position where Pes changed in concert with airway pressure (Paw),14 registering null effective transpulmonary pressure during the occlusion manoeuvre. Both balloons were inflated with 2–4 mL of air and connected to an air-filled differential pressure transducer (TSD 104A, Biopac Systems, Goleta, California, USA), calibrated before each study with a water manometer. Pdi was obtained by electronic subtraction of Pes from the Pga signal; flow, and pressures were all collected and digitised at a sampling rate of 100 Hz and recorded on a computer using dedicated software (Biopac Systems, Goleta, California, USA). Additionally, the Pes and Pdi signals were transmitted via a differential transducer (DP 200, Mesureur, Paris, France) to the ultrasound screen to allow simultaneous, real-time recording of Pes or Pdi and M-mode diaphragmatic sonography.
MRR measured from the Pdi curve is determined as the slope of the initial, steepest part of the descending Pdi pressure curve (Pdi-MRR) (figure 2A).15 Pdi sniff curves were selected for analysis if a rapid sharp upstroke was present, followed by smooth pressure decay. Since we were particularly interested to investigate a possible relationship between the MRR calculated with Pdi manometry and ultrasonography in a variety of breathing conditions and patterns, we did not include acceptability criteria for sniffs about the duration of peak pressure or total sniff duration commonly applied in the laboratory studies; instead, we included all sniffs with the above-mentioned exception only. Overall, almost 80% of the total recorded sniff Pdi tracings were finally considered suitable for analysis.
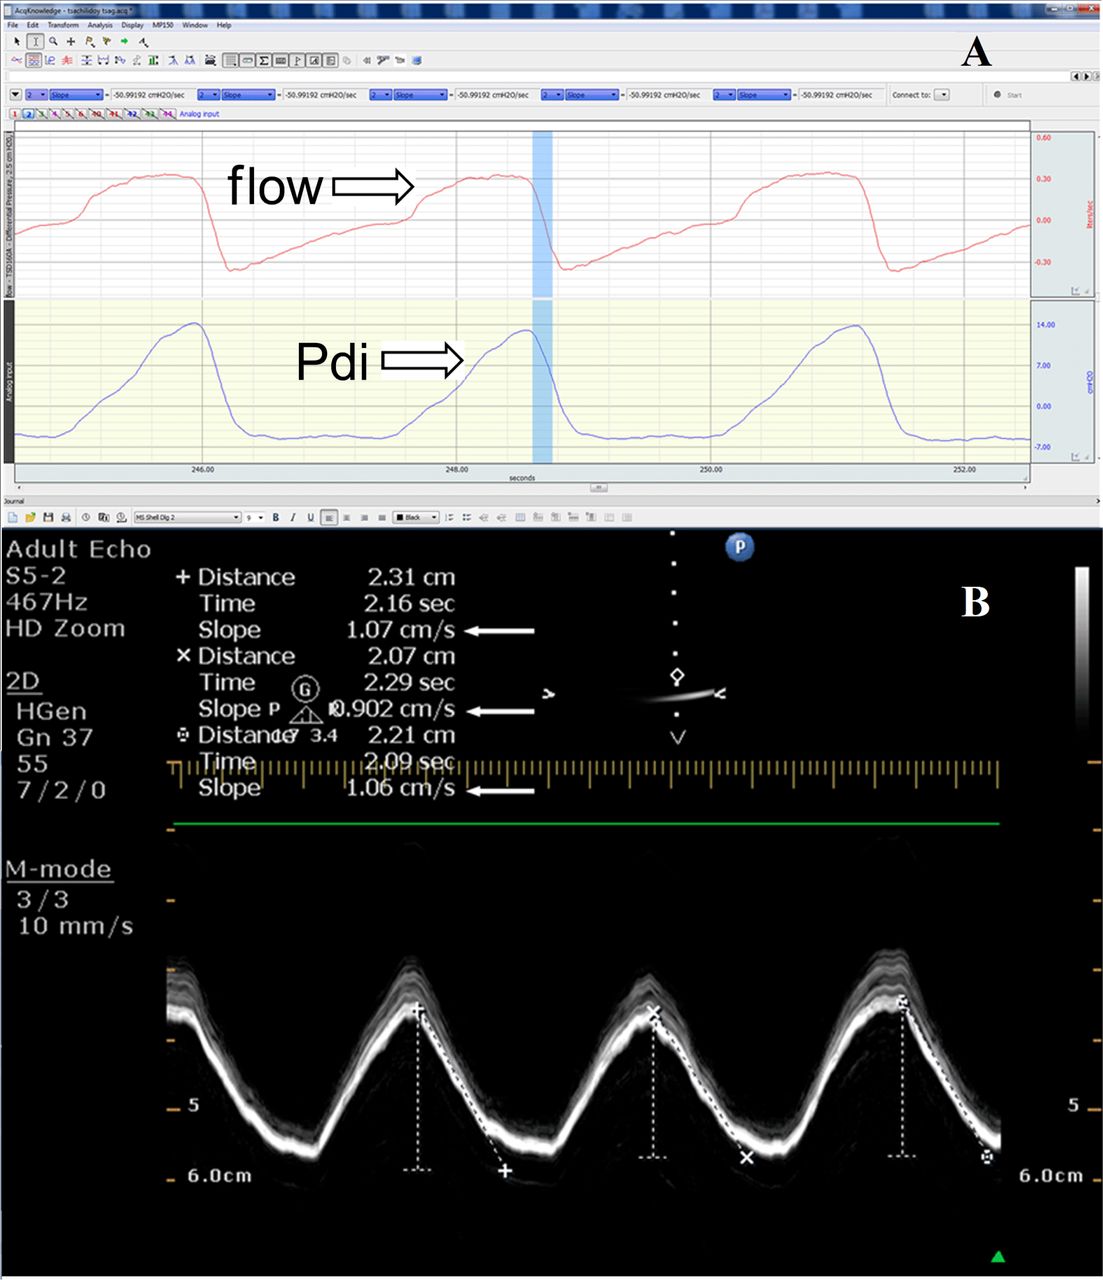
(A) Measurement of MRR from the Pdi curve; the steepest part of the curve during relaxation is considered. In the picture the flow and Pdi curve are presented. The value of MRR is −50.99 cmH2O/s. (B) Measurement of the MRR from the diaphragmatic displacement; the steepest part of the diaphragmatic displacement during relaxation is indicated as slope. The value for the first breath is 1.07 cm/s, for the second breath 0.90 cm/s and for the third breath is 1.06 cm/s (white arrows). Pdi, transdiaphragmatic pressure; MRR, maximal relaxation rate.
Ultrasonographic measurements
Ultrasonography was performed using a Philips HD 15 ultrasound system (Philips, Rochester, New York, USA) according to the previously described technique.16 Briefly, a 3.5 MHz probe was placed below the right costal margin in the midclavicular line, so that the ultrasound beam reached perpendicularly the posterior third of the right hemidiaphragm. M-mode was then used to display the diaphragmatic displacement, speed and duration of motion of the selected part of the right hemidiaphragm.
MRR obtained with ultrasonography (ECHO-MRR)
The sonographic expression of MRR was defined as the slope of the initial steepest descending part of the M-mode diaphragmatic displacement waveform during expiration; these measurements were performed by placing the callipers in the selected initial steepest part of the declining displacement waveform (figure 2B). The slope obtained from the diaphragmatic displacement waveform is the ratio of distance over time and it is measured by the ultrasound machine software in cm/s; as the measurements are performed in the descending part of the displacement waveform, they involve the relaxation part of diaphragmatic motion giving a direct estimate of the rate of the diaphragmatic relaxation.
Study protocol
All measurements were performed with the patients in the semi-recumbent position. Recordings of diaphragmatic displacement simultaneously with Pes and Pdi performed while the patients were breathing spontaneously on PSV 0 and 0 PEEP, or while performing a sniff-like test in the same conditions. As intubated patients cannot sniff naturally because their upper airway is bypassed by the endotracheal tube, we momentarily occlude flow by pressing the end-expiratory hold button, allowing the patient to generate a ‘sniff-like’ inspiratory waveform, without the need for the patient to be fully cooperative for that specific purpose.
Therefore, according to the protocol, four sets of simultaneous measurements were obtained: (1) simultaneous measurement of Pdi and diaphragmatic displacement while breathing spontaneously and (2) while performing a sniff-like manoeuvre, (3) simultaneous measurement of Pes and diaphragmatic displacement while breathing spontaneously and (4) while performing a sniff- like manoeuvre. From these data sets, comparisons were obtained between values of Pdi and diaphragmatic displacement, Pes and diaphragmatic displacement, and, finally, between the MRR obtained from the Pdi curve and the sonography MRR obtained from the diaphragmatic displacement relaxation slope (figure 2).
In no case during the study protocol, had the protocol been terminated because of patient complaints of shortness of breath or requested reventilation.
Patient and public involvement
Intensive care patients undergoing ventilator weaning procedures were recruited. The research question and predicted outcome of the study was thoroughly explained to them or their next of kin and informed consent was obtained, before inclusion in the study. Information regarding the results will be provided to the participants or their relatives through personal communication. Patients and the public were not involved in the design, the recruitement or the conduct of the study.
Statistical analysis
Recorded variables are presented as means±SD. Comparison of repeated measurements in normal breathing and under sniff like manoeuvres was tested with Wilcoxon signed-rank test, while the correlation between independent variables was tested with Spearman’s r correlation coefficient (rs); respective scatterplots were provided in (figures 3–5). The estimated statistical power for a sample size of over 200 breaths for each condition was almost 0.99 (given a large effect size of 0.6 and α error set to 0.05).

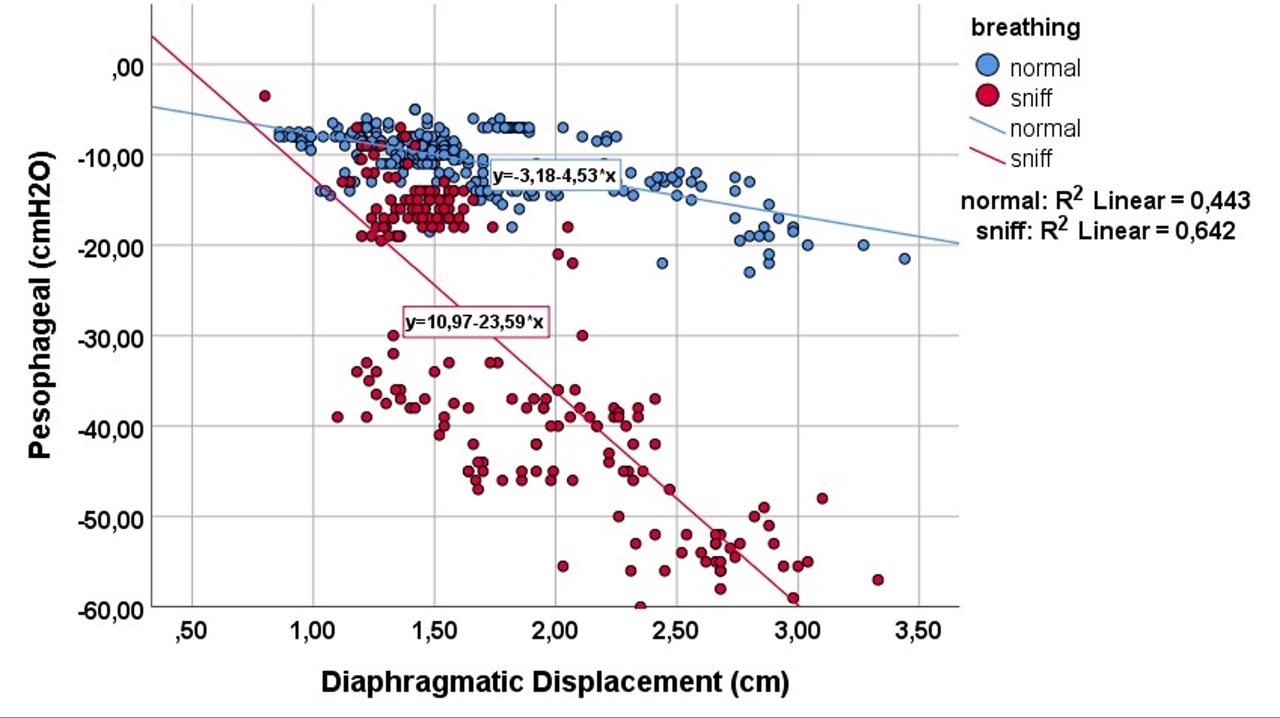
Correlation between peak diaphragmatic displacement and peak oesophageal pressure during quiet breathing (blue dots) and while performing a sniff-like manoeuvre (red dots).
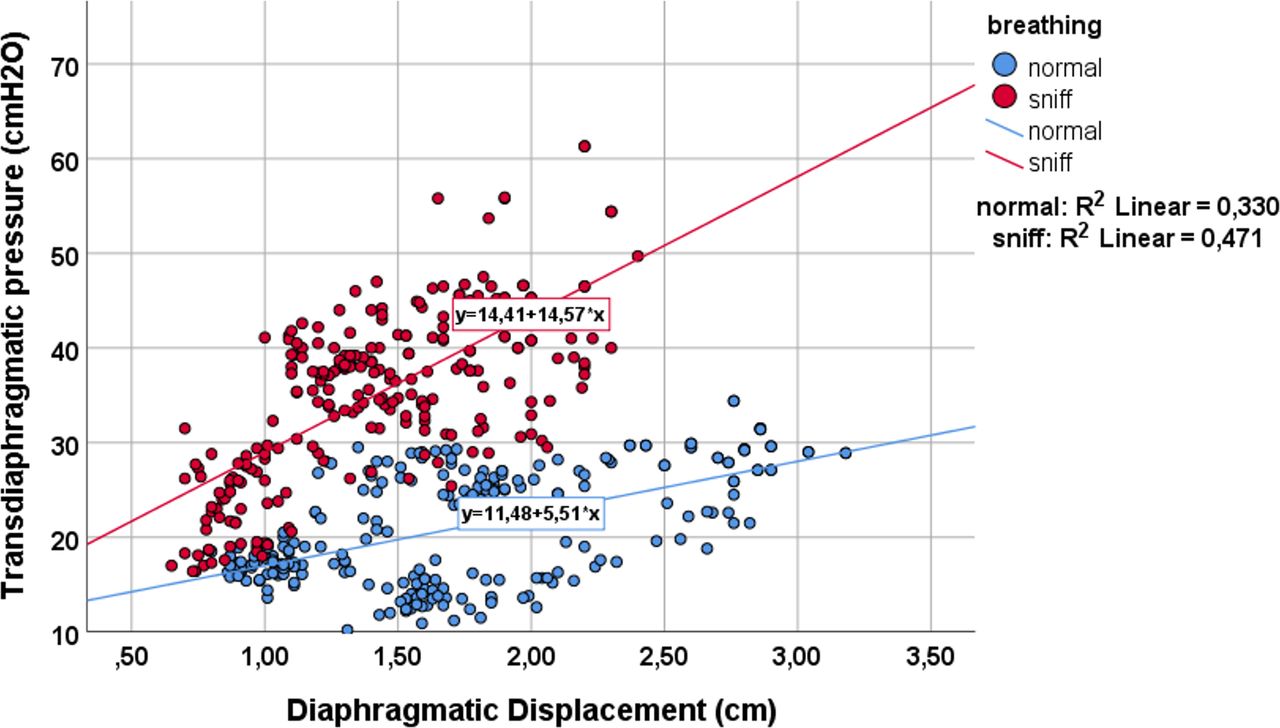
Correlation between peak diaphragmatic displacement and peak transdiaphragmatic pressure during quiet breathing (blue dots) and while performing a sniff-like manoeuvre (red dots).
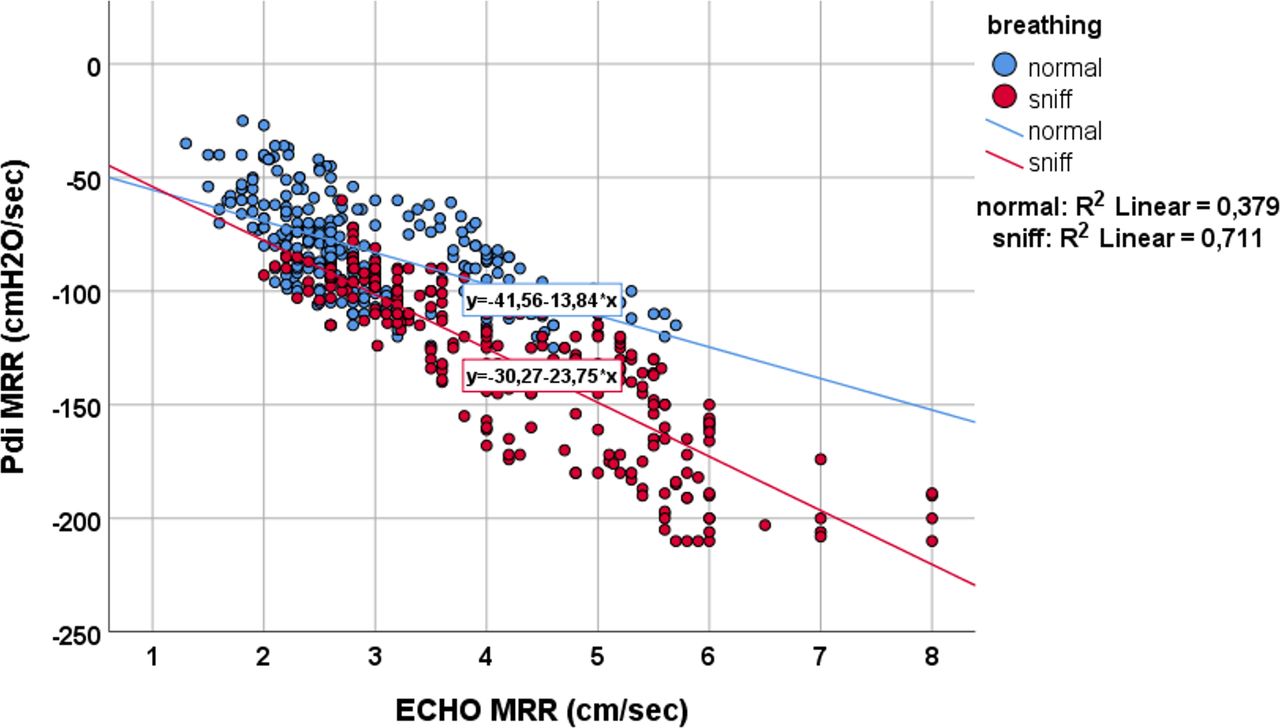
Correlation between MRR measured from Pdi and diaphragmatic displacement during quiet breathing (blue dots) and during sniff-like manoeuvre (red dots). Pdi, transdiaphragmatic pressure; MRR, maximal relaxation rate.
All statistical analyses were performed with SPSS V.26.0 (IBM Statistics), and p values were considered statistically significant at the 0.05 level.
Results
Study population
Fourteen consecutive ICU patients (nine males and five females) with a mean age of 67±11 years were included in the study. The reason for ICU admission was: acute respiratory failure for eight patients, septic shock for four and multiple trauma for the remaining two patients. Among these 14 patients, 11 succeeded the weaning trial and three failed while sharing, in total, 12.5±10 days under mechanical ventilation (minimum four and maximum 35 days).
Measurements of the study protocol
Over 200 breaths, under each condition, were assessed. Measurement values of diaphragmatic displacement (in cm), Pes and Pdi (in cmH2O), as well as Pdi-MRR (in cmH2O/s) and ECHO-MRR (in cm/s), all both during normal breathing and the sniff-like manoeuvre, are provided in table 1. Statistically significant differences were found between normal breathing and sniff-like manoeuvres in all measured parameters (Wilcoxon signed-rank test, p≤0.01).
Measurements of different pressures, diaphragmatic displacement and maximal relaxation rate in different conditions
During the sniff-like manoeuvre, diaphragmatic displacement, Pes and Pdi-MRR significantly decreased, whereas Pdi and ECHO-MRR increased significantly (table 1). Diaphragmatic displacement was significantly correlated with both Pes (rs=−0.04, p<0.001) and Pdi (rs=0.5, p<0.001), and this correlation further improved during the sniff-like manoeuvre (figures 3 and 4). Finally, a statistically significant correlation was found between the MRR measured from the Pdi slope and MRR derived from the ECHO (rs=−0.65, p<0.001). This relationship remained during the sniff manoeuvre (rs=−0.87, p<0.001) (figure 5).
Discussion
The motivation for undertaking this study was the striking similarities between the shape and magnitude of the simultaneously recorded Pdi or Pes and M-mode diaphragmatic displacement waveforms (figure 1). A question arises why the tracings obtained with the pressure transducer and the tracing of the diaphragmatic displacement, obtained with the ECHO, show a similar configuration. Pdi and Pes are the consequence of the respiratory muscles’ contraction and relaxation. As we can see in figure 1A,C, Pes and Pdi start, peak and end simultaneously with diaphragmatic displacement. Furthermore, in figure 1B we can see that Pes and diaphragmatic displacement are identical in shape even in the smallest details! Additionally, we can easily understand that the higher the respiratory muscles’ diaphragmatic contraction documented by a higher diaphragmatic displacement, the higher the increase in Pdi and decrease in Pes. In fact, our study provides and compares the values of these three respiratory variables during normal breathing and sniff-like manoeuvres. Diaphragmatic displacement decreased significantly during sniff (from 1.64 and 1.7cm to 1.4 cm), while Pdi increased (from 21±5.8 to 35±8.9) and Pes decreased (from −10.6±3.4 to -31.4±15). The large decrease in Pes during sniff, despite a decrease in diaphragmatic displacement, took place because the respiratory muscles -including the diaphragm- exert a vacuum effect on the thoracic cavity consequent to airway occlusion. Conversely, as the diaphragmatic displacement decreased during sniff, thus not contributing to the increase in gastric pressure, the increase in Pdi may be exclusively attributed to Pes contribution.
As we can see in figures 3 and 4, while breathing unobstructed, each cm of diaphragmatic displacement produces 5.5 cmH2O of pressure in Pdi and −4.5 cmH2O in Pes. Additionally, performing a sniff, each cm of diaphragmatic displacement produces much more Pdi and Pes (14.5 cmH2O and −22 cmH2O, respectively). However, the Δ pressure of Pdi (9 cmH2O) from breathing unobstructed to sniff, is less compared with Δ Pes (−17.5 cmH2O), indicating the absence of diaphragmatic displacement contribution, as a pressure generator to the Pdi. It is interesting to notice that the significant relationship between diaphragmatic displacement, Pes and Pdi is further improved during the sniff. This improvement is probably due to the increased values of pressure produced during a sniff. When we perform statistics with small values, like those of Pes and Pdi pressure during quiet breathing, it is difficult to obtain statistical significance, risking a type one or alpha-statistical error (the statistical significance, although it exists, cannot be found).
A strong correlation has been found between the slope of the relaxation-descending part of the M-mode diaphragmatic displacement waveform and the slope of the Pdi curve during relaxation, over a wide range of Pdi and during two different respiratory conditions, spontaneous breathing, and sniff (figure 5). Diaphragmatic relaxation is of extreme physiological importance since it is associated with rapid adaptation to changes in respiratory load and breathing frequency.17 Earlier studies using simultaneous diaphragmatic EMG and Pdi recordings have shown that EMG activity of the diaphragm ceases at peak Pdi,18 therefore, the initial rapid change in the slope of the Pdi curve is thought to represent the maximal rate of diaphragmatic relaxation. A slowing of the relaxation rate of the inspiratory muscles has been shown to occur well before the development of fatigue, which implies that a formal analysis of diaphragmatic relaxation may predict the fate of an ongoing weaning trial before an endpoint of respiratory failure is reached.
In this study, we assumed that diaphragmatic muscle relaxation rate could be also measured from the initial steepest part of the diaphragmatic displacement waveform, and a good relationship with the MRR derived from the Pdi waveform is determined. With regard to the M-mode diaphragmatic displacement waveform, previous studies that used spirometry concomitantly with diaphragmatic M-mode sonography, have shown no differences in expiratory time measured with either method,19 implying that the peak diaphragmatic excursion coincides with the beginning of the diaphragmatic relaxation phase; sonography provides a direct assessment of the actual velocity of motion of the diaphragmatic muscle, whereas in all previous studies20 it was assumed that changes in pressure curves demonstrated changes in relaxation rate. However, there is evidence to support that the decay of pleural (or Pes) pressure ends before the crural and costal diaphragmatic parts return to their initial conditions of length and tension20 21; in such case, these pressure swings recorded during relaxation may not totally coincide with diaphragmatic relaxation time, whereas the sonographic method will correctly demonstrate the whole duration of relaxation time and, subsequently, the right period of time for the relaxation rate to be determined.
Although diaphragmatic MRR appears in many studies as an attractive method to detect diaphragmatic fatigue and predict weaning failure, it has not won widespread acceptance as a way of monitoring patients during weaning in clinical practice. This may be due to the practical difficulties in recording easily, accurately and repeatedly, bedside, the slope of the MRR from the Pdi curve. Moreover, the reproducibility of the Pdi curve has never been evaluated, possibly for ethical reasons. Therefore, we believe that it is worthy to evaluate the sonographic equivalent of MRR in larger studies.
There are some limitations to our study. A limited number of patients were studied, however, a significant number of breaths per patient and conditions were analysed, more than 200 hundred breaths in pairs in total, that yielded a statistical significant correlation at p<0.05 level. Moreover, interobserver and intraobserver variability was not measured, however, the high reproducibility and the low interobserver and intraobserver variability of the M-mode diaphragmatic displacement was demonstrated in many studies.6–8 Furthermore, diaphragmatic motion can be affected by respiratory mechanics, abdominal compliance, rib cage or abdominal muscle activity, possibly influencing the relationship between diaphragm displacement and Pes or Pdi in a different set of patients.
Conclusions
In conclusion, in this study, we demonstrated a direct relationship between the magnitude of diaphragmatic displacement and the magnitude of Pes and Pdi. We calculated the velocity of diaphragmatic maximum relaxation using the M-mode diaphragmatic displacement recording. This new sonographic variable correlates well with the MRR obtained from Pdi recordings. Sonography seems to offer an alternative, easy to perform method for calculating the diaphragmatic MRR. Clinical studies are needed to evaluate if ECHO-MRR is a useful, non-invasive, highly reproducible method for assessing weaning failure due to diaphragmatic fatigue.
Data availability statement
The study data are not publicly available as per an agreement with the data custodian.
Ethics statements
Patient consent for publication
Ethics approval
The study protocol was approved by the Research and Ethics Committee of the Papageorgiou General Hospital (No 251 20/04/2016) and a written consent was obtained from the patients or their surrogates.
Acknowledgments
We thank the patients that participated in the study, their families and their advisers.
References
Footnotes
Contributors All authors contributed equally to the study conduct and preparation of the manuscript: EK, ES and PS performed study measurements and collected all relevant data; EK, MT, IP and DM shared the original idea for the study; SS and DM performed data analysis; all authors jointly wrote the first draft, participated in the reviewing of the manuscript and contributed to the final version to be submitted.
Funding The authors have not declared a specific grant for this research from any funding agency in the public, commercial or not-for-profit sectors.
Competing interests None declared.
Patient and public involvement Patients and/or the public were not involved in the design, or conduct, or reporting, or dissemination plans of this research.
Provenance and peer review Not commissioned; externally peer reviewed.