Article

Depth-Dependent C-N-P Stocks and Stoichiometry in Ultisols Resulting from Conversion of Secondary Forests to Plantations and Driving Forces

1
Guangdong Academy of Forestry, Guangzhou 510520, China
2
College of Forestry, Guangxi University, Nanning 530004, China
3
Key Laboratory of Wetland Ecology and Environment, Northeast Institute of Geography and Agroecology, Chinese Academy of Sciences, Changchun 130102, China
4
University of Chinese Academy of Sciences, Beijing 100049, China
*
Authors to whom correspondence should be addressed.
Forests 2021, 12(10), 1300; https://doi.org/10.3390/f12101300
Submission received: 18 August 2021 / Revised: 18 September 2021 / Accepted: 21 September 2021 / Published: 24 September 2021
(This article belongs to the Section Forest Soil)

Abstract

:
Stocks and stoichiometry of carbon (C), nitrogen (N), and phosphorus (P) in ultisols are not well documented for converted forests. In this study, Ultisols were sampled in 175 plots from one type of secondary forest and four plantations of Masson pine (Pinus massoniana Lamb.), Slash pine (Pinus elliottii Engelm.), Eucalypt (Eucalyptus obliqua L’Hér.), and Litchi (Litchi chinensis Sonn., 1782) in Yunfu, Guangdong province, South China. Five layers of soil were sampled with a distance of 20 cm between two adjacent layers up to a depth of 100 cm. We did not find interactive effects between forest type and soil layer depth on soil organic carbon (SOC), total nitrogen (TN), and total phosphorus (TP) concentrations and storages. Storage of SOC was not different between secondary forests and Eucalypt plantations, but SOC of these two forest types were lower than that in Litchi, Masson pine, and Slash pine plantations. Soil C:P was higher in Slash pine plantations than in secondary forests. Soil CNP showed a decreasing trend with the increase of soil depth. Soil TP did not show any significant difference among soil layers. Soil bulk density had a negative contribution to soil C and P stocks, and longitude and elevation were positive drivers for soil C, N, and P stocks. Overall, Litchi plantations are the only type of plantation that obtained enhanced C storage in 0–100 cm soils and diverse N concentrations among soil layers during the conversion from secondary forests to plantations over ultisols.

1. Introduction

The pedosphere reserves the largest carbon (C) sink in terrestrial ecosystem, which contributes to its important role of C sequestration [1,2]. Carbon storage in soils is greater than that in vegetation biomass and atmospheric reservoir combined [3]. Tropical forests locate on the front of the climate curve to balance atmospheric CO2 concentration. About 30% of global soil C stocks are sequestered in tropical forests [4]. About half of the total C in tropical forests are stored in the upper soils above a depth of 100 cm [5]. Net primary productivity (NPP) in tropical forests has been estimated to be 1.3 × 10⁹ t C yr−1 [6,7], which is about 40% of the global terrestrial level [8]. Soils in tropical forests also account for the highest C turnover rate [9]. Together, these lead to the uncertainty in estimating C storage levels in tropical forest soils.
Soil nitrogen (N) and phosphorus (P) availabilities strongly influence primary production and C accumulation. Both N and P reserves have a close relationship with C pools in terrestrial biogeochemical cycles [10]. Soil CNP stoichiometry is a remarkable indicator of soil quality, organic composition, C storage, and C sequestration in forest ecosystems [3,11]. The C:N explains more than 99% of variations in soil dissolved organic C stock due to its negative relationship with decomposition of soil organic matters [3]. Nitrogen plays a central role in ecosystem productivity and C sequestration [12]. Globally, surface soil N stocks are estimated to be 133–140 Pg totally for the upper 100-cm and soil C:N are estimated to range from less than 10.0 in Aridisols to over 25.0 in Histosols [13] with a mean ratio of 10.0 [14]. Unlike N, P does not have a gaseous phase. Rock weathering is the primary source of P in terrestrial ecosystems [15,16]. Phosphorus is particularly important in the tropics because P is adsorbed by oxides and clay minerals which renders P unavailable to plants [17]. Soil N:P is usually used as an indicator of N-P saturation and relative limitation [18]. Relative to C:N and N:P, less is known about C:P in soil. High C:P may indicate a low microbial diversity and resource quality [19]. There is a lack of attention on the quantification of CNP stoichiometry in tropical forest soils compared to that in other forest ecosystems.
Extensive areas of native forests are being converted into short-rotation plantations to meet increasing demand for timber production [20,21]. Globally, secondary forests are increasingly being converted into plantations, which interrupt soil ecosystems by reducing SOC and lowering nutrient availability [22]. Conversion of tropical secondary forests may drastically impact soil CNP stoichiometry. In the natural forests of Singapore, soil C stock in secondary forests increased to 52% from 33% [23]. In Brazil, C and N content in soils were lower in pasture compared to native vegetation stands while P content was higher, which resulted in a higher C:N but a lower C:P [17]. Even so, current understanding is still limited by three types of information. Specific response of soil CNP stoichiometry has been limited to conversion from secondary forests to a narrow range of plantation types at a regional scale. Depth-dependent change in soil stoichiometry has not received attention regarding specific tropical forest soil types. Topological factors that contribute to soil stoichiometry have not been well documented for tropical forests. As one of main factors that form soil CNP stoichiometry [22], conversion of forest types deserves more attention to further explore changes in soil physicochemical properties.
Ultisols (from Latin ultimus that means ‘last’) are a type of forest soil that is mainly found in humid tropical areas of the world. Ultisols account for 8.4% of all soil types in worldwide [24,25]. Ultisols have low fertility but a strong ability to leach primary minerals, such as calcium, magnesium, and potassium [25]. Ultisols have a subsurface layer where clays heavily accumulate with an abundant presence of reddish to maroon colored oxidative iron. Therefore, ultisols are recognized as “red clay” in tropical forested lands, such as Amazon Basin, Indonesia, southeastern United States, southern China [25,26,27,28]. Because of favorable climate, ultisols usually support productive forests [25]. Prime forests on ultisols have suffered intensive harvests and urbanization. As a result, prime forests are being replaced by secondary forests which are further converted to plantations. Forested Ultisols had greater soil C due to continuous C concentration increase in aggregate [29]. Soil C storage and relevant CNP stoichiometry in successional forests on ultisols are generally unknown.
Soil CNP stoichiometry can vary as a response to different soil depths in broadleaf forests [30]. Depth-dependent attributes have also been documented for texture in ultisols [31]. Forest type and soil depth have an interactive effect on soil stoichiometry during land conversion in subtropical forests [32] and Loess Plateau regions [33]. In this study, CNP stoichiometry was investigated at different soil depths in a secondary forest and four types of plantations in tropical forests on the western mountains of South China. Soils were sampled in a total of 175 plots across five forest types, including a secondary forest and four plantations. Topographical and soil physiochemical properties were also investigated in plots for regression analysis to detect the driving forces that form soil stoichiometry. Our objective was to assess reserves of soil C, N, and P at different depths and to detect their differences, among different forest types, in response to an expected interaction. We hypothesized that, compared to the secondary forest, (i) plantations will have a higher soil C:N in accordance with decreased C storage; and (ii) plantations will have lowered soil N:P and C:P, and decreased P concentration.

2. Materials and Methods

2.1. Study Site

This study was carried out in Yunfu (latitude: 22°20′‒22°59′ N, longitude: 111°03′‒112°31′ E), located west of Guangdong province, South China. Regional area is 7785 km2 and 63% (4915 km2) was forested. The study area is in a subtropical monsoon zone with an annual accumulated temperature between 4500–8000 °C and an average temperature of 0–15 °C during the coldest month. Annual rainfall is 1670 mm and the irradiation period is 1684 h [34,35]. Topography in Yunfu is high in the southwest and low in the northeast, in which mountainous and hilly lands accounted for 61% and 31% of the total area, respectively. Natural secondary forest types include evergreen broad-leaved forests, coniferous forests, and mixed coniferous and evergreen-broad leaved forests [31]. Under the impact of anthropogenic activities, some secondary forests have been converted to mixed forests [36]. For example, other broadleaf species were introduced into some tropical native broadleaf forests in Ultisols at Guangdong. In addition, our secondary forests have also been converted to plantations, such as Masson pine (Pinus massoniana Lamb.), Slash pine (Pinus elliottii Engelm.), Eucalypt (Eucalyptus obliqua L’Hér.), and Litchi (Litchi chinensis Sonn., 1782) [34,37,38]. Masson pine accounts for one of the largest industrial productions of timber and resin. Eucalypt is a widely planted forest type that accounts for the largest production of timber. Slash pine has been a successfully introduced species that dwell in increasing forested lands that were converted into plantations. Litchi is one of the most important industrial plantations that produce fruits. The most common ultisols in Yunfu include Typic Kanhapludults (Lateritic Red Earths) and Typic Hapludults (Red Earths), which together account for 86% of forested lands in Yunfu [31].

2.2. Soil Sampling

A total of 35 sites were set as stands for soil sampling with seven for secondary forest, 10 for Masson pine, 6 for slash pine, 6 for eucalypt, and 6 for litchi (Figure 1). Specific structure for the five types of forests can be seen in Table S1. Five 20 m × 20 m plots were laid out for one forest type with every two plots being located at least 50 m from each other. A total of 175 plots were placed for soil sampling. Five soil profiles from each plot were excavated to 1 m-depth. Soil profiles were divided into five depths of 0–20 cm, 20–40 cm, 40–60 cm, 60–80 cm, and 80–100 cm. Soils samples were collected from each depth of a profile and mixed at the same depth for a plot. Soil bulk density (BD) was measured using the cutting ring method at each depth of soil profiles. Plant roots, soil animals, and stones were removed from collected soil samples. Subsequently, soil samples were transported to the laboratory where they were air-dried and sieved through 0.25 mm to ensure evenness and uniformity.

2.3. Chemical Analysis

Soil organic carbon (SOC), total N (TN), and total P (TP) concentrations were measured for samples at 0–20 cm, 20–40 cm, 40–60 cm, 60–80 cm, and 80–100 cm depths separately. The concentration of SOC was determined by the dichromate heating oxidation method [39]. The concentration of TN was determined by the classic Kjeldahl method [40]. The concentration of TP was determined by the molybdenum blue colorimetric method [41]. Soil pH was measured using a pH meter.

2.4. Calculation of Stocks

Soil stocks (Mg ha−1) for SOC (SOCstock), TN (TNstock), and TP (TPstock) were calculated as follows [42]:
SOCstock = SOC × BD × D/10,
TNstock = TN × BD × D/10,
TPstock = TP × BD × D/10,
where BD is the soil bulk density (g cm−3) for the ith layer of soil profile and D is the depth (cm) of the ith layer of soil. In this study, the variable i stands for any layer from the 5 possible layers in depths of 0–20 cm, 20–40 cm, 40–60 cm, 60–80 cm, and 80–100 cm. Therefore, D is always a multiple of 20 (cm) corresponding to the ith layer.

2.5. Statistical Analysis

All statistics were analyzed using SAS software (ver. 9.4.0, SAS Institute, Cary, NC, USA). Normality and homogeneity of variance were tested for all observed variables and log-transformed data were used when necessary. Analysis of variance (ANOVA) was used to detect the effects of variation from forest type (degree of freedom [df] = 4), soil layer (df = 4), and their interaction (df = 16) on concentration and stocks of C, N, and P and their concentration ratios (C:N, C:P, N:P) in soils. Only when any interactive effects were identified as significant using ANOVA, were results compared by responses to combined forest-type and soil-layer as two fixed factors. Duncan test was used for comparing the uneven numbers of replicated plots among different forest types. Otherwise, the difference of results across forest type and soil layer were compared by paired t-tests when no interaction was indicated by ANOVA. This process detects possible differences by combined factors that two-way ANOVA may fail to find due to accumulated sum of squares. When the main effect was indicated to be significant for either forest type or soil layer, results were compared to detect the difference as a response to either main effect. Significance of difference was defined at the probability of 95% (α = 0.05). To reveal the mechanism that formed CNP stocks by topography and soil properties, stepwise regression was employed to detect combined contributions from longitude, latitude, elevation, slope, soil pH, and soil BD at each of the five depths. Soil stoichiometry was analyzed as dependent variables (responders) and topography and soil property as independent (drivers). Any significant estimate can only be determined in the model when the probability of its contribution was estimated to be higher than 95%.

3. Results

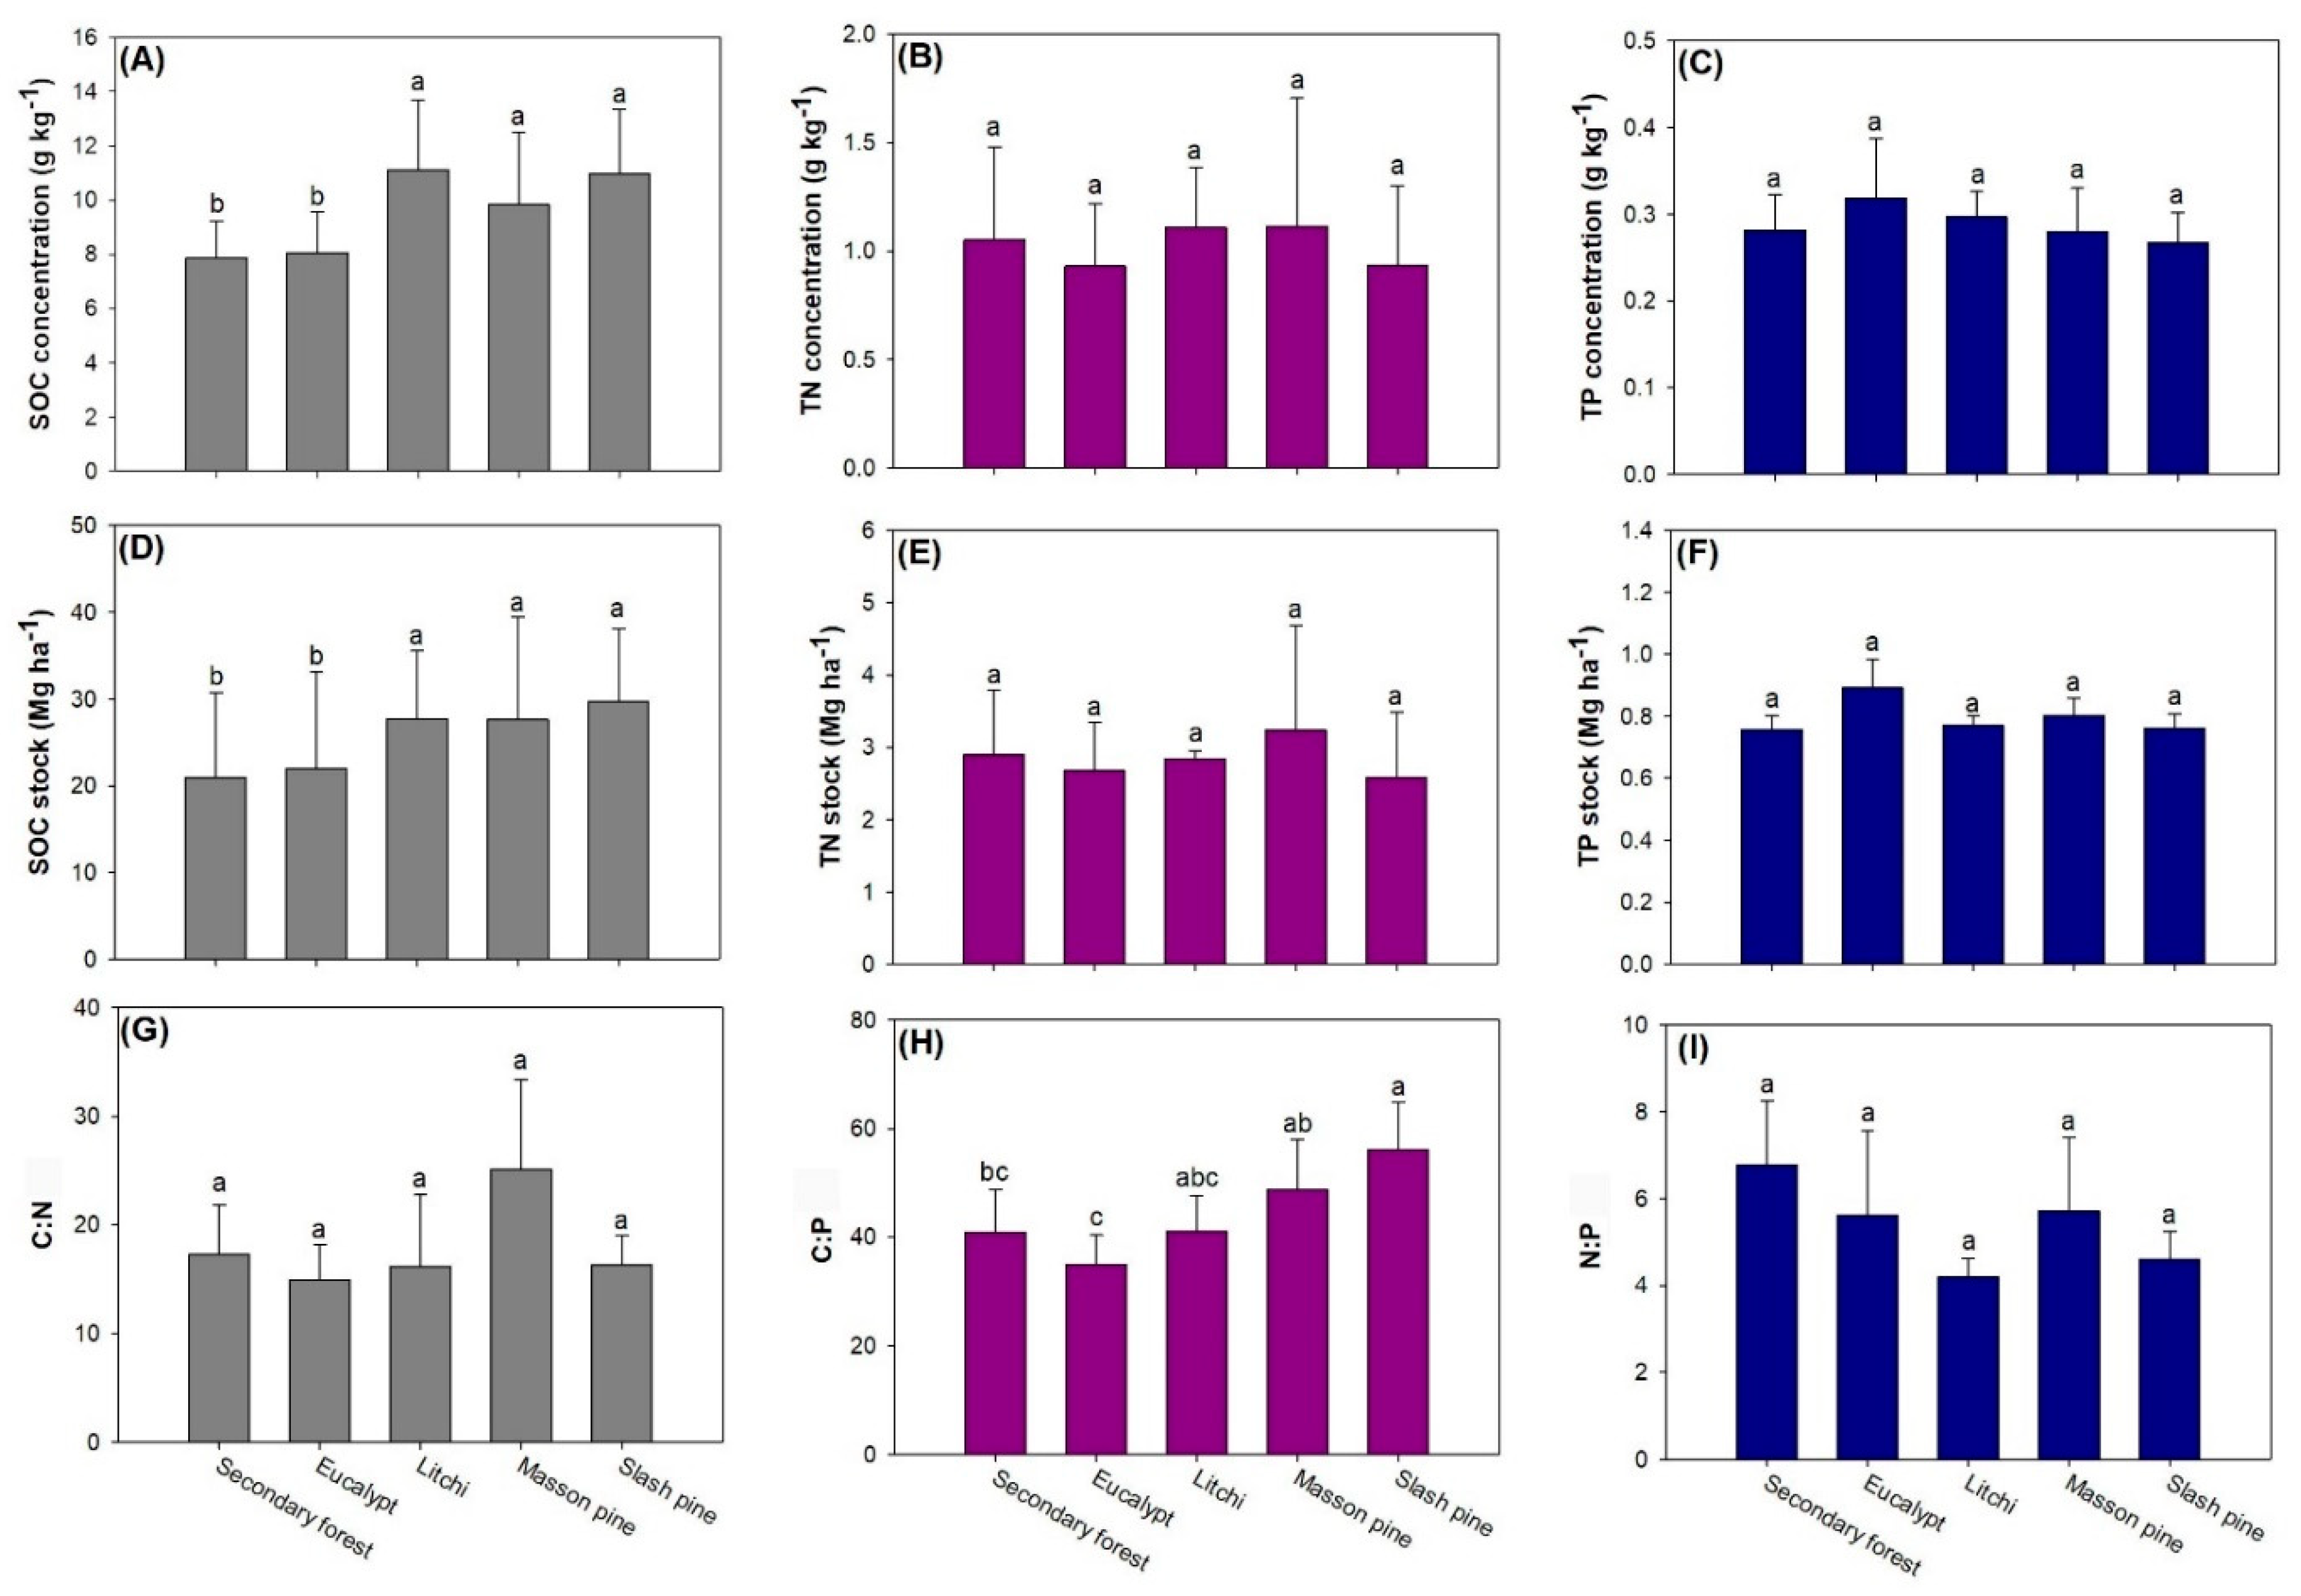
3.1. Difference among Forest Types

Forest type was a source of variation mainly for variables of SOC and soil C:P (Table 1). SOC concentration was higher in Litchi, Masson pine, and Slash pine forests than in the secondary forest (Figure 2A). However, differences in SOC concentration were not significant between Eucalypt forests and secondary forests. Accordingly, SOC stock was also higher in Litchi, Masson pine, and Slash pine forests than in secondary forests (Figure 2D). Among the plantations, only Slash pine forests had higher soil C:P compared to secondary forests (Figure 2H). In addition, soil C:P was also higher in Slash pine and Masson pine forests than in Eucalypt forests.
Soil TN and TP concentrations fell in a range of 0.92 to 1.17 and 0.27 to 0.32, respectively, both of which did not differ among forest types (Figure 2B,C). Averaged soil TN stock ranged between 0.26 Mg ha−1 and 0.32 Mg ha−1 and soil TP stock ranged between 0.75–0.90 Mg ha−1 (Figure 2E,F). Soil C:N ranged between 14.8–25.2 and soil N:P ranged from 4.2 to 6.7 (Figure 2G,I).

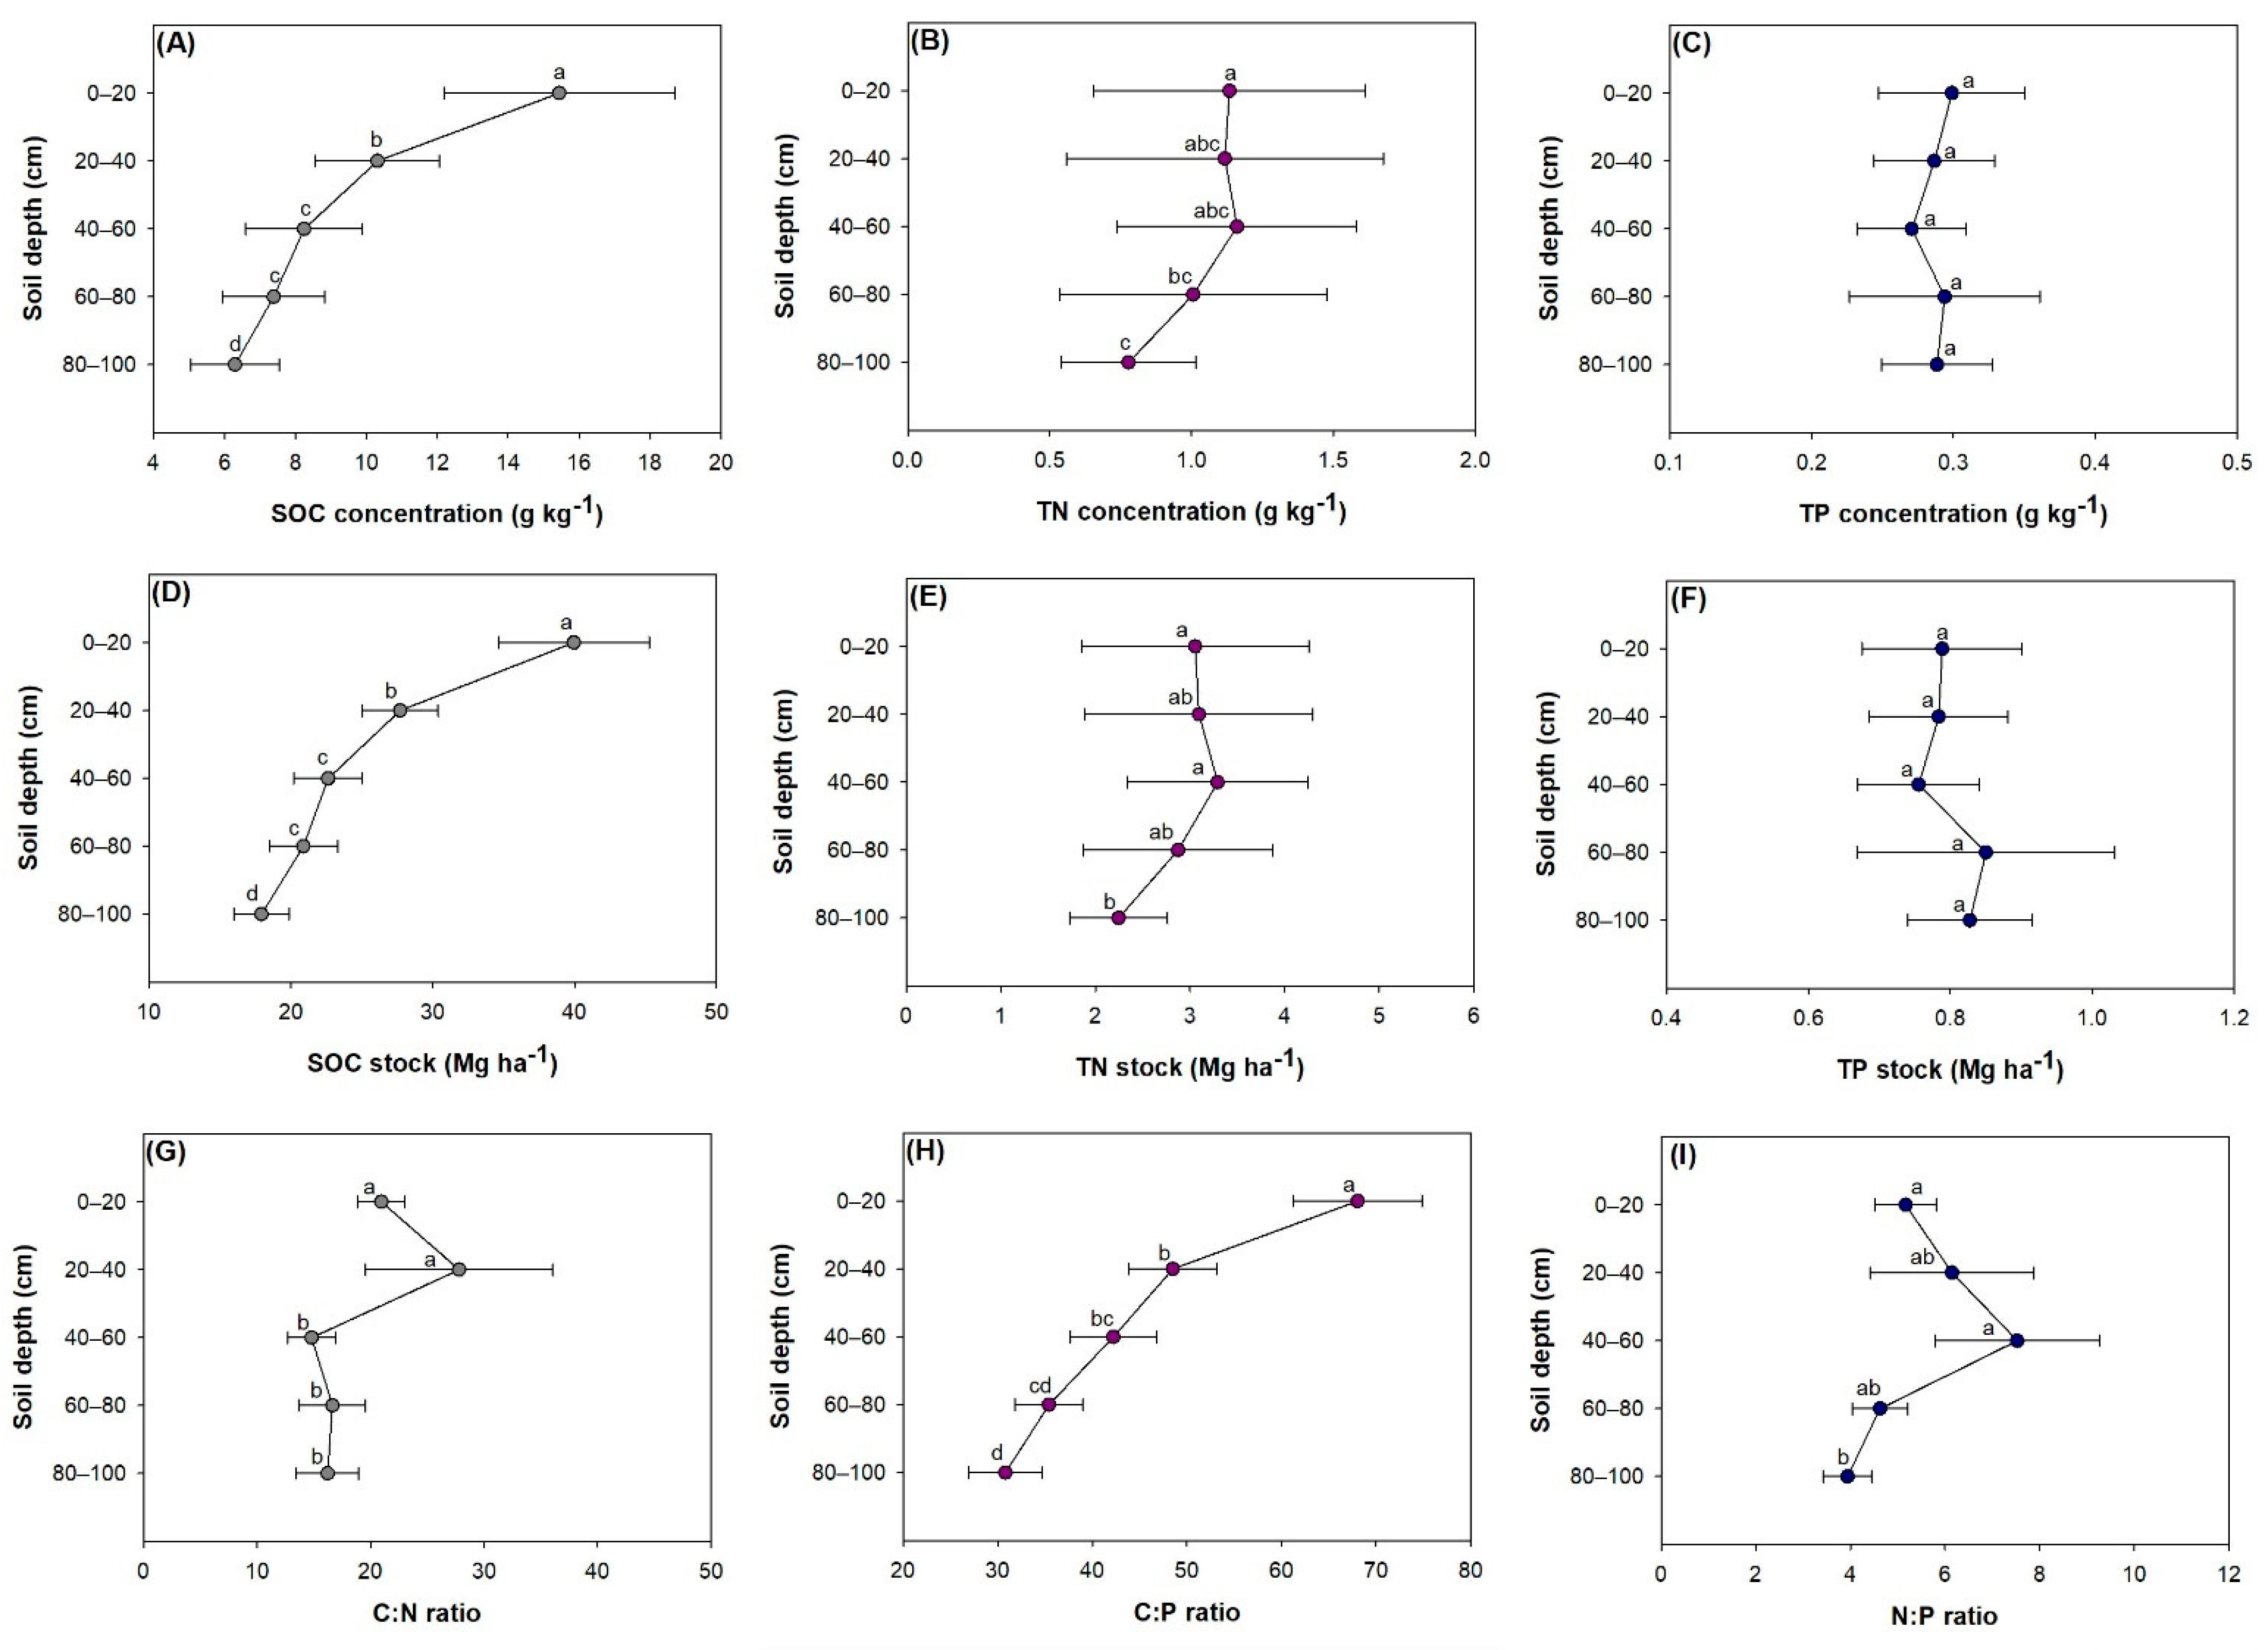
3.2. Variation among Soil Layer Depths

Soil layer significantly affected SOC and TN concentrations and stocks (Table 1). Both SOC concentration and stock showed a decreasing trend with the increase in soil depth (Figure 3A,D). SOC concentration was highest in the surface soil layer (depth of 0–20 cm) and there were no statistically significant differences between layers at depths of 40–60 cm and 60–80 cm (Figure 3A). With the increase of soil depth, TN concentration remained unchanged from surface soil to soil at a depth of 40–60 cm. However, TN concentration was lower in soil at depths from 60 cm to 100 cm than in surface soil (Figure 3B). Soil TN stock remain unchanged from surface soil to soils at a depth of 60–80 cm (Figure 3E). Soil TN stock at 80–100 cm was lower than that at 40–60 cm and 0–20 cm. Soil TP concentration ranged around 0.3 g kg−1 and TP stock ranged around 0.8 Mg ha−1 (Figure 3C,F).
Soil layer also had a significant effect on C:N, C:P, and N:P (Table 1). Soil C:N was higher in soils at depths of 0–20 cm and 20–40 cm than that in deeper soils (Figure 3G). Soil C:P showed a decreased trend with the increase of soil depth (Figure 3H). Soil C:P was highest in surface soil and C:P was lower at 80–100 cm than at 20–40 cm and 40–60 cm. Soil N:P was lower at a depth of 80–100 cm than at 40–60 cm and 0–20 cm (Figure 3I).

3.3. Variation of Concentration along Soil Depths for Different Species

We did not find any interactive effects of forest type and soil layer on soil variables (Table 1), hence results were analyzed by t-tests for soil property concentrations along the depth gradient in different types of plantations (Figure 4). SOC concentration showed a decreasing trend with the increase of soil depth. SOC concentration was higher in surface soil than in deeper soils for most forest types except Eucalypt and Litchi plantations (Figure 4B-1,C-1). There was no difference in SOC concentration at depths of 20–100 cm in secondary forests, but SOC concentration in soil at 80–100 cm was lower than that in soil at 20–40 cm and 40–60 cm in four types of plantations. Soil TN concentration did not show significant difference among soil depths in varied forest types except for that in Litchi plantations (Figure 4C-2). Soil TN concentration at a depth of 60–80 cm was lower than that in soils at shallower depths. However, TN concentration was not statistically different in soils between 60–80 cm and 80–100 cm. Soil TP concentration did not show any significant difference among soil depths for any forest type (Figure 4 right column).

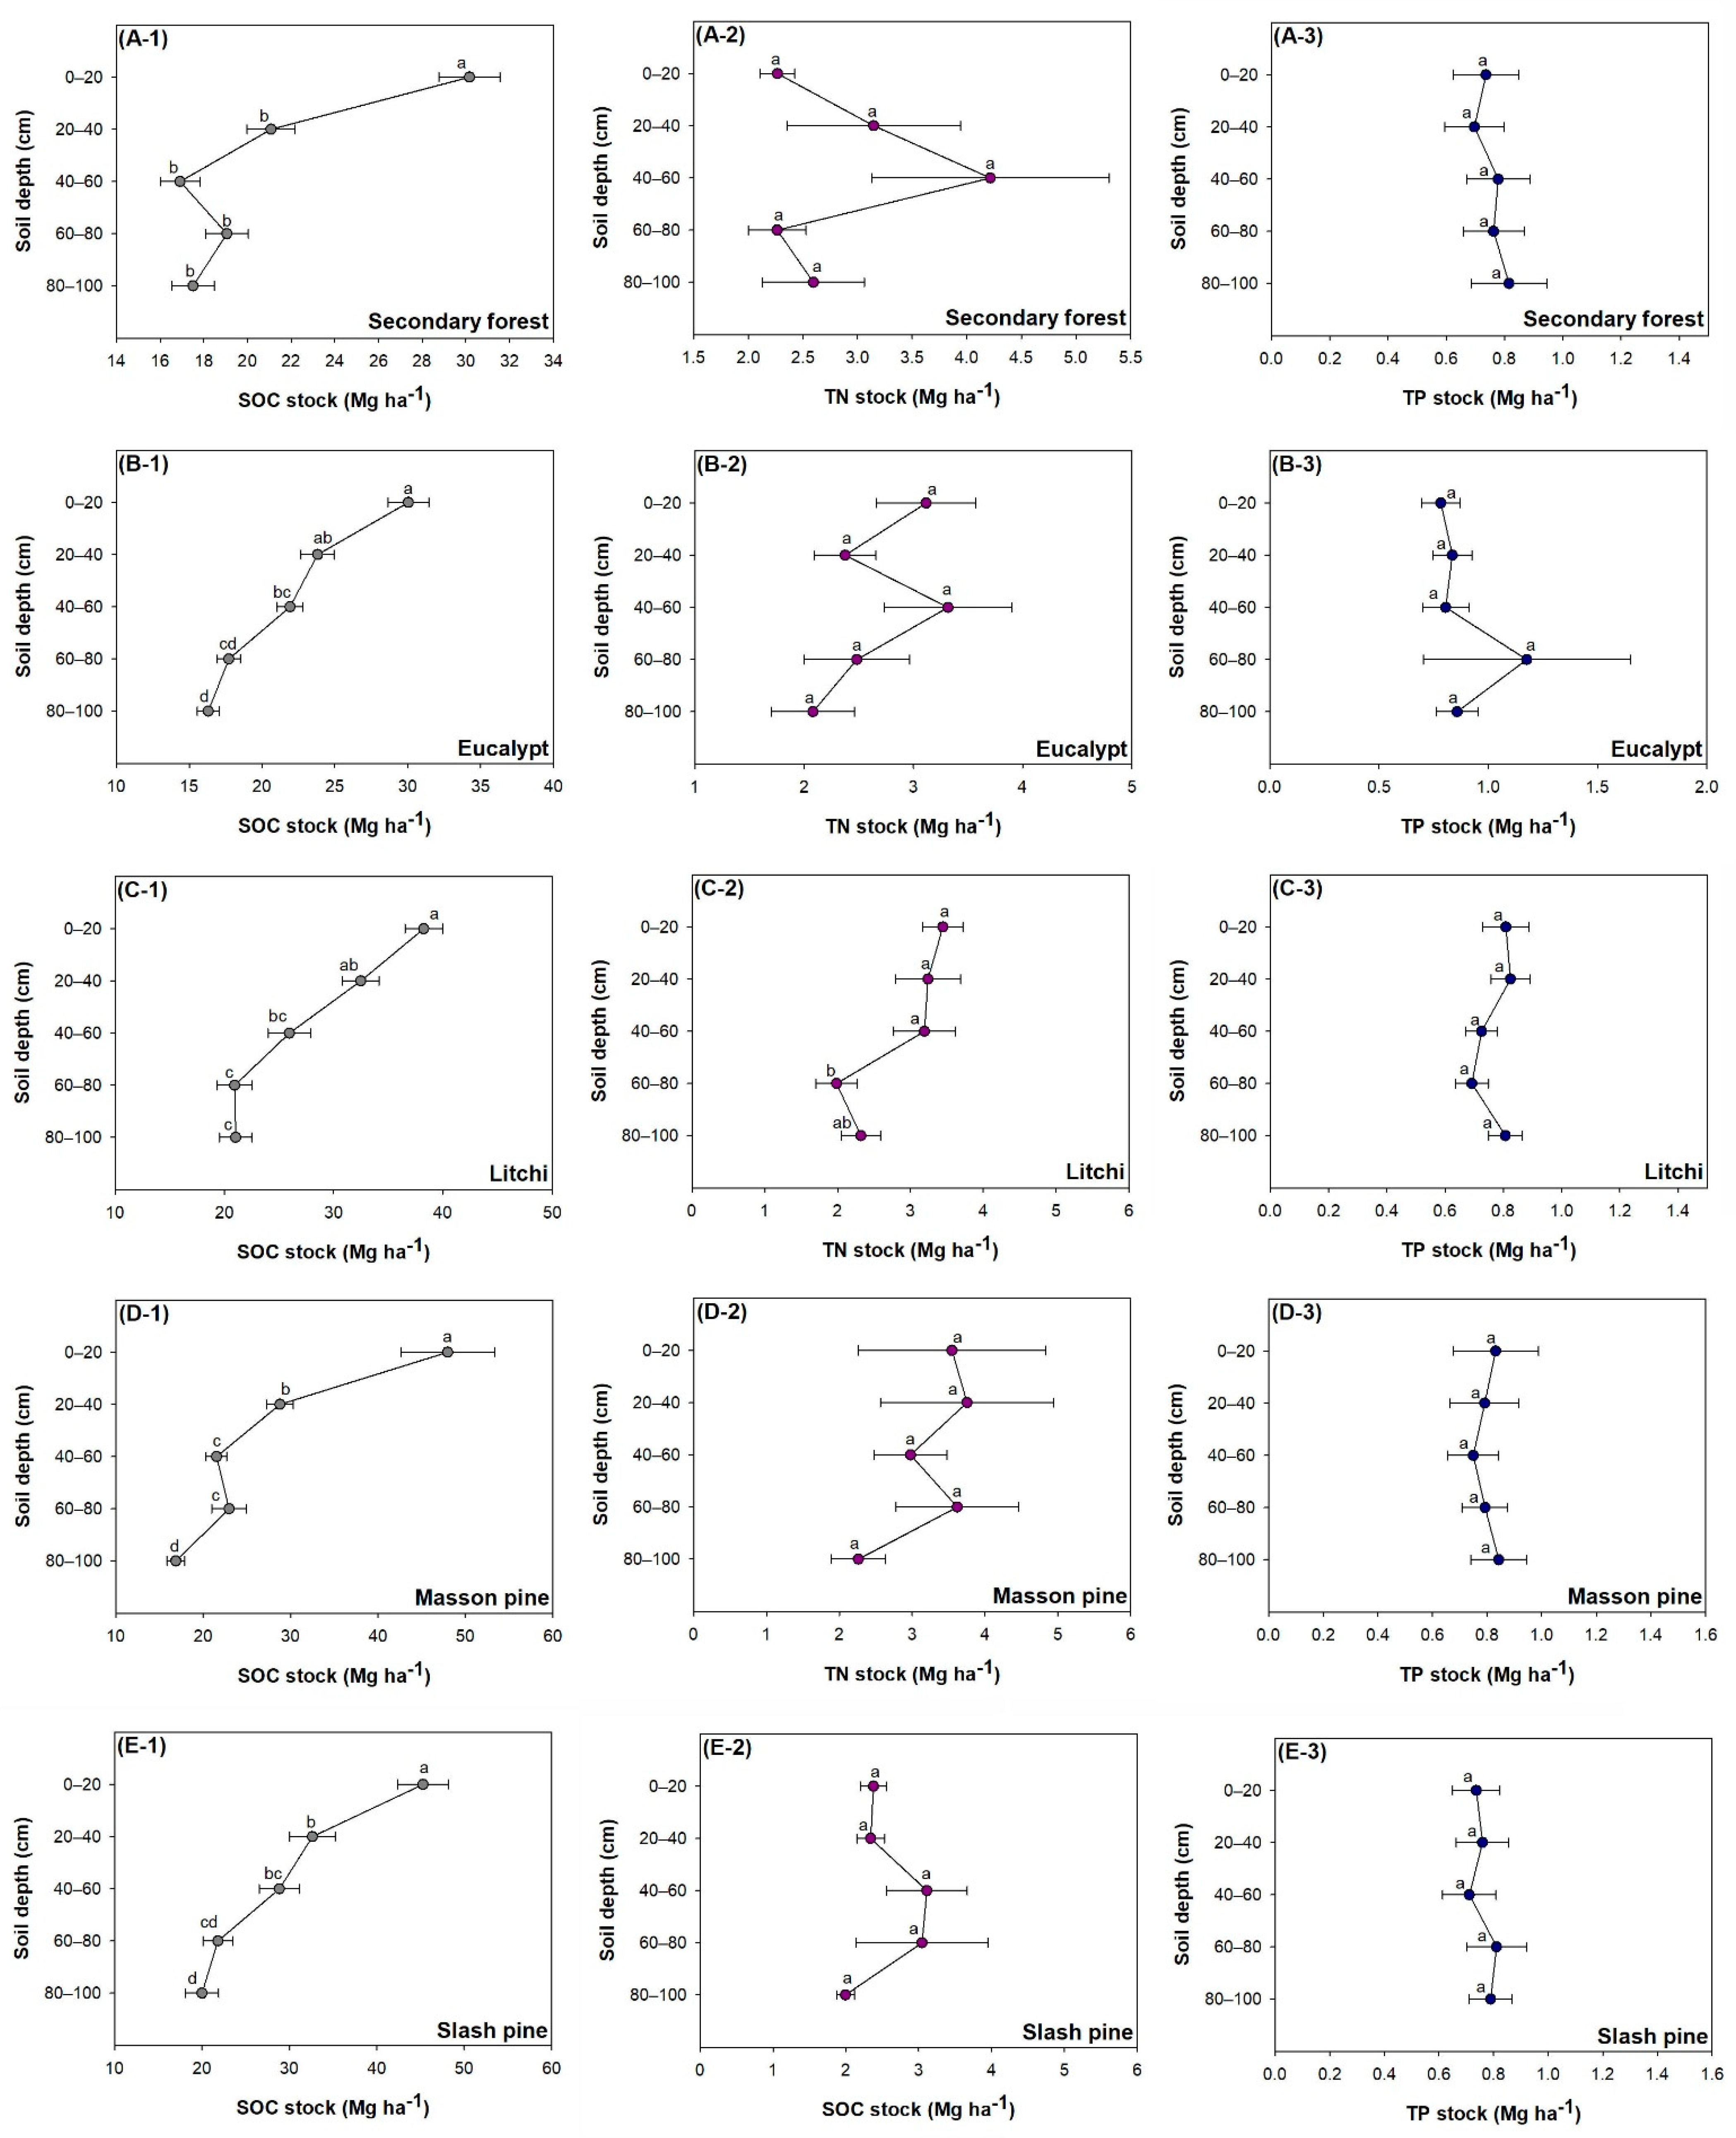
3.4. Variation of Stock along Soil Depths for Different Species

Again, soil variable stocks were not responsive to interactive effects of forest type and soil layer (Table 1). Therefore, stock results were analyzed by t-test and no significant difference was found for most TN and TP stocks at different depths for all forest types (Figure 5). However, in Litchi forests, soil TN stock was lower at 60–80 cm compared to soil at layers of shallower depths (Figure 5C-2). SOC stock showed a decreasing trend with the increase of soil depth (Figure 5 left column). SOC stock was higher in surface soil than in all other deeper soil layers for secondary forests, Masson pine, and Slash pine plantations. In Eucalypt and Litchi plantations, SOC stock at 80–100 cm was lower than that at 20–40 cm and 40–60 cm (Figure 5B-1,C-1).

3.5. Regression of Soil Variable Stock

Longitude and elevation had positive contributions to SOC stock in surface soil at 0–20 cm (Table 2). Longitude had a greater contribution than elevation when comparing their estimated parameters. In contrast, soil pH had a negative contribution to surface soil SOC stock. In soil at a depth of 20–40 cm, elevation had a tiny positive contribution to SOC stock, but BD had a greater positive contribution. Both latitude and BD had a negative contribution to SOC stock at 40–60 cm, while slope had a tiny positive contribution. Both longitude and elevation had a positive contribution to SOC stock at 60–80 cm. In soil at 80–100 cm, both latitude and BD had negative contributions to SOC stock and slope had a tiny positive contribution.
Topography and soil property only generated significant contribution to TN stock at 80–100 cm (Table 3). Latitude had a strong negative contribution to TN stock while elevation had a tiny positive contribution.
Longitude had a positive contribution to soil TP stock in nearly all soil layers except for the 60–80 cm layer (Table 4). Soil BD had negative contributions to TP stock at 40–60 cm and 80–100 cm.

4. Discussion

4.1. Failure of Interactive Effects

Our failure to detect interactive effects between forest type and soil depth on soil stoichiometry does not corroborate findings in subtropical forests [32] and Loess Plateau regions [33]. Although ANOVA did not indicate any significant combination between combined forest-type and soil-depth, paired t-tests indicated significant interactions. Many factors can affect the expression of significant interaction and we would like to attribute this to statistics and soil type property. Uneven replicated numbers and insufficient sampling numbers may partly be the cause of this failure. High temperature in tropical forests may also reduce difference in soil stoichiometry among forest types at different depths. Our results clearly demonstrated a weak influence from forest type but a strong influence from depth; hence the latter one contributed to the main body of data variation instead of an interaction with forest type. Soil property in ultisols may have contributed more to C change and subsequently stoichiometry with N and P than we expected [31,43]. Overall, the absence of interaction was not surprising, and we do not surmise any repeat investigation will be necessary.

4.2. Variation among Forest Types

In this study, we found that SOC was the only responsive variable that was significantly different among the five forest types. Eucalypt was the only type of forest that had similar SOC as secondary forests, and both had lower SOC compared to Litchi, Masson pine, and Slash pine plantations. Studies in subtropical forests have revealed that land conversion from secondary forests to plantations will result in loss of SOC [20,44]. It was also revealed that plantations had higher SOC stock than secondary forests [45]. In regions where soil C was lost by land conversion to plantations, secondary forests with few disturbances can maintain near-natural forest soil conditions. However, in our study region, secondary forests received frequent management that have heavily disturbed soil C storage. In accordance with our study, another investigation in forests of Queensland, Australia also found no difference in SOC in soils between local secondary forests and Eucalypt plantations [21]. As a fast-growing species, Eucalypt-dominated forests showed similar structure with other types of forests but at lower stand age. The recentness of conversion did not give Eucalypt forests long-enough time to generate different soil C from secondary forests. It was also documented in Puerto Rico that there was no difference in SOC between secondary forests and Pinus caribeae plantations [46]. Therefore, we can accept our results regarding no difference in SOC between secondary forests and Eucalypt forests.
Slash pine forests were the only type of plantations that had higher soil C:P compared to secondary forests. This means that there are lower levels of microbial diversity and resource quality in Slash pine forests [19]. Slash pine are usually managed through straw raking and fertilization [47]. The former is needed for increasing revenue from timber production and the latter replenishes removed P. The change in SOC drove the variation of soil C:P among forest types because soil TP concentration was not changed. Therefore, we surmise it was the stand management that interrupted soil P pool and impacted stand quality in Slash pine forests. In contrast to soil C:P for Slash pine, that in Eucalypt forests was lower, which suggests a better microbial diversity and stand quality. Eucalypt forests were also found to have low C:P, suggesting a close trend of high nutrient mineralization [48]. High efficiency of nutrient cycling in soils can support the fast-growing attribute of Eucalypt trees.

4.3. Vertical Distribution across Soil Layers

In our study, surface soil has a generally higher C stock than deep soils. This trend concurs with studies in Brazil [17] and Singapore [23]. Qiao et al. [30] explained that higher litter accumulation on surface soil provides more dissolved organic C, which will also stimulate microbial activity. In contrast, deep soil C was unstable and might be susceptible to climate-induced perturbation, particularly only if increasing forest productivity promotes C allocation below-ground [23]. Our gradient of soil C storage was consistent with the gradient in which clay translocated from sandy surface soil to clay subsoil [31]. Although accumulation of clay soils can amend sandy soils by increasing SOC, the increment can only be effective for the surface (depth of 0–30 cm) [49]. More factors can contribute to the negative impact of decline in subsoil SOC rather than just the vertical distribution of soil texture conversion from sandy soil to clay. Surface soil C storage was found to increase with longitude but decrease with pH value, while SOC in soils at 80–100 cm was strongly depressed by latitude and bulk density. As local topography is lower in the northeast, flat floor in eastern forests would benefit from litter accumulation and therefore promote C input to surface soil. The negative relationship between soil pH and SOC was also found in a large-scale investigation on carbonate soils in China [50]. This might be caused by controlling plant C transformation in accordance with lower fungal diversity and activity in high soil pH. Lowered SOC storage in deep soils was due to high compaction that would limit fresh organic matter input into subsoil [51]. The flat floor in the northern part of the study area attracted more anthropogenic activities than the hilly lands in the south, which generated heavy pressure on deep soil and limited SOC therein.
Both soil TN concentration and stock were higher in surface soil than in subsoil. The decreasing trend of TN with soil depth accorded with SOC, both of which resulted from a higher input of organic matters into surface soil and lower input in deep soils [3,30]. Our TN storage in deep soil at 80–100 cm was mainly driven by a strong force of latitude as a negative contribution, which concurs with findings on SOC. Soil in northern parts of the study area suffered from lower temperature, which hindered organic matter decomposition and N mineralization.
Neither soil TP concentration nor stock showed significant vertical distribution among soil layers. This is not the first case of null response to vertical distribution of soil TP in forest soils [3,42]. The vertical distribution pattern of soil TP concentration is the result of synthesized influences by parent material, land use, and biogeochemical processes in the soil ecosystem [52,53]. The weathering process of parent materials in surface soil is sensitive to climate and land use, which needs a long period of time and did not show any difference among forest types. Distribution of TP in subsoil is formed not only by long-term weathering of the parent materials but also by translocation from buried plants [54]. Therefore, it was P accumulation from multiple sources that made TP concentration the same along vertical soil layers. Longitude had a positive contribution to TP stock in most soil layers. Our results differed from the trend of soil TP concentration along the longitude at the national scale in China [55]. This contradiction was acceptable because our study sites were concentrated at a regional scale where elevation was lower in the east and higher in the west. Generally, factors impacting soil P along the longitude gradient included soil age, development, climatic condition, and topographic heterogeneity [56,57,58]. Among these factors, only the topographic variation might have significantly impacted soil P stock along the longitude in our study.
Soil C:N is frequently used as a negative indicator of organic matter decomposition [3]. However, our soil C:N showed a decreasing trend with soil depth, which disagrees with other findings in temperature forests [3,59]. In accordance with our results, investigations in other types of subtropical forests also showed higher C:N in surface soil [30,42]. Nitrogen in organic matters decomposed with C but the decomposing speed of N was slower than C. During the decomposition process, soil TN is immobilized in decayed products, leaving behind more durable materials with slower decomposition in deeper soil layers [42].
Again, our soil N:P was higher in soils near surface layers than those in deep layers. These findings were consistent with several previous findings [3,30,42], which together revealed a general response of soil N:P to soil layer depth. In the forest ecosystem of our study, the speed of P mineralization from rock weathering [15,16] was lower than that for N release from organic matters, which led to a higher N input than P input into the soil. Our N:P ranged around 4.0–8.0, which is lower than the Chinese average (9.3) and the global average (13.1) [60]. This suggests N limitation in our sites, which was more severe in deeper soils than surface soil due to their lower N:P.

4.4. Vertical Distribution among Differnet Forest Types

In our study, the vertical distribution of SOC showed a similar pattern among all forest types. Neither TN nor TP were different across soil depths in secondary forests. Litchi plantation was the only type of forest that showed different soil TN concentration and stock at different depths of soil layers. Therefore, it is reasonable to speculate that CNP stoichiometry in Litchi plantations accounted for the most variation across soil depths across all forest types. As one of the most important fruit trees with big economic value, Litchi plantations are always receiving intensive management in southern China [61,62]. Litchi spp. are a heavy N-consumer. Hence, the plantations are frequently dependent on manual N supply [61,63]. Large amount of N input into soils promoted N leaching to deep soil and contributed to the variation of TN at different soil depths. In addition, Litchi plantations are also managed by introducing forage grass into the understory to maximize the eco-environment value [64]. Therefore, high biodiversity of undergrowth improved the structure of the soil bacteria community that also strengthened N mineralization from organic matter decomposition in Litchi plantations.

5. Conclusions

We did not observe significant differences in soil CNP stoichiometry by combined forest type and soil type. The Eucalypt plantation was the only forest type to have similar C storage and C:P in soils of the secondary forests. Both SOC and TN storages and C:N, C:P, and N:P in soils showed a generally decreasing trend with the increase of soil depth, but TP storage did not show significant difference along vertical distribution. Litchi plantations were the only type of forest that had a significant difference in TN storage in different soil depths. Overall, during the conversion from secondary forests to plantations over ultisols, Litchi plantations are the only type of plantation that obtained enhanced C storage in 0–100 cm soils and diverse N concentrations among soil layers.

Supplementary Materials

The following are available online at https://www.mdpi.com/article/10.3390/f12101300/s1, Table S1: Structure of five types of forests located in Yunfu, Guangdong province, South China.

Author Contributions

Conceptualization, X.D. and X.L.; methodology, X.D.; software, H.W.; validation, X.D., Y.Q. and Z.Z.; formal analysis, D.S. and H.W.; investigation, X.D., Y.Q., Z.Z. and D.S.; resources, X.D. and X.L.; data curation, Y.Q. and H.W.; writing—original draft preparation, X.D. and X.L.; writing—review and editing, H.W.; visualization, Z.Z.; supervision, X.D. and X.L.; project administration, X.L.; funding acquisition, X.L. All authors have read and agreed to the published version of the manuscript.

Funding

This research was funded by Guangdong Forestry Science and Technology Plan of China (Grant No.: 201907) and National Natural Science Foundation of China (grant numbers 42001117, 41971122, and 41861017).

Acknowledgments

Authors are thankful to reviewers and editors for their insightful comments and suggestions to an earlier edition of this article.

Conflicts of Interest

The authors declare no conflict of interest.

References

  1. Lal, R. Managing Soils and Ecosystems for Mitigating Anthropogenic Carbon Emissions and Advancing Global Food Security. BioScience 2010, 60, 708–721. [Google Scholar] [CrossRef]
  2. Pires, C.V.; Schaefer, C.E.R.G.; Hashigushi, A.K.; Thomazini, A.; Filho, E.I.F.; Mendonça, E.S. Soil organic carbon and nitrogen pools drive soil C-CO2 emissions from selected soils in Maritime Antarctica. Sci. Total Environ. 2017, 596–597, 124–135. [Google Scholar] [CrossRef] [PubMed]
  3. Cao, Y.; Zhang, P.; Chen, Y.M. Soil C:N:P stoichiometry in plantations of N-fixing black locust and indigenous pine, and secondary oak forests in Northwest China. J. Soils Sediments 2018, 18, 1478–1489. [Google Scholar] [CrossRef]
  4. Jobbagy, E.G.; Jackson, R.B. The vertical distribution of soil organic carbon and its relation to climate and vegetation. Ecol. Appl. 2000, 10, 423–436. [Google Scholar] [CrossRef]
  5. Dixon, R.K.; Brown, S.; Houghton, R.A.; Solomon, A.M.; Trexler, M.C.; Wisniewski, J. Carbon pools and flux of global forest ecosystems. Science 1994, 263, 185–190. [Google Scholar] [CrossRef]
  6. Lewis, S.L.; Lopez-Gonzalez, G.; Sonke, B.; Affum-Baffoe, K.; Baker, T.R.; Ojo, L.O.; Phillips, O.L.; Reitsma, J.M.; White, L.; Comiskey, J.A.; et al. Increasing carbon storage in intact African tropical forests. Nature 2009, 457, 1003. [Google Scholar] [CrossRef]
  7. Malhi, Y. The carbon balance of tropical forest regions, 1990–2005. Curr. Opin. Environ. Sustain. 2010, 2, 237–244. [Google Scholar] [CrossRef]
  8. Beer, C.; Reichstein, M.; Tomelleri, E.; Ciais, P.; Jung, M.; Carvalhais, N.; Rodenbeck, C.; Arain, M.A.; Baldocchi, D.; Bonan, G.B.; et al. Terrestrial Gross Carbon Dioxide Uptake: Global Distribution and Covariation with Climate. Science 2010, 329, 834–838. [Google Scholar] [CrossRef] [Green Version]
  9. Raich, J.W.; Schlesinger, W.H. The global carbon-dioxide flux in soil respiration and its relationship to vegetation and climate. Tellus Ser. B Chem. Phys. Meteorol. 1992, 44, 81–99. [Google Scholar] [CrossRef] [Green Version]
  10. Cleveland, C.C.; Liptzin, D. C:N:P stoichiometry in soil: Is there a “Redfield ratio” for the microbial biomass? Biogeochemistry 2007, 85, 235–252. [Google Scholar] [CrossRef]
  11. Hu, L.; Ade, L.; Wu, X.; Zi, H.; Luo, X.; Wang, C. Changes in Soil C:N:P Stoichiometry and Microbial Structure along Soil Depth in Two Forest Soils. Forests 2019, 10, 113. [Google Scholar] [CrossRef] [Green Version]
  12. Reich, P.B.; Hobbie, S.E.; Lee, T.; Ellsworth, D.S.; West, J.B.; Tilman, D.; Knops, J.M.H.; Naeem, S.; Trost, J. Nitrogen limitation constrains sustainability of ecosystem response to CO2. Nature 2006, 440, 922–925. [Google Scholar] [CrossRef] [PubMed]
  13. Batjes, N.H. Total carbon and nitrogen in the soils of the world. Eur. J. Soil Sci. 1996, 47, 151–163. [Google Scholar] [CrossRef]
  14. Stevenson, F.J.; Cole, M.A. Cycles of Soils: Carbon, Nitrogen, Phosphorus, Sulfur, Micronutrients; John Wiley and Sons: Hoboken, NJ, USA, 1999. [Google Scholar]
  15. Walker, T.W.; Syers, J.K. The fate of phosphorus during pedogenesis. Geoderma 1976, 15, 1–19. [Google Scholar] [CrossRef]
  16. Trudgill, S.T. Soil and Vegetataion Systems; Clarendon Press: Oxford, UK, 1988. [Google Scholar]
  17. Groppo, J.D.; Lins, S.R.M.; Camargo, P.B.; Assad, E.D.; Pinto, H.S.; Martins, S.C.; Salgado, P.R.; Evangelista, B.; Vasconcellos, E.; Sano, E.E.; et al. Changes in soil carbon, nitrogen, and phosphorus due to land-use changes in Brazil. Biogeosciences 2015, 12, 4765–4780. [Google Scholar] [CrossRef] [Green Version]
  18. Fan, H.B.; Wu, J.P.; Liu, W.F.; Yuan, Y.H.; Hu, L.; Cai, Q.K. Linkages of plant and soil C:N:P stoichiometry and their relationships to forest growth in subtropical plantations. Plant Soil 2015, 392, 127–138. [Google Scholar] [CrossRef]
  19. Delgado-Baquerizo, M.; Reich, P.B.; Khachane, A.N.; Campbell, C.D.; Thomas, N.; Freitag, T.E.; Abu Al-Soud, W.; Sorensen, S.; Bardgett, R.D.; Singh, B.K. It is elemental: Soil nutrient stoichiometry drives bacterial diversity. Environ. Microbiol. 2017, 19, 1176–1188. [Google Scholar] [CrossRef]
  20. Wang, Q.; Wang, S.; Yu, X. Decline of soil fertility during forest conversion of secondary forest to Chinese fir plantations in subtropical China. Land Degrad. Dev. 2011, 22, 444–452. [Google Scholar] [CrossRef]
  21. Lewis, T.; Smith, T.E.; Hogg, B.; Swift, S.; Verstraten, L.; Bryant, P.; Wehr, B.J.; Tindale, N.; Menzies, N.W.; Dalal, R.C. Conversion of sub-tropical native vegetation to introduced conifer forest: Impacts on below-ground and above-ground carbon pools. For. Ecol. Manag. 2016, 370, 65–75. [Google Scholar] [CrossRef] [Green Version]
  22. Wang, Y.; Chen, L.; Xiang, W.H.; Ouyang, S.; Zhang, T.D.; Zhang, X.L.; Zeng, Y.L.; Hu, Y.T.; Luo, G.W.; Kuzyakov, Y. Forest conversion to plantations: A meta-analysis of consequences for soil and microbial properties and functions. Glob. Chang. Biol. 2021. Early Access. [Google Scholar] [CrossRef]
  23. Ngo, K.M.; Turner, B.L.; Muller-Landau, H.C.; Davies, S.J.; Larjavaara, M.; Hassan, N.F.B.; Lum, S. Carbon stocks in primary and secondary tropical forests in Singapore. For. Ecol. Manag. 2013, 296, 81–89. [Google Scholar] [CrossRef]
  24. Lal, R. Soil carbon sequestration to mitigate climate change. Geoderma 2004, 123, 1–22. [Google Scholar] [CrossRef]
  25. University of Idaho. The Twelve Soil Orders: Ultisols. Available online: https://www.uidaho.edu/cals/soil-orders/ultisols#:~:text=Ultisols%20(from%20Latin%20ultimus%2C%20%22,typically%20on%20older%2C%20stable%20landscapes (accessed on 3 January 2021).
  26. Wikipedia. The Red Clay Soils: Ultisol. Available online: https://en.wikipedia.org/wiki/Ultisol (accessed on 4 January 2021).
  27. Fujii, K.; Uemura, M.; Hayakawa, C.; Funakawa, S.; Sukartiningsih; Kosaki, T.; Ohta, S. Fluxes of dissolved organic carbon in two tropical forest ecosystems of East Kalimantan, Indonesia. Geoderma 2009, 152, 127–136. [Google Scholar] [CrossRef]
  28. Lu, D.; Moran, E.; Mausel, P. Linking amazonian secondary succession forest growth to soil properties. Land Degrad. Dev. 2002, 13, 331–343. [Google Scholar] [CrossRef]
  29. Sotomayor-Ramirez, D.; Espinoza, Y. Soil aggregation and organic carbon fractions in the Rio Grande de Arecibo watershed. J. Agric. Univ. P. R. 2010, 94, 25–39. [Google Scholar] [CrossRef]
  30. Qiao, Y.; Wang, J.; Liu, H.M.; Huang, K.; Yang, Q.S.; Lu, R.L.; Yan, L.M.; Wang, X.H.; Xia, J.Y. Depth-dependent soil C-N-P stoichiometry in a mature subtropical broadleaf forest. Geoderma 2020, 370, 9. [Google Scholar] [CrossRef]
  31. Ding, X.G.; Zhao, Z.Y.; Yang, Q.; Chen, L.N.; Tian, Q.Y.; Li, X.C.; Meng, F.R. Model prediction of depth-specific soil texture distributions with artificial neural network: A case study in Yunfu, a typical area of Udults Zone, South China. Comput. Electron. Agric. 2020, 169, 13. [Google Scholar] [CrossRef]
  32. Luo, X.Z.; Hou, E.Q.; Chen, J.Q.; Li, J.; Zhang, L.L.; Zang, X.W.; Wen, D.Z. Dynamics of carbon, nitrogen, and phosphorus stocks and stoichiometry resulting from conversion of primary broadleaf forest to plantation and secondary forest in subtropical China. Catena 2020, 193, 104606. [Google Scholar] [CrossRef]
  33. Zhao, F.Z.; Zhang, L.; Ren, C.J.; Sun, J.; Han, X.H.; Yang, G.H.; Wang, J. Effect of Microbial Carbon, Nitrogen, and Phosphorus Stoichiometry on Soil Carbon Fractions under a Black Locust Forest within the Central Loess Plateau of China. Soil Sci. Soc. Am. J. 2016, 80, 1520–1530. [Google Scholar] [CrossRef]
  34. Li, X.; Ding, X.; Ceng, S.; Zhang, C.; Yang, H. Forestry Soil Survey of Yunfu, Guangdong Province; China Forestry Publishing House: Beijing, China, 2018. [Google Scholar]
  35. Tang, Z.H.; Ouyang, T.P.; Li, M.K.; Huang, N.S.; Kuang, Y.Q.; Hu, Q.; Zhu, Z.Y. Potential effects of exploiting the Yunfu Pyrite mine (southern China) on soil: Evidence from analyzing trace elements in surface soil. Environ. Monit. Assess. 2019, 191, 1–18. [Google Scholar] [CrossRef]
  36. Wang, W.; Shu, J.; Chen, W.; Ding, J. Holocene environmental changes and human impact in the Yangtze River Delta area in East China. Quat. Sci. 2010, 30, 233–244. [Google Scholar]
  37. Wei, R.-P.; Yang, R.; Wei, Q. Effect of Lime Application to Acidic Soils on Oleoresin Yield Tapped from Pine Plantations in South China. Open J. For. 2014, 4, 390–397. [Google Scholar] [CrossRef] [Green Version]
  38. Anjum, J.; Lone, R.; Wani, K.A. Lychee (Litchi chinensis): Biochemistry, Panacea, and Nutritional Value. In Lychee Disease Management; Kumar, M., Kumar, V., Bhalla-Sarin, N., Varma, A., Eds.; Springer Singapore: Singapore, 2017; pp. 237–256. [Google Scholar]
  39. Liu, G. Soil Physical and Chemical Analysis, Description of Soil Profiles; Standard Press of China: Beijing, China, 1996. [Google Scholar]
  40. Bremner, J.M.; Mulvaney, C.S. Nitrogen—Total. In Methods of Soil Analysis; American Society of Agronomy: Madison, WI, USA, 1983; pp. 595–624. [Google Scholar]
  41. Murphy, J.; Riley, J.P. A modified single solution method for the determination of phosphate in natural waters. Anal. Chim. Acta 1962, 27, 31–36. [Google Scholar] [CrossRef]
  42. Xu, H.W.; Qu, Q.; Li, P.; Guo, Z.Q.; Wulan, E.; Xue, S. Stocks and Stoichiometry of Soil Organic Carbon, Total Nitrogen, and Total Phosphorus after Vegetation Restoration in the Loess Hilly Region, China. Forests 2019, 10, 27. [Google Scholar] [CrossRef] [Green Version]
  43. Zhao, Z.Y.; Yang, Q.; Sun, D.X.; Ding, X.G.; Meng, F.R. Extended model prediction of high-resolution soil organic matter over a large area using limited number of field samples. Comput. Electron. Agric. 2020, 169, 12. [Google Scholar] [CrossRef]
  44. de Blecourt, M.; Brumme, R.; Xu, J.C.; Corre, M.D.; Veldkamp, E. Soil Carbon Stocks Decrease following Conversion of Secondary Forests to Rubber (Hevea brasiliensis) Plantations. PLoS ONE 2013, 8, e69357. [Google Scholar]
  45. Yang, Y.S.; Xie, J.S.; Sheng, H.; Chen, G.S.; Li, X.; Yang, Z.J. The impact of land use/cover change on storage and quality of soil organic carbon in midsubtropical mountainous area of southern China. J. Geogr. Sci. 2009, 19, 49–57. [Google Scholar] [CrossRef]
  46. Li, Y.; Xu, M.; Zou, X.M.; Shi, P.J.; Zhang, Y.Q. Comparing soil organic carbon dynamics in plantation and secondary forest in wet tropics in Puerto Rico. Glob. Chang. Biol. 2005, 11, 239–248. [Google Scholar] [CrossRef]
  47. Chevasco, E.D.; Minogue, P.J.; Mackowiak, C.; Comerford, N.B. Fertilization and pine straw raking in slash pine plantations: P removals and effects on total and mobile soil, foliage and litter P pools. For. Ecol. Manag. 2016, 376, 310–320. [Google Scholar] [CrossRef]
  48. Bui, E.N.; Henderson, B.L. C:N:P stoichiometry in Australian soils with respect to vegetation and environmental factors. Plant Soil 2013, 373, 553–568. [Google Scholar] [CrossRef]
  49. Schapel, A.; Marschner, P.; Churchman, J. Clay amount and distribution influence organic carbon content in sand with subsoil clay addition. Soil Tillage Res. 2018, 184, 253–260. [Google Scholar] [CrossRef]
  50. Jin, S.F.; Wang, H.S. Relationships between soil pH and soil carbon in China’s carbonate soils. Fresenius Environ. Bull. 2018, 27, 605–611. [Google Scholar]
  51. Brevik, E.; Fenton, T.; Moran, L. Effect of soil compaction on organic carbon amounts and distribution, South-Central Iowa. Environ. Pollut. 2002, 116, S137–S141. [Google Scholar] [CrossRef]
  52. Cheng, Y.; Li, P.; Xu, G.; Li, Z.; Cheng, S.; Gao, H. Spatial distribution of soil total phosphorus in Yingwugou watershed of the Dan River, China. CATENA 2016, 136, 175–181. [Google Scholar] [CrossRef]
  53. Kooijman, A.M.; Jongejans, J.; Sevink, J. Parent material effects on Mediterranean woodland ecosystems in NE Spain. CATENA 2005, 59, 55–68. [Google Scholar] [CrossRef]
  54. Tian, H.; Chen, G.; Zhang, C.; Melillo, J.M.; Hall, C.A.S. Pattern and variation of C:N:P ratios in China’s soils: A synthesis of observational data. Biogeochemistry 2010, 98, 139–151. [Google Scholar] [CrossRef]
  55. Zhu, J.; Wu, A.C.; Zhou, G.Y. Spatial distribution patterns of soil total phosphorus influenced by climatic factors in China’s forest ecosystems. Sci. Rep. 2021, 11, 5357. [Google Scholar] [CrossRef]
  56. Garcia-Velazquez, L.; Rodriguez, A.; Gallardo, A.; Maestre, F.T.; Dos Santos, E.; Lafuente, A.; Fernandez-Alonso, M.J.; Singh, B.K.; Wang, J.T.; Duran, J. Climate and soil micro-organisms drive soil phosphorus fractions in coastal dune systems. Funct. Ecol. 2020, 34, 1690–1701. [Google Scholar] [CrossRef]
  57. Wang, Y.P.; Law, R.M.; Pak, B. A global model of carbon, nitrogen and phosphorus cycles for the terrestrial biosphere. Biogeosciences 2010, 7, 2261–2282. [Google Scholar] [CrossRef] [Green Version]
  58. Li, X.P.; Chang, S.X.; Liu, J.T.; Zheng, Z.M.; Wang, X.H. Topography-soil relationships in a hilly evergreen broadleaf forest in subtropical China. J. Soils Sediments 2017, 17, 1101–1115. [Google Scholar] [CrossRef]
  59. Zhang, S.; Yan, L.; Huang, J.; Mu, L.; Huang, Y.; Zhang, X.; Sun, Y. Spatial Heterogeneity of Soil C:N Ratio in a Mollisol Watershed of Northeast China. Land Degrad. Dev. 2016, 27, 295–304. [Google Scholar] [CrossRef]
  60. Yang, S.B.; Feng, C.; Ma, Y.H.; Wang, W.J.; Huang, C.; Qi, C.J.; Fu, S.L.; Chen, H.Y.H. Transition from N to P limited soil nutrients over time since restoration in degraded subtropical broadleaved mixed forests. For. Ecol. Manag. 2021, 494, 119298. [Google Scholar] [CrossRef]
  61. Sun, J.; Li, S.; Wei, Z.; Wang, D.; Qi, Z. Distribution of soil nutrients in the litchi orchard in the midwest Hainan. Guangdong Agric. Sci. 2013, 40, 62–64. [Google Scholar]
  62. Yao, L.; Zhou, C.; He, Z.; Li, G.; Yang, B.; Bai, C. Nutrient accumulation characteristics of main litchi cultivars and their relationships with soil nutrients. J. South China Agric. Univ. 2020, 41, 40–47. [Google Scholar]
  63. Menzel, C.M.; Haydon, G.F.; Simpson, D.R. Growth of Lychee (Litchi-chinensis sonn) in sand culture under variable nitrogen supply. J. Horticult. Sci. 1995, 70, 757–767. [Google Scholar]
  64. Zhang, J.E.; Luo, S.M.; Duan, S.S. The eco-environment of a young litchi orchard interplanted with forage grass in south China. In Proceedings of the First International Symposium on Litchi and Longan, Guangzhou, China, 16–19 June 2000; Huang, H., Menzel, C., Eds.; International Society for Horticultural Science: Leuven, Belgium, 2001; pp. 311–313. [Google Scholar]
Figure 1. Distribution of stands for soil sampling in forested Ultisols of Yunfu, Guangdong province, South China.
Forests 12 01300 g001
Figure 2. Differences of soil organic carbon (SOC) (A,D), total nitrogen (TN) (B,E), and total phosphorus (TP) (C,F) and ratios of C:N (G), C:P (H), and (N:P) (I) in secondary forests and four types of plantations of Eucalypt (Eucalyptus obliqua L’Hér.), Litchi (Litchi chinensis Sonn., 1782), Masson pine (Pinus massoniana Lamb.), and Slash pine (Pinus elliottii Engelm.) in Yunfu, Guangdong province, South China. Bars indicate standard deviations. Different letters over bars indicate significant difference detected by Duncan test at 0.05 level.
Forests 12 01300 g002
Figure 3. Differences in concentrations and stocks in soil organic carbon (SOC) (A,D), total nitrogen (TN) (B,E), and total phosphorus (TP) (C,F) and ratios of C:N (G), C:P (H), and (N:P) (I) in five soil layers at depths of 0–20 cm, 20–40 cm, 40–60 cm, 60–80 cm, and 80–100 cm in Yunfu, Guangdong province, South China. Bars indicate standard deviations. Different letters beyond bars indicate significant difference detected by Duncan test at 0.05 level.
Forests 12 01300 g003
Figure 4. Differences of concentrations in soil organic carbon (SOC) (A-1,B-1,C-1,D-1,E-1), total nitrogen (TN) (A-2,B-2,C-2,D-2,E-2), and total phosphorus (TP) (A-3,B-3,C-3,D-3,E-3) in five soil layers at depths of 0–20 cm, 20–40 cm, 40–60 cm, 60–80 cm, and 80–100 cm from stands of secondary forests and four types of plantations of Eucalypt (Eucalyptus obliqua L’Hér.), Litchi (Litchi chinensis Sonn., 1782), Masson pine (Pinus massoniana Lamb.), and Slash pine (Pinus elliottii Engelm.) in Yunfu, Guangdong province, South China, Yunfu, Guangdong province, South China. Bars indicate standard deviations. Different letters beyond bars indicate significant difference detected by paired t-test at 0.05 level.
Forests 12 01300 g004
Figure 5. Differences of storages in soil organic carbon (SOC) (A-1,B-1,C-1,D-1,E-1), total nitrogen (TN) (A-2,B-2,C-2,D-2,E-2), and total phosphorus (TP) (A-3,B-3,C-3,D-3,E-3) in five soil layers at depths of 0–20 cm, 20–40 cm, 40–60 cm, 60–80 cm, and 80–100 cm from stands of secondary forests and four types of plantations of Eucalypt (Eucalyptus obliqua L’Hér.), Litchi (Litchi chinensis Sonn., 1782), Masson pine (Pinus massoniana Lamb.), and Slash pine (Pinus elliottii Engelm.) in Yunfu, Guangdong province, South China, Yunfu, Guangdong province, South China. Bars indicate standard deviations. Different letters beyond bars indicate significant difference detected by paired t-test at 0.05 level.
Forests 12 01300 g005
Table 1. Analysis of variance (ANOVA) of forest type (F), soil depth (S), and their interaction (F×S) on concentration (conc.), stock, and ratios of soil organic carbon (SOC), total nitrogen (TN), and total phosphorus (TP) in Udults soils among a secondary forest and Eucalypt (Eucalyptus obliqua L’Hér.), Litchi (Litchi chinensis Sonn., 1782), Masson pine (Pinus massoniana Lamb.), and Slash pine (Pinus elliottii Engelm.) plantations at Yunfu, Guangdong, China.
Source of VariationSOC Conc.TN Conc.TP Conc.
F value P value F valueP valueF valueP value
F5.160.00041.190.31221.470.2093
S41.75<0.00013.840.00440.560.6911
F × S0.650.84560.490.95110.151.0000
SOC StockTN StockTP Stock
F valueP valueF valueP valueF valueP value
F6.12<0.00010.600.66350.990.4128
S35.35<0.00012.510.04090.410.8049
F × S0.670.82210.530.93430.141.0000
C:NC:PN:P
F valueP valueF valueP valueF valueP value
F1.570.18063.510.00770.390.8171
S5.820.000118.27<0.00012.720.0290
F × S0.490.95400.350.99150.310.9955
Table 2. Stepwise regression of surface topology and physicochemical property to soil organic carbon stock in Udults soils at different depths for a secondary forest and Eucalypt (Eucalyptus obliqua L’Hér.), Litchi (Litchi chinensis Sonn., 1782), Masson pine (Pinus massoniana Lamb.), and Slash pine (Pinus elliottii Engelm.) plantations at Yunfu, Guangdong, China.
VariableParameter EstimateSEModel R2F Valuep Value
0–20 cm
Intercept−624.42292.62-4.550.0353
Longitude5.902.590.13965.190.0248
Elevation0.020.010.09544.400.0384
pH−5.672.510.05646.150.0147
20–40 cm
Intercept16.233.92-17.09<0.0001
Elevation0.020.010.158319.37<0.0001
BD−6.332.650.20295.710.0187
40–60 cm
Intercept153.6068.07-5.090.0262
Latitude−6.033.000.21624.040.0472
Slope0.140.050.18486.430.0127
BD−8.282.460.133415.860.0001
60–80 cm
Intercept−321.37116.60-7.600.0069
Longitude2.911.040.22397.820.0062
Elevation0.020.010.164520.27<0.0001
80–100 cm
Intercept198.0951.37-14.870.0002
Latitude−8.252.300.124514.650.0002
Slope0.090.040.18928.130.0053
BD−4.812.040.23175.590.0200
Note: BD, soil bulk density.
Table 3. Stepwise regression of surface topology and physicochemical property to total nitrogen stock in Udults soils at the depth of 80–100 cm for a secondary forest and Eucalypt (Eucalyptus obliqua L’Hér.), Litchi (Litchi chinensis Sonn., 1782), Masson pine (Pinus massoniana Lamb.), and Slash pine (Pinus elliottii Engelm.) plantations at Yunfu, Guangdong, China.
VariableParameter EstimateSEModel R2F Valuep Value
Intercept22.6111.02-4.210.0429
Latitude−0.970.490.11724.040.0472
Elevation0.010.010.08239.240.0030
Table 4. Stepwise regression of surface topology and physicochemical property to total phosphorus stock in Udults soils at different depths for a secondary forest and Eucalypt (Eucalyptus obliqua L’Hér.), Litchi (Litchi chinensis Sonn., 1782), Masson pine (Pinus massoniana Lamb.), and Slash pine (Pinus elliottii Engelm.) plantations at Yunfu, Guangdong, China.
VariableParameter EstimateSEModel R2F Valuep Value
0–20 cm
Intercept−17.965.55-10.480.0016
Longitude0.160.050.095210.830.0014
20–40 cm
Intercept−14.994.57-10.760.0014
Longitude0.140.040.097911.180.0012
40–60 cm
Intercept−11.394.16-7.480.0074
Longitude0.110.040.06407.040.0092
BD−0.160.080.09913.980.0488
60–80 cm
Intercept0.290.03-125.68<0.0001
80–100 cm
Intercept−11.624.19-7.690.0066
Longitude0.110.040.07588.440.0045
BD−0.200.090.12145.290.0235
Publisher’s Note: MDPI stays neutral with regard to jurisdictional claims in published maps and institutional affiliations.

