Article

Thinning Influences Wood Properties of Plantation-Grown Eucalyptus nitens at Three Sites in Tasmania

1
ARC Training Centre for Forest Value, School of Natural Sciences, University of Tasmania, Private Bag 55, Hobart, TAS 7001, Australia
2
Forest Quality Pty Ltd., P.O. Box 293, Huonville, TAS 7109, Australia
3
Forico Pty Limited, Launceston, TAS 7249, Australia
4
Sustainable Timber Tasmania, Hobart, TAS 7000, Australia
*
Author to whom correspondence should be addressed.
Forests 2021, 12(10), 1304; https://doi.org/10.3390/f12101304
Submission received: 7 September 2021 / Revised: 17 September 2021 / Accepted: 22 September 2021 / Published: 24 September 2021

Abstract

:
Thinning of forestry plantations is a common silviculture practice to increase growth rates and to produce larger dimension logs. The wood properties, basic density and stiffness, are key indicators of the suitability of timber for particular purposes and ultimately determine timber value. The impact of thinning operations on wood properties is, therefore, of considerable interest to forest growers and timber producers. To date, studies examining the impact of thinning on wood properties have produced variable results and understanding the consistency of the effects of thinning treatments across various sites for important plantation species is limited. Two non-destructive assessment techniques, drilling resistance and acoustic wave velocity, were used to examine the impact of thinning on basic density and stiffness in 19–21-year-old plantation grown Eucalyptus nitens across three sites. Commercial thinning to 300 trees ha−1 decreased the stiffness of standing trees and this effect was consistent across the sites. Reduction in stiffness due to thinning ranged from 3.5% to 11.5%. There was no difference in wood properties between commercially and non-commercially thinned trees to 300 trees ha−1 and no difference in wood properties when thinned to 500 trees ha−1. Basic density was not affected by thinning. The site had significant effects on both basic density and stiffness, which were lowest at the highest precipitation and highest elevation site. The results indicate that wood properties are influenced both by silviculture and site environmental differences. This knowledge can be used for the better management of E. nitens resources for solid wood production.

1. Introduction

Thinning is an important silvicultural intervention used to produce high-value sawlogs from plantation grown trees [1,2,3,4]. Understanding how the resource responds to thinning treatments across different sites is an important consideration for maximizing the production of wood products across an entire estate [2]. Thinning of plantations is commonly undertaken to reduce stand density and competition for limited but essential growing resources, and to accelerate diameter growth on the retained stems [5,6,7]. The aim of thinning is to grow large-size logs for solid wood as these provide a greater proportion of sawn timber recovery [8,9], are more stable during drying [10], are more efficiently converted to laminates for plywood or sliced veneer [11] and maximize financial returns [12,13,14,15]. For solid wood production, maximizing the size of the potential sawlog crop is often more important than maximizing total stand volume production [16]. Lower stocking offers larger individual stems that are worth more due to the relationship between stem size and the potential worth of the products that may be produced [12].
For temperate plantation eucalypts in Tasmania, early age or non-commercial thinning occurs between the ages of 4–7 years and just after the completion of pruning to ensure increased growing resources are directed towards the retained stems immediately, thus increasing the production of knot-free timber. Later-age or commercial thinning typically occurs between the ages of 7–12 years when trees are large enough to allow a commercial pulpwood harvest and an early financial return [17,18,19,20]. Generally, pruning and then thinning to a final stocking of 200 to 300 trees per hectare for solid wood production on rotations of 20–25 years is regarded as the most profitable approach to the management of E. nitens plantations [17,21].
How thinning affects the properties of the produced timber is an important issue. The stiffness or Modulus of Elasticity (MOE) is a key wood property by which structural products are graded and priced [22,23,24], while basic density is also a useful indicator of stiffness, as well as hardness, strength or Modulus of Rupture (MOR) and workability [25]. In Australia, both MOE and MOR define strength groups according to AS/NZS2878:2000 Timbers–Classification into strength groups [26], and MOE is identified as the limiting factor in high stress grade products according to AS/NZS 2269.1:2012 and AS/NZS 1720.1-2010 [22,27,28].
The effects of thinning on plantation grown Eucalyptus wood properties are variable. Thinning at age 6 years had no effect on the MOE and MOR of sawn boards from a 22-year-old Eucalyptus nitens plantation [29]; however, this thinning did result in an increased microfibril angle (MFA) corresponding to a lower stiffness [30]. In Chile, thinning of E. nitens at age 6 years had no effect on the basic density of boards from trees harvested at age 15 years [31], but a lower intensity thinning regime (i.e., 700 stems ha−1 vs. 500 to 300 stems ha−1) at age 7–9 years resulted in a higher MOE at age 15 years but little change in basic density [32]. In the case of Eucalyptus globulus, thinning at age 2 years had no effect on air dry density, MOE or MFA at age 10 years [33]; however, later thinning of E. globulus at age 8 years resulted in decreased wood density and increased MFA at age 13 years [34]. Such variability in the effects of thinning on wood properties makes it difficult to recommend optimal silvicultural thinning treatments for hardwood plantations. While the above-mentioned studies were undertaken at sites ranging from 120 to 340 m above sea level, it remains unclear how higher elevations may interact with thinning treatments to affect wood properties, as well as the consistency of the effects of thinning treatments on wood properties across sites of contrasting environments. This is particularly important given the diverse environments and broad elevation range across which E. nitens is planted and the impact that site characteristics, such as elevation and precipitation, have on wood properties [35,36].
Acoustic Wave Velocity (AWV) is a non-destructive technique that can be used as a predictor of MOE [23,37,38,39]. There are two ways of measuring AWV, resonance and time of flight, that are used for logs and boards and standing trees, respectively [40]. Time of flight AWV has been shown to be a reliable predictor of stiffness in E. nitens and has been used in tree breeding programs [23,41,42]. The technique also allows for the relatively rapid testing of a large number of standing trees and has been used to test thinning effects on softwoods [43,44,45,46] and hardwoods [47].
Drilling resistance offers an accurate, fast and non-destructive approach for assessing basic density [48,49]. Although initially developed to detect internal defects in trees, poles and structural timber [50,51,52], this technique has also been used to evaluate basic density, for example, in standing eucalypts [53,54] and Pinus radiata [55], and also to evaluate radial variation [55,56]. In E. nitens, drilling resistance was able to explain 62% to 92% of the variance in basic density [53,57,58]. Calibration and post-processing of drilling resistance data are needed to obtain basic density values [53]. To obtain accurate drilling resistance values, a correction must be applied to account for frictional drag [53,58,59,60,61]. The drilling resistance method also allows the testing of many trees relatively quickly and has been used to assess thinning effects on Taiwania cryptomeribides [62]. The combination of both AWV and drilling resistance allows rapid, non-destructive estimation of tree MOE. For example, Lai, et al. [63] used wood density obtained with a non-destructive method and acoustic wave velocity to estimate MOE. The MOE prediction can be improved when wood density and AWV are used in combination [64,65,66,67].
In this study, stiffness and basic density following thinning in E. nitens plantations were assessed using non-destructive wood testing techniques. The aim was to understand how different thinning regimes affect wood properties and how consistent the effects of thinning treatment are across different sites. Specifically, the objectives were to:
(1)
Examine whether commercial thinning affects tree size, stiffness and basic density of E. nitens and whether these effects vary across three different sites;
(2)
Determine whether commercial and non-commercial thinning affects tree size, stiffness and basic density differently and whether these effects vary across two different sites;
(3)
Determine if there is a difference in tree size and wood properties between two commercial thinning treatments across two different sites.

2. Materials and Methods

2.1. Site Description

Three E. nitens plantations established at a stocking of 1100 trees ha−1 in the late 1990s, at Urana, Florentine and Gads in Tasmania, Australia, were used for this study (Table 1). Eucalyptus nitens grown in Tasmania originate from a single region on mainland Australia, the Central Highlands of Victoria [68]. The plantations were established using standard nursery stock from an open pollinated seed source. All sites had previously supported native wet eucalypt forests. Experimental trials were imposed with the aim of improving existing growth models to better understand the silvicultural and economic implications of pruning and thinning operations. Urana is in north-east Tasmania. The plantation had an understory dominated by a mixture of Zieria arborescens and Ozothamnus ferrugineus. Florentine is in south-west Tasmania with a dense understory of dogwood (Pomaderris apetala). Both sites are at about 400 m above sea level (asl). Gads Hill is at 700 m asl in north-west Tasmania; the understory was dominated by snow grass (Poa labillardierei).

2.2. Experimental Design and Thinning Treatments
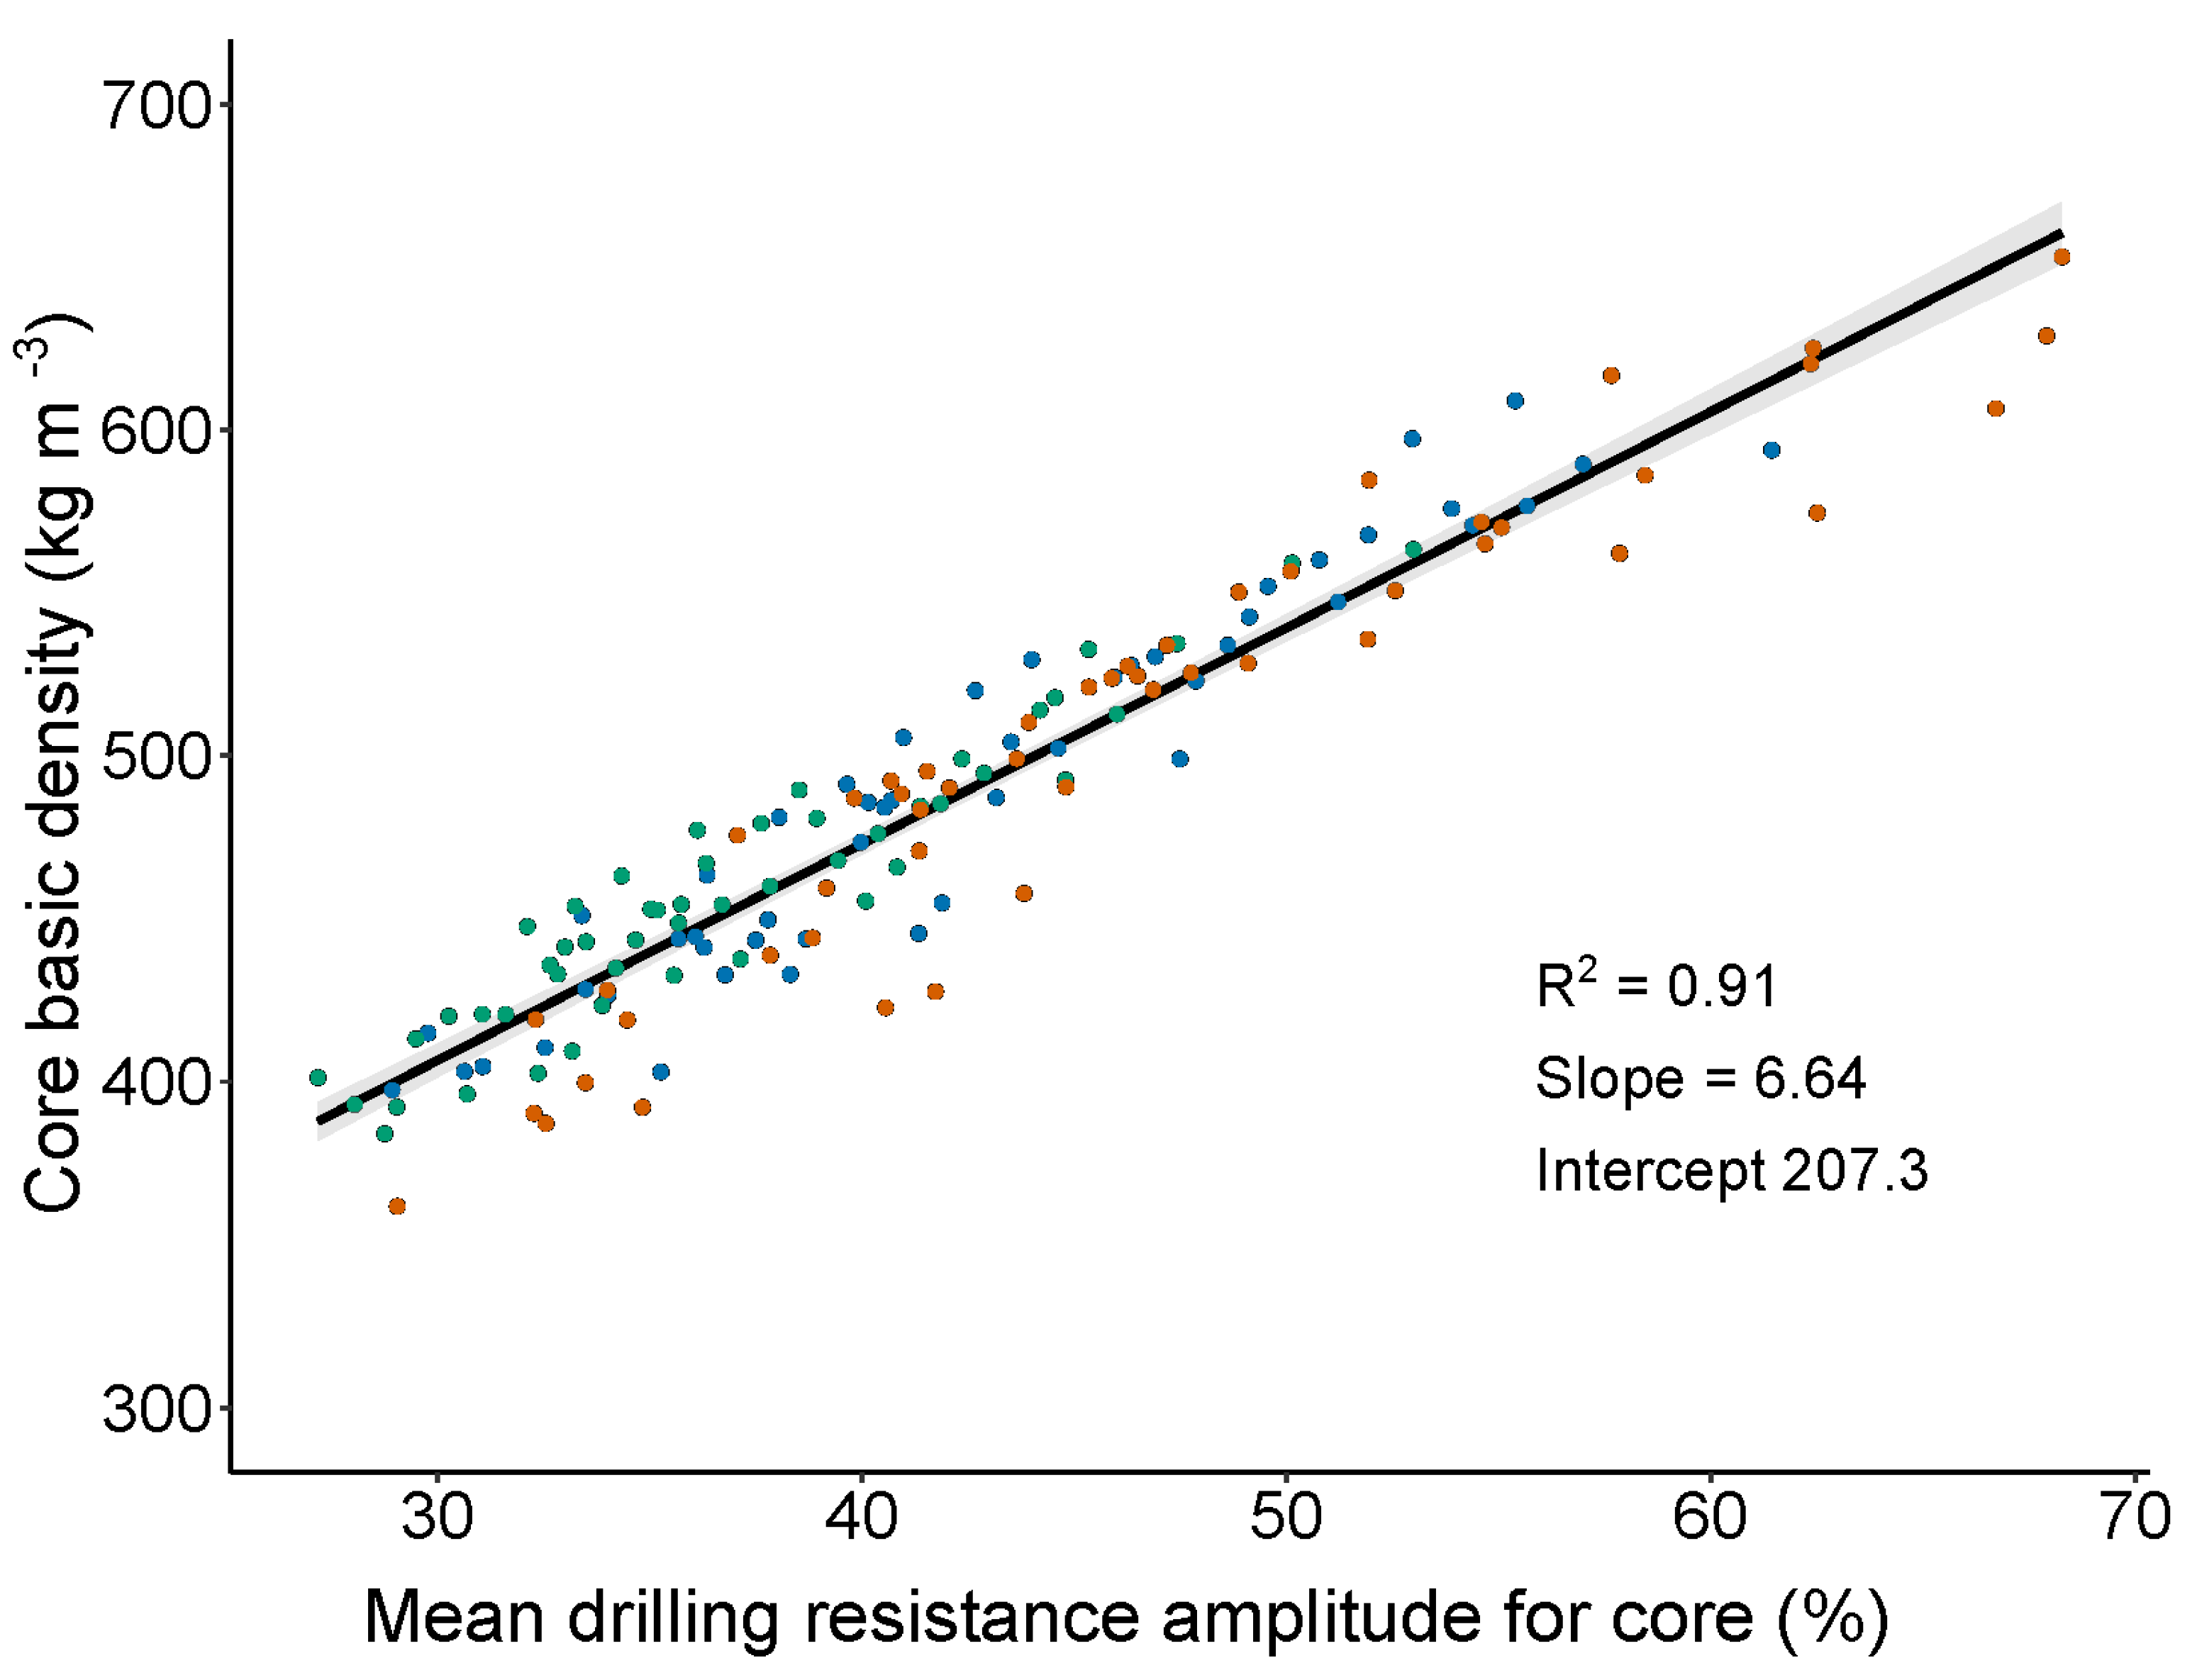
Between the ages of 3–5 years, the best, straight, dominant and codominant trees (300 trees ha−1) at all three sites were pruned in three stages to a maximum height of 6.5 m. Four thinning treatments were then applied (Table 2): unthinned (control); commercial thinning to 300 trees ha−1 (EC300) and 500 trees ha−1 (EC500) at age 8 or 9 years, and non-commercial thinning to 300 trees ha−1 (EW300) at age 4 or 5 years. The control and EC300 treatments were performed at all three sites; control and EW300 at Urana and Gads; and control and EC500 at Urana and Florentine. There were between two and four replicates of each treatment; replicate areas were approximately 0.08 ha at Urana and Florentine, and 0.06 ha at Gads. All replicates were located between windrows and surrounded by at least one buffer row, and each had between 13 and 70 trees at time of measurement and the total number of trees tested per treatment is in Table 2. Thinning at all sites was from ‘below’, where small and defective trees were removed. Thinning at Urana was done by first creating six-row blocks with two rows having been removed on either side and then thinning within the retained rows; at Florentine and Gads, all rows were thinned. Mortality in the ca. 15-year period between the time of thinning and measurement varied between 0% and 25% in the thinned treatments. In the controls, mortality varied between 7% and 44%; at the Urana site, stocking in the control was reduced from 1126 to 579 trees ha−1, while at Florentine and Gads the decrease in stocking of the control due to mortality was relatively small.

2.3. Assessments

Diameter at breast height (1.3 m; DBH) was measured at all sites in April–May 2018. Trees damaged at thinning, with pronounced fork or with severe lean (>15°) were not measured or assessed for wood properties.
In April–May 2018, drilling resistance on standing trees at 1.3 m above ground level (breast height) was measured using an IML Resi PD 400 instrument (referred to as Resi from here on). Trees across the sites were measured in the same season to minimize the potential effect of temperature and potential moisture content variation. Previous work has explored the effect of moisture content on resistance readings, and values above fiber saturation point have been found to contribute little to the variance [69,70]. The point of entry into the stem was perpendicular to the direction of lean or, if the tree was vertical, to prevailing wind direction based on wind roses from the nearest weather stations at St Helens, Strathgordon village and Burnie [71] for Urana, Florentine and Gads, respectively. The Resi sampling conditions were 150 cm min−1 speed of forward feed and 3500 rpm, which have been identified as optimal for plantation eucalypts [53]. Resi frictional drag was accounted for using the semi-non-linear friction correction [58]. To examine the strength of the relationship between drilling resistance amplitude and basic density, the mean drilling resistance amplitude for the 50 mm long trace on the entry side was compared with basic density measurements on the same-length wood cores. Cores were taken as close to the Resi entry point as possible and were extracted using a 5 mm diameter manual corer. To ensure a maximum range in drilling resistance amplitude, 50 trees at each site were selected based on their average Resi drilling resistance amplitude. The drilling resistance traces were stratified to choose trees that provided a uniform distribution over the density range. Core basic density was determined using the test method described in AS/NZS 1080.3:2000 [72]. Green volume of the cores was measured in the laboratory using the water displacement method [73]. Oven dry mass was measured after oven drying of the wood at 103 ± 2 °C until the sample reached constant mass. The basic density of the cores was calculated as the ratio of oven dry mass (kg) to green volume (m3).
As a first step, it was important to determine the parameters to calculate basic density. There was a strong linear relationship between the basic density of the 50 mm length core and the same length Resi trace. As there were no differences in slope and no significant interactions between sites (ANCOVA F2, 144 = 0.04, p = 0.67), all data were pooled and the regression parameters from the three sites were used to calculate basic density (Figure 1).
The slope and intercept obtained from the regression relationship between core basic density and Resi drilling resistance amplitude were used to calculate tree mean area weighted basic density from cambium to pith using the platform https://forestquality.shinyapps.io/FQ_ResiProcessor/ (accessed on 21 July 2021) [53].
Acoustic Wave Velocity (AWV) was measured with a Director ST-300 (Fibregen, Christchurch, New Zealand) on the same and opposite sides of the tree to that used for drilling resistance. The bottom and top probes were placed, respectively, approximately 0.5 m and 1.7 m above ground level. Measurements across all three sites were conducted in September–October 2018; the mean air temperatures during measurement were 10.3, 6.8 and 8.3 °C at Urana, Florentine and Gads, respectively. The MOE in MPa of standing trees was estimated using the model [63]:
MOE = ρ ∙ v2,
where ρ is the area weighted basic density obtained from Resi (kg m−3) and v is the mean squared AWV (km s−1) from both sides of the tree measured with the Director ST-300.

2.4. Statistical Analyses

To test the objectives of the study, three individual models were run. The first (objective 1) assessed commercial thinning to 300 trees ha−1 (EC300) vs. the unthinned control treatment at Urana, Florentine and Gads; the second (objective 2) assessed non-commercial and commercial thinning to 300 trees ha−1 (EC300 and EW300) vs. the unthinned control at Urana and Gads; and the third (objective 3) assessed commercial thinning to 500 and to 300 trees ha−1 (EC500 and EC300) vs. the unthinned control at two sites; Urana and Florentine. All three models were a linear mixed-effects model that compared the effects of treatment and site on DBH, AWV, basic density and MOE using the “lmer” function in the lme4 package [74] by fitting the following model:
y = µ + treatment + site + pruning + treatment × site + treatment:replicate + site:replicate + site:treatment:replicate + residual,
where y is the response of DBH, AWV, basic density and MOE, µ is the overall mean, and treatment and site and treatment by site interaction are fixed effects. The random effects are the treatment within replicate, site within replicate and site within treatment within replicate as denoted by italics. As some trees within treatments were not pruned as part of normal operational practice, pruning (presence/absence) was fitted as a covariate (and, hence, not included in the interaction terms). In all cases, the addition of the pruning covariate did not change significance nor the effect size of the fixed effect, regardless of whether pruning was significant or non-significant. All statistical analyses were undertaken using R [75]. Model assumptions of normality and homoscedasticity as well as overdispersion were statistically and visually assessed using simulated residuals from the fitted model with the DHARMa R package [76] following Zuur and Ieno [77]. No deviations of model assumptions were detected. Statistical significance of the fixed effects was assessed using a Type III F test where the denominator degrees of freedom were estimated using the Kenward–Roger approximation with the “anova” function of the lmerTest R package [78]. Least-square means and their standard errors estimated from the fitted models were calculated using the emmeans R package [79].

3. Results

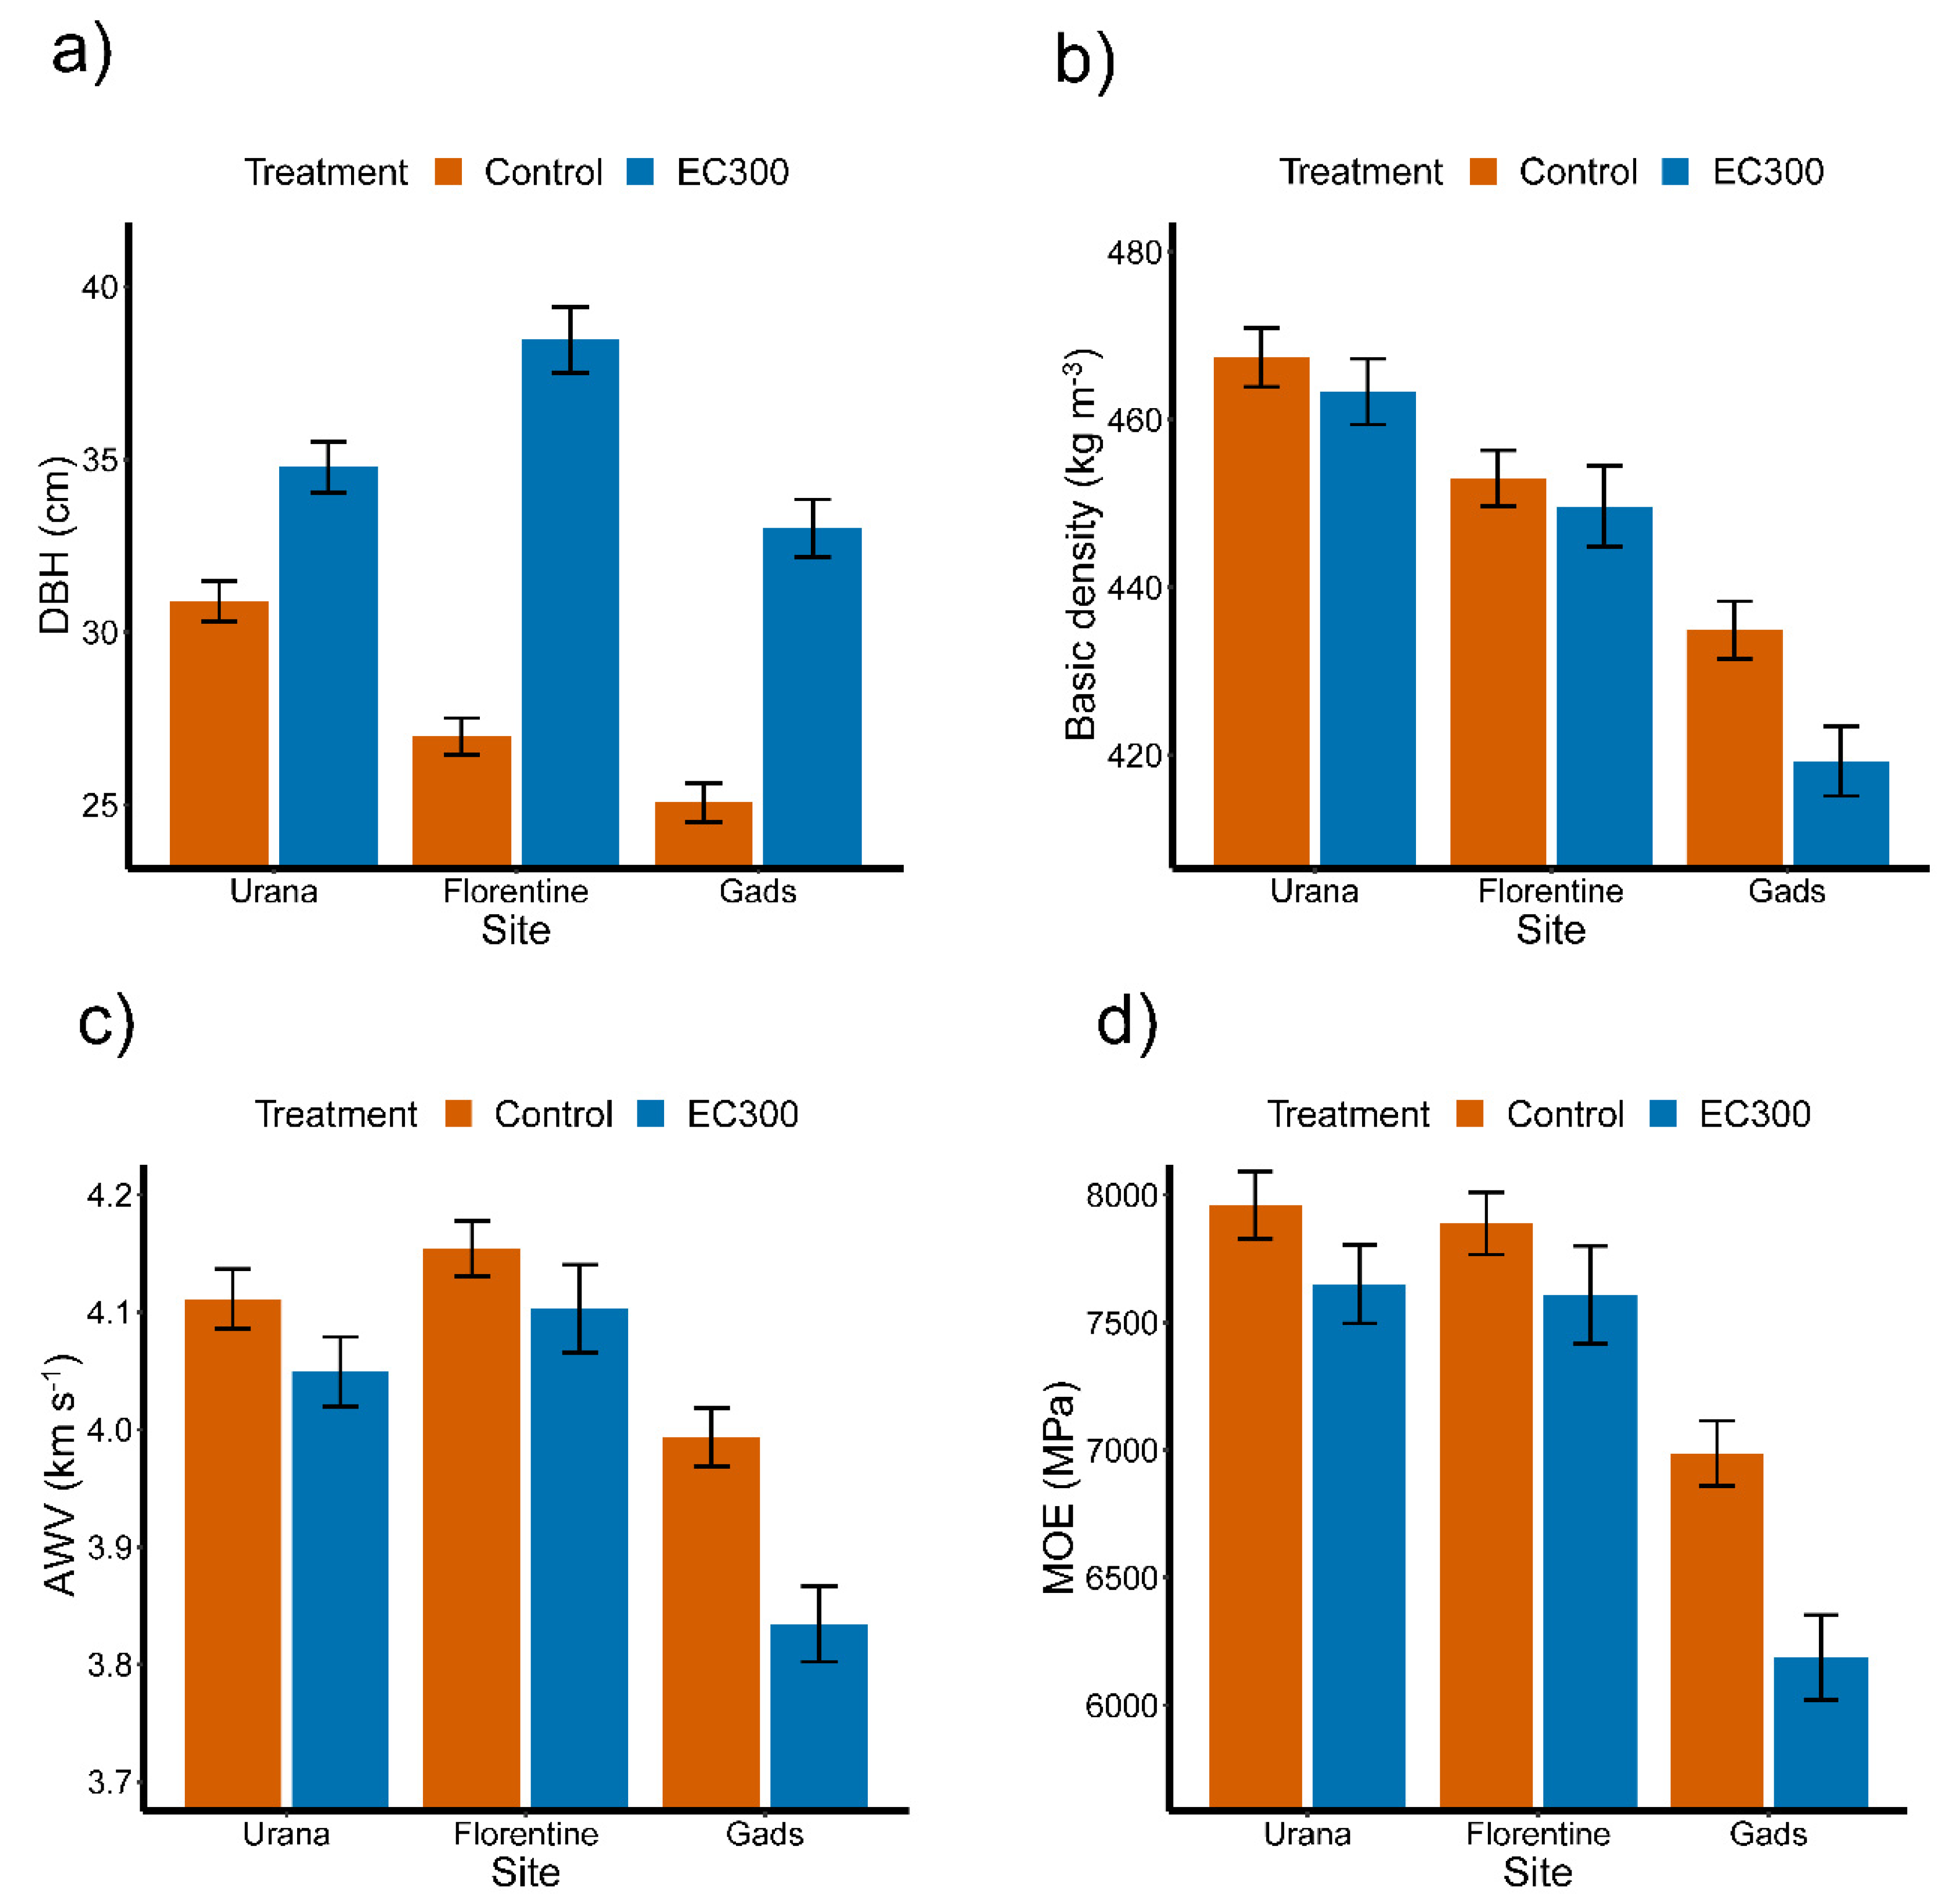
3.1. Commercial Thinning (EC300) vs. Control across Three Sites

Both thinning and site had significant effects on tree size. Mean diameter (DBH) was significantly smaller at Gads than at Urana and Florentine and thinning resulted in significantly larger trees (Figure 2a). However, the effects of thinning treatment on tree size were not consistent across all three sites, as there was a significant thinning by site interaction (Table 3). Thinning at Florentine resulted in a larger diameter response (42.5% greater than the Control) than at Urana (12.6%) and Gads (31.6%) (Figure 2a).
Commercial thinning had no effect on basic density (Table 3). Site had a significant effect on basic density, which was lower at Gads than at Urana and Florentine (Figure 2b) and there was no thinning by site interaction (Table 3).
Acoustic Wave Velocity was significantly lower in the EC300 than in the Control treatment (Table 3); while the largest reduction in AWV due to thinning was 4% at Gads followed by 1.5% at Urana and 1.2% at Florentine (Figure 2c). Acoustic Wave Velocity significantly differed among the three, with Gads showing significantly lower AWV than Urana or Florentine (Figure 2c). There was no thinning by site interaction (Table 3), indicating that the effects of thinning on AWV were consistent across the sites.
The EC300 treatment also had a significant effect on MOE (Table 3). Thinning reduced tree MOE by 3.9% at Urana, 3.5% at Florentine and 11.5% at Gads (Figure 2d). Site had a significant effect on MOE; MOE at Gads, 6564 MPa, was about 15% lower than at Urana and Florentine (Figure 2d). The effects of thinning on MOE were consistent across the sites (Table 3).

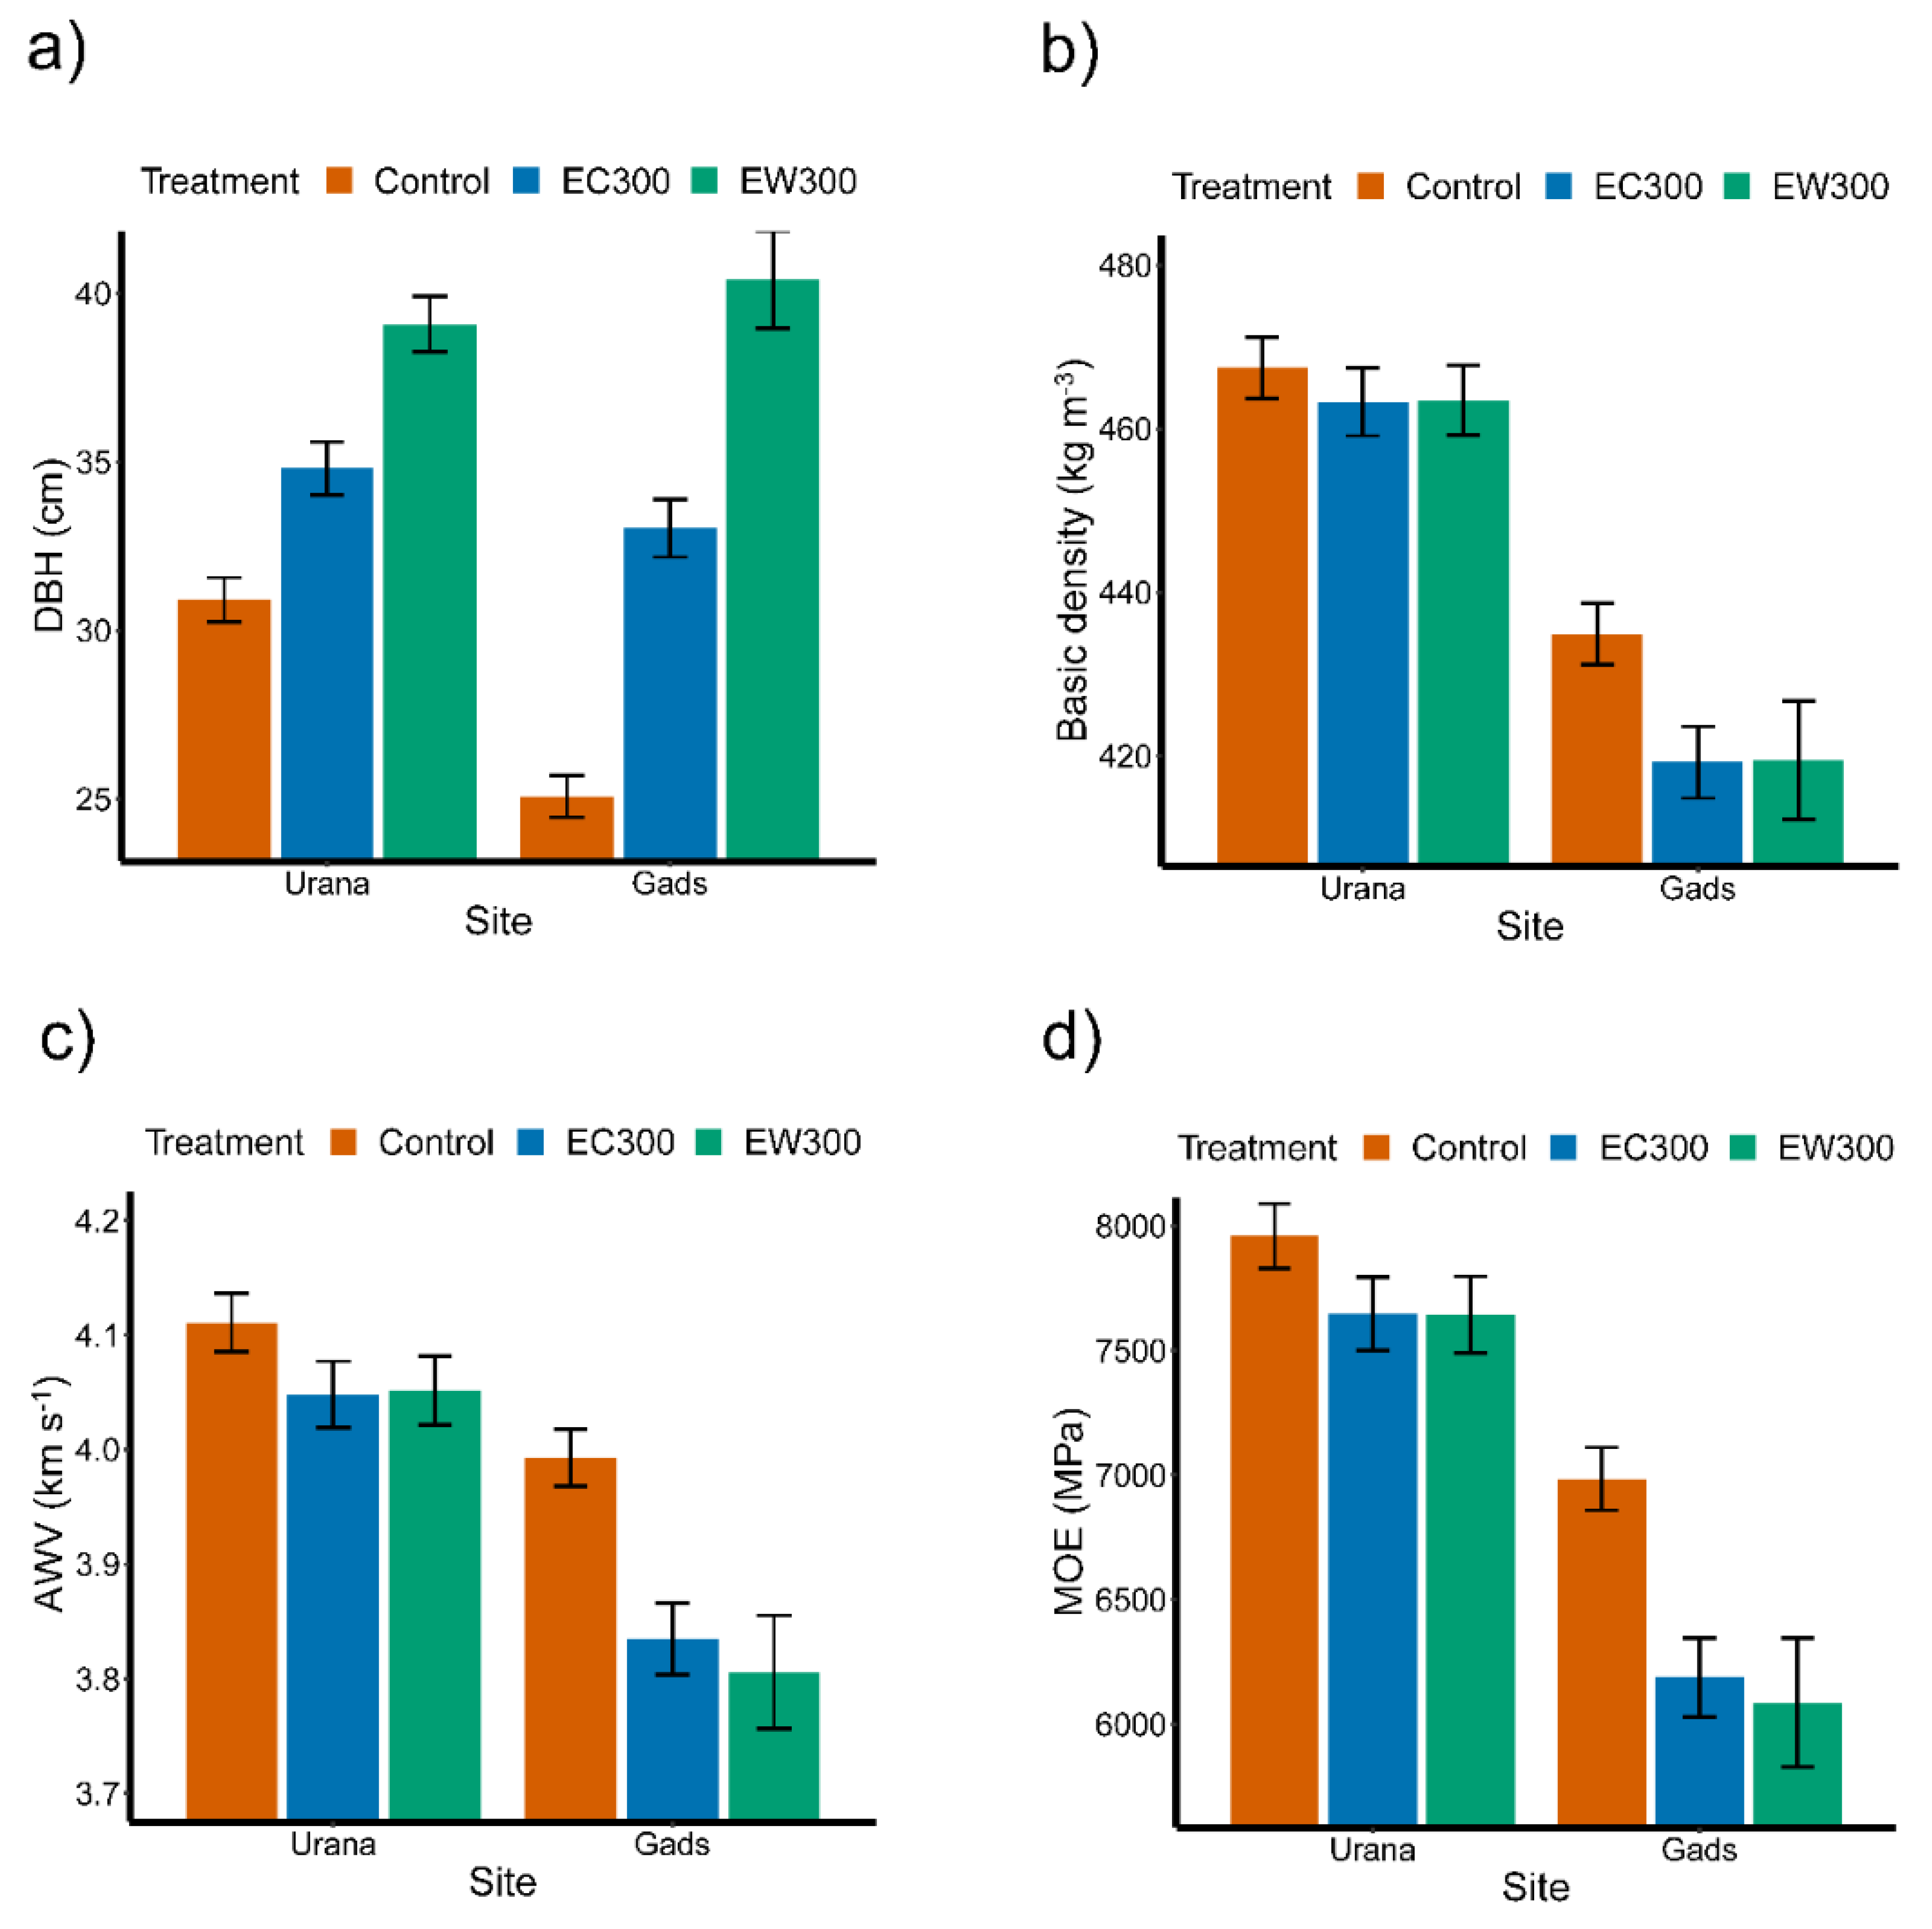
3.2. Commercial (EC300) and Non-Commercial (EW300) Thinning vs. Control at Urana and Gads

Both thinning and site had significant effects on DBH, which was smaller at Gads than at Urana, and was significantly different across all the treatments but lowest in the control. There was a significant interaction between thinning and site (Figure 3a), where differences in DBH due to treatment were greater at Gads than Urana (Figure 3a).
Thinning treatment had no effect on basic density (Table 4, Figure 3b). Site had a significant effect on basic density, which was 8.6% lower at Gads than Urana and there was no thinning by site interaction (Figure 3b).
Both thinning and site had a significant effect on AWV (Table 4); thinning treatment resulted in a lower AWV, but there was no difference between the EC300 and EW300 treatments. AWV was lower at Gads than Urana (Figure 3c). There was no thinning by site interaction, indicating the effects of thinning on AWV were consistent across the two sites.
Similarly, thinning and site had a significant effect on MOE (Table 4). As with AWV, thinning reduced MOE and there was no difference between the EC300 and EW300 treatments (Figure 3d). MOE was significantly lower at Gads than Urana. The thinning effects on MOE were consistent across the two sites.

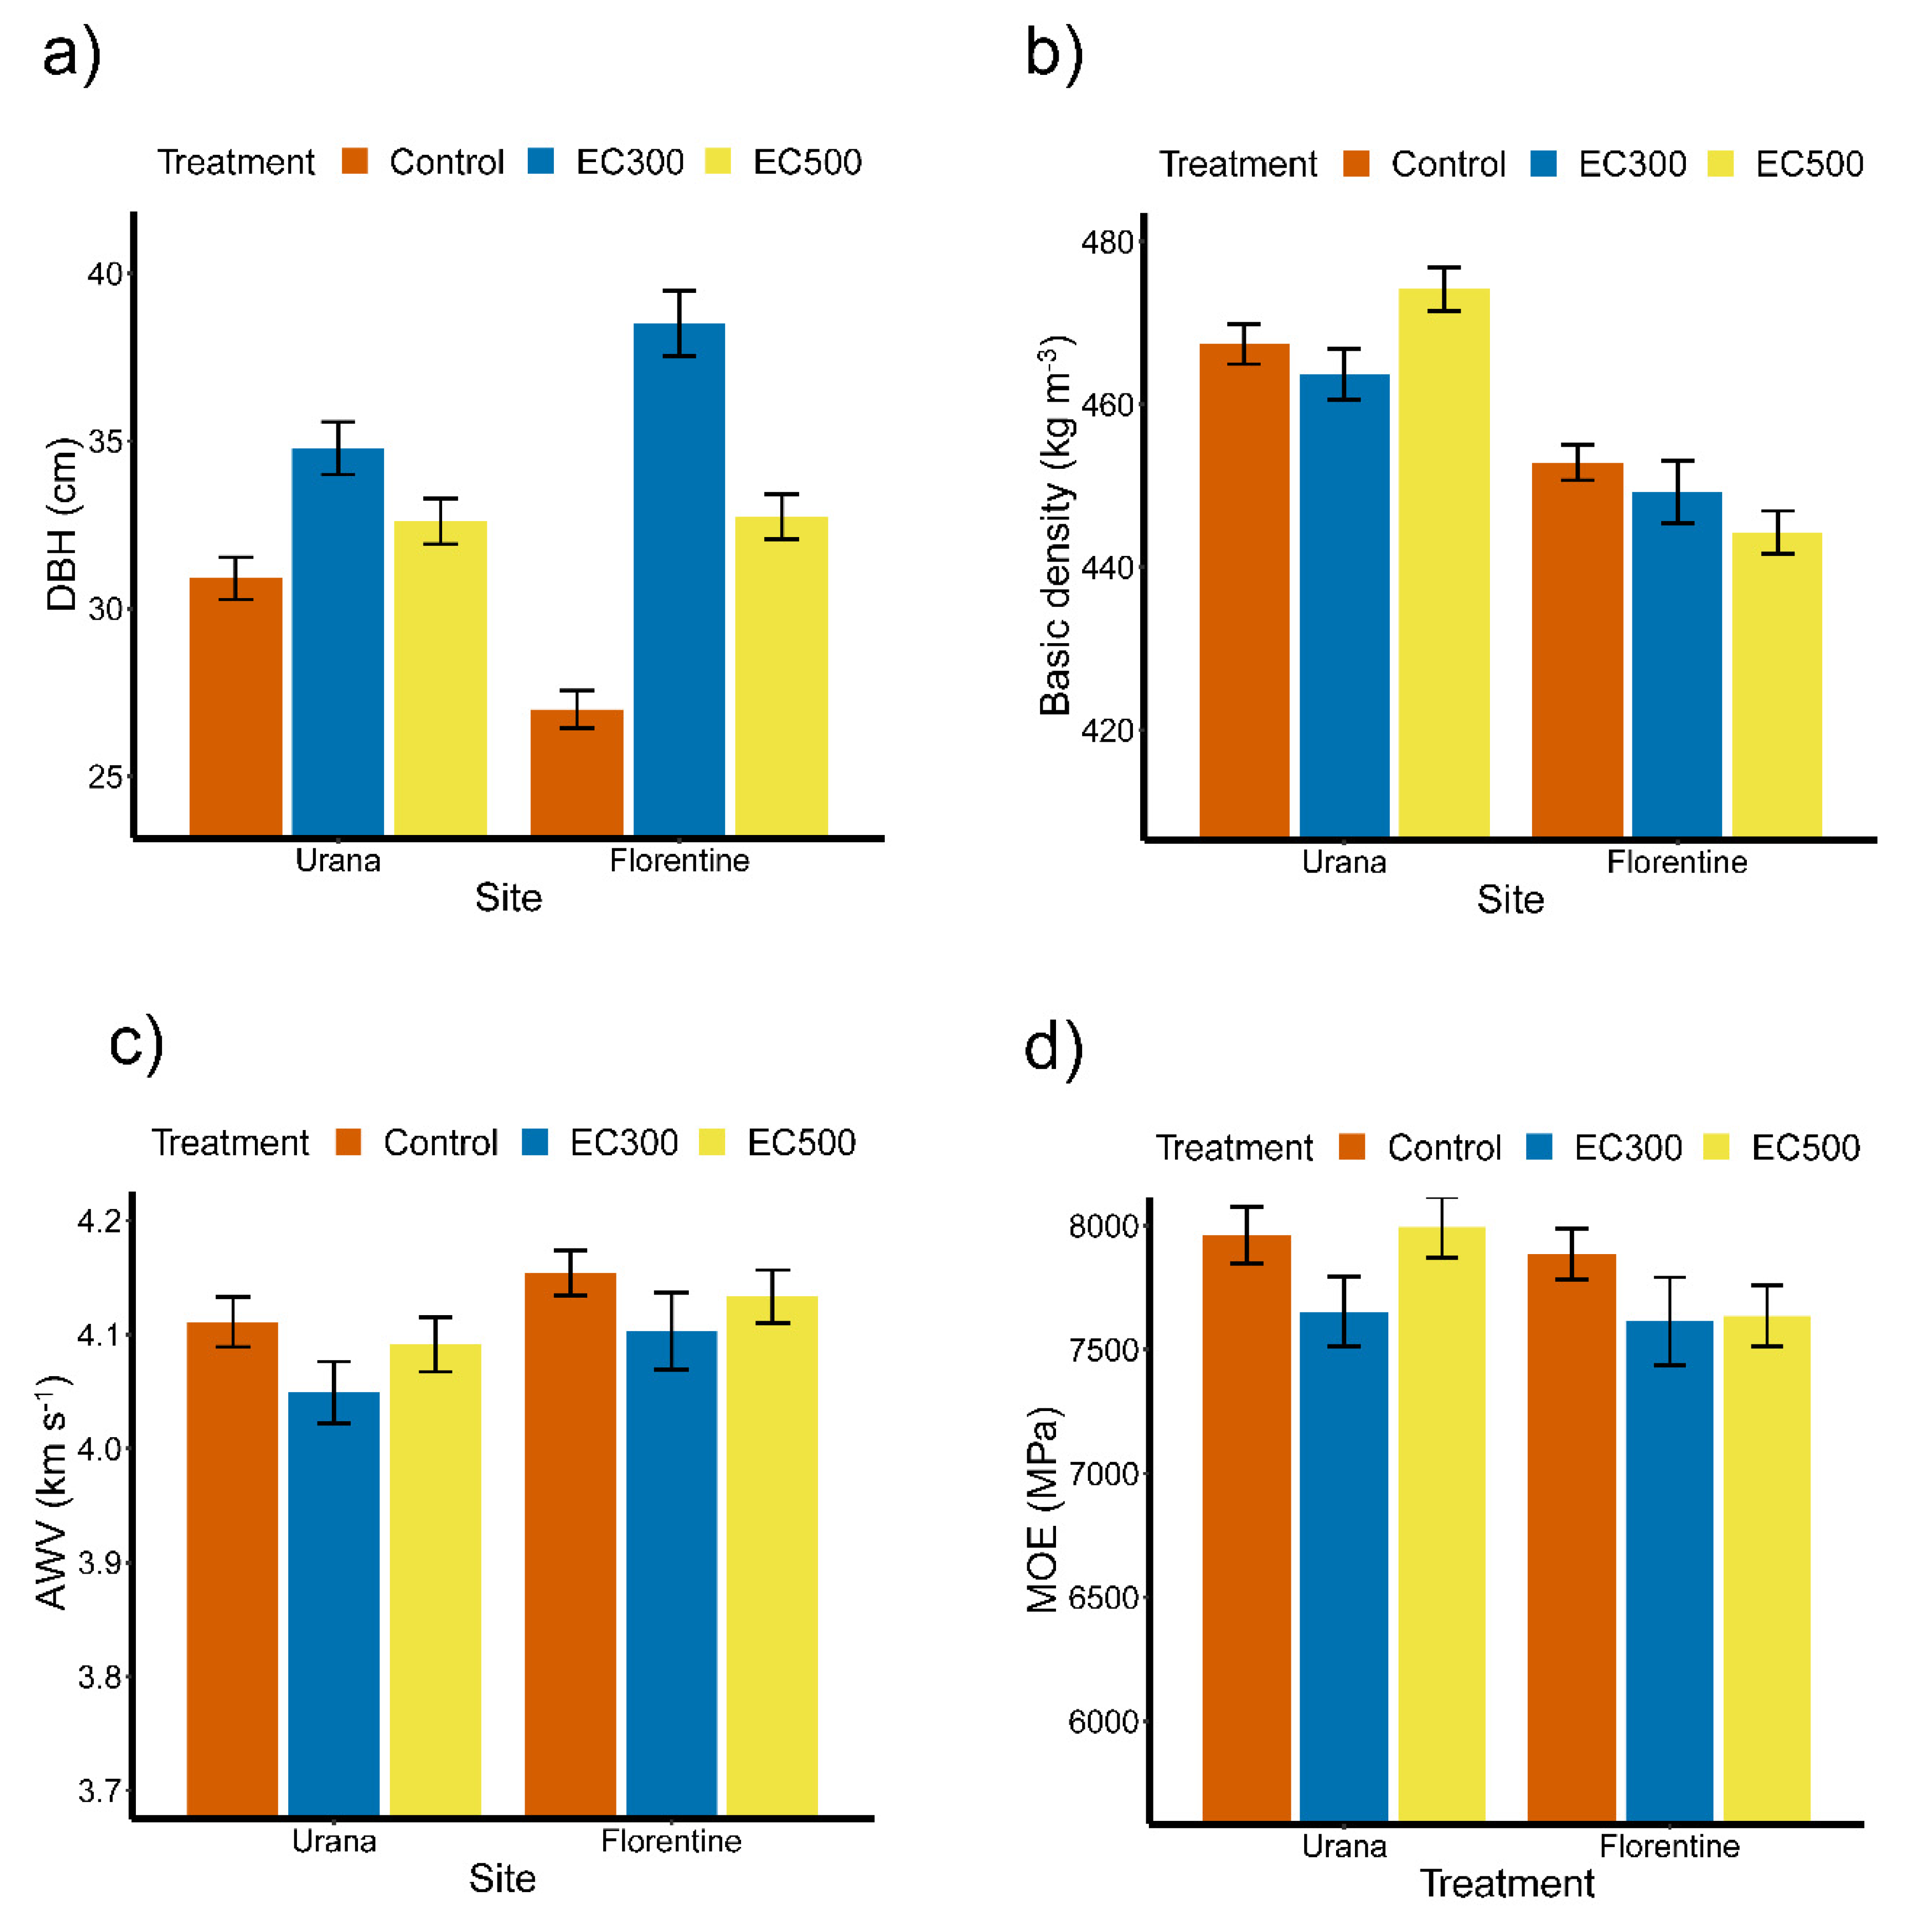
3.3. Commercial Thinning (EC300 and EC500) vs. Control at Urana and Florentine

Thinning had a significant effect on DBH; DBH was smaller in the Control than in the thinned treatments, and smaller in the EC500 than in the EC300 treatment. Site had no effect on DBH (Table 5). However, there was a significant thinning by site interaction. The response to thinning was greater at Florentine than Urana (Figure 4a).
Thinning had no effect on basic density. Site had a significant effect on basic density, which was 4.3% greater at Urana than Florentine (Figure 4b). However, there was a marginal thinning by site interaction (Table 5).
Thinning had no effect on AWV (Table 5 and Figure 4c). Site had a significant effect on AWV which was greater at Florentine than Urana and there was no thinning by site interaction.
Neither thinning nor site had a significant effect on MOE and there was no thinning by site interaction (Table 5 and Figure 4d).

4. Discussion

This study examined the effects of different thinning regimes on wood properties of E. nitens across different sites. The thinning of three stands had significant effects on wood stiffness (AWV and MOE) and these effects were stable across sites. While the effects of thinning on increasing tree volume have been well documented [2,21,80] and are also supported here, this is the first time the consistency of thinning regimes across various sites has been tested on wood properties of E. nitens. Thinning reduced the stiffness of standing trees. This suggests that if the silvicultural treatment of thinning is to be utilized to improve tree volume, consideration may need to be given to the possible trade-offs with wood quality, especially stiffness. The observed reductions in MOE due to thinning ranged from 3.5% to 11.5% and, based on Australian stress grade standards [28], this magnitude in reduction should not affect the classification of the product at point of sale, as the change in stiffness is not large enough. For example, the difference from stress grade F17 to grade F14 in MOE values is 14.3% while the difference from F14 to F11 is 12.5%. The largest effect on wood stiffness values in this study was due to site differences where there was a 17.2% reduction in MOE due to site. This large reduction could well result in a product failing to meet a particular stress grade class, illustrating the importance of site selection for certain tree and wood traits. As opposed to stiffness, it seems that thinning has no observable influence on basic density as suggested by this and other studies of E. nitens [30,31,32]; however, basic density does vary across sites.
Basic density and stiffness were consistently lower at Gads (700 m elevation and with the highest rainfall), than at Urana and Florentine at 400 m. The pattern of decreasing basic density with increasing elevation and its associated factors, such as colder temperature and higher precipitation, for E. nitens in Tasmania was also observed in previous studies [22,35,36,81]. Similarly, softwoods have been found to have lower basic density on sites grown at higher elevations [46,82,83,84,85,86]. Thus, basic density appeared to be inversely related to elevation in this study; however, there was only a single site at this elevation. Similarly, stiffness or MOE might also be related to elevation where in previous studies with E. nitens, MOE decreased with increasing elevation [36,81], and plantations grown at lower elevations and rainfall had higher stiffness (MOE) compared to higher elevations and rainfall [22]. Similarly in softwoods, there was an observed negative relationship between elevation and MOE for Picea abies [84] and Picea sitchensis [82,83].
There was no evidence of a significant difference in the wood properties measured on trees between the commercially (EC300) and non-commercially (EW300) thinned stands applied at Urana and Gads. This suggests trees can be grown larger without a corresponding reduction in wood quality when thinned earlier. In Tasmania, commercial thinning is performed when trees are large enough to allow a commercial pulpwood harvest and an early financial return before the main crop is ready for harvest [17,18,19]. However, the financial benefits to delay thinning until stems reach commercial size may be counter-productive and early non-commercial thinning may be more economically viable over the rotation [12,87]. The price per unit volume increases with various threshold log sizes, and the magnitude of each price increment also increases with log size [1]. For example, the minimum small end diameter for sawlog is 350 mm, cross laminated timber product is 300 mm, domestic peeler log is 180 mm, and export peeler log is 150 mm (Williams pers. comm., 2021). In this study the commercially thinned trees had an average diameter of 350 mm at breast height (1.3 m above ground) while non-commercially thinned trees were 400 mm. A 50 mm difference in diameter would result in a log meeting size specifications for the next larger class. Therefore, by the end of the rotation, from non-commercially thinned trees it would be possible to produce a higher quantity of more valuable logs.
Thinning to 300 trees ha−1 reduced stiffness across the three sites, Urana, Florentine and Gads, consistently with various magnitudes. Thinned E. nitens at the high elevation site (Gads) exhibited a significant reduction in stiffness relative to the unthinned control. However, despite a slight reduction in stiffness between the two low elevation sites (Urana and Florentine), this reduction was not statistically significant. This suggests that thinning might have a small or no affect at lower elevation sites for E. nitens similarly as reported in other studies [29,30,31].
Both thinning and site had a significant effect on wood growth; however, there was a consistent significant interaction between thinning and site for tree DBH. This interaction can be attributed to the control stand at the Urana site where the trees were the largest. Control treatments at Urana experienced heavy self-thinning, such that by the time of final measurement, the stand density in the control stand was around 600 trees ha−1 while the control treatments at Florentine and Gads were well above 900 trees ha−1. This self-thinning occurred at Urana earlier than at Florentine because the Urana site was more productive, and trees started to die because of more intense competition compared to Florentine and Gads. This could also explain the different rate of thinning response across the three sites. The greatest response to thinning at the Florentine site for EC300 thinning was due to the fact that the EC300 treatment had slightly lower stocking, which was 283 trees ha−1 compared to 316 and 315 trees ha−1 at Florentine and Gads, respectively. That is probably why EC300 treatment had the largest trees at Florentine.
Thinning to 500 trees ha−1 produced the largest basal area per hectare but thinning to 300 trees ha−1 resulted in greater individual tree diameters, which can lead to greater efficiency in processing. By thinning to 300 trees ha−1, there can be more upper logs available for processing because of their larger size, which tend to have greater stiffness and basic density [88,89,90]. Larger trees are also more suitable for quarter-sawing, which has a positive impact on processing, drying and sawn material recovery [91].

5. Conclusions

Commercial thinning to 300 trees ha−1 led to trees having lower stiffness and the effect of thinning on tree stiffness across three contrasting sites was consistent. This reduction in stiffness due to thinning was small except at the high elevation and high precipitation Gads site. Thinning did not affect basic density, and non-commercial thinning to 300 trees ha−1 resulted in larger trees without any effect on wood properties. Commercial thinning to 500 trees ha−1 had no effect on wood quality. Trees grown at the Gads site had lower basic density and stiffness and the magnitude of the thinning effect seemed greater at this site.

Author Contributions

Conceptualization, V.G., M.N., M.H. and J.O.-W.; data collection, V.G. and G.M.D.; formal analysis, V.G. and P.A.H.; funding acquisition, M.H.; investigation, V.G., M.N., M.H. and J.O.-W.; methodology, V.G., M.N., M.H. and J.O.-W.; project administration, V.G., M.N. and J.O.-W.; supervision, M.N., M.H., A.J. and J.O.-W.; visualization, V.G.; writing—original draft, V.G.; writing—review and editing, V.G., M.N., D.W., M.H., A.J., G.M.D., P.A.H. and J.O.-W. All authors have read and agreed to the published version of the manuscript.

Funding

This research was supported by the Australian Research Council Industrial Transformation Training Centre for Forest Value (grant no. IC150100004).

Data Availability Statement

Data are available from the corresponding author upon reasonable request.

Acknowledgments

We would like to thank Emily Pollington, Meagan Porter, Hugh Fitzgerald, Michelle Balasso, Mingxin Liu, Ibrahim Bourbia, Dalila Pasquini, Manuel Rocha, Hans Ammitzboll for the assistance in the field, Thomas Baker for assistance in the field and statistical support, Mario Vega for statistical advice, Sustainable Timbers Tasmania’s staff Crispen Marunda and Kennedy Kurwaisimba for providing information for the research trials and forest managers John McNamara and David White provided access to the trials, Dale Worledge from CSIRO for lending the Director ST-300 and Chris Beadle for comments on the manuscript.

Conflicts of Interest

The authors declare no conflict of interest.

References

  1. Nolan, G.; Greaves, B.; Washusen, R.; Parsons, M.; Jennings, S. Eucalypt Plantations for Solid Wood Products in Australia—A Review ‘If You Don’t Prune It, We Can’t Use It’; Project No. PN04.3002; Forest & Wood Products Research and Development Corporation: Melbourne, Australia, 2005; pp. 1–130. Available online: https://www.fwpa.com.au/images/resources/PN04.3002.pdf (accessed on 16 August 2021).
  2. Forrester, D.I.; Medhurst, J.L.; Wood, M.; Beadle, C.L.; Valencia, J.C.; Harwood, C. The Effect of Solid-Wood Silviculture on Growth, Form and Wood Properties in Eucalyptus Plantations: An Australian Perspective; Project Number: PNB291-1112B; Forest & Wood Products Australia: Melbourne, Australia, 2013; Available online: https://www.fwpa.com.au/images/processing/PNB291-1112B_Effect_ofSolid_Wood_silviculture.pdf (accessed on 16 August 2021).
  3. Gerrand, A.M.; Medhurst, J.L.; Neilsen, W.A. Research Results for Thinning and Pruning Eucalypt Plantations for Sawlog Production in Tasmania; Forestry Tasmania: Hobart, Australia, 1997; p. xii + 209. [Google Scholar]
  4. Wood, M.; Musk, R.; Volker, P.; Medhurst, J.; Beadle, C. Plantation Grown Eucalyptus Nitens in Tasmania: The Effects of Pruning and Thinning Intensity on Growth and Potential Log Product Recovery after 21 Years; Technical Report 219; CRC for Forestry: Hobart, Australia, 2011. [Google Scholar]
  5. Savill, P.S.; Evans, J. Plantation Silviculture in Temperate Regions with Special Reference to the British Isles; University of Oxford: Oxford, UK, 1986; p. 246. [Google Scholar]
  6. Smith, D.M.; Larson, B.C.; Kelty, M.J.; Ashton, P.M.S. The Practice of Silviculture: Applied Forest Ecology; John Wiley and Sons, Inc.: New York, NY, USA, 1997; p. 537. [Google Scholar]
  7. Cameron, A.D. Importance of early selective thinning in the development of long-term stand stability and improved log quality: A review. Forestry 2002, 75, 25–35. [Google Scholar] [CrossRef]
  8. Wardlaw, T.; Plumpton, B.; Walsh, A.; Hickey, J. Comparison of sawn timber recovery and defect levels in Eucalyptus regnans and E. globulus from thinned and unthinned stands at Balts Road, Tasman Peninsula. Tasforests 2004, 15, 99–109. [Google Scholar]
  9. Washusen, R.; Clark, N. Integration of sawn timber and pulpwood production. In New Forests—Wood Production and Environmental Services; CSIRO: Canberra, Australia, 2005; pp. 185–208. [Google Scholar]
  10. McKenzie, H.; Hawke, A. Growth response of Eucalyptus regnans dominant trees to thinning in New Zealand. N. Z. J. For. Sci. 1999, 29, 301–310. [Google Scholar]
  11. Haygreen, J.G.; Bowyer, J. Forest Products and Wood Science: An Introduction; Iowa State University Press: Ames, IA, USA, 1982; p. 495. [Google Scholar]
  12. Cassidy, M.; Palmer, G.; Glencross, K.; Nichols, J.D.; Smith, R.G.B. Stocking and intensity of thinning affect log size and value in Eucalyptus pilularis. For. Ecol. Manag. 2012, 264, 220–227. [Google Scholar] [CrossRef]
  13. Candy, S.G. Growth and yield models for Eucalyptus nitens plantations in Tasmania and New Zealand. Tasforests 1997, 9, 167–194. [Google Scholar]
  14. LaSala, A.; Dawson, J.; Goodwin, A. Productivity and economic implications of various silvicultural thinning regimes in Tasmanian regrowth eucalypt forests. Tasforests 2004, 15, 19–28. [Google Scholar]
  15. Acuna, M.; Strandgard, M.; Wiedemann, J.; Mitchell, R. Impacts of Early Thinning of a Eucalyptus globulus Labill. Pulplog Plantation in Western Australia on Economic Profitability and Harvester Productivity. Forests 2017, 8, 415. [Google Scholar] [CrossRef] [Green Version]
  16. Shield, E. New silviculture for producing eucalypt sawlogs. For. Rev. 2008, 35, 6–13. [Google Scholar]
  17. Wood, M.; McLarin, M.; Volker, P.; Syme, M. Management of eucalypt plantations for profitable sawlog production in Tasmania, Australia. Tasforests 2009, 18, 117–121. [Google Scholar]
  18. Candy, S.; Gerrand, A. Comparison of financial returns from sawlog regimes for Eucalyptus nitens plantations in Tasmania. Tasforests 1997, 9, 35–50. [Google Scholar]
  19. Beadle, C.; Medhurst, J.; Forrester, D. Linking silvicultural management to solid-wood values. In Developing a Eucalypt Resource: Learning from Australia and Elsewhere; Wood Technology Research Centre, University of Canterbury: Christchurch, New Zealand, 2011; pp. 77–92. [Google Scholar]
  20. Sustainable Timber Tasmania. Forest Management Plan; Sustainable Timber Tasmania: Hobart, Australia, 2019; Available online: https://www.sttas.com.au/sites/default/files/media/documents/plans/Forest%20Management%20Plan%20Oct%202019.pdf (accessed on 16 August 2021).
  21. Medhurst, J.; Beadle, C.; Neilsen, W. Early-age and later-age thinning affects growth, dominance, and intraspecific competition in Eucalyptus nitens plantations. Can. J. For. Res. 2001, 31, 187–197. [Google Scholar] [CrossRef]
  22. Blackburn, D.; Vega, M.; Yong, R.; Britton, D.; Nolan, G. Factors influencing the production of structural plywood in Tasmania, Australia from Eucalyptus nitens rotary peeled veneer. South. For. J. For. Sci. 2018, 80, 1–10. [Google Scholar] [CrossRef]
  23. Farrell, R.; Innes, T.C.; Harwood, C.E. Sorting Eucalyptus nitens plantation logs using acoustic wave velocity. Aust. For. 2012, 75, 22–30. [Google Scholar] [CrossRef]
  24. Dickson, R.L.; Raymond, C.A.; Joe, W.; Wilkinson, C.A. Segregation of Eucalyptus dunnii logs using acoustics. For. Ecol. Manag. 2003, 179, 243–251. [Google Scholar] [CrossRef]
  25. Baillères, H.; Hopewell, G.; McGavin, R. Evaluation of Wood Characteristics of Tropical Post-Mid Rotation Plantation Eucalyptus Cloeziana and E. pellita: Part (c) Wood Quality and Structural Properties. Resource Characterisation & Improvement; Forest & Wood Products Australia: Melbourne, Australia, 2008; pp. 1–57. Available online: https://www.fwpa.com.au/images/resources/FWPA_PN07.3022_Part%20C_0.pdf (accessed on 16 August 2021).
  26. Standards Australia. Timbers–Classification into Strength Groups. AS/NZS2878:2000; Standards Australia: Sydney, Australia; Standards New Zealand: Wellington, New Zealand, 2000.
  27. Standards Australia. Australian/New Zealand Standard. Plywood–Structural Part. 0: Specifications. AS/NZS 2269.0:2012; Standards Australia: Sydney, Australia; Standards New Zealand: Wellington, New Zealand, 2012.
  28. Standards Australia. Australian/New Zealand Standard. Timber Structures–Part. 1: Design Methods. AS/NZS 1720.1-2010; Standards Australia: Sydney, Australia; Standards New Zealand: Wellington, New Zealand, 2010.
  29. Washusen, R.; Harwood, C.; Morrow, A.; Northway, R.; Valencia, J.C.; Volker, P.; Wood, M.; Farrell, R. Pruned plantation-grown Eucalyptus nitens: Effect of thinning and conventional processing practices on sawn board quality and recovery. N. Z. J. For. Sci. 2009, 39, 39–55. [Google Scholar]
  30. Medhurst, J.; Downes, G.; Ottenschlaeger, M.; Harwood, C.; Evans, R.; Beadle, C. Intra-specific competition and the radial development of wood density, microfibril angle and modulus of elasticity in plantation-grown Eucalyptus nitens. Trees 2012, 26, 1771–1780. [Google Scholar] [CrossRef]
  31. Munoz, F.; Neira, A.; Cancino, J. The effect of thinning on the wood basic density of Eucalyptus nitens (Deane & Maiden) Maiden. Interciencia 2010, 35, 581–585. [Google Scholar]
  32. Bravo, S.D.; Espinosa, M.; Valenzuela, L.; Cancino, J.; Lasserre, J.-P. Effect of thinning on growth and some properties of wood of Eucalyptus nitens in a plantation of 15 years old. Maderas. Cien. Tecnol. 2012, 14, 373–388. [Google Scholar] [CrossRef]
  33. Downes, G.; Harwood, C.; Washusen, R.; Ebdon, N.; Evans, R.; White, D.; Dumbrell, I. Wood properties of Eucalyptus globulus at three sites in Western Australia: Effects of fertiliser and plantation stocking. Aust. For. 2014, 77, 179–188. [Google Scholar] [CrossRef]
  34. Washusen, R.; Baker, T.; Menz, D.; Morrow, A. Effect of thinning and fertilizer on the cellulose crystallite width of Eucalyptus globulus. Wood Sci. Technol. 2005, 39, 569–578. [Google Scholar] [CrossRef]
  35. Balasso, M.; Hunt, M.; Jacobs, A.; O’Reilly-Wapstra, J. Characterisation of wood quality of Eucalyptus nitens plantations and predictive models of density and stiffness with site and tree characteristics. For. Ecol. Manag. 2021, 491, 118992. [Google Scholar] [CrossRef]
  36. Vega, M.; Harrison, P.; Hamilton, M.; Musk, R.; Adams, P.; Potts, B. Modelling wood property variation among Tasmanian Eucalyptus nitens plantations. For. Ecol. Manag. 2021, 491, 119203. [Google Scholar] [CrossRef]
  37. Carter, P.; Briggs, D.; Ross, R.J.; Wang, X. Acoustic testing to enhance western forest values and meet customer wood quality needs. In Productivity of Western Forests: A Forest Products Focus. Gen. Tech. Rep. PNW-GTR-642. USDA Forest Service Pacific Northwest; Research Station: Portland, OR, USA, 2005; pp. 121–129. [Google Scholar]
  38. Blackburn, D.; Vega, M.; Nolan, G. Using acoustic wave velocity to select fibre-managed plantation Eucalyptus nitens logs for laminated veneer lumber products. South. For. J. For. Sci. 2019, 81, 223–234. [Google Scholar] [CrossRef]
  39. Nickolas, H.; Williams, D.; Downes, G.; Tilyard, P.; Harrison, P.A.; Vaillancourt, R.E.; Potts, B. Genetic correlations among pulpwood and solid-wood selection traits in Eucalyptus globulus. New For. 2020, 51, 137–158. [Google Scholar] [CrossRef]
  40. Legg, M.; Bradley, S. Measurement of stiffness of standing trees and felled logs using acoustics: A review. J. Acoust. Soc. Am. 2016, 139, 588–604. [Google Scholar] [CrossRef] [Green Version]
  41. Valencia, J. Application of Non-Destructive Evaluation Techniques to the Prediction of Solid-Wood Suitability of Plantation-Grown Eucalyptus nitens Logs. Master’s Thesis, University of Tasmania, Hobart, Australia, 2008. [Google Scholar]
  42. Blackburn, D.; Hamilton, M.; Harwood, C.; Innes, T.; Potts, B.; Williams, D. Stiffness and checking of Eucalyptus nitens sawn boards: Genetic variation and potential for genetic improvement. Tree Genet. Genomes 2010, 6, 757–765. [Google Scholar] [CrossRef]
  43. Russo, D.; Marziliano, P.A.; Macri, G.; Proto, A.R.; Zimbalatti, G.; Lombardi, F. Does Thinning Intensity Affect Wood Quality? An Analysis of Calabrian Pine in Southern Italy Using a Non-Destructive Acoustic Method. Forests 2019, 10, 303. [Google Scholar] [CrossRef] [Green Version]
  44. Krajnc, L.; Farrelly, N.; Harte, A.M. The effect of thinning on mechanical properties of Douglas fir, Norway spruce, and Sitka spruce. Ann. For. Sci. 2019, 76, 12. [Google Scholar] [CrossRef] [Green Version]
  45. Lowell, E.C.; Turnblom, E.C.; Comnick, J.M.; Huang, C.L. Effect of Rotation Age and Thinning Regime on Visual and Structural Lumber Grades of Douglas-Fir Logs. Forests 2018, 9, 576. [Google Scholar] [CrossRef] [Green Version]
  46. Carson, S.D.; Cown, D.J.; McKinley, R.B.; Moore, J.R. Effects of site, silviculture and seedlot on wood density and estimated wood stiffness in radiata pine at mid-rotation. N. Z. J. For. Sci. 2014, 44, 1–12. [Google Scholar] [CrossRef] [Green Version]
  47. Llana, D.F.; Short, I.; O’Ceallaigh, C.; Harte, A.M. Mechanical Properties Estimation by Non-destructive Testing of Irish Hardwood Round Timber from Thinnings for Construction Purposes. In Proceedings of the 8th Hardwood Conference with Special Focus on New Aspects on Hardwood Utilization-from Science to Technology, Sopron, Hungary, 25–26 October 2018; H-9400 Sopron, University of Sopron, Dept Forestry Policy & Economics: Sopron, Hungary, 2018; pp. 160–161. [Google Scholar]
  48. Bailleres, H.; Lee, D.J.; Kumar, C.; Psaltis, S.; Hopewell, G.; Brancheriau, L. Improving Returns from Southern Pine Plantations through Innovative Resource Characterisation; Project Number: PNC361-1415; Forest & Wood Products Australia: Melbourne, Australia, 2019. [Google Scholar]
  49. Schimleck, L.; Dahlen, J.; Apiolaza, L.A.; Downes, G.; Emms, G.; Evans, R.; Moore, J.; Pâques, L.; Van den Bulcke, J.; Wang, X. Non-destructive evaluation techniques and what they tell us about wood property variation. Forests 2019, 10, 728. [Google Scholar] [CrossRef] [Green Version]
  50. Costello, L.R.; Quarles, S.L. Detection of wood decay in blue gum and elm: An evaluation of the Resistograph [R] and the portable drill. J. Arboric. 1999, 25, 311–318. [Google Scholar]
  51. Johnstone, D.; Tausz, M.; Moore, G.; Nicolas, M. Quantifying wood decay in Sydney bluegum (Eucalyptus saligna) trees. J. Arboric. 2010, 36, 243. [Google Scholar]
  52. Johnstone, D.M.; Ades, P.K.; Moore, G.M.; Smith, I.W. Predicting wood decay in eucalypts using an expert system and the IML-Resistograph drill. Arboric. Urban For. 2007, 33, 76. [Google Scholar]
  53. Downes, G.M.; Lausberg, M.; Potts, B.; Pilbeam, D.; Bird, M.; Bradshaw, B. Application of the IML Resistograph to the infield assessment of basic density in plantation eucalypts. Aust. For. 2018, 81, 177–185. [Google Scholar] [CrossRef]
  54. Nickolas, H.; Williams, D.; Downes, G.; Harrison, P.; Vaillancourt, R.; Potts, B. Application of resistance drilling to genetic studies of growth, wood basic density and bark thickness in Eucalyptus globulus. Aust. For. 2020, 83, 172–179. [Google Scholar] [CrossRef]
  55. Downes, G.M.; Drew, D.M.; Moore, J.; Lausberg, M.; Harrington, J.; Elms, S.; Watt, D.; Holtorf, S. Evaluating and Modeling Radiata Pine Wood Quality in the Murray Valley Region; FWPA Project PNC325-1314; Forest and Wood Products Australia: Melbourne, Australia, 2016; Available online: https://www.fwpa.com.au/images/webinars/2016/PNC325-1314_eCambium_18_May_2016.pdf (accessed on 16 August 2021).
  56. Gao, S.; Wang, X.; Brashaw, B.K.; Ross, R.J.; Wang, L. Rapid assessment of wood density of standing tree with nondestructive methods—A review. In Proceedings of the 2012 International Conference on Biobase Material Science and Engineering, Changsha, China, 21–23 October 2012. [Google Scholar]
  57. Carrillo, I.; Valenzuela, S.; Elissetche, J.P. Comparative evaluation of Eucalyptus globulus and E. nitens wood and fibre quality. IAWA J. 2017, 38, 105–116. [Google Scholar] [CrossRef]
  58. Gendvilas, V.; Downes, G.M.; Neyland, M.; Hunt, M.; Jacobs, A.; O’Reilly-Wapstra, J. Friction correction when predicting wood basic density using drilling resistance. Holzforschung 2021, 75, 508–516. [Google Scholar] [CrossRef]
  59. Fundova, I.; Funda, T.; Wu, H.X. Non-destructive wood density assessment of Scots pine (Pinus sylvestris L.) using Resistograph and Pilodyn. PLoS ONE 2018, 13, e0204518. [Google Scholar] [CrossRef]
  60. Sharapov, E.; Wang, X.; Smirnova, E. Drill bit friction and its effect on resistance drilling measurements in logs. In Proceedings of the 20th International Nondestructive Testing and Evaluation of Wood Symposium, Madison, WI, USA, 12–15 September 2017; pp. 405–415. [Google Scholar]
  61. Downes, G.; Drew, D.; Lee, D. Validated Softwood Stiffness Predictions Using IML-Resistograph and eCambium; Forest & Wood Products Australia: Melbourne, Australia, 2020. [Google Scholar]
  62. Wang, S.Y.; Chiu, C.M.; Lin, C.J. Application of the drilling resistance method for annual ring characteristics: Evaluation of Taiwania (Taiwania cryptomeribides) trees grown with different thinning and pruning treatments. J. Wood Sci. 2003, 49, 116–124. [Google Scholar] [CrossRef]
  63. Lai, M.; Dong, L.; Leng, C.; Zhang, L.; Yi, M. Genotypic variation in the basic density, dynamic modulus of elasticity and tracheid traits of Pinus elliottii in three progeny trials in southern China. Holzforschung 2019, 74, 1–9. [Google Scholar] [CrossRef]
  64. Simic, K.; Gendvilas, V.; O’Reilly, C.; Harte, A.M. Predicting structural timber grade-determining properties using acoustic and density measurements on young Sitka spruce trees and logs. Holzforschung 2019, 73, 139–149. [Google Scholar] [CrossRef]
  65. Chen, Z.-Q.; Karlsson, B.; Lundqvist, S.-O.; Gil, M.R.G.; Olsson, L.; Wu, H.X. Estimating solid wood properties using Pilodyn and acoustic velocity on standing trees of Norway spruce. Ann. For. Sci. 2015, 72, 499–508. [Google Scholar] [CrossRef] [Green Version]
  66. Wu, H.; McRae, T.; Southerton, S.; Gapare, W.; Baltunis, B.; Li, X.; Dillon, S.; Ivkovic, M.; Powell, M.; Dieters, M. Quantitative and Molecular Genetics of Juvenile Wood Traits in Radiata and Slash/Caribbean Pines; Project No. PNC050-0304; Forest & Wood Products Australia: Melbourne, Australia, 2009; Available online: https://www.fwpa.com.au/images/resources/PNC050-0304_Juvenile_Wood_Initiative_Research_Report_0.pdf (accessed on 16 August 2021).
  67. Fundova, I.; Funda, T.; Wu, H.X. Non-Destructive Assessment of Wood Stiffness in Scots Pine (Pinus sylvestris L.) and its Use in Forest Tree Improvement. Forests 2019, 10, 491. [Google Scholar] [CrossRef] [Green Version]
  68. Hamilton, M.; Joyce, K.; Williams, D.; Dutkowski, G.; Potts, B. Achievements in forest tree improvement in Australia and New Zealand 9. Genetic improvement of Eucalyptus nitens in Australia. Aust. For. 2008, 71, 82–93. [Google Scholar] [CrossRef]
  69. Sharapov, E.; Wang, X.; Smirnova, E.; Wacker, J.P. Wear behavior of drill bits in wood drilling resistance measurements. Wood Fiber Sci. 2018, 50, 154–166. [Google Scholar] [CrossRef] [Green Version]
  70. Sharapov, E.; Brischke, C.; Militz, H.; Smirnova, E. Prediction of modulus of elasticity in static bending and density of wood at different moisture contents and feed rates by drilling resistance measurements. Eur. J. Wood Wood Prod. 2019, 77, 833–842. [Google Scholar] [CrossRef]
  71. Bureau of Meteorology. Available online: http://www.bom.gov.au/climate/averages/wind/selection_map.shtml (accessed on 3 March 2018).
  72. Standards Australia. Timber—Method of Test—Method 3: Density. AS/NZ 1080.3:2000; Standards Australia: Sydney, Australia; Standards New Zealand: Wellington, New Zealand, 2000.
  73. Heinrichs, J.F.; Lassen, L. Improved technique for determining the volume of irregularly shaped wood blocks. For. Prod. J. 1970, 20, 24. [Google Scholar]
  74. Bates, D.; Mächler, M.; Bolker, B.; Walker, S. Fitting linear mixed-effects models using lme4. J. Stat. Softw. 2015, 67, 1–48. [Google Scholar] [CrossRef]
  75. R Core Team. R: A Language and Environment for Statistical Computing; R Foundation for Statistical Computing: Vienna, Austria, 2020. [Google Scholar]
  76. Hartig, F. DHARMa: Residual Diagnostics for Hierarchical (Multi-Level/Mixed) Regression Models; R Package Version 0.3.2.0; The Comprahensive R Archive Network (CRAN): 2020. Available online: https://CRAN.R-project.org/package=DHARMa (accessed on 10 August 2021).
  77. Zuur, A.F.; Ieno, E.N. A protocol for conducting and presenting results of regression-type analyses. Methods Ecol. Evol. 2016, 7, 636–645. [Google Scholar] [CrossRef]
  78. Kuznetsova, A.; Brockhoff, P.; Christensen, R. lmerTest Package: Tests in Linear Mixed Effects Models. J. Stat. Softw. 2017, 82, 1–26. [Google Scholar] [CrossRef] [Green Version]
  79. Russell, L. Emmeans: Estimated Marginal Means, Aka Least-Squares Means; R Package Version 1.5.0; The Comprahensive R Archive Network (CRAN): 2020. Available online: https://CRAN.R-project.org/package=emmeans (accessed on 10 August 2021).
  80. Forrester, D.I.; Medhurst, J.L.; Wood, M.; Beadle, C.L.; Valencia, J.C. Growth and physiological responses to silviculture for producing solid-wood products from Eucalyptus plantations: An Australian perspective. For. Ecol. Manag. 2010, 259, 1819–1835. [Google Scholar] [CrossRef]
  81. Vega, M. Characterisation of Eucalyptus nitens Plantations for Veneer Production. Ph.D. Thesis, University of Tasmania, Hobart, Australia, 2016. [Google Scholar]
  82. Moore, J.R.; Lyon, A.J.; Searles, G.J.; Vihermaa, L.E. The effects of site and stand factors on the tree and wood quality of Sitka spruce growing in the United Kingdom. Silva. Fenn. 2009, 43, 383–396. [Google Scholar] [CrossRef] [Green Version]
  83. Moore, J.R.; Lyon, A.J.; Searles, G.J.; Lehneke, S.A.; Ridley-Ellis, D.J. Within-and between-stand variation in selected properties of Sitka spruce sawn timber in the UK: Implications for segregation and grade recovery. Ann. For. Sci. 2013, 70, 403–415. [Google Scholar] [CrossRef] [Green Version]
  84. Vestøl, G.I.; Fischer, C.; Høibø, O.; Øvrum, A. Between-and within-site variation of density and bending properties of Picea abies structural timber from Norway. Scand. J. For. Res. 2016, 31, 758–765. [Google Scholar] [CrossRef]
  85. Palmer, D.J.; Kimberley, M.O.; Cown, D.J.; McKinley, R.B. Assessing prediction accuracy in a regression kriging surface of Pinus radiata outerwood density across New Zealand. For. Ecol. Manag. 2013, 308, 9–16. [Google Scholar] [CrossRef]
  86. Kimberley, M.O.; McKinley, R.B.; Cown, D.J.; Moore, J.R. Modelling the variation in wood density of New Zealand-grown Douglas-fir. N. Z. J. For. Sci. 2017, 47, 15. [Google Scholar] [CrossRef] [Green Version]
  87. Smith, R.G.B.; Brennan, P. First thinning in sub-tropical eucalypt plantations grown for high-value solid-wood products: A review. Aust. For. 2006, 69, 305–312. [Google Scholar] [CrossRef]
  88. Raymond, C.A.; MacDonald, A.C. Where to shoot your pilodyn: Within tree variation in basic density in plantation Eucalyptus globulus and E. nitens in Tasmania. New For. 1998, 15, 205–221. [Google Scholar] [CrossRef]
  89. Lausberg, M.; Gilchrist, K.; Skipwith, J. Wood properties of Eucalyptus nitens grown in New Zealand. N. Z. J. For. Sci. 1995, 25, 147–163. [Google Scholar]
  90. Shelbourne, C.; Nicholas, I.; McKinley, R.; Low, C.; McConnochie, R.; Lausberg, M. Wood density and internal checking of young Eucalyptus nitens in New Zealand as affected by site and height up the tree. N. Z. J. For. Sci. 2002, 32, 357–385. [Google Scholar]
  91. Washusen, R.; Dumbrell, I.; Harwood, C.; Downes, G. Effects of Site and Silvicultural Treatments on Pulpwood and Solid-Wood Quality of Eucalyptus globulus; Technical Report No. 182; CRC for Forestry: Hobart, Australia, 2008. [Google Scholar]
Figure 1. Linear regression between core basic density and mean drilling resistance amplitude across the three thinning sites. Red points are Urana, blue are Florentine and green are Gads.
Forests 12 01304 g001
Figure 2. Least-square means and their standard errors estimated from the fitted first model showing the effect of commercial thinning (EC300; blue bars) relative to the unthinned control (orange bars) on tree size ((a)—DBH) and wood properties ((b)—Basic density; (c)—Acoustic Wave Velocity; (d)—Modulus of Elasticity) at Urana, Florentine and Gads.
Forests 12 01304 g002
Figure 3. Least-square means and their standard errors estimated from the fitted second model showing the effect of commercial (EC300, blue bar) and non-commercial (EW300, green bar) thinning relative to the unthinned control (orange bar) on tree size ((a)—DBH) and wood properties ((b)—Basic density; (c)—Acoustic Wave Velocity; (d)—Modulus of Elasticity) at Urana and Gads.
Forests 12 01304 g003
Figure 4. Least-square means and their standard errors estimated from the fitted third model showing the effect of commercial thinning (EC300, blue bar) and (EC500, yellow bar) relative to the untinned control (orange bar) on tree size ((a)—DBH) and wood properties ((b)—Basic density; (c)—Acoustic Wave Velocity; (d)—Modulus of Elasticity) at Urana and Florentine.
Forests 12 01304 g004
Table 1. Site description of three Eucalyptus nitens thinning trials in Tasmania, Australia.
SiteUranaFlorentineGads
Location41°20′57.0″ S
148°02′54.8″ E
42°36′22.0″ S
146°28′09.5″ E
41°34′22.9″ S
146°12′13.8″ E
Elevation (m, a.s.l.)400400700
Rainfall (mm yr−1) *110113321556
Mean annual temperature °C *11.410.39.4
Stocking at establishment (stems ha−1)110011001100
Coupe plantedAugust 1997September 1999August 1999
Soil profileModerately well drained. Black humic coarse sandy loam-Devonian granite and derived colluviumWell drained dark loamy topsoils overlying red brown or brown clay subsoils-Jurassic DoleriteFertile clay soil on Tertiary Basalt
Prevailing wind directionNWNWSW
* Temperature and rainfall data from trial planting date until 2018 were extracted for the trial site using the get AWAP function of the AUSclim package (P.A. Harrison unpublished R package).
Table 2. Stand characteristics in 2018 for each thinning treatment in the three thinning trials established in Tasmania, Australia.
Site
UranaFlorentineGads
Thinning CodeControlEC300EW300EC500ControlEC300EC500ControlEC300EW300
Thinning age (year)N/A848N/A88N/A95
Number of replicates4444434442
Number of trees tested18110185141263661502287628
Current stocking
(trees ha−1)
579 (36)316 (28)269 (5)452 (30)941 (6)283 (30)467 (33)1045 (24)315 (14)233 (22)
Mortality (%)44 (7)16 (4)11 (5)25 (8)15 (9)5 (2)2 (2)7 (4)6 (9)0 (0)
Basal area (m2 ha−1)43 (2)31 (2)33 (1)38 (2)48 (1)33 (3)40 (2)46 (2)28 (1)31 (2)
DBH (cm)30.9 (6)34.5 (7)39.1 (7)32.6 (7)27.0 (7)38.4 (9)32.8 (6)25.1 (6)33.0 (6)40.4 (7)
Notes: Control—unthinned; EC300—commercial thinning to 300 trees ha−1; EW300—non-commercial thinning to 300 trees ha−1; EC500—commercial thinning to 500 trees ha−1; Parenthesis = ± one standard error.
Table 3. Statistics for commercial thinning (EC300) vs. control treatment across three sites of the Eucalyptus nitens thinning trials. Results are F-tests for fixed effects and variance with standard deviation in parentheses for the random effects. Random effects are denoted in italics. Pruning was considered as a co-variate and was not included in the interaction term.
DBHBasic DensityAWVMOE
Site15.1 ***60.9 ***26.7 ***36.0 ***
Treatment126.8 ***4.6 ns21.2 **20.4 **
Site × Treatment15.2 **1.9 ns2.4 ns2.5 ns
Pruning17.7 ***0.0 ns7.1 **3.8 ns
Treatment:Replicate0.00 (0.00)7.89 (2.81)0.000 (0.000)0 (0)
Site:Replicate0.27 (0.52)0.00 (0.00)0.000 (0.015)14,340 (120)
Site:Treatment:Replicate0.09 (0.31)26.68 (5.16)0.001 (0.035)26,142 (162)
Residuals44.07 (6.64)644.56 (25.38)0.051 (0.226)1,290,216 (1136)
Note: ns, not significant, ** p ≤ 0.01, *** p ≤ 0.001.
Table 4. Statistics for commercial thinning (EC300) and non-commercial (EW300) vs. control treatment across two sites of the Eucalyptus nitens thinning trials. Results are F-tests for fixed effects and variance with standard deviation in parentheses for the random effects. Random effects are denoted in italics. Pruning was considered as a co-variate and was not included in the interaction term.
DBHBasic DensityAWVMOE
Site7.1 *123.1 ***47.9 ***93.5 ***
Treatment76.3 ***2.4 ns11.3 **9.2 **
Site × Treatment9.1 **1.4 ns2.9 ns2.2 ns
Pruning0.5 ns0.5 ns1.1 ns0.1 ns
Treatment:Replicate0.00 (0.00)11.22 (3.35)0.000 (0.013)1947 (44)
Site:Replicate0.27 (0.52)0.00 (0.00)0.001 (0.014)0 (0)
Site:Treatment:Replicate0.49 (0.70)31.12 (5.58)0.001 (0.035)39,699 (199)
Residuals40.50 (6.36)31.12 (25.43)0.041 (0.203)1,079,152 (1039)
Note: ns, not significant, * p ≤ 0.05, ** p ≤ 0.01, *** p ≤ 0.001.
Table 5. Statistics for commercial thinning (EC300) and (EC500) vs. control treatment across two sites of the Eucalyptus nitens thinning trials. Results are F-tests for fixed effects and variance with standard deviation in parentheses for the random effects. Random effects are denoted in italics. Pruning was considered as a co-variate and was not included in the interaction term.
DBHBasic DensityAWVMOE
Site0.0 ns39.1 ***5.2 ns1.8 ns
Treatment46.1 ***1.1 ns3.3 ns3.2 ns
Site × Treatment16.2 **7.1 *0.0 ns1.2 ns
Pruning21.4 ***0.1 ns2.6 ns1.6 ns
Treatment:Replicate0.00 (0.00)0.00 (0.00)0.000 (0.000)0 (0)
Site:Replicate0.47 (0.68)10.31 (3.21)0.000 (0.000)5007 (71)
Site:Treatment:Replicate0.05 (0.23)0.00 (0.00)0.001 (0.026)12,250 (111)
Residuals45.91 (6.78)814.80 (28.55)0.054 (0.233)1,493,084 (1222)
Note: ns, not significant, * p ≤ 0.05, ** p ≤ 0.01, *** p ≤ 0.001.
Publisher’s Note: MDPI stays neutral with regard to jurisdictional claims in published maps and institutional affiliations.

