Article

Performance of Aether Low-Cost Sensor Device for Air Pollution Measurements in Urban Environments. Accuracy Evaluation Applying the Air Quality Index (AQI)

by
Georgios C. Spyropoulos
1,2,3,
Panagiotis T. Nastos
1,* and
Konstantinos P. Moustris
3
1
Laboratory of Climatology and Atmospheric Environment, Department of Geology and Geoenvironment, National and Kapodistrian University of Athens, Panepistimiopolis, GR-15784 Athens, Greece
2
Laboratory of Soft Energy Applications & Environmental Protection, Mechanical Engineering Department, University of West Attica, 250 Thivon and P. Ralli Str., GR-12244 Athens, Greece
3
Laboratory of Air Pollution, Mechanical Engineering Department, University of West Attica, 250 Thivon and P. Ralli Str., GR-12244 Athens, Greece
*
Author to whom correspondence should be addressed.
Atmosphere 2021, 12(10), 1246; https://doi.org/10.3390/atmos12101246
Submission received: 13 August 2021 / Revised: 9 September 2021 / Accepted: 21 September 2021 / Published: 24 September 2021
(This article belongs to the Special Issue Air Quality in Greece)

Abstract

:
Significant portions of European cities’ population are still exposed to levels of air pollution deemed harmful by the World Health Organization. Given the high impact of air pollution both on human health and the economy, numerous low-cost electrochemical sensor monitoring systems are being installed. The market is forced to develop new air quality monitoring systems to meet the needs of providing forecasting services based on advanced technologies and protocols that utilize certain characteristics such as high accuracy, real-time monitoring, daily and yearly statistics, data access from both experts and simple users with the use of low-cost equipment. In this study, conducted in Athens, Greece, a comparison is attempted between the findings from a low-cost electrochemical sensor device and those of a static, fixed site measurement monitoring station; this comparison is based on the data quality and Air Quality Index (AQI) concerning data accuracy and quality on adverse health effects due to air pollution. With regard to the prediction of different AQI intervals, TPR ranges from 35.2% up to 100.0%, FPR from 0.0% up to 36.1% and FNR from 0.0% up to 38.1%. The outcome of this study reveals flexible and affordable alternatives adopted during the evaluation and calibration of low-cost gas sensors for monitoring.

1. Introduction

It is a fact that nowadays humanity finds itself facing critical decisions, deeply associated with the unfolding of the climate crisis and the emergence of global environmental and health issues, such as the COVID-19 pandemic. Now, more than ever, the interplay between social, health, economic and environment challenges the current norms of thinking and stresses the need for immediate actions and structural changes. This often comes down to simple expectations such as living in a healthy environment and appreciating a sufficient healthcare system and the feeling of safety, accomplished through the adoption of effective measures, both preventive and precautionary.
In forthcoming years, every society will be called to act with appropriate answers to the global challenges of climate and the environment. The plethora of scientific and non-scientific publications and reports demonstrate the seriousness and impact of the situation so far. Sustainable solutions must be provided urgently and so must substantial information on climate change, biodiversity loss, depletion of natural resources and the environmental risks we are called upon to address.
According to multiple scientific studies, a link between air pollution, meteorology and human health impacts such as asthma, respiratory diseases, chronic bronchitis, heart disease, lung cancer and generally reduced life expectancy and premature mortality has been confirmed [1,2,3]. The World Health Organization [4] has estimated that in developing countries, the increase in urban air pollution has led to more than 2 million deaths per year, as well as to various respiratory illnesses [5,6]. Moreover, technological progress and urbanization in developing and developed countries results in an increase of air pollution [7,8,9] and due to local soil dust re-suspension from transportation higher dust contribution is observed [10]. The appropriate decision-making in terms of strategies and actions, in due course, depends on the recording and analysis of ambient air quality parameters, which create the need for the development of a real-time monitoring network.
The use of multi-parameter monitoring systems to measure the quality of the atmospheric environment enables a consequent detailed analysis of the major air pollutants, biometeorological parameters and noise pollution. These integrated monitoring systems are important components of the so-called “smart cities”, for air quality monitoring in urban areas [11], but also for the monitoring of other environmental parameters that determine to a significant extent the life quality of the city’s inhabitants. According to the Directive 2008/50/EC [12] on ambient air quality and cleaner air for Europe, which clearly designates the need for fixed monitoring stations for significant pollutants, the development also of networks that consists of low-cost electrochemical sensors along with the necessary precision and accuracy of air pollution and meteorological measurements, offer an alternative to the problem. To that end, the use of electrochemical sensors compared to fixed site measurement monitoring stations, is of great interest among researchers with several studies putting forward methodologies similar to that currently adopted [13,14,15,16,17,18,19], and with others [20], giving more focus on the use of electrochemical sensors to monitor urban air quality, sensor design, laboratory and field performance. Environmental and air quality data obtained by such systems are thought to be less reliable than individual instruments and, therefore, concrete information about the sensitivity, selectivity and stability of sensors is necessary. Simultaneously, as most web applications and low-cost sensors provide monitoring measurements reporting the AQI, there is also an interest in the evaluation of the specific index in terms of how informative and reliable it can be.
Moreover, and due to the rapid expansion of low-cost sensors’ usage for air quality measurements from responsible authorities or individual citizens, development and implementation recently of numerous platforms that provide public information is also noted [21]. However, reliability, and whether these devices can actually contribute to the correct communication and information, are still major concerns, since even now there are no specific and clear protocols for the evaluation of low-cost sensors, substituted by general guidelines alone [22,23].
In order to ensure adequate performance, one must be aware that each case is different and performance may vary spatially and temporally [24], which makes it difficult for a researcher to utilize the data received from the corresponding devices. It is common and recommended when such devices with low-cost sensors are used, firstly to take measurements and then compare the data with validated data that come from governmental or research stationary monitors [17]. Similar measurements to those in this manuscript, which were performed in Portugal during a two-week period, suggest that the overall performance of the sensors in terms of statistical metrics and measurement profile can be used for providing spatially and temporally useful information for air quality levels [15]. In a study that took place in Amsterdam, the Netherlands, the authors [25] suggest that after using low-cost sensors for over 2 months in measurements, it is better to proceed in validation through a comparison with steady air monitoring stations for an 8-day period. Nevertheless, before using any data from low-cost sensors and obtaining trustworthy values, a calibration procedure for all the parameters should be initially carried out [16]. In the case in which better performance is sought from the sensors, then usage of artificial neural networks and supervised learning techniques is suggested [20,26]. However, values obtained from on-site calibrations instead of laboratory ones are considered better and it is crucial to avoid adopting the last case, when it comes to use data for real-world measurements [27].
Therefore, the impact on the usage and research of low-cost electrochemical sensors devices, is more than obvious as the literature is extremely extensive concerning this topic. We have already reached the point where a plethora of such devices is at such a very low cost that citizens own their own devices and use them [21].
The aim and the objectives of this study are to evaluate the final qualitative information that can be obtained by any user. This information is determining the level of air quality. Consequently, the main objective of this manuscript is the performance of an accuracy evaluation analysis applying the AQI [28], between a low-cost sensor device for urban air quality monitoring “Aether” and a static fixed site monitor station “NOA”, instead of focusing on an in-depth analysis on absolute measuring values regarding sensitivity, selectivity and stability of sensors, which have been described in detail elsewhere [20,29,30,31,32,33].
Restrictions and assumptions adopted during the research were the number of sites and duration of measurements that took place. The study was conducted in a single location during a typical Greek period (April) and for 18 days (24 h/day). It should be considered at this point that for such measurements to be carried out, the portable equipment must be in a controlled area or there must be staff for its usage and the fixed measuring station must always be in its optimal operating condition (adding extra operational cost for gases and calibration). Moreover, it should be mentioned that in the wider study area in Greece and in the Athens historical center, there is only this specific site with a fixed station in a perfectly working condition. Therefore, the major concern was whether the AQI value is correctly determined or not, by using statistical indices as will be described later in detail.
In this study, two surveys were conducted for low-cost sensor devices. The first was for the evaluation of air pollution data accuracy and the second for providing valuable data concerning adverse health effects due to air pollution, through the evaluation of the well-known AQI. In both cases, the evaluation was based on low-cost sensor device measurements in comparison with a NOA air pollution monitoring station. AQI reports daily air quality. AQI shows the relation between air quality and public health effects. The US Environmental Protection Agency (USEPA) is an independent executive agency of the United States federal government and calculates the AQI for five major air pollutants regulated by the Clean Air Act: ground-level ozone, particle pollution (also known as particulate matter), carbon monoxide, sulfur dioxide, and nitrogen dioxide. For each of these pollutants, USEPA has established national air quality standards to protect public health. Ground-level ozone and particle pollution are the two pollutants that pose the greatest threat to human health in this country [34]. There are a substantial number of different indexes to measure air quality for individual pollutants and even countries that share the same legislation or sometimes areas/cities of the same country have different indices, but in this study, the authors focus on the most commonly used index, AQI.

2. Field Data and Methodology

Recent research in the field of air pollution measurements using low-cost sensors is now plentiful worldwide, and researchers are producing positive results. More specifically, in Gateshead UK [35], CO and NO2 sensors were monitored and validated successfully, during the development of a protocol where the data had to go through a dual network transmission to reach the destination address.
In New Zealand a team of scientists [36], conducted a study in Auckland where high pollution is produced because of the of the high circulation of diesel cars. The study took place on a busy 2 km road, 4 km from the center. The researchers used 8 low-cost sensors at distances of 100 to 1000 m near bus stops. Although the measured daily concentration of NO2 did not exceed 20 μg/m3 the conclusions they drew highlight the very large deviations for every 100 m [37].
During 2016 the NO2 pollution of the atmosphere of Oslo in Norway was mapped, with measurements taken from electrochemical sensors. While the chosen equipment did not conclude with acceptable data accuracy at first, researchers combined the measurements with data value deriving from forecasting programs and succeeded to achieve an accuracy rate of 89%.
Similar methodology appears from researchers in Seoul, South Korea [38], as they have used low-cost sensors in cells to measure PM2.5. They took a rather small sample of measurements, a total of 169 h of data and exported it through a free geo-data editable map (OpenStreetMap). Using algorithms and through machine learning models they optimized the percentages of accuracy and chose the optimal ones.
In the Athens area by using low-cost PM sensors for over 5 months, strong correlations appeared compared to reference-grade instrumentation [19]. The result of using this equipment is positive and as the authors conclude low-cost sensors can provide useful data to the research community.
Also, an acceptable method was used by Tasic et al. [39], where they used low-cost sensors connected to an Arduino in order to measure PM2.5 indoors and through measurement calibration software succeeded in achieving high accuracy.
On the other hand, in Sao Paulo, Brazil [40], researchers collected measurements of CO, CO2, NO2 and O3 as well as temperature, humidity, altitude and velocity. The measurements were taken in five different routes with cars equipped with electrochemical sensors and they used geo-data map techniques to capture these measurements. Although the idea was well established, they encountered several problems with the accuracy of the pollutant measurements. It should be noted that using any type of device for air pollution measurements in a car while travelling, has so many limitations and specific features that it is extremely difficult to be safe concerning accuracy.
After evaluating different systems of low-cost sensor devices for urban air quality monitoring on the market, the authors in collaboration with Progekta Europe P.C., an Athens (GR)-based company, concluded in using the device called “Aether” (Figure 1).
The Aether was exclusively designed by the company and authors to be resistant to external conditions, compact and lightweight, and thus convenient for users to carry or install in specific urban spots. The Aether supports sensing of a variety gas concentrations using Alphasense Ltd. (UK) electrochemical sensors considered among the best choices [41], for CO, H2S, NO, NO2, O3, SO2, photoionisation detection (PID) for VOCs, non-dispersive infra-red (NDIR) for CO2. In addition, it incorporates the Alphasense optical particle counter (OPC) for PM1, PM2.5 and PM10 particulate matters. Air temperature, relative humidity and atmospheric pressure are also measured. In more detail, Aether weighs only 6 kg (including batteries) with housing dimensions of (mm) 290 × 230 × 160. Alphasense analogue front-end (AFE) supports up to four electrochemical sensors, or three electrochemical sensors in addition to PID. NDIR for CO2 sensing is provided via a separate interface. The ultra-low-noise circuitry maximizes repeatability of electrochemical sensing. For particulate monitoring, the AFE uses Alphasense OPC-N2, OPC-N3 or OPC-R1 particle counters. Temperature, relative humidity and atmospheric pressure are measured using an enclosed Bosch Sensortec device. The communication can be achieved wired over a waterproof ethernet RJ45 connector or wireless over a 2G/3G/4G cellular modem and GPS receiver. The processor comes from BeagleBone Black Industrial and its internal real-time clock (with battery backup) has time synchronization over a GPS receiver along with the ability to accept a network time protocol or real-time clock. Aether is powered by 7 to 24 V DC and its internal battery backup provides up to 48 h operation. Environmental operating temperature ranges from −15 °C to 60 °C and humidity levels from 10% to 80% (non-condensing).
This study took place in central Athens, in the area of the National Observatory of Athens (NOA) at Thissio (37°58′ Ν, 23°43′ E), between 12 and 28 April 2018 (specifically 392 consecutive hours). The specific point is located next to a park (Philopappou Hill) and the distance from roads with mild traffic is more than 100 m. The access to the spot where field data were collected is limited only to specific personnel, while this point was chosen because it lies next to the historic center of Athens and at the same time a certified urban background air pollution monitoring station is already installed there. It belongs to NOA and its certified analyses comply with the prescribed calibration intervals. More specifically, Horriba AP-360 series and the Thermo 49i automatic analyzers were operated for monitoring of NOx (NO + NO2) and O3 respectively on 1 min resolution, averaged on an hourly basis. A beta-radiation attenuation particulate matter measurement system (Eberline Instruments, type FH-62) was operated for the continuous detection of PM10 levels. For the fine fraction of particulates, PM2.5 filter samples integrated over 24 h periods with a Derenda low volume sampler were used. Finally, meteorological data (ambient temperature and relative humidity) at the sampling site were recorded by NOA’s automatic meteorological station at Thissio (1-min resolution). The Aether device was chosen to measure NO2, O3, PM10, air temperature and relative humidity at 2 s intervals.
The methodology followed after the installation of the Aether device at Thissio area consisted of three stages: data collection, processing and evaluation of the results. The first step initially involved setting the time, date and synchronization between the Aether device and NOA monitoring station, along with ensuring data communication from data loggers. Each analyzer and instrument were set to take measurements and record in the minimum interval (1–2 s) having the ability—in the next stage—to define the interval. In the second stage, differences in the mode of operation of the fixed station and the electrochemical sensors were taken into account. For data evaluated in short intervals, e.g., seconds, considerable variations would arise, due to the different response pattern of the analyzers and the Aether device. Hence, it was decided that the interval of the measurements should be in hourly steps. At this stage the raw data from Aether were collected, filtered and sorted with human intervention without the use of any other electronic device or automation software. Simple data processing operations included validation and sorting and after all the data were processed and analyzed they were stored in a common readable format.

3. Results

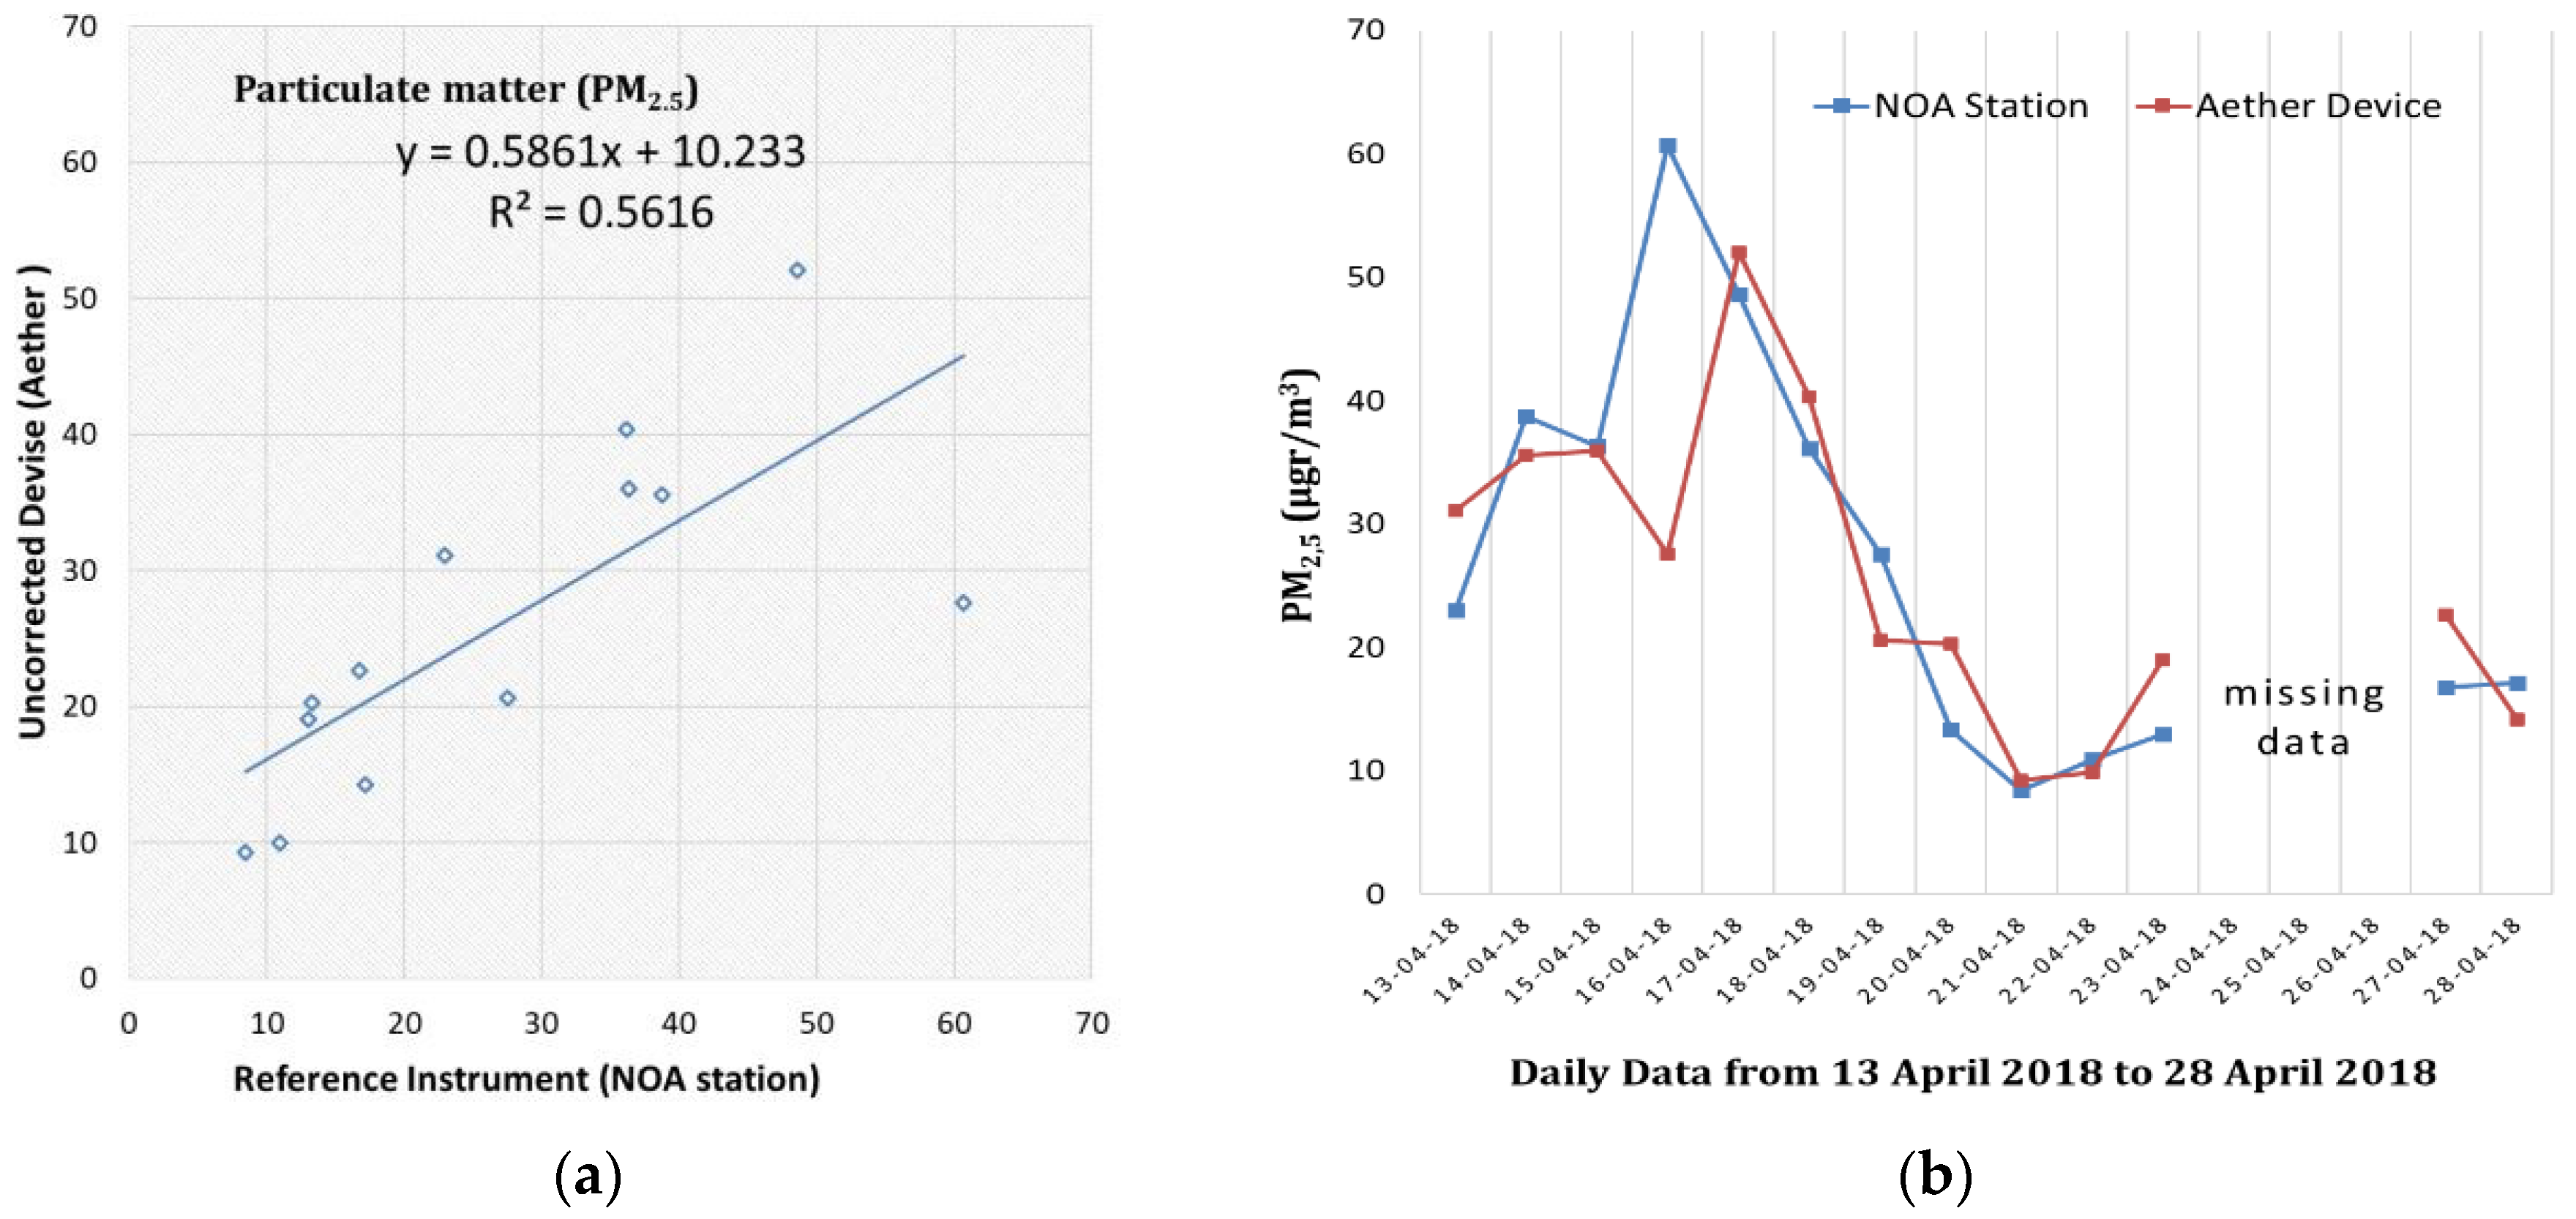
3.1. Data Accuracy Validation

Subsequently, the reliability of the Aether was examined, all the individual measurements were checked and the validity of the data was evaluated by utilizing statistical metrics [42,43,44] in Table 1. “N”, refers to the number of data points (average hourly value) for each sensor. Its value comes from ratios derived from 1–2 s sampling times. For the evaluation process, the coefficient of determination (R2) for each data set was calculated, where array-1 was the worksheet range that holds the data of NOA station set and array-2 was the worksheet range that holds the Aether device data. The mean absolute error (MAE) was calculated in order to indicate the average magnitude of the errors. Mean bias error (MBE) quantifies the overall bias and detects whether Aether produces overestimation (MBE > 0) or underestimation (MBE < 0); and, finally, the root mean square error (RMSE) was calculated for the two data sets in order to aggregate them into a single measure of predictive power [45,46]. Final steps concerned the evaluation of the results in relation to their correlation and statistical analysis.
According to the specific work and methodology described above, one can see the results of the comparison between NOA station and the Aether device (Table 1). Typical time series of average hourly measurements are presented. The scatterplot (Figure 2a) and the time series (Figure 2b) reflect the comparison of NO2 measurements (ppb) with a data completeness of 96.2%. As can be seen, the concentrations are ranging from 0 up to 62ppb (117.0 μg/m3) according to NOA station and from 0 up to 89 ppb (167.0 μg/m3) according to the Aether device. The coefficient of determination is equal to R2 = 0.702, explaining 70.2% of the variance of the data, indicating a very good agreement between NOA station and Aether device measurements.
Furthermore, low values of MAE and RMSE provide a strong correlation for NO2 measurements between NOA monitoring stations and Aether device. Finally, it seems that Aether device overestimates the air pollution (MBE > 0) in all cases and for all pollutants, in comparison with NOA monitoring station measurements.
In Figure 3, the scatterplot and time series of ozone (O3) is provided with data completeness of 90.1%. The measurements range from 0 up to 62 ppb (122.0 μg/m3) according to NOA station and from 0 up to 89 ppb (175.0 μg/m3) according to the Aether device. The coefficient of determination is equal to R2 = 0.510, along with relatively high values of MAE and RMSE shows that there is a limited tolerable correlation between the measurements of the NOA station and Aether device. In this case, although R2 seems relatively low, with an adequate slope = 0.8579 and a positive intercept = 14.533, along with MBA = 7.78 ppb (15.5 μgr/m3) a rather important overestimation appears. According to the above, accurate data of local air quality, concerning O3, over long timescales should not be expected.
The next data sets concern particulate matter PM10 and PM2.5. In particular, PM2.5 derived from weighed filters and not by an automatic analyzer, therefore data provided from NOA in daily average values and not in hourly values. Figure 4 and Figure 5 provide moderate correlation results. In this case, data completeness was 95.2% and 81.3% respectively, with values of the coefficient of determination equal to R2 = 0.637 and R2 = 0.562 respectively. Slope in both equations (0.3628 and 0.5861) does not approach ideal values and intercepts reveal an overestimation, especially in low real values.
During the specific period, at least two major Sahara dust events occurred over Athens (Figure 4b) and in such cases dust can be a significant component of PM [47,48]. In these cases, it is clear that the Aether device could not adapt to these major fluctuations, along with relatively high values of MAE and RMSE. For both pollutants, a slight value of MBE < 0 indicates an underestimation of the real situation. It should be noted, however, that these sensors are also highly affected by humidity phenomena, therefore with the fluctuations low reliability was expected [49].
Finally, the comparison of air temperature and relative humidity measurements (Figure 6) was conducted with data completeness of 100%. The Aether device showed high correlations with the NOA station with R2 = 0.959 and R2 = 0.936, respectively, almost excellent slope and intercept, for both temperature and humidity, along with low values of MAE, MBE and RMSE (Table 1).
Solutions for improving the reliability of the measurements and their accuracy are specific. You may either correct values directly internally using software calculations on any device with low-cost sensors, or use calibration algorithms using multi-linear regression models, artificial neural network models, etc. to account for influences of other factors such as temperature, humidity, solar radiation or for example ozone values when calibrating electrochemical sensors, after obtaining the values [20,26,33]. In both cases, correlation coefficients between low-cost devices and reference instruments are improved.
Nevertheless, the need for better quality and accuracy of sensors measurements concerning their spatial and temporal performance still remains questionable and the important challenge is to provide valuable information for human health. Moreover, it is a fact that the multitude of international collaborations and agencies such as companies, universities and organizations that are involved and constantly contribute to the development of quality improvement of low-cost sensors, such as the VAQUUMS project [50], CEN Technical Committee [51], EveryAware project [52], EU-Sense project [53], Joint Research Center [54] and others, improve constantly the reliability and the quality of measurements by low-cost sensors, so that users can have reliable measurements. Therefore, it is emphasized through this paper that the duration of exposure along with the value of concentration of any pollutant, are of major importance for human health, which means that besides the value of every pollutant, air quality indexes are also important to highlight the effect on human health.

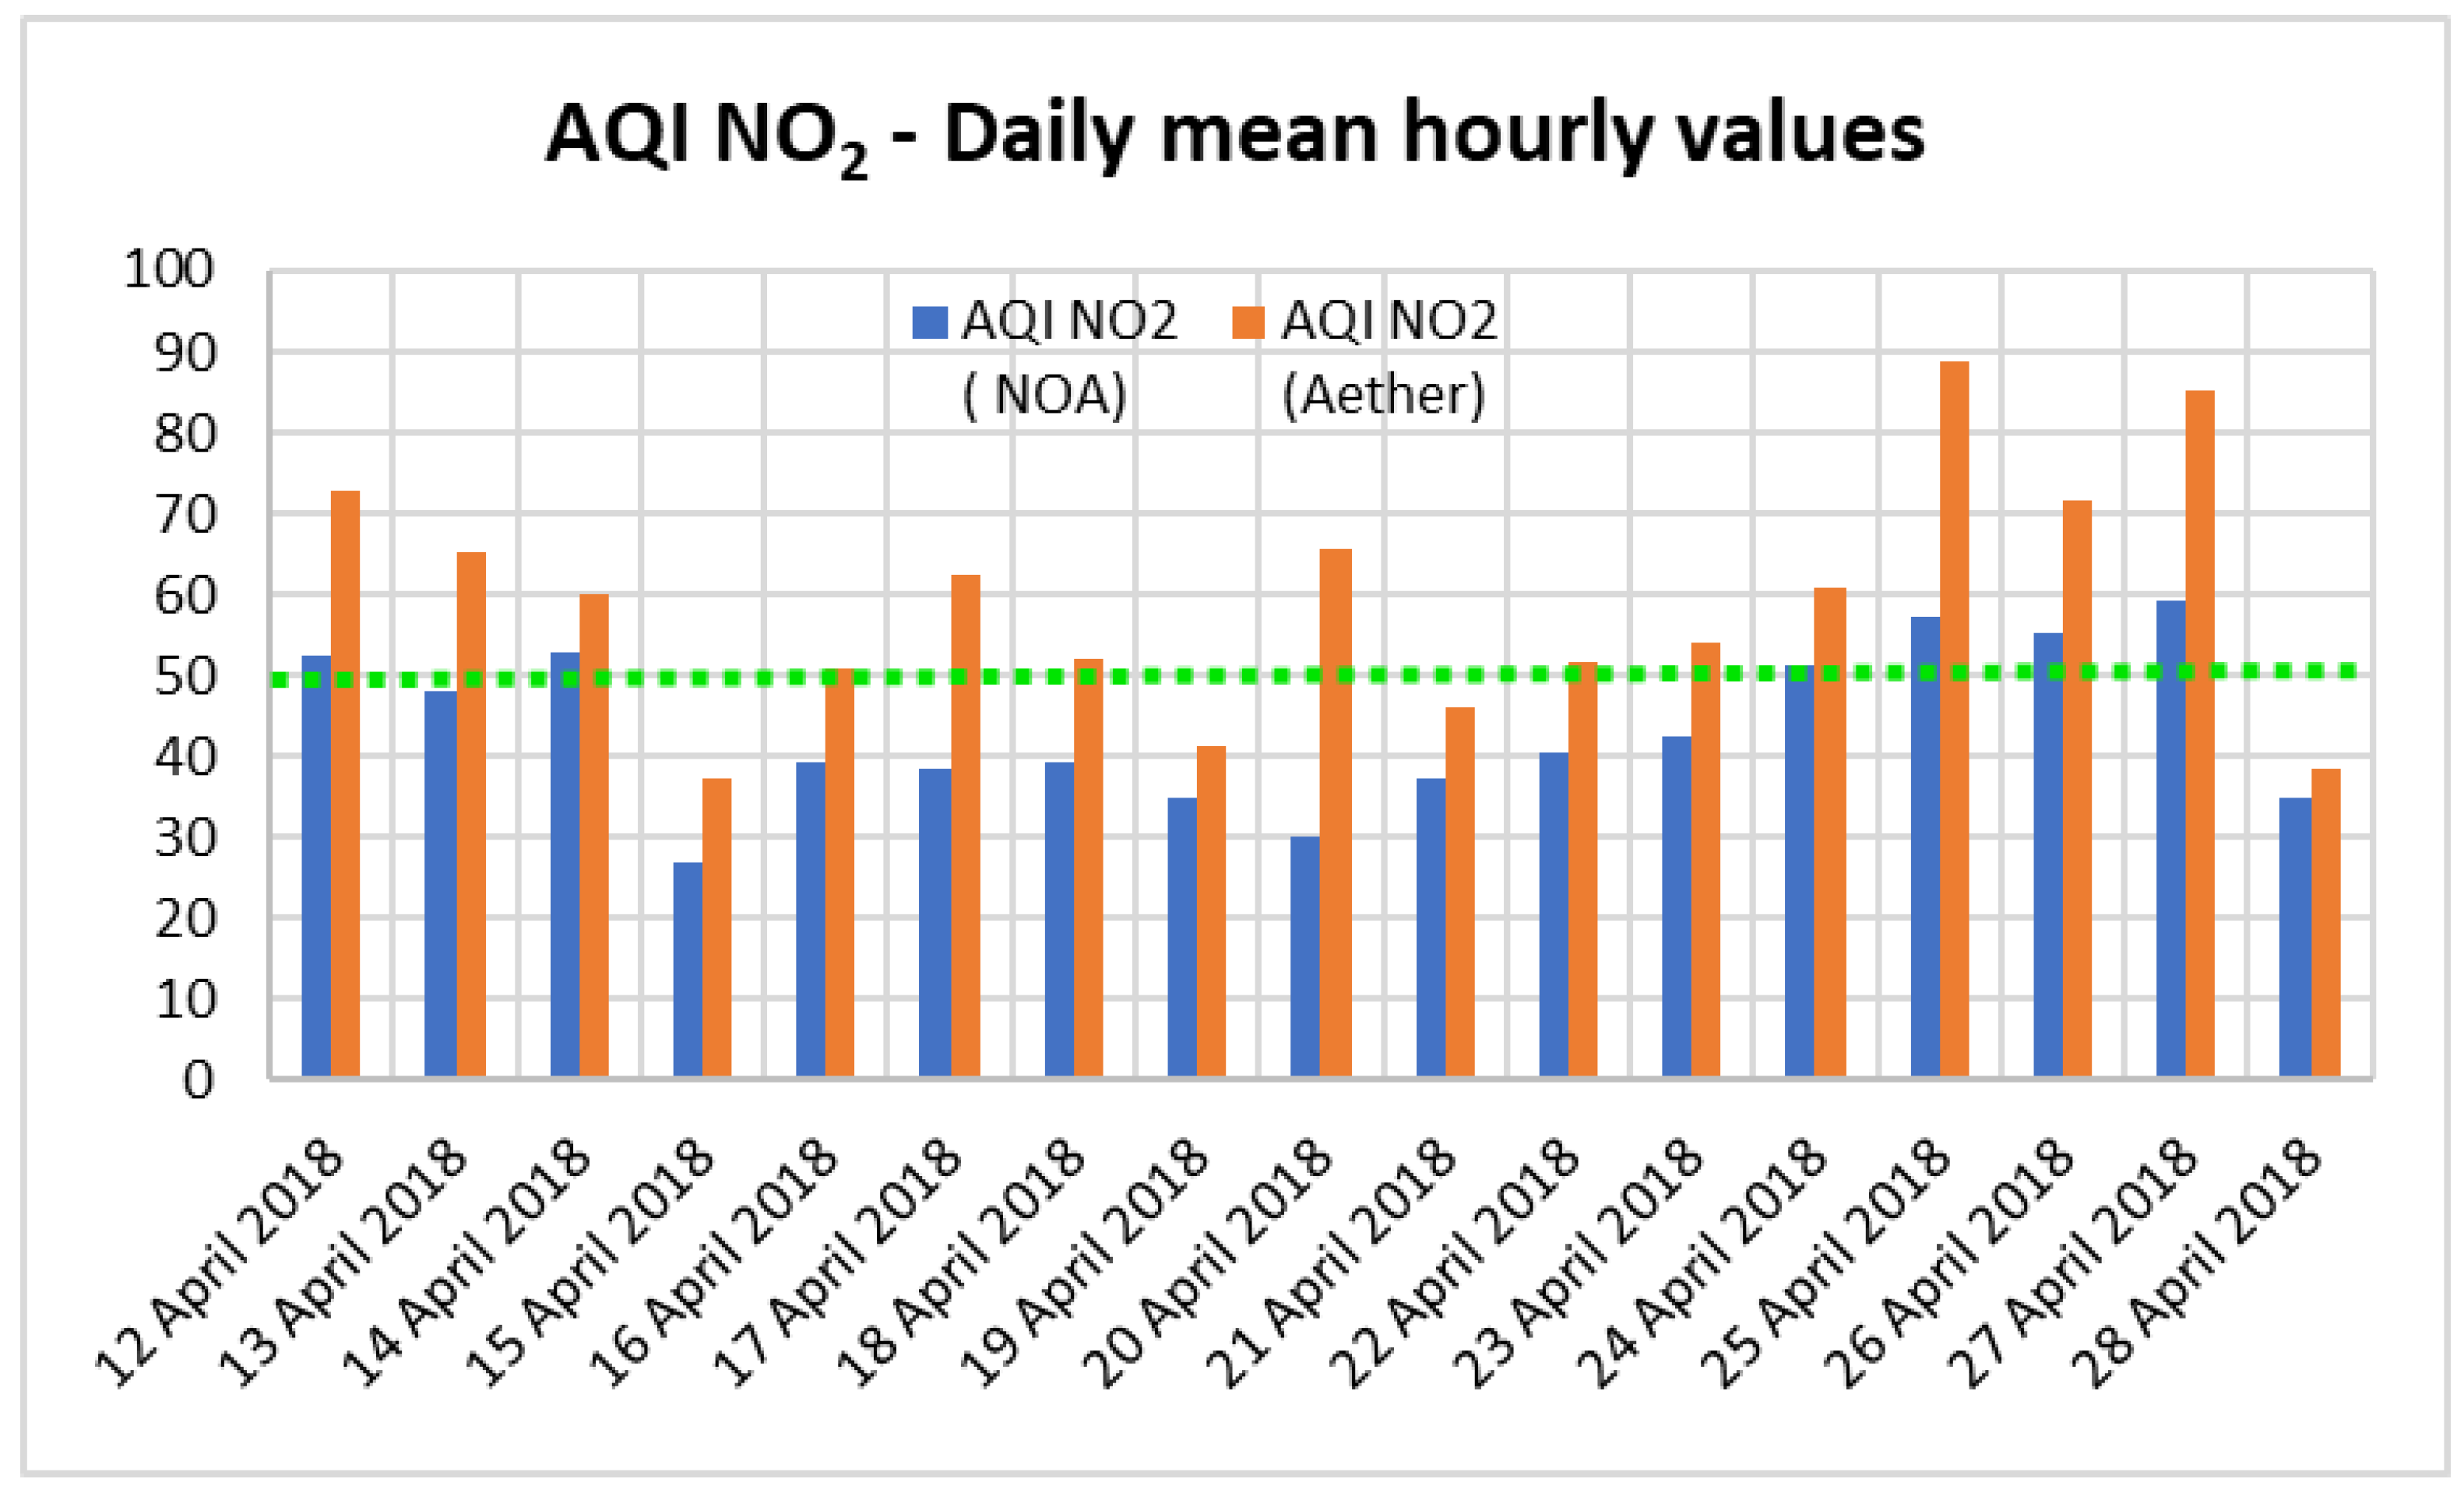
3.2. Evaluation through Air Quality Index

Initially, the AQI value obtained from NOA station is compared to the Aether device’s corresponding value and then it is evaluated whether the AQI interval is correctly determined or not by using appropriate statistical evaluation indices. The main reason that has led researchers to determinate the air quality through AQI is practical. Most people are unable to know a given value or indication which will be given in units such as ppb or μgr/m3 and, even if they are familiar with the units, they will not be able to evaluate the threshold value of every pollutant in order to understand air quality risks. Therefore, AQI is useful for citizens and relevant authorities to inform about the quality of air pollution in an adequate and understandable way, but also to be used to take a series of predetermined measures [55,56]. There is a substantial number of different ways to interpret air quality in real-time conditions. The most acceptable and common way to do so is the use of an air quality index. Air quality indices are generally based on a number of sub-indices for each individual pollutant. There is a wealth of air quality indices [57]. Early and recently studies in several areas of the world adopt similar air quality indices. Some of the differences between them can be explained by the local differences in the nature of the air quality problems. Some other differences are due to fundamentally different approaches. Cochran et al. [58] studied the ambient air quality standards of 21 nations for eight commonly regulated substances and over 15 countries were studied in detail by Monteiro et al. [57]. The major differences among the air quality indices are found in the calculation functions, type and number of pollutants and the number of intervals based on associated thresholds and health impacts.
AQI is a well-known and established index developed by the US Environmental Protection Agency [28]. For each pollutant an AQI value of 100 generally corresponds to an ambient air concentration that equals the level of the short-term national ambient air quality standard for protection of public health. AQI values at or below 100 are generally thought of as satisfactory. When AQI values are above 100, air quality is unhealthy: at first for certain sensitive groups of people, then for everyone as AQI values become higher. The AQI is divided into six categories. Each category corresponds to a different level of health concern. Each category also has a specific color. The color makes it easy for people to quickly determine whether air quality is reaching unhealthy levels in their communities [28].
Therefore, an established categorization of AQI value with intervals of concern (Good—air quality is satisfactory, and air pollution poses little or no risk (0–50); Moderate—air quality is acceptable. However, there may be a risk for some people, particularly those who are unusually sensitive to air pollution (51–100); Unhealthy for Sensitive Groups—members of sensitive groups may experience health effects. The general public is less likely to be affected (101–150); Unhealthy—some members of the general public may experience health effects; members of sensitive groups may experience more serious health effects (151–200); Very Unhealthy—health alert: the risk of health effects is increased for everyone (201–300); Dangerous—health warning of emergency conditions: everyone is more likely to be affected (301–500)) and an appropriate chromatic scale is definitely useful [28]. According to pollutant-specific sub-indices and cautionary statements for guidance on the AQI, every pollutant should be calculated in different time series. NO2 should be calculated in mean hourly values, O3 in 8 h moving average concentrations and lastly PM10 and PM2.5 in daily mean values.
In order to investigate the ability of the Aether device to determine the accurate value of AQI for every interval of concern, appropriate statistical indices such us the true predicted rate (TPR), the false negative rate (FNR) and the false positive rate (FPR) were used.
Table 2 presents the validation statistical indices for different AQI intervals. In Table 2, the number of hours, for both Aether device and NOA station, for each pollutant AQI value is lying within the same interval (right AQI interval prediction), denoted as X. The number of hours where AQI was calculated via the Aether device is lying within the previous AQI interval, based on NOA measurements are denoted as Y, the number of hours where AQI calculated via the Aether device is lying within the next AQI interval, based on NOA measurements are denoted as Z, and N is the number of hours where AQI is lying within a specific interval, based on NOA measurements.
TPR represents the percentage (%) of correct cases over total cases with values from 0.0% to 100.0% and a perfect score equal to 100.0%, i.e., when AQI calculated via the Aether device is lying within the same AQI interval, based on NOA measurements. FNR represents the percentage (%) of negative false predictions, i.e., where AQI calculated via the Aether device is lying within the previous AQI interval, based on NOA measurements, with values from 0.0% to 100.0% and a perfect score equal to 0.0%. Finally, FPR represents the percentage (%) of positive false predictions, i.e., where AQI calculated via the Aether device is lying within the next AQI interval, based on NOA measurements, with values from 0.0% to 100.0% and a perfect score equal to 0.0%.
According to Table 2, it seems that the Aether device shows a very good overall accuracy in predicting AQI index by using mean hourly concentrations. More specifically, the Aether device with the electrochemical sensors predicts correctly from 35.2% (O3—Moderate level) up to 100% (PM2.5—Good, Moderate level) of observed exceedances. What is argued to be both practical and important to obtain as an hourly basis information is, if the AQI index will be correct and much more if the concentration level is above the Good or Moderate level. This is due to the fact that the human body when exposed to high concentrations of air pollution for more than 8h during the day is at high unhealthy risk [45]. More specifically, in Figure 7, Figure 8, Figure 9 and Figure 10, the daily value of the AQI index derived from average hourly values along with statistical indices for the evaluation of the Aether device accuracy is presented in detail for every pollutant.
It should be noted at this point that during the period of measurement, NO2 emissions were in relatively low levels at ranges below 70 ppb (132 μg/m3). Therefore, according to AQI calculations only the first 2 categories were explored (Good and Moderate) and the results are very promising (Figure 7). It is of major interest to understand that even in cases of different categories in AQI calculations considering NO2, with FPR 10.1% and 0.0% for Good level and Moderate levels, respectively, the outcome is not prohibitive. The same conclusions derive also for FNR (0.0% and 9.1% for Good level and Moderate AQI levels, respectively).
Figure 8 depicts the daily AQI concerning O3 (8 h moving average concentration) during the period examined where we can see that three different AQI levels (health impact) appear. It is well known that in Athens and generally in Greece, O3 is one of the key pollutants due to the high solar irradiation and number of sunny hours during the year. As can be seen the comparison between the mean daily AQI value derived via the Aether device and the respectively NOA monitoring station measurements, may easily be characterized as positive.
Correlations between ozone and each particulate component are considered to be weak and, according to previous research, this situation varies by season and location [59,60]. Rapid meteorological fluctuations affecting air pollution formation, especially in rather extreme events (like the Sahara dust event) along with ozone, produced by photochemical reactions over large spatial scales, can and may promote ozone formation and modulation, due to higher levels of primary pollutants, higher temperatures and different pressure conditions [61]. Therefore, although the Aether seems to always overestimate the value of AQI concerning O3, at these extreme weather conditions it appears not to follow the sharp increase and, in such cases, it should not be trusted. Concerning PM10, the comparison between daily AQI values derived via the Aether device and the corresponding values derived via the NOA monitoring station leads to very similar values (Figure 9). For 16 consecutive days the daily AQI value is lying (for both the Aether device and the NOA monitoring station) within the same health impact interval (100.0% success).
The same conclusions were derived for PM2.5. The comparison between daily AQI values derived via the Aether device and the corresponding values derived via the NOA monitoring station are almost identical (Figure 10). For 12 of the 13 consecutive days, the AQI daily value lies (for both the Aether device and the NOA monitoring station) within the same health impact interval (92.3% success). More specifically, for only 1 day the AQI value according to NOA was marginally larger than 150 (Unhealthy) and at the same time according to the Aether device was more than 50 and less than 100 (Unhealthy for Sensitive Groups).

4. Discussion and Conclusions

A low-cost sensor device for urban air quality monitoring which was designed by a private Athens-based company and the authors was tested and compared with a static, fixed-site air pollution monitoring station. The device supports sensing of a variety gas concentrations using Alphasense Ltd. (Great Notley, UK) electrochemical sensors and an optical particle counter (OPC) for PM1, PM2.5 and PM10 particulate matter. Two surveys were conducted for the low-cost sensing device. The first one explored the evaluation of the measured concentrations and the second the worth of providing valuable information concerning human health impact due to air pollution, in other words the evaluation of the information through the application of the well-known air quality index AQI.
The evaluation of the performance of a device with electrochemical sensors, installed in an urban environment took part in central Athens, Greece, in the area of the National Observatory of Athens (Thissio). As the results may vary depending on the field conditions and different applications, it was concluded that the main challenges of using such devices with electrochemical sensors depend on to what extent the data quality as well as the respective information through these data will be used. The main results of this study are summarized below:
  • There are differences concerning the absolute values between the Aether device and the corresponding NOA monitoring station (reference measurements). Relatively high values of MAE and RMSE were observed indicating poor performance. Furthermore, positive values of MBE indicated an overestimation of air pollution by the use of the Aether device.
  • The comparison between the Aether device measurements and the NOA fixed-site monitoring station’s corresponding measurements presents a coefficient of determination which ranges between 0.510 (O3) and 0.702 (NO2). This indicates a significant correlation between Aether and NOA measurements at a statistical significant level of p < 0.005.
  • With regard to the prediction of different AQI’s human health impact intervals, during the period under examination, the statistical indices TPR, FNR and FPR can be seen in detail. TPR ranges from 35.2% up to 100.0%, FPR from 0.0% up to 36.1% and FNR from 0.0% up to 38.1%. Taking into account these statistical values, we conclude that the Aether device can be a sufficient low-cost solution for monitoring and quantifying the air quality.
  • In general terms, the vast majority of the false health impact predictions through the use of AQI revealed that the Aether device overestimates the air quality levels. This means that when we are going to use this device, it might provide information for the next worst AQI health impact categorization level than is actually the case.
Therefore, if the reason that someone chooses to use such devices is not to measure the absolute concentration values, but to indicate the quality of the atmospheric environment through different health impact levels, then the Aether low-cost device may successfully fit this purpose. Of course, the long-term stability of electrochemical sensors must be further examined using the same method which has been partially described, in order to determine the overall use of such devices compared to big and expensive air quality monitoring stations.
Finally, the limitations of the methodology followed that impacted or influenced the interpretation of the findings in the specific research should be mentioned. First of all, the length of the measuring period should be longer in order to cover extreme weather conditions, different seasons and an in-depth study of Aether behavior in different atmospheric events. Moreover, installing more devices not only in one monitoring site but in different areas or even cities is required. Therefore, the authors have already expanded their network with a number of similar devices, in different locations within Athens, improving their field experience along with the already existing data methodology. The authors believe that the vital question raised through this work has been answered. Τhe usage of low-cost sensing devices, such as Aether, for air pollution measurements in urban environments provides sufficient and correct information concerning adverse health effects due to air pollution. This kind of information is very important for people (residents and visitors of the city) in order to schedule their daily outdoor activity, as well as for the state in order to take the appropriate measures to avoid short-term and long-term hazardous public health impacts.
The authors believe that future improved electrochemical sensor devices will be able to create databases suitable for the creation of models determining the air quality of the atmosphere and environment in many different areas. The effects on public health, through appropriate tools will be recorded and provided as information. Such databases, of high spatial resolution, will enable—in the long run—the scientific community, using all the above tools, to prepare studies and scenarios for taking appropriate measures and decisions by the state, in order to protect the environment and public health. There will be realistic depiction of the prevailing conditions on maps, as well as the development of special platforms for informing the public. Every citizen or organization, through easy access (e.g., mobile phone, computer, tablet, etc.), will be able to see in real time the conditions prevailing in terms of air pollution and noise pollution in all the study areas, select the information that appeals to them, and decide on their activities in each area. Summarizing, through a dense network of electrochemical sensors, real data will be available due to the small number of installed atmospheric quality monitoring stations.

Author Contributions

Conceptualization and methodology: G.C.S., P.T.N. and K.P.M.; Software, validation and formal analysis: G.C.S., P.T.N. and K.P.M.; Investigation, resources, data curation, writing—original draft preparation, G.C.S.; Writing—review and editing, visualization, supervision, project administration: G.C.S., P.T.N. and K.P.M. All authors have read and agreed to the published version of the manuscript.

Funding

This research received no external funding.

Institutional Review Board Statement

Not applicable.

Informed Consent Statement

Not applicable.

Data Availability Statement

The data presented in this study are available on request from the corresponding author. The data are not publicly available due to privacy restrictions.

Acknowledgments

The authors would like to thank the Atmospheric Chemistry Laboratory of the National Observatory of Athens for the access on the monitoring station at Thissio (Athens) for the equipment comparison purposes.

Conflicts of Interest

The authors declare no conflict of interest.

References

  1. Nastos, P.T.; Matzarakis, A. Weather Impacts on Respiratory Infections in Athens, Greece. Int. J. Biometeorol. 2006, 50, 358–369. [Google Scholar] [CrossRef]
  2. Pope, C.A.; Dockery, D.W.; Schwartz, J. Review of Epidemiological Evidence of Health Effects of Particulate Air Pollution. Inhal. Toxicol. 1995, 7, 1–18. [Google Scholar] [CrossRef]
  3. Pateraki, S.; Fameli, K.-M.; Assimakopoulos, V.; Bougiatioti, A.; Maggos, T.; Mihalopoulos, N. Levels, Sources and Health Risk of PM2.5 and PM1-Bound PAHs across the Greater Athens Area: The Role of the Type of Environment and the Meteorology. Atmosphere 2019, 10, 622. [Google Scholar] [CrossRef] [Green Version]
  4. WHO. Available online: https://www.who.int/westernpacific/health-topics/air-pollution (accessed on 26 April 2021).
  5. Cities Alliance. The Benefits of Urban Environmental Planning; Cities Alliance, United Nations Environment Programme (UNEP), and ICLEI—Local Governments for Sustainability: Washington, DC, USA, 2007; p. 162. [Google Scholar]
  6. Guerreiro, C.; González Ortiz, A.; de Leeuw, F.; Viana, M.; Horálek, J.; European Environment Agency. Air Quality in Europe—2016 Report; Publications Office of the European Union: Luxembourg, 2016; ISBN 978-92-9213-847-9. [Google Scholar]
  7. Fu, H.; Chen, J. Formation, Features and Controlling Strategies of Severe Haze-Fog Pollutions in China. Sci. Total Environ. 2017, 578, 121–138. [Google Scholar] [CrossRef] [PubMed]
  8. Tian, J.; Li, W. Pheromone-Based Genetic Algorithm Adaptive Selection Algorithm in Cloud Storage. Int. J. Grid Distrib. Comput. 2016, 9, 269–278. [Google Scholar] [CrossRef]
  9. Wang, Y.; Yao, L.; Wang, L.; Liu, Z.; Ji, D.; Tang, G.; Zhang, J.; Sun, Y.; Hu, B.; Xin, J. Mechanism for the Formation of the January 2013 Heavy Haze Pollution Episode over Central and Eastern China. Sci. China Earth Sci. 2014, 57, 14–25. [Google Scholar] [CrossRef]
  10. Tsiflikiotou, M.A.; Kostenidou, E.; Papanastasiou, D.K.; Patoulias, D.; Zarmpas, P.; Paraskevopoulou, D.; Diapouli, E.; Kaltsonoudis, C.; Florou, K.; Bougiatioti, A.; et al. Summertime Particulate Matter and Its Composition in Greece. Atmos. Environ. 2019, 213, 597–607. [Google Scholar] [CrossRef]
  11. Marinov, M.B.; Topalov, I.; Gieva, E.; Nikolov, G. Air Quality Monitoring in Urban Environments. In Proceedings of the 39th International Spring Seminar on Electronics Technology (ISSE), Pilsen, Czech Republic, 18–22 May 2016; pp. 443–448. [Google Scholar] [CrossRef]
  12. EUR-Lex—32008L0050—EN—EUR-Lex. Available online: https://eur-lex.europa.eu/legal-content/en/ALL/?uri=CELEX%3A32008L0050 (accessed on 30 June 2021).
  13. de Nazelle, A.; Seto, E.; Donaire-Gonzalez, D.; Mendez, M.; Matamala, J.; Nieuwenhuijsen, M.J.; Jerrett, M. Improving Estimates of Air Pollution Exposure through Ubiquitous Sensing Technologies. Environ. Pollut. 2013, 176, 92–99. [Google Scholar] [CrossRef] [PubMed] [Green Version]
  14. Aguiar, E.F.K.; Roig, H.L.; Mancini, L.H.; de Carvalho, E.N.C.B. Low-Cost Sensors Calibration for Monitoring Air Quality in the Federal District—Brazil. JEP 2015, 06, 173–189. [Google Scholar] [CrossRef] [Green Version]
  15. Borrego, C.; Costa, A.M.; Ginja, J.; Amorim, M.; Coutinho, M.; Karatzas, K.; Sioumis, T.; Katsifarakis, N.; Konstantinidis, K.; De Vito, S.; et al. Assessment of Air Quality Microsensors versus Reference Methods: The EuNetAir Joint Exercise. Atmos. Environ. 2016, 147, 246–263. [Google Scholar] [CrossRef] [Green Version]
  16. Cross, E.S.; Williams, L.R.; Lewis, D.K.; Magoon, G.R.; Onasch, T.B.; Kaminsky, M.L.; Worsnop, D.R.; Jayne, J.T. Use of Electrochemical Sensors for Measurement of Air Pollution: Correcting Interference Response and Validating Measurements. Atmos. Meas. Tech. 2017, 10, 3575–3588. [Google Scholar] [CrossRef] [Green Version]
  17. Jerrett, M.; Donaire-Gonzalez, D.; Popoola, O.; Jones, R.; Cohen, R.C.; Almanza, E.; de Nazelle, A.; Mead, I.; Carrasco-Turigas, G.; Cole-Hunter, T.; et al. Validating Novel Air Pollution Sensors to Improve Exposure Estimates for Epidemiological Analyses and Citizen Science. Environ. Res. 2017, 158, 286–294. [Google Scholar] [CrossRef]
  18. Nguyen, N.H.; Nguyen, H.X.; Le, T.T.B.; Vu, C.D. Evaluating Low-Cost Commercially Available Sensors for Air Quality Monitoring and Application of Sensor Calibration Methods for Improving Accuracy. Open J. Air Pollut. 2021, 10, 1–17. [Google Scholar] [CrossRef]
  19. Stavroulas, I.; Grivas, G.; Michalopoulos, P.; Liakakou, E.; Bougiatioti, A.; Kalkavouras, P.; Fameli, K.M.; Hatzianastassiou, N.; Mihalopoulos, N.; Gerasopoulos, E. Field Evaluation of Low-Cost PM Sensors (Purple Air PA-II) under Variable Urban Air Quality Conditions, in Greece. Atmosphere 2020, 11, 926. [Google Scholar] [CrossRef]
  20. Mead, M.I.; Popoola, O.A.M.; Stewart, G.B.; Landshoff, P.; Calleja, M.; Hayes, M.; Baldovi, J.J.; McLeod, M.W.; Hodgson, T.F.; Dicks, J.; et al. The Use of Electrochemical Sensors for Monitoring Urban Air Quality in Low-Cost, High-Density Networks. Atmos. Environ. 2013, 70, 186–203. [Google Scholar] [CrossRef] [Green Version]
  21. Wesseling, J.; de Ruiter, H.; Blokhuis, C.; Drukker, D.; Weijers, E.; Volten, H.; Vonk, J.; Gast, L.; Voogt, M.; Zandveld, P.; et al. Development and Implementation of a Platform for Public Information on Air Quality, Sensor Measurements, and Citizen Science. Atmosphere 2019, 10, 445. [Google Scholar] [CrossRef] [Green Version]
  22. European Commission; Joint Research Centre. Evaluation of Low-Cost Sensors for Air Pollution Monitoring: Effect of Gaseous Interfering Compounds and Meteorological Conditions; Publications Office: Luxembourg, 2017. [Google Scholar]
  23. Spinelle, L.; Aleixandre, M.; Gerboles, M.; European Commission; Joint Research Centre; Institute for Environment and Sustainability. Protocol of Evaluation and Calibration of Low-Cost Gas Sensors for the Monitoring of Air Pollution; Publications Office: Luxembourg, 2013; ISBN 978-92-79-32691-2. [Google Scholar]
  24. Castell, N.; Dauge, F.R.; Schneider, P.; Vogt, M.; Lerner, U.; Fishbain, B.; Broday, D.; Bartonova, A. Can Commercial Low-Cost Sensor Platforms Contribute to Air Quality Monitoring and Exposure Estimates? Environ. Int. 2017, 99, 293–302. [Google Scholar] [CrossRef]
  25. Mijling, B.; Jiang, Q.; de Jonge, D.; Bocconi, S. Practical Field Calibration of Electrochemical NO2 Sensors for Urban Air Quality Applications. Atmos. Meas. Tech. Discuss. 2017. [Google Scholar] [CrossRef] [Green Version]
  26. Mawrence, R.; Munniks, S.; Valente, J. Calibration of Electrochemical Sensors for Nitrogen Dioxide Gas Detection Using Unmanned Aerial Vehicles. Sensors 2020, 20, 7332. [Google Scholar] [CrossRef] [PubMed]
  27. Rai, A.C.; Kumar, P.; Pilla, F.; Skouloudis, A.N.; Sabatino, S.D.; Ratti, C.; Yasar, A.; Rickerby, D. End-User Perspective of Low-Cost Sensors for Outdoor Air Pollution Monitoring. Sci. Total Environ. 2017, 607–608, 691–705. [Google Scholar] [CrossRef] [PubMed] [Green Version]
  28. Office of Air Quality Planning and Standards Technical Assistance Document for the Reporting of Daily Air Quality—The Air Quality Index (AQI). 2018. Available online: https://www.airnow.gov/publications/air-quality-index/technical-assistance-document-for-reporting-the-daily-aqi/ (accessed on 11 February 2021).
  29. Borghi, F.; Spinazzè, A.; Rovelli, S.; Campagnolo, D.; del Buono, L.; Cattaneo, A.; Cavallo, D. Miniaturized Monitors for Assessment of Exposure to Air Pollutants: A Review. Int. J. Environ. Res. Public Health 2017, 14, 909. [Google Scholar] [CrossRef] [Green Version]
  30. Idrees, Z.; Zheng, L. Low Cost Air Pollution Monitoring Systems: A Review of Protocols and Enabling Technologies. J. Ind. Inf. Integr. 2020, 17, 100123. [Google Scholar] [CrossRef]
  31. Kumar, P.; Morawska, L.; Martani, C.; Biskos, G.; Neophytou, M.; Di Sabatino, S.; Bell, M.; Norford, L.; Britter, R. The Rise of Low-Cost Sensing for Managing Air Pollution in Cities. Environ. Int. 2015, 75, 199–205. [Google Scholar] [CrossRef] [PubMed] [Green Version]
  32. Spyropoulos, G.; Nastos, P.; Moustris, K.; Katopodis, T.; Ntourou, K. The Use of Low-Cost Sensing for Air Pollution Measurements in Urban Outdoor Environments. In Proceedings of the 14th International Conference on Meteorology, Climatology and Atmospheric Physics (COMECAP), Alexandroupolis, Greece, 15–17 October 2018. [Google Scholar]
  33. Brattich, E.; Bracci, A.; Zappi, A.; Morozzi, P.; Di Sabatino, S.; Porcù, F.; Di Nicola, F.; Tositti, L. How to Get the Best from Low-Cost Particulate Matter Sensors: Guidelines and Practical Recommendations. Sensors 2020, 20, 3073. [Google Scholar] [CrossRef]
  34. AirNow.Gov. Available online: https://www.airnow.gov/ (accessed on 11 February 2021).
  35. Blythe, P.; Neasham, J.; Sharif, B.; Watson, P.; Bell, M.C.; Edwards, S.; Suresh, V.; Wagner, J.; Bryan, H. An Environmental Sensor System for Pervasively Monitoring Road Networks. In Proceedings of the IET Road Transport Information and Control—RTIC 2008 and ITS United Kingdom Members’ Conference, Manchester, UK, 20–22 May 2008; pp. 1–10. [Google Scholar] [CrossRef]
  36. Weissert, L.F.; Alberti, K.; Miskell, G.; Pattinson, W.; Salmond, J.A.; Henshaw, G.; Williams, D.E. Low-Cost Sensors and Microscale Land Use Regression: Data Fusion to Resolve Air Quality Variations with High Spatial and Temporal Resolution. Atmos. Environ. 2019, 213, 285–295. [Google Scholar] [CrossRef]
  37. Schneider, P.; Castell, N.; Vogt, M.; Dauge, F.; Lahoz, W.; Bartonova, A. Mapping Urban Air Quality in near Real-Time Using Observations from Low-Cost Sensors and Model Information. Environ. Int. 2017, 106, 234–247. [Google Scholar] [CrossRef]
  38. Lim, C.C.; Kim, H.; Vilcassim, M.J.R.; Thurston, G.D.; Gordon, T.; Chen, L.-C.; Lee, K.; Heimbinder, M.; Kim, S.-Y. Mapping Urban Air Quality Using Mobile Sampling with Low-Cost Sensors and Machine Learning in Seoul, South Korea. Environ. Int. 2019, 131, 105022. [Google Scholar] [CrossRef]
  39. Tasic, V.; Jovašević-Stojanović, M.; Topalovic, D.; Davidovic, M. Measurement of PM2.5 Concentrations in Indoor Air Using Low-Cost Sensors and Arduino Platforms. In Proceedings of the New Sensing Technologies for Air-Pollution Control and Environmental Sustainability—Final Meeting—Sixth Scientific Meeting, Prague, Czech Republic, 5–7 October 2016. [Google Scholar] [CrossRef]
  40. de Oliveira, R.H.; Carneiro, C.; Almeida, F.; Meirelles, B.; Nunes, E.; Santos, A. Multivariate Air Pollution Classification in Urban Areas Using Mobile Sensors and Self-Organizing Maps. Int. J. Environ. Sci. Technol. 2019, 16, 5475–5488. [Google Scholar] [CrossRef]
  41. Spinelle, L.; Gerboles, M.; Villani, M.G.; Aleixandre, M.; Bonavitacola, F. Calibration of a Cluster of Low-Cost Sensors for the Measurement of Air Pollution in Ambient Air. In Proceedings of the Sensors 2014, Valencia, Spain, 2–5 November 2014; Institute of Electrical and Electronics Engineers (IEEE): Interlaken, Switzerland, 2014; pp. 21–24. [Google Scholar]
  42. Boslaugh, S.; Watters, P.A. Statistics in a Nutshell; O’Reilly: Farnham, UK, 2008; ISBN 978-0-596-51049-7. [Google Scholar]
  43. Nastos, P.T.; Vassilakis, E.; Nastos, M.-P.P.; Charalampopoulos, I.; Matzarakis, A. Assessment of Continuous Sky View Factor Based on Ultra-High Resolution Natural Colour Images Acquired by Remotely Piloted Airborne Systems for Applications in an Urban Area of Athens. Int. J. Remote Sens. 2017, 38, 5814–5829. [Google Scholar] [CrossRef]
  44. Wang, W.; Lu, Y. Analysis of the Mean Absolute Error (MAE) and the Root Mean Square Error (RMSE) in Assessing Rounding Model. IOP Conf. Ser. Mater. Sci. Eng. 2018, 324, 012049. [Google Scholar] [CrossRef]
  45. Moustris, K.P.; Ziomas, I.C.; Paliatsos, A.G. 3-Day-Ahead Forecasting of Regional Pollution Index for the Pollutants NO2, CO, SO2, and O3 Using Artificial Neural Networks in Athens, Greece. Water Air Soil Pollut. 2010, 209, 29–43. [Google Scholar] [CrossRef]
  46. Ranadip, P. Predictive Modeling of Drug Sensitivity; Academic Press: Cambridge, MA, USA, 15 November 2016; ISBN 978-0-12-805274-7. [Google Scholar]
  47. Argyropoulos, G.; Samara, C.; Diapouli, E.; Eleftheriadis, K.; Papaoikonomou, K.; Kungolos, A. Source Apportionment of PM10 and PM2.5 in Major Urban Greek Agglomerations Using a Hybrid Source-Receptor Modeling Process. Sci. Total Environ. 2017, 601–602, 906–917. [Google Scholar] [CrossRef] [PubMed]
  48. Paraskevopoulou, D.; Liakakou, E.; Gerasopoulos, E.; Mihalopoulos, N. Sources of Atmospheric Aerosol from Long-Term Measurements (5years) of Chemical Composition in Athens, Greece. Sci. Total Environ. 2015, 527–528, 165–178. [Google Scholar] [CrossRef]
  49. Jayaratne, R.; Liu, X.; Thai, P.; Dunbabin, M.; Morawska, L. The Influence of Humidity on the Performance of a Low-Cost Air Particle Mass Sensor and the Effect of Atmospheric Fog. Atmos. Meas. Tech. 2018, 11, 4883–4890. [Google Scholar] [CrossRef] [Green Version]
  50. VAQUUMS. Available online: https://vaquums.eu (accessed on 29 June 2021).
  51. CEN—European Committee for Standardization. Available online: https://standards.cen.eu/index.html (accessed on 29 June 2021).
  52. Vittorio, L. The EveryAware Project. Available online: http://www.everyaware.eu/ (accessed on 29 June 2021).
  53. EU-SENSE. European Sensor System for CBRN applications. Available online: https://eu-sense.eu/ (accessed on 29 June 2021).
  54. Joint Research Centre. Available online: https://ec.europa.eu/info/departments/joint-research-centre_en (accessed on 29 June 2021).
  55. Kyrkilis, G.; Chaloulakou, A.; Kassomenos, P.A. Development of an Aggregate Air Quality Index for an Urban Mediterranean Agglomeration: Relation to Potential Health Effects. Environ. Int. 2007, 33, 670–676. [Google Scholar] [CrossRef]
  56. Van den Elshout, S.; Léger, K.; Nussio, F. Comparing Urban Air Quality in Europe in Real Time. Environ. Int. 2008, 34, 720–726. [Google Scholar] [CrossRef]
  57. Monteiro, A.; Vieira, M.; Gama, C.; Miranda, A.I. Towards an Improved Air Quality Index. Air Qual. Atmos. Health 2017, 10, 447–455. [Google Scholar] [CrossRef]
  58. Cochran, L.S.; Pielke, R.A.; Kovács, E. Selected International Receptor-Based Air Quality Standards. J. Air Waste Manag. Assoc. 1992, 42, 1567–1572. [Google Scholar] [CrossRef] [Green Version]
  59. Anderson, G.B.; Krall, J.R.; Peng, R.D.; Bell, M.L. Is the Relation Between Ozone and Mortality Confounded by Chemical Components of Particulate Matter? Analysis of 7 Components in 57 US Communities. Am. J. Epidemiol. 2012, 176, 726–732. [Google Scholar] [CrossRef] [Green Version]
  60. Liu, Y.; Zhao, N.; Vanos, J.K.; Cao, G. Effects of Synoptic Weather on Ground-Level PM2.5 Concentrations in the United States. Atmos. Environ. 2017, 148, 297–305. [Google Scholar] [CrossRef]
  61. Vanos, J.K.; Hebbern, C.; Cakmak, S. Risk Assessment for Cardiovascular and Respiratory Mortality Due to Air Pollution and Synoptic Meteorology in 10 Canadian Cities. Environ. Pollut. 2014, 185, 322–332. [Google Scholar] [CrossRef] [PubMed] [Green Version]
Figure 1. Aether low-cost sensor device for urban air quality monitoring.
Atmosphere 12 01246 g001
Figure 2. Scatterplot (a) and time series (b) of nitrogen dioxide (NO2) records.
Atmosphere 12 01246 g002
Figure 3. Scatterplot (a) and time series (b) of ozone (O3) records.
Atmosphere 12 01246 g003
Figure 4. Scatterplot (a) and time series (b) of PM10 records.
Atmosphere 12 01246 g004
Figure 5. Scatterplot (a) and time series (b) of PM2.5 records.
Atmosphere 12 01246 g005
Figure 6. Scatterplot between NOA station and Aether device for air temperature (a) and relative humidity (b) measurements.
Atmosphere 12 01246 g006
Figure 7. AQI daily values for NO2 according to NOA monitoring station and Aether device measurements. The green dot line represents the threshold value AQI = 50.
Atmosphere 12 01246 g007
Figure 8. AQI daily values for O3 (8 h moving average concentration) according to NOA monitoring station and Aether device measurements. The dots colored lines represent the AQI threshold values between different AQI intervals (health impacts).
Atmosphere 12 01246 g008
Figure 9. AQI daily values for PM10 according to NOA monitoring station and Aether device measurements. The green dot line represents the threshold value AQI = 50.
Atmosphere 12 01246 g009
Figure 10. AQI daily values for PM2.5 according to NOA monitoring station and Aether device measurements. The dots colored lines represent the AQI threshold values between different AQI intervals (health impacts).
Atmosphere 12 01246 g010
Table 1. Evaluation statistical indices between NOA station and Aether device measurements.
NO2O3PM10PM2.5TRH
N
(Number of data points—hours)
37735337313392392
R2
(Coefficient of determination)
0.7020.5100.6370.5620.9590.936
MAE
(Mean Absolute Error)
8.64 (ppb)18.38 (ppb)15.47 (μgr/m3)6.38 (μgr/m3)0.56 (°C)2.42 (%)
16.5 (μgr/m3)36.6 (μgr/m3)
MBE
(Mean Bias Error)
2.29 (ppb)7.78 (ppb)−1.53 (μgr/m3)−0.93 (μgr/m3)−0.04 (°C)−0.34 (%)
4.4 (μgr/m3)15.5 (μgr/m3)
RMSE
(Root Mean Square Error)
12.60 (ppb)23.69 (ppb)25.42 (μgr/m3)10.30 (μgr/m3)0.75 (°C)3.23 (%)
24.1 (μgr/m3)47.2 (μgr/m3)
Table 2. Statistical indices for the evaluation of the Aether device ability to predict the right interval of Air Quality Index (AQI) in comparison with NOA measurements.
PollutantAQI IntervalXYZNTPR%FNR%FPR%
NO2AQI (0–50)32903736689.90.010.1
AQI (51–100)10101190.99.10.0
O3AQI (0–50)17405723175.30.024.7
AQI (51–100)38313910835.228.736.1
AQI (101–150)181684242.938.119.0
PM10AQI (0–50)24101025196.00.04.0
AQI (51–100)10612011889.810.20.0
PM2.5AQI (0–50)2002100.00.00.0
AQI (51–100)6006100.00.00.0
AQI (101–150)4004100.00.00.0
AQI (151–200)01010.0100.00.0
Publisher’s Note: MDPI stays neutral with regard to jurisdictional claims in published maps and institutional affiliations.

