Leading science cities’ output related to the United Nations’ 17 Sustainable Development Goals (SDGs) speak to research strengths and priorities. This analysis features articles in the 82 selected natural-sciences journals tracked by the Nature Index that were filtered using SDG-related classifiers in Digital Science’s Dimensions database.
Nature Index’s signature metric, Share, is used to measure cities’ SDG-related article output for the period 2015–20. Share is a fractional count for an article allocation to an institution, city or country/region, that accounts for the proportion of authors on the article whose institutional affiliation is with that institution or location. (For more information on the analyses used in this article, see ‘A guide to Nature Index’.)
Sustainable agenda
City/metropolitan area |
Location |
Total Share for 17 SDGs, 2015–20 |
Proportion of total Share related to 17 SDGs |
Beijing |
China mainland, Hong Kong, Macau |
1,753.49 |
11.9% |
San Francisco Bay Area |
United States |
875.16 |
8.5% |
New York metropolitan area |
United States |
862.76 |
7.0% |
Baltimore–Washington |
United States |
745.40 |
8.9% |
Boston metropolitan area |
United States |
720.97 |
6.5% |
Shanghai |
China mainland, Hong Kong, Macau |
579.22 |
7.9% |
Nanjing |
China mainland, Hong Kong, Macau |
499.42 |
10.5% |
Singapore |
Singapore |
427.73 |
11.9% |
Los Angeles metropolitan area |
United States |
414.82 |
7.8% |
Seoul metropolitan area |
South Korea |
395.26 |
8.7% |
Wuhan |
China mainland, Hong Kong, Macau |
325.73 |
9.8% |
Chicago metropolitan area |
United States |
316.02 |
6.7% |
Paris metropolitan area |
France |
300.29 |
5.1% |
San Diego metropolitan area |
United States |
295.05 |
8.0% |
Guangzhou |
China mainland, Hong Kong, Macau |
286.37 |
9.8% |
Tokyo metropolitan area |
Japan |
278.98 |
3.7% |
Tianjin |
China mainland, Hong Kong, Macau |
273.49 |
12.5% |
London metropolitan area |
United Kingdom |
268.96 |
6.0% |
Boulder |
United States |
266.42 |
16.3% |
Zurich |
Switzerland |
258.72 |
7.2% |
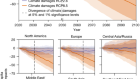
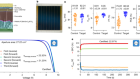
Top targets
SDG-related output for 20 leading science cities in the Nature Index is mapped against the three leading SDGs in the index. Performance over time is indicated by coloured arrows, which track whether cities’ output related to the three SDGs has increased, decreased or remained the same over the period 2015–20.

Data analysis by Catherine Cheung; infographic by Bec Crew, Tanner Maxwell and David Payne
The complete visualization, showing 20 cities’ performance in 10 selected SDGs, can be viewed in the PDF version of this article.
A tale of three cities
Baltimore–Washington is the most prolific area for SDG3-related research, with a Share of 264.45. Baltimore is home to Johns Hopkins University, which in 2019 spent a record US$2.9 billion on research and development, higher than any other university in the United States for the 41st consecutive year, according to the US National Science Foundation. Despite such strong commitment to research, the city has significant health inequalities. The 2018 State of Health in Baltimore white paper reports that life expectancy varies by up to 19 years between neighbourhoods.
Nature Index 2021 Science cities
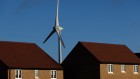
Many major science cities are highly active in clean-energy research, often in response to local challenges. Beijing leads, with a Share of 1,241.53 for SDG7. The city hosts the Bluetech Clean Air Alliance, a non-profit organization launched in 2012 to improve China’s air quality. Of its 31 institutional members, 21 are drawn from the Chinese cities highlighted here, including 12 in Beijing.
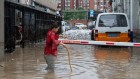
Institutions in Boulder, Colorado, have the highest proportion of total research output related to all 17 SDGs (16.3%) among the leading 20 cities. The city’s strongest performance is for SDG13 (ranked fifth), with a Share of 197.79. In 2018, Boulder and San Miguel counties partnered with the city of Boulder to file a lawsuit against Suncor and ExxonMobil for contributions to climate change, they claim the oil companies have made — the impacts of which include wildfires and drought.

 Sustainable Development Goals research speaks to city strengths and priorities
 How cities are collaborating to safeguard oceans
 Rising tide of floating plastics spurs surge in research
 Coral conservation strikes a balance
 Uneven spread of research leaves poorer cities short of solutions
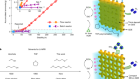
 Pursuit of better batteries underpins China’s lead in energy research
 How Belo Horizonte’s bid to tackle hunger inspired other cities
 New York bids to level the playing field in a metropolis of inequality