

Abstract
Measuring the polarization state of light has become a challenging study owing to its requirement to simultaneously extract the phase and amplitude parameters with high precision. Here, we present a weak measurement (WM) scheme with two pointers to determine a general polarization state. For the output spectrum from the WM regime, one pointer with the light frequency is used to measure the phase parameter while the other with the post-selected probability is to measure the amplitude. The optimized regime permits the simultaneous measurements of two parameters since the shift results of both two pointers are read in the same working regions. The simulated results show high sensitivity for both two parameters, and high precision that can be comparable with that by other existing schemes. Our scheme can be applied to measure other complex physical effects, providing a method for future ultra-sensitive sensing and metrology.
Export citation and abstract BibTeX RIS
Determination of polarization states of light plays a vital role in both basic and applied science. For instance, in many cases the prediction for the behavior of a polarization system, the detection for the chirality signal, and the observation for the magneto-optical effect, intrinsically require precise measurements of the polarization states. 1–7) A crucial feature of the polarization state is that it is described in general by a complex number, in which the real and imaginary parts refer to the amplitude and phase of eigenstates, respectively. Therefore, simultaneously determining its amplitude and phase with high precision has been a challenging task. Recently, weak measurement (WM) has become a considerable method due to its wide application in precision metrology. 8–19)
WM, which was originally introduced by Aharonov, Albert, and Vaidman in 1988, 20) couples the system and meter so weakly that the test system state does not collapse. Subsequent projective measurement on the system gives rise to a measurable complex number value as the "weak value", which exactly reveals the information of the system state. Inspired by this concept, many schemes have been successively proposed to measure the polarization state of light. For example, Salvail et al. measured general polarization states by reading the real and imaginary parts of the weak value in position and momentum spaces, respectively. 21) Hariri et al. further achieved the simultaneous readout of the real and imaginary parts by introducing two WMs for the same test polarization system, which comes at the sacrifice of the weak-value-based amplification effect. 22) Xu et al. suggested that the measurements can also be implemented via WMs in frequency domain, which show higher precision and better robustness. 23,24) However, the traditional pointer with the light frequency is incapable of measuring the amplitude and phase simultaneously, thus reducing the measurement efficiency. Now, a question arises as to whether the simultaneous measurements can be achieved if introducing the other efficient pointer for WMs in frequency domain?
In this work, we propose a WM scheme with two pointers to measure a general polarization state. One pointer with the light frequency is used to measure the phase, and the other pointer with the post-selected probability is introduced to measure the amplitude. This scheme allows one to read the shifts of these two pointers in the same working regions, thus guaranteeing the high efficiency of simultaneously measuring amplitude and phase by only an optical spectrum analyzer. Our analysis suggests that both amplitude and phase can be estimated with high sensitivity, the best attainable sensitivity is comparable to that obtained with other currently practical WM schemes.
We begin by considering the pointer with the light frequency to measure the phase of a pure polarization state. A general state can be described by  , where
  and
and  are the vector of forming the Pauli matrices and the unit vector represented in the Bloch sphere, respectively. Here, the amplitude parameter is assumed as χ = π/2 in order to analyze the phase ϕ alone. The input state of the other auxiliary system, the meter, is ρM
= ∣φi
〉〈φi
∣. The meter wavefunction is taken as a real Gaussian in the frequency space, i.e.
are the vector of forming the Pauli matrices and the unit vector represented in the Bloch sphere, respectively. Here, the amplitude parameter is assumed as χ = π/2 in order to analyze the phase ϕ alone. The input state of the other auxiliary system, the meter, is ρM
= ∣φi
〉〈φi
∣. The meter wavefunction is taken as a real Gaussian in the frequency space, i.e. ![$\langle \omega | {\varphi }_{i}\rangle =f{(\omega )\propto \exp [-(\omega -{\omega }_{0})}^{2}/4{\sigma }^{2}]$](https://content.cld.iop.org/journals/1882-0786/14/10/102007/revision2/apexac2399ieqn4.gif) . The frequency
. The frequency  then is coupled feebly to the system observable
  (
( in the polarization degree of freedom) via the interaction
  . The time delay τ serves as the coupling strength. Depending on the measurement proposal, projective measurements on the system and meter, described by ΠS
= (I − σx
)/2 and ΠR
= ∣ω〉〈ω∣ (i.e. R1 = ω), respectively, need to be performed subsequently. By making the shift processing for the above measurement results, the average spectrum shift is given by
. The time delay τ serves as the coupling strength. Depending on the measurement proposal, projective measurements on the system and meter, described by ΠS
= (I − σx
)/2 and ΠR
= ∣ω〉〈ω∣ (i.e. R1 = ω), respectively, need to be performed subsequently. By making the shift processing for the above measurement results, the average spectrum shift is given by
where  and
and  . However, in fact there exists some systematic errors in whole measurement process, which are also required for the high precision measurements due to its contribution to the lowered uncertainty. For concreteness, we introduce corresponding action operators representing these errors on the observable polarization system:
25)
. However, in fact there exists some systematic errors in whole measurement process, which are also required for the high precision measurements due to its contribution to the lowered uncertainty. For concreteness, we introduce corresponding action operators representing these errors on the observable polarization system:
25)
 ,
,  , and
, and  , where
  and θ refer to the systematic errors in amplitude and phase, respectively. ν shows the same dimension as the time delay, whose action operator implies the correlation between the system and the meter. Besides, the error describing the uniform loss in measurements should be considered, i.e.
  , where γ ≪ 1. In this way, the evolution operator in Eq. (1) becomes
  . Under the prerequisite approximation of ∣ϕ + 2ω0
τ∣ ≪ ∣2σ(τ + ν)∣ ≪ 1 as the optimization of the WM regime, we get the average spectrum shift
. Under the prerequisite approximation of ∣ϕ + 2ω0
τ∣ ≪ ∣2σ(τ + ν)∣ ≪ 1 as the optimization of the WM regime, we get the average spectrum shift
Thus, a linear WM regime for measuring ϕ is generated, whose feasibility has been shown experimentally. 25) Such an applicable pointer with the light frequency (R1 = ω) attracts the further attempt for measuring the other parameter, the amplitude χ. As suggested by the study, 25) the sensitivity of measuring the amplitude parameter may attain the highest level when δ〈ω〉 is at the maximum value, which is in the working region of ∣ϕ + 2ω0 τ∣ ∼ ∣2σ(τ + ν)∣. Accordingly, the average spectrum shift is given by
where κ = (π − 2χ)/4. ζ = 1 − 2 describes the influence from the amplitude error. Moreover, the phase is temporarily ignored in order to analyze the amplitude alone.
In Fig. 1, we plot the average spectrum shifts as functions of the parameters (ϕ and κ) to be measured using Eqs. (2) and (3), respectively. The input spectrum is considered as a common Gaussian-shape distribution centered at 632.8 nm with a full width at half maximum of 10 nm. Combined with the practical measurement cases, the average systematic errors are set as  mrad and
  as. For a sufficiently small ϕ, the effective working region with high sensitivity is the linear region with τ → 0, as depicted by the blue solid part of the left curve in Fig. 1(a)]. The corresponding output spectrum (given by
  ) shows approximately symmetric bimodal distribution, see the inset of Fig. 1(a). With the increase of ϕ, such a linear working region is valid by increasing τ until Eq. (2) is satisfied, and a symmetric bimodal spectrum emerges again (see the right curve). In this fashion, ϕ can be measured with high sensitivity in a somewhat large dynamic range.
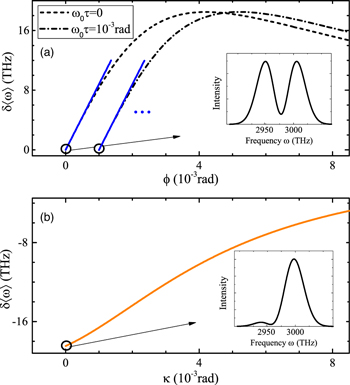
Fig. 1. (Color online) Using the pointer of R1 = ω to measure the phase and amplitude parameters (ϕ and κ). (a) and (b) plot the simulated average spectrum shifts δ〈ω〉 as functions of ϕ and κ, respectively. The solid curves in blue and orange refer to respective effective working regions specified by Eqs. (2) and (3) respectively. The insets represent the respective output spectra of the points labeled by hollow circles.
Download figure:
Standard image High-resolution imageFor the measurement of κ, the effective working region limited by Eq. (3) is suitable for a large dynamic range of κ from 0 to a larger value, as shown by the orange curve in Fig. 1(b). In such a working region, it yields a peculiar output spectrum as the borderline spectrum between the bimodal and unimodal features, see the inset of Fig. 1(b). Obviously, using the same pointer of R1 = ω cannot satisfy the simultaneous readout of ϕ and κ since the measurements of these two parameters are limited in the entirely different working regions as analyzed above. Furthermore, it can be seen from Fig. 1(b) that with the increase of κ to be measured, the sensitivity (described by the gradient of the curve) tends to be reduced appreciably. And, the best attainable sensitivity of measuring κ cannot compete with that of measuring ϕ, see the two distinct gradients of blue and orange curves in Fig. 1.
For those problems, we introduce the other pointer of the post-selected probability (i.e. R2 = 〈ΠS 〉f ) to measure κ while using the pointer of R1 = ω to measure ϕ. Consequently, a WM regime with two pointers is constructed. Having taken in account the necessary systematic errors, the post-selected probability is given by
which can be measured by the same spectrum analyzer as used for the pointer of R1 = ω. As a result, the post-selected light intensity can be read at the detection port. The post-selected probability before measurements and after introducing the parameter κ to be measured, are recorded as 〈ΠS
〉f
∣κ=0 and 〈ΠS
〉f
, respectively. Then, a normalized shift processing is performed for them. Therefore, the shift of post-selected probability is obtained as  . Under the approximation of ∣ϕ + 2ω0
τ∣ ≪ ∣2σ(τ + ν)∣ ≪ 1, we obtain that
. Under the approximation of ∣ϕ + 2ω0
τ∣ ≪ ∣2σ(τ + ν)∣ ≪ 1, we obtain that
Here, the phase is temporarily ignored as before. Equation (5) specifies the same working region as that by Eq. (2) of measuring ϕ using the pointer of R1 = ω, making it possible to simultaneously measure ϕ and κ via the WM regime with two pointers. Interestingly, this working region is not only optimal for measuring ϕ, but also for measuring κ according to the highest attainable sensitivity (characterized by ∂δ〈ω〉/∂ϕ and ∂η/∂κ, respectively). The corresponding η changing with κ is plotted in Fig. 2(a). It shows the same symmetric bimodal spectrum as that of measuring ϕ in the same working regions, see the insets of Figs. 2(a) and 1(a). Besides satisfying the simultaneity of measurements, using the pointer of R2 = 〈ΠS 〉f for measuring κ presents a clear advantage in sensitivity. With the increase of κ, the sensitivity of η with the pointer of R2 = 〈ΠS 〉f tends to be increased greatly, as opposed to that of δ〈ω〉 with the pointer of R1 = ω in Fig. 1(b). The sensitivity is comparable with that in the existing practical WM scheme using the pointer of the post-selected probability, 26) even when κ → 0.
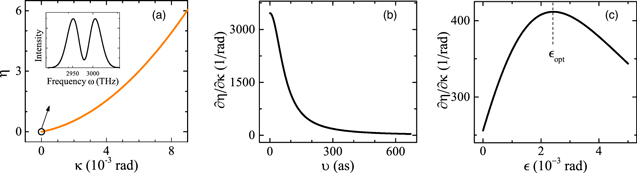
Fig. 2. (Color online) Using the pointer of R2 = 〈ΠS
〉f
in the WM regime is advantageous to measure the amplitude parameter κ. (a) Simulated shift of post-selected probability η as a function of κ with the same systematic errors set as before. The inset gives the output spectrum at κ = 0. (b) and (c) plot the sensitivity (∂η/∂κ) of measuring κ at κ = 2 mrad changing with the errors in phase and amplitude (ν and ), respectively. The remaining errors are set as in (a), i.e.  mrad in (b) and
  as in (c).
Download figure:
Standard image High-resolution imageAdditionally, the systematic errors have effect on the sensitivity of η, which differs from previous study
25) where the sensitivity is monotonically improved with decreasing phase and amplitude errors. Here, the sensitivity tends to be sharply increased with the decrease of the phase error ν, see Fig. 2(b). The changing speed of the increasing sensitivity becomes increased as well. For a certain ν, the sensitivity may reach the maximum when the amplitude error is suppressed to the optimal value

provided that these errors are small enough (i.e. ≪ 1 and ∣ν
σ∣ ≪ 1), also for κ. As shown in Fig. 2(c), the sensitivity begins to be significantly reduced once is further suppressed to be smaller than opt
. Hence, the optimal WM regime may be achieved with ν being suppressed to the lowest possible level under the premise of satisfying the relation between ν and by Eq. (6).
Our aim is to measure a general polarization state conforming the practical situation that both phase and amplitude parameters are contained. In this situation, the polarization system undergoing the pre- and post-selected measurements generates a complex weak value

which exactly contains the two parameters to be measured. Hence, the determination of the polarization state is equivalent to making the tomography of the weak value. In the following, we focus on the WM scheme that two pointers are used to estimate these two parameters simultaneously. The implementation of the scheme is divided into three steps:
- (1)The output spectrum is adjusted to that with symmetric bimodal distribution before measurements. The systematic errors in phase and amplitude, as well as the post-selected light intensity are need to be recorded, which are labeled as
 , , and 〈ΠS
〉f
∣κ=0, respectively.
, , and 〈ΠS
〉f
∣κ=0, respectively. - (2)The parameters describing the polarization state to be measured are introduced, i.e. ϕ and κ. The initial spectrum is then changed.
- (3)A time delay is introduced until a symmetric bimodal spectrum (corresponding to δ〈ω〉 = 0) emerges again. At this time, the time delay is denoted as τ, and the phase parameter is determined as ϕ = − 2ω0 τ using Eq. (2). The amplitude parameter is also estimated by reading the post-selected light intensity 〈ΠS 〉f according to Eq. (5). In this fashion, both ϕ and κ are determined.


As the simulated results of this WM scheme, Fig. 3 shows the normalized shifts of two pointers (δ〈ω〉 and η) as functions of two continuously varying parameters to be measured (ϕ and κ), respectively. Within the optimal working region, δ〈ω〉 is always read over a tiny range around 0 with the increase of ϕ. Here, the parameter κ is also forced to be simultaneously increased with the increase of ϕ, and vice versa. Accordingly, the sensitivity of δ〈ω〉 tends to be reduced to some extent, as shown in Figs. 3(a) and 3(c). For contrast, it can be seen from Fig. 3(d) that the sensitivity of η tends to be increased with the increase of κ even for a gradually increasing ϕ. Overall, these two parameters may cause different levels of constraints in the measurement sensitivity of each other with the increase of them.

Fig. 3. (Color online) Using the WM with two pointers to measure phase and amplitude parameters simultaneously. (a) and (c) show the simulated average spectrum shift and its sensitivity (δ〈ω〉 and ∂δ〈ω〉/∂ϕ) changing with the phase parameter ϕ, respectively. (b) and (d) show the simulated shift of post-selected probability and its sensitivity (η and ∂η/∂κ) changing with the amplitude parameter κ, respectively.
Download figure:
Standard image High-resolution image
It is worth mentioning that it shows high sensitivity when these two parameters are sufficiently small, even achieving high precision with high-resolution detectors. For the measurements of ϕ, the precision may be theoretically reached at ∼ 10−7 rad by the transitive relation Δϕ = Δω/(∂δ〈ω〉/∂ϕ), where the spectrum uncertainty is at least Δω = 10−3 THz using the currently available spectrometer. 23,27,28) For the measurements of κ, the uncertainty of η can be limited under 10−3 according to previous study. 26,29) Our scheme is then capable of attaining the precision of at least ∼10−6 rad by the relation Δκ = Δη/(∂η/∂κ), which is comparable with that by other existing schemes.
With the further increase of these two parameters to be measured, corresponding modulation operation can be carried out. For example, a temporal-delay compensation can be introduced once the parameter ϕ is increased to beyond the valid range as in Fig. 3(a). The optimal compensation amount is given by τM
= − (ϕ/2ω0 + τ) to reset the measured range to the optimal working region.
30) As for the increased parameter κ, the projective measurement on the system is modulated until a set of nearly orthogonal pre- and post-selected states is constructed again [i.e. satisfying  ]. In this way, κ always lies within the range of a low magnitude as in Fig. 3(c), thus eliminating the constraint on the sensitivity of measuring ϕ. A general polarization state containing phase and amplitude parameters then can be precisely estimated in a large dynamic range that may cover the whole surface of the Bloch sphere.
To conclude, we have elucidated the WM scheme with two pointers used for measuring a general polarization state of light. One pointer with the light frequency has been analyzed to measure the phase parameter of the polarization state with high sensitivity. The other pointer with the post-selected probability has been explored to measure the amplitude parameter from the high sensitivity and large dynamic range consideration. The optimal WM regimes for both two parameters are limited in the same working regions, thus achieving the simultaneity of measurements by two pointers. From simulated results, the attainable precision is comparable with that by existing schemes according to the practical resolution of detectors. Furthermore, we have discussed the practical implementation strategy of the scheme and given the modulation-based processing thought for the measurements of parameters in a large dynamic range. We believe that this scheme is a good alternative to the optical precision metrology, especially to the measurements of complex physical effects.
Acknowledgments
This work is supported by the Natural Science Foundation of China (Grant No. 11674234), the Science Specialty Program of Sichuan University (Grant No. 2020SCUNL210), and the Innovation Project of Sichuan University (Grant No. 2018SCUH0021).