
Agricultural Land Transition in the “Groundnut Basin” of Senegal: 2009 to 2018


1
School of Economics and Management, Northeast Agricultural University, Harbin 150030, China
2
School of Public Administration and Law, Northeast Agricultural University, Harbin 150030, China
*
Author to whom correspondence should be addressed.
Land 2021, 10(10), 996; https://doi.org/10.3390/land10100996
Submission received: 15 August 2021
/
Revised: 13 September 2021
/
Accepted: 16 September 2021
/
Published: 22 September 2021
(This article belongs to the Special Issue Land Perspectives: People, Tenure, Planning, Tools, Space, and Health)
Abstract
:The study aims to reveal the transition features of agricultural land use in the Groundnut Basin of Senegal from 2009 to 2018, especially the impact of urbanization on agricultural land and the viewpoint of farmland spatiotemporal evolution. Integrated data of time series MCD12Q1 land-use images of 2009, 2012, 2015, and 2018 were used to provide a land transition in agricultural and urban areas through the synergistic methodology. Socio-economic data was also used to serve as a basis for the argument. The results highlight that: (1) Agricultural land increased by 14.53%, with a dynamic index of 1.45 from 2009–2018. (2) Over the same period, urbanization increased by 2.80%, with a dynamic index of 0.28. (3) In different regions, the transition of agricultural land in Kaffrine is most intense (expansion rate: 22.80%). The same situation of urbanization happened in Thiès Region with a value of 7.94%. Except for Thiès, agricultural land in other regions has not yet been subject to major pressure due to urbanization. Overall, the farming system in Groundnut Basin is an extensive model, the recommendations from the point of view of land-use planning and land law are necessary to ensure efficient agricultural land management in the area.
1. Introduction
Land-use changes are consistently the principal driver of habitat change on approximately half of the earth’s terrestrial surface [1]. From 2000 to 2015, the global land cover trend indicated a net loss of natural/semi-natural lands. These losses of land resulted from many processes. Among the processes, we can identify deforestation, unsustainable agricultural practices, urbanization, land tenure, and poverty [2]. This situation is more visible in industrialized countries, in Europe or Asia. Therefore, the land-use study is of fundamental significance, as the land resources play a strategic role in the determining man’s economic, social and cultural progress [3].
Indeed, the global land system faces unprecedented pressures from growing human populations and climatic change [4]. Urban sprawl on agricultural land has become a global phenomenon plaguing all countries of the world, rich or poor [5]. This phenomenon has attracted the attention of social researchers since the mid-20th century [6]. Thus, many researchers are interested in the causes and consequences of urbanization. Some authors such as G. Duranton and D. Puga highlight that economic growth drives urban expansion in constructing businesses, dwellings, roads, leisure centers, transportation, etc. [7]. Therefore, the metropolitan regions face the growing problems of urban sprawl, including a decline in natural vegetation, wildlife habitats, and agricultural land [3]. More than 8.8% of European Union (EU) land is used for residential, commercial, and industrial purposes [8]. Other very important factors are the quality of the environmental conditions of agricultural production, population density, and net migration [9], which also affect agricultural land. Therefore, it is important to note that the life of more than 7.7 billion human beings today [10], 9.73 billion by 2050, and 11.2 by 2100 will depend on the soil availability for food production [11]. As long as urban populations continue to grow, the challenge of maintaining food security is increasing [12]. In Eastern and Central European countries, namely in Hungary, Slovak Republic, Poland, Estonia, Lithuania, and Latvia, agricultural land prices were gradually increasing in these countries during the past decade [13], and this price depends on the market forces of the supply and the demand [14]. In Romania, the political and socio-economic changes began in the early 1990s had a strong impact on land, especially on the quantity and quality of agricultural terrains [15]. Furthermore, we found that in Bulgaria arable land abandoned without cultivation, represents a very large area because of a shortage of financial resources [16]. In addition, land privatization and farm restructuring are inseparable issues for agriculture and the rural sector in the transformation to a market economy [17]. The case of Slovakia illustrates this. Indeed, the pressure from investors has increased in creating new residential, commercial services and shopping centers, logistic and industrial parks, which is consequently reflected in land-use changes [18]. In summary, in Europe the areas with the most visible impacts of urban sprawl are in countries or regions with high population density and economic activity like Belgium, northern Italy, the Paris and Madrid regions, and Germany [19].
The south Asian region as a whole is experiencing expansion and intensification of cropland and urbanization, shrinking of forests and grassland [20]. On the other hand, in China, for example, the problems in urban-rural spatial structure and food security have been the hot spots of land use research [21]. It is because China has urbanized rapidly over the past three decades, underpinned by rapid economic growth. It has many rapidly growing cities and some that have had declining populations [22]. As such, the per capita area of farmland fell from 0.106 ha in 1996 to 0.092 ha in 2008, raising concerns about food security [23]. Therefore, migration, rural economic development, and urbanization are the primary forces driving the conversion from farmland to non-agricultural uses in China [24]. Other researchers attest that immigration plays an important role in land-use transitions because it leads to urban expansion and farmland occupation [25].
The review of the literature also conduced us to examine land tenure. Indeed, land tenure security refers to the right of individuals and groups of people to effective protection by their government against forcible evictions [26]. Therefore, in the agricultural sector, securing land tenure has regularly been prioritized by policy-makers to ensure and develop more productive agriculture [27]. In that sense, secure tenure is widely recognized as an essential foundation for achieving a range of rural economic development goals [28]. However, land tenure security is central to agricultural production and sustainable use of natural resources [29], and the links between tenure security and agricultural productivity are of primary interest [30]. This may imply that land tenure systems can affect agricultural productivity by influencing the efficient use of inputs and the adoption of modern technology [31]. On another note, secure access to productive land reduces the vulnerability to hunger and poverty to the millions of poor people living in rural areas and depending on agriculture. It influences their capacity to invest in their productive activities and the sustainable management of their resources [32]. From then on, land tenure security is important not only for agricultural production, but it also allows people to diversify their livelihoods by using their land as collateral, renting it out, or selling it [33]. Finally, strengthening land tenure security is key to achieving efficient land allocation among farmers in both in land abundant and land-constrained areas as it facilitates land markets [34].
In the above background, it is important to analyze the evolution of the population to in order to understand rapid urbanization. Globally, more people live in urban areas than in rural areas [35]. We found that 54 percent of the world’s population live in urban areas. In view of this, we noted that the urban population of the world has grown rapidly since 1950, from 746 million to 3.9 billion in 2014 [10]. Along with this, the medium-variant projection indicates that the global population could grow to around 8.5 billion in 2030 [36]. Hence, prior work has highlighted that urbanization is a problem because urban expansion inevitably covers some agricultural land.
In contrast, changes in land values and land markets around cities often result in vacant land as the owners anticipate their gains from selling it or using it for non-agricultural uses [22]. Therefore, the changes in land use arise from competing for economic, political, social, and environmental goals [37], and urban sprawl dynamics will also play an important role in the future land-use change in some countries like India [38], and Africa countries. In summary, land-use change is characterized by a high diversity of change trajectories depending on the local conditions, regional context, and external influences [39]. Therefore, it is important to understand the underlying technological, institutional, and economic drivers of land-use change and how they play out in different environmental, socio-economic, and cultural contexts [40].
According to the literature review, the drivers of the agricultural land transition are mainly non-agricultural activities—for instance, residential construction. The more human activities intensify, the more agricultural land is threatened. Therefore, as Senegal is a developing country, this study is important from the point of view of understanding the mechanisms and the main factors influencing the transition of agricultural land. Given this worrying situation, the objective of this work is to (i) understand the degree and trend of transition and evolution of agricultural land space and time. Then, our interest is to (ii) identify the keys drivers of this transition and evolution of agricultural land in the Groundnut Basin. In this study, we will focus on these important issues.
2. Study Area
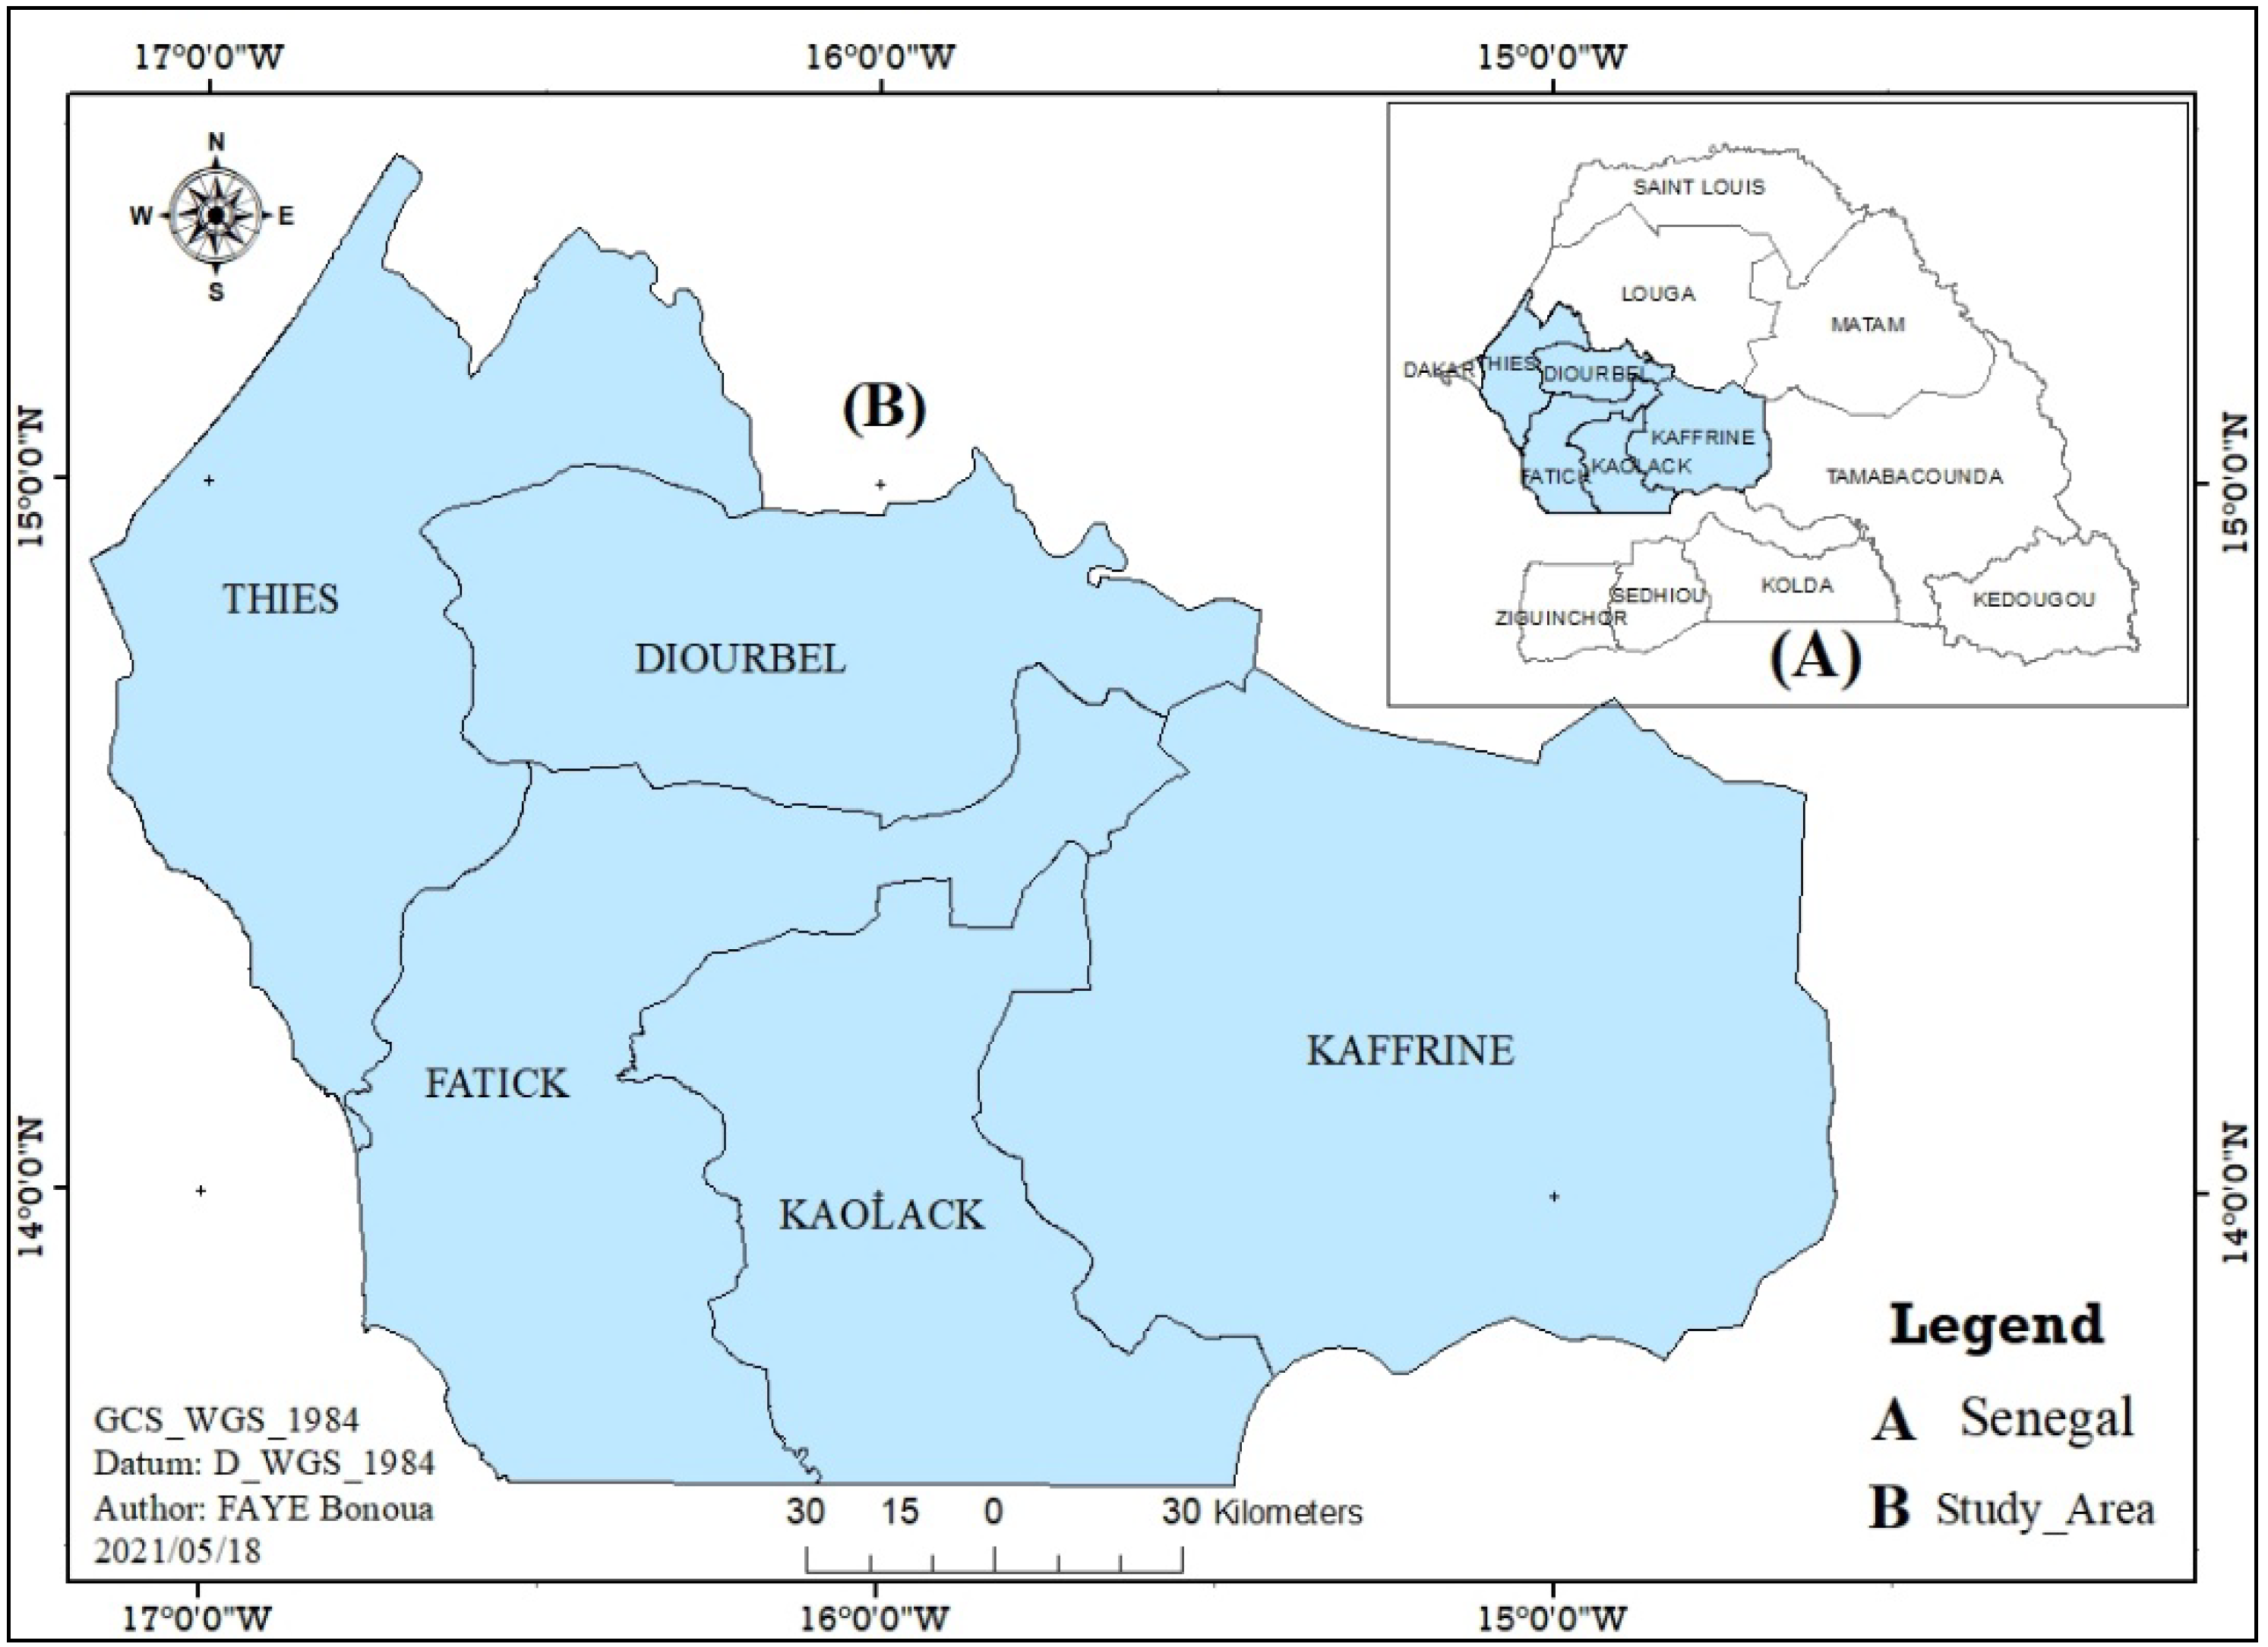
Senegal is located in the West African continent, with a land area of 196,722 km2. It is located between the latitudes 12°20′ and 16°20′ N and the longitudes 11°20′ and 17°30′ W [41]. Ecologically and agriculturally, the country is subdivided into six geographical eco-zones [42]. Our research concerned the Groundnut Basin. It covers the administrative regions of Diourbel, Thiès, Kaolack, Fatick, Kaffrine, part of the Tambacounda region (departments of Koumpentoum and part of the department of Tambacounda) and the department of Kébémer [43]. Therefore, our study focuses only on the five administrative regions (Figure 1). They are considered most important in this area because they occupy almost all the arable land in the Groundnut Basin, and constitute an area of very high agricultural production in Senegal [44]. It has a population of 6,436,912 people according to the population censuses in 2013 [45], and covers a total area of 34,964.36 km2, with a density of 184.10 people per km2. The distribution of arable land by agro-ecological zone shows that the Groundnut Basin represents 70% of arable land [46]. Throughout the Groundnut Basin, the cropping systems are mainly cereal-leguminous rotations [47], and it is dominated by subsistence production of millet, maize, groundnuts, cowpeas, and bissap (hibiscus) [48]. Groundnut Basin is characterized by degraded and patchy open forests dominated by Bombax costatum, Lannea acida, Pterocmpuserinaceus, Sterculia setigera, Khaya senegalensis, Daniellia oliveri, Detarium senegalensis [49].
With a poverty rate of 47% in 2011 [50], agriculture in Senegal has always been seen as the foundation of the country’s socio-economic development [51]. In terms of economic activities, this sector is dominated by agriculture and occupies 74% of the population in the area [52]. Its average in terms of gross domestic product (GDP) ranged from 21.24% (1960–1989) to 15.26% (1990–2011) [53], and further to 16.1% in 2017 [54]. According to data from the National Agency for Statistics and Demography (NASD) site, in 2020, the areas planted (in hectares) in peanuts represent, respectively, 55.16% (2017) and 63.15% (2018) of the national areas (in hectares) planted. In 2013, the population censuses showed that 70% of farms were small family farms with an area of fewer than five hectares [45]. In the study area, the median value of annual rain-fed crop sales per household in 2018 is around $246.61. According to the NASD site, the percentage of farm household members with agricultural education vary from 5.34% in 2017 to 0.67% in 2018.
In fact, in Africa, particularly in the Sahel, after the rainy periods of the 1960s, many researchers noted anomalies of rain in the early 1970s [55]. The consequences of this rainfall deterioration are reflected in Senegal by the degradation of the natural environment, with drought leading to the degradation of the plant cover, the soils being subjected to erosion and runoff, and the accentuation acidification and salinization [56]. In addition, the factors of low annual rainfall, frequent dry spells, and the rainy season shortening affect the vegetative cycle of crops [57]. Severe droughts, especially in northern regions, appear as the biggest risk in estimated aggregate losses to crop and livestock [58]. In Senegal, agriculture is mainly rain-fed and depends heavily on seasonal rainfall amounts, and distribution [59]. Therefore, the combined effect of rainfall, land surface temperature, and solar radiation explain approximately 40% of the variation in cropland productivity over West Africa at the 95% significance level [60]. This situation underlines the fact that the evolution of agricultural land, and climate are closely linked. Drought is a recurring phenomenon in the coastal zone of Senegal and its hazards affect the economies of the predominantly agricultural population [61].
The main factors affecting land-use in Senegal are manifold. Firstly, lots of land areas were changed by the urban setting and associated rapid growth and transformation of human societies in Senegal [42]. In 2015, Senegal’s population was estimated at 14,356,575 people with an average annual growth rate of 2.7% [45]. The growth of the rural population has brought greater pressure on land and natural resources and contributed to land fragmentation, particularly in densely populated and high-potential areas with easy access to markets [62]. As a result, in Sangalkam, around Dakar (capital of Senegal), some 7.64 km2 of agricultural land use was officially developed in the area between 2003 and 2009 [63]. The law n° 64–46 of 17 June 1964, governs land management in Senegal, which stipulates, land does not belong to the State, territorial communities, or users, but the “Nation” [63]. Local governments are responsible for the allocation/dedication of land in the national domain for rural activities [64]. Secondly, the chronological summary of agricultural policy in Senegal has gone through several phases. The literature shows the Agricultural Program (1960–1980), the New Agricultural Policy (1985–1994) and the Agricultural Development Policy Programs, letters and Declaration (1995–2003). Since the 2000s, we have seen a reconfiguration of the situation regarding agriculture. For example, we have the Law of Agro-Sylvo-Pastoral (LOASP) in 2004. Since 2013, Senegal has defined a new agricultural policy called the Program to Accelerate the Cadency of Senegalese Agriculture (PRACAS). Despite all these agricultural policies, Senegalese agriculture still faces difficulties [65]. Third, soils in Africa affected by water erosion ranging from medium to high effect cover an area of more than 12 million hectares, or 18.5% of the total national territory [66]. The Groundnut Basin is today confronted with chemical and physical-biological degradation which has become more intense. Thus, the soils are impoverished, restructured, chemically exhausted by wind and water erosion, recurrent droughts [67].
3. Materials and Methods
3.1. Data Sources
The data presented in this study are derived from different databases (please see Table 1). The analysis model aims at analyzing the agricultural land evolution and transition in terms of area and soil occupation change over ten years chronological series between 2009 to 2018.
3.2. Methodology
The spatial data used in this study are obtained from NASA LPDAAC Collections-Modis Land Cover—MCD12Q1V6 (Earth Explorer USGS). However, due to their characteristics, pre-processing is necessary to have more clarity. Therefore, several steps have been taken. First, to optimize the quality of the images, the layers were re-projected according to the reference projection system of the study area, which is World Geodetic System (WGS)_1984_Complex_UTM_Zone_28N (EPSG:31028). In addition, the strips were cut according to the size of the study area. To make the classified land cover images comparable, we resampled the images to 50 m, which is the common resolution for all images [68]. This resampling allows us to obtain common results between the processed images. Second, after this geometric correction, we used supervised classification to categorize the land cover components used in our study. The land-use types are mainly classified into four categories: cropland, grassland, urban and built-up, and permanent wetland. Then, concerning the spatial analysis, four temporal remotely sensed images were selected for evolution and transition land use detection, namely, Modis Land Cover of USGS in 2009, 2012, 2015, and 2018. All four images, respectively, were used to examine the area’s evolution and transition land-use dynamics. The area information was used as a basis for analyzing the quantitative change in land use. After the conversion of raster data to vector data, we had to use ArcGIS 10.6 platform to analyze the change pattern of cropland, grassland, urban and built-Up, and permanent wetland.
3.2.1. Analysis of Land Use Dynamics
Dynamics of land use are expressed as an increase or decrease in area. Therefore, this method positively affects the analysis of the evolutionary pattern of land use in the study area. In addition, it gives an idea of the future dynamics of transition and evolution of land use over time.
where KT is the dynamic attitude of the pattern using during the study period, Ua is the area of the pattern at the beginning of the study period, Ub is the area of the pattern at the end of the study period T is the time interval of the study years [69].
3.2.2. Calculation of the Land Evolution
The degree of evolution in each tenure category will be assessed by calculating the rate of evolution E (i, k) in the area of land use as follows [70].
(Si) the area of a land-use category of the year i and (Sk) the area of a land-use category of year k, with k > i. E (i, k) will be equal to: If E (i, k) = 0, it is concluded that this land use category is stable, if E (i, k) < 0, it is concluded that there is a regression of this category, and if E (i, k) > 0, there is an extension or evolution of this category.
3.2.3. Analysis of Agricultural Land Transition
To visualize the land cover transition, we merged the layers using the intersection tool in the ArcGIS platform. Then, we used the equation below to show the different transitions between the spatial data and used the pivot table function in Excel to produce statistics according to a couple of classes. Initially, the results of the four components studied showed fourteen different land-use change classes. Since not all land-use change classes have the same degree of importance, those representing the main changes were kept and the others were unified. For example, when we considered the relationship between grassland and permanent wetland, we obtained two different couple of classes change: grassland to permanent wetland and permanent wetland to grassland. Accordingly, the difference in change between these two couple of classes is maintained. In addition, we opted for this methodology to highlight the most important or the dominate transition between couple classes. This operation allowed us to keep the four most representatives, land-use change classes.
Layer A = corresponds to the year of beginning, Layer B = corresponds to the year of arrival, T = result of the transformation. (This method is used by GIS and RS solutions).
3.2.4. Analysis of Climatic Data: Rainfall
To better understand the factors of evolution and transition of agricultural land in the Groundnut Basin, we have analyzed the inter-annual evolution of rainfall over the period from 2009 to 2018. Indeed, Senegal has two main seasons that mark the climatic regime: a dry season from November to April–May, and a rainy season from May–June to October, depending on the geographical location [41]. Accordingly, the rainfall values used in this analysis only concern the period from June to October, which coincides with the rainy season in our study area [71]. The methodology adopted is based on a statistical approach, using the averages of the five months of rainfall for each year in the series.
4. Results
4.1. Analysis of the Land-Use Evolution
4.1.1. Cropland and Grassland Evolution
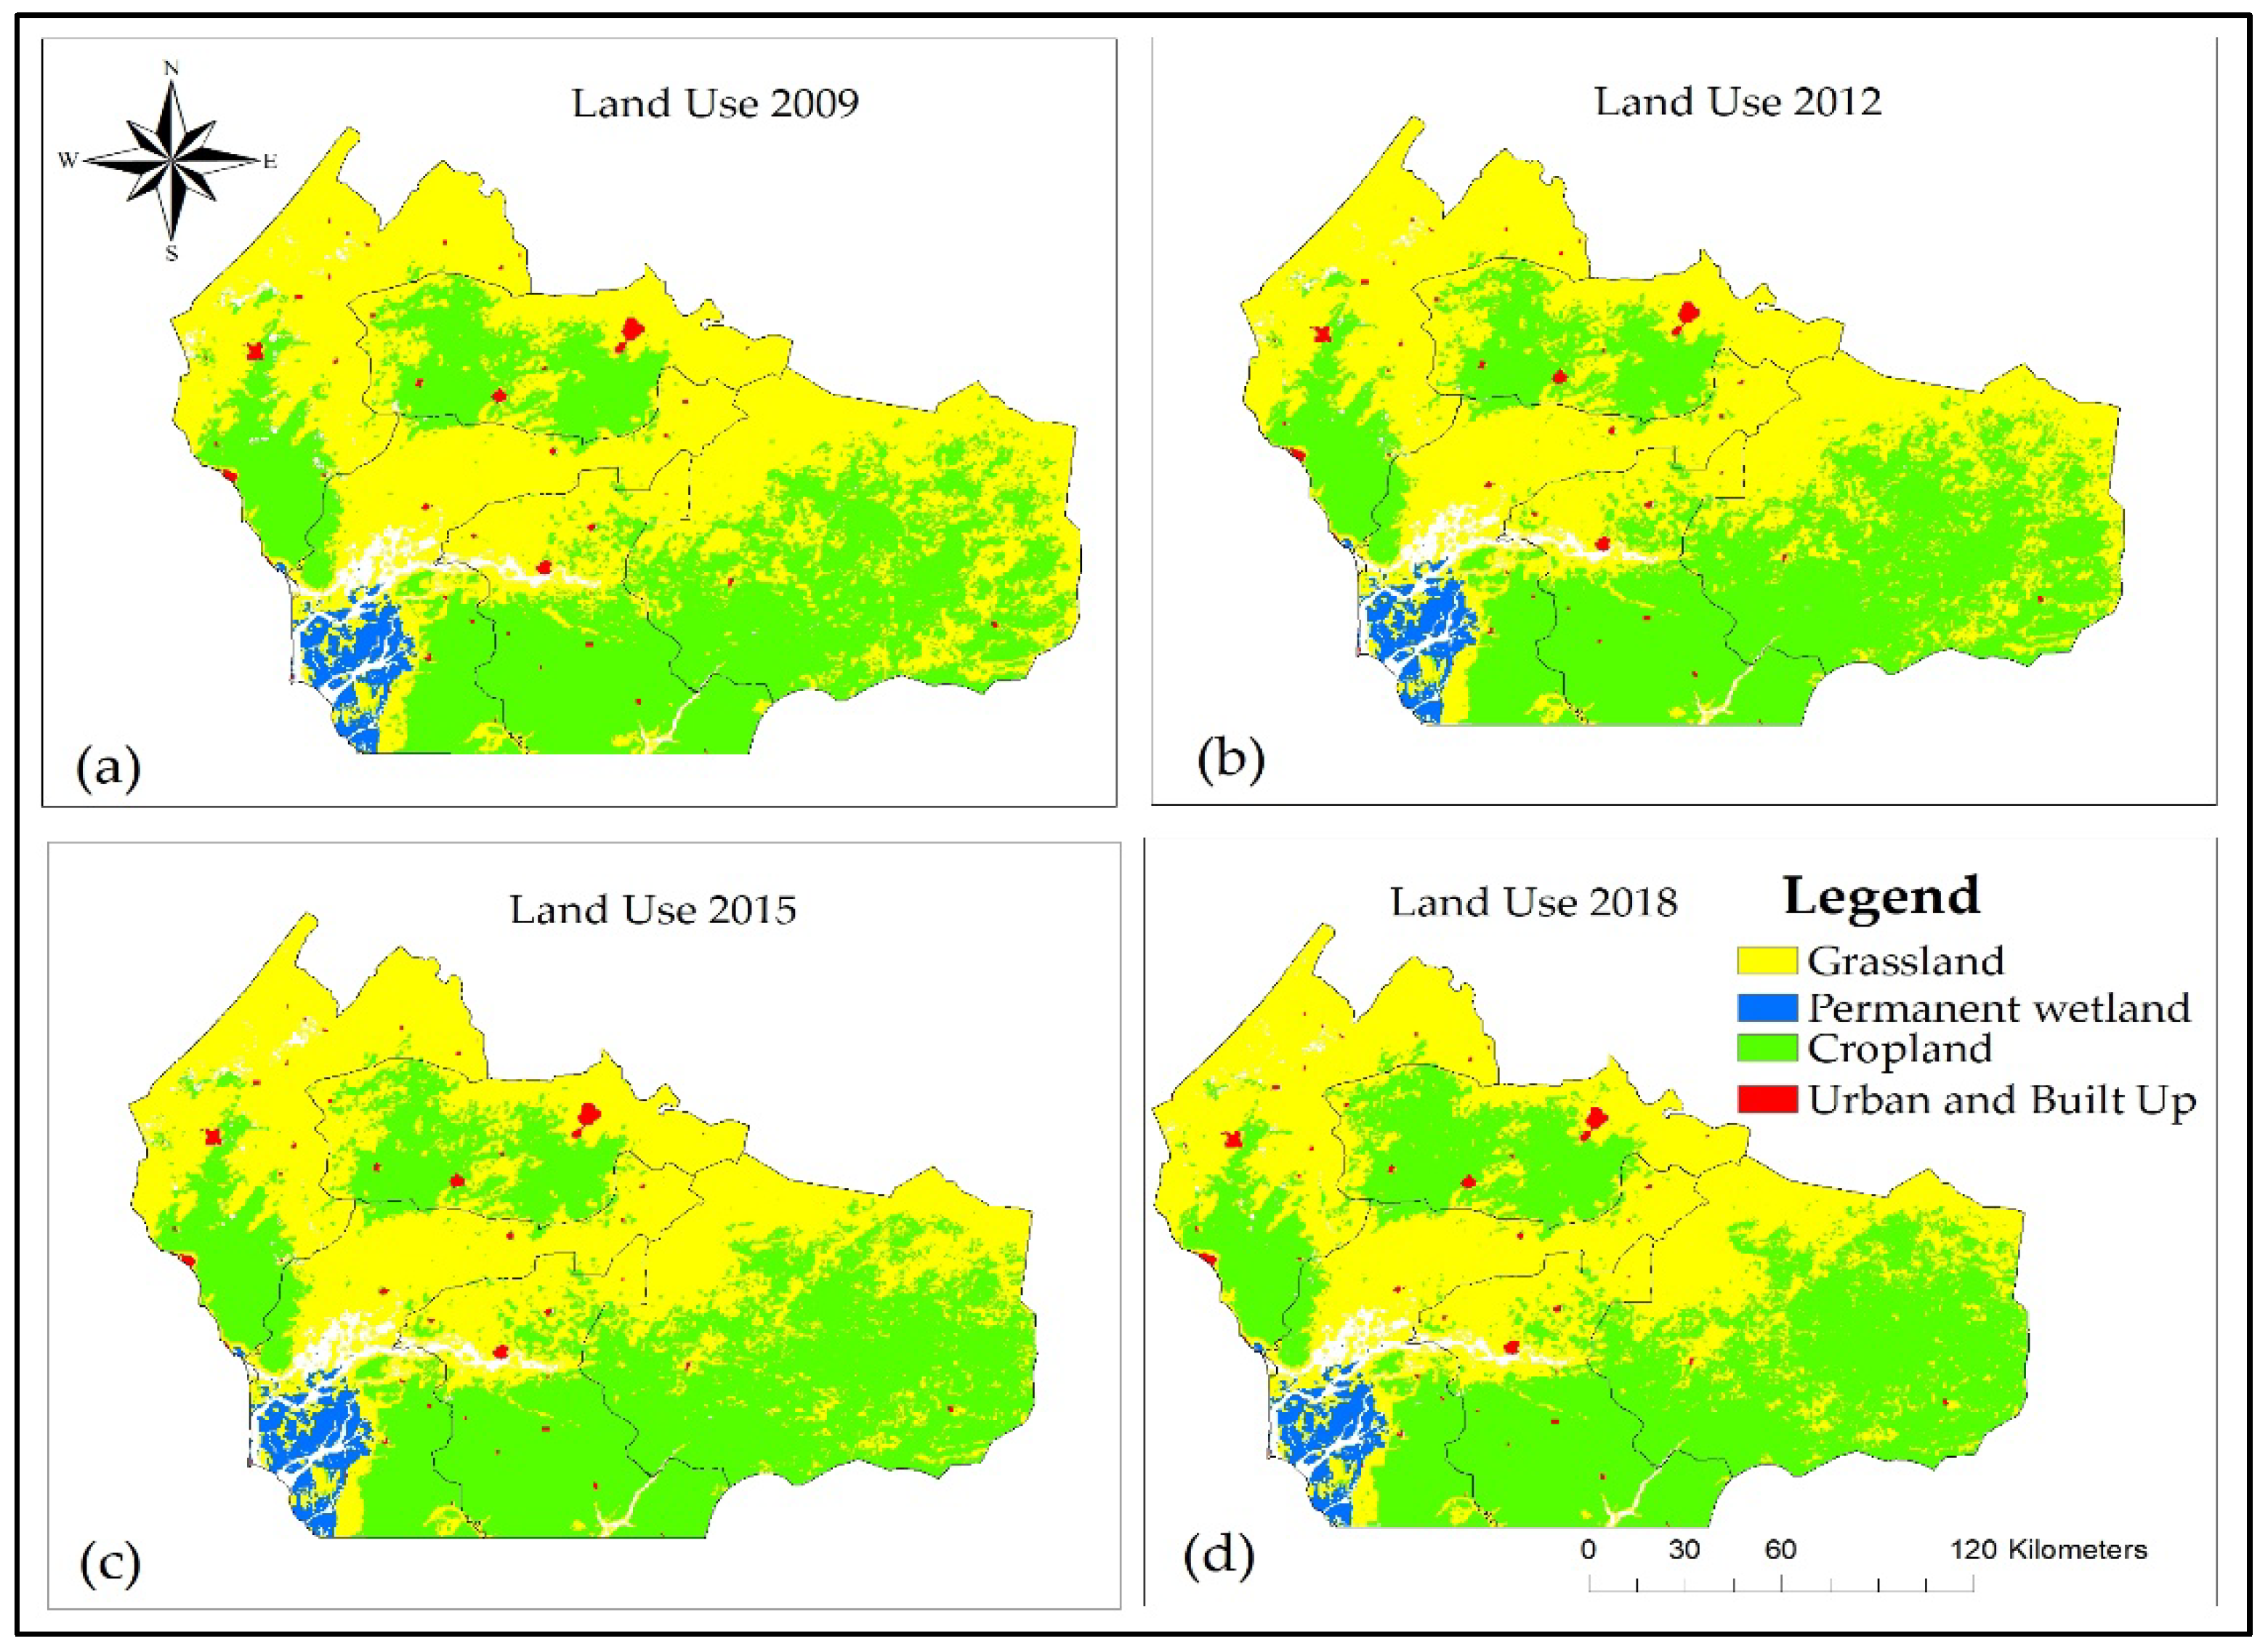
Agricultural land is becoming increasingly scarce and threatened by several factors. This situation can be fast/slow and differs from one country to another. Therefore, the transition of agricultural land is relatively fast in developed countries due to industrialization but is slow in underdeveloped countries. Table 2 and Table 3 shed light on the rate of evolution in agricultural land area, and urbanization has been increased in the last few decades. On the other hand, grassland has decreased.
The research revealed that an increase in cropland (Figure 2), at the beginning of the study period, which coincides with the year 2009, the cropland represented around 14,569.53 km2. On the other hand, at the end of the study in 2018, the cropland is around 16,687.16 km2. Therefore, a difference of 2117.63 km2 was noted, including an increase of 14.53%. The dynamic attitude of cropland amounts to 1.45. This dynamic seems to be important. This means a potential doubling of the cultivated areas around 2028.
On the other hand, our analysis shows a decrease in grassland. The grassland represented respectively 18,656.27 km2 in 2009 and 16,566.23 km2 in 2018, showing a decrease of about −2090.04 km2 (−11.20%). Therefore, the cropland increases as the grasslands decrease.
As for the results between periods, the cropland also shows fluctuations. Thus, Table 3 reflects an evolution of 6.67% over the period 2009–2012. This result has decreased to 2.40% between 2012 to 2015 with a deviation of 4.27%. Compared to the second period, we have observed in the third period an increase of 4.86%. Therefore, if we compare the first period to the last period, the results reflect that the cropland has not increased significantly. In summary, the cropland has slightly increased by 1.81% between the first and last periods (Table 3). This situation remains the same for the grassland. Respectively, the results are decreasing by −5.10%, −2.31%, and −4.22% and the difference noted between the first and third periods is about 0.88%. In summary, the study highlights important knowledge that an expansion of cropland during the study period (Figure 2). These results are confirmed by the data of the World Bank site (2020). Indeed, they show that the permanent cropland represented 0.30% in 2009 and 0.35% in 2016, increasing 0.05% in Senegal.
4.1.2. Urban and Built Up and Permanent Wetland Evolution
Urbanization is one of the factors that affect agricultural land. Therefore, it appears differently depending on the context and evolution of the population. In our study area, urbanization seems to be slow and occupies the space little by little. The dynamic attitude of urban and built-up turns around 0.28. Between 2009 and 2018, urban and built-up represent 2.80% and permanent wetland 1.30%.
Urban and built-up and permanent wetland are not significantly represented. Indeed, at the beginning of our study in 2009, urban and built-up represents an area of 172.49 km2 out of 34,964.36 km2, which corresponds to the total area of the study area. This area has evolved to reach 177.32 km2 at the end of the study in 2018, including an increase of 2.80%. However, the inter-period results show an increase of 1.37% between 2009 and 2012. This value has changed slightly from 2012 to 2015 with an area of 0.32 km2, a decrease of about 1.05% less. For the last period, our research reflects an increase of 1.09%. In addition, between the first and the last period, urban and built-up grew by 0.28%.
In summary, urbanization has intensified in the second and last periods. The permanent wetland reflects an increase of 2.58% in the first period, 0.17% in the second period, that is to say, a difference 2.41%. This result continues to decrease, reaching −1.43% in the third period. Finally, between the first and the last period, this variable has decreased by about −1.15%.
4.2. The Regional Difference of the Study Area in Land-Use Transition
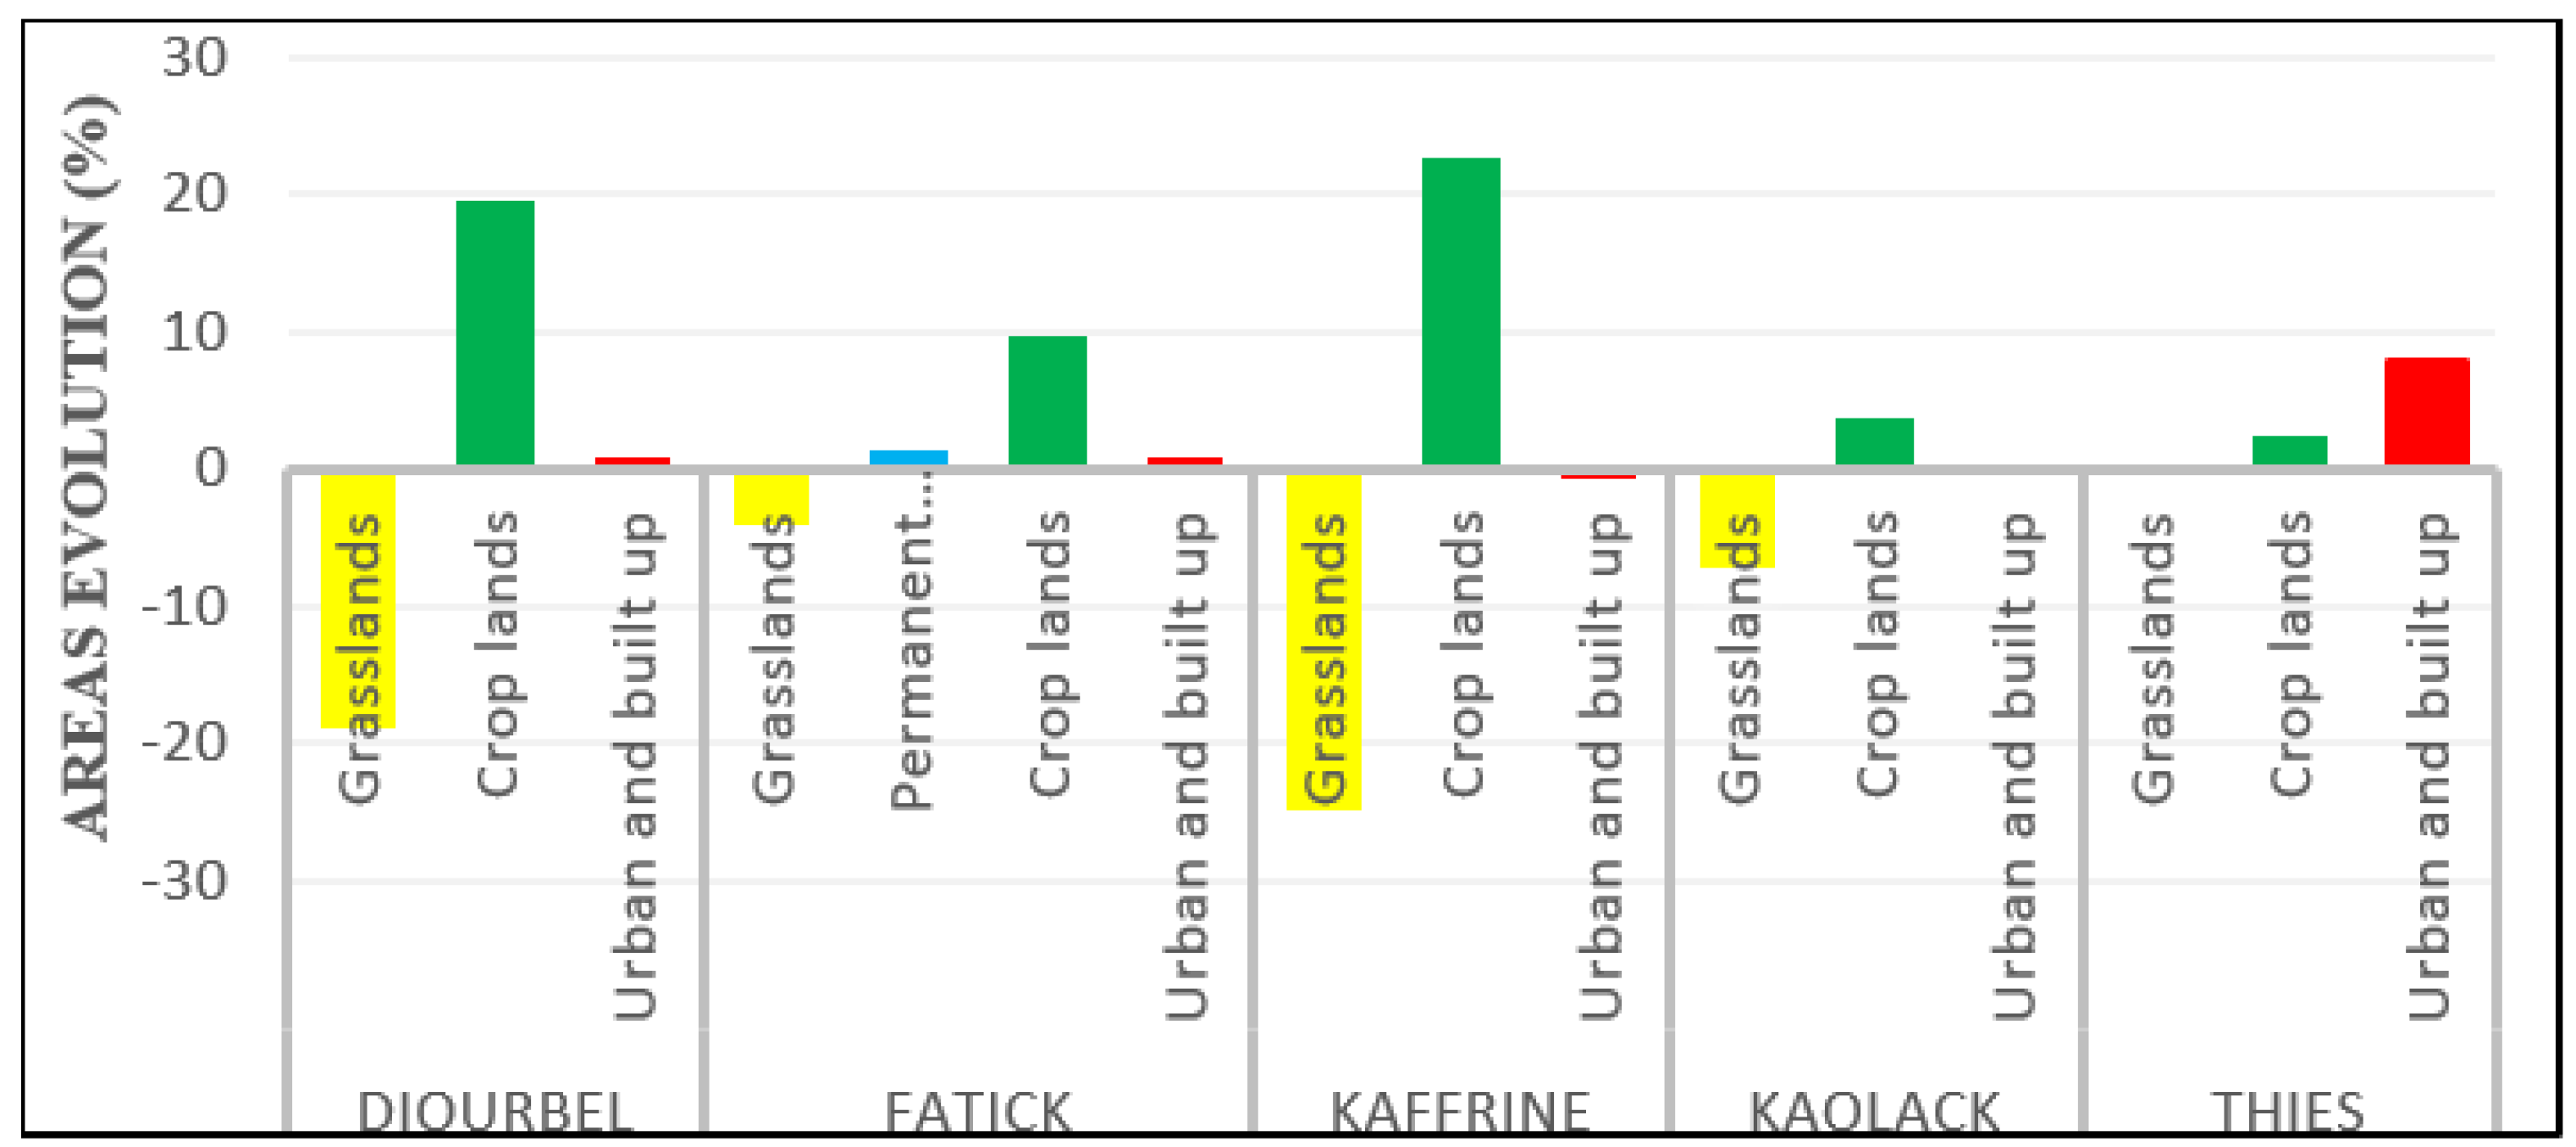
Analysis of regional differences is important to understand the dynamics of agricultural land use in each region. We have firstly analyzed the cropland and grassland. Concerning cropland, from 2009 to 2018, an increase is noted in all the five regions. The region of Kaffrine has the highest value with 1337.95 km2 (22.80%). It is followed by the regions of Diourbel (19.50%) and Fatick (9.71%). The regions of Kaolack and Thiès show 3.83% and 2.53% over the ten years, respectively. This increase hides inter-annual disparities. Between 2009 and 2012, the area of cropland in the Diourbel region decreased by −5.81%. However, over the same period, the area increased in Fatick (4.27%), Kaffrine (13.31%), Kaolack (7.01%), and Thies (1.70%). This approach shows that cropland evolution is not exponential but in a sawtooth pattern. This pattern is similar to grassland. In general, it has decreased. The Kaffrine region occupied first place with −24.81%, followed by the Diourbel (−18.74%) and Kaolack (−7.26%). In contrast, the Thiès region shows an increase of 0.11%.
For urban and built-up and permanent wetland, the situation is the same. Concerning urban and built-up, the region of Thies comes in first place with an evolution of 4.02 km2 (7.94%) between 2009 and 2018 (Figure 3). This evolution trend remains the same for the Diourbel region with 0.93%. The evolution of urban and built-up is average in the Factick region with 0.77%. In contrast, the regions of Kaolack (−0.17%) and Kaffrine (−0.61%) show a decrease in urban and built-up areas in the same period. Permanent wetland concern largely the Fatick and Thiès regions. In the Thiès region, the evolution is stable. However, in the region of Fatick, it has been recorded an increase of 9.80 km2 (1.31%). However, this result hides disparities. In the same region shows an increase of 2.60% from 2009–2012, to reach a decline of −1.43% from 2015–2018. Finally, the analysis of regional differences in land use shows several aspects. The first aspect shows that in the regions of Kaffrine and Diourbel, cropland has evolved rapidly, but urban and built-up remains low in Kaffrine (Figure 3). In contrast, urban and built-up expansion is relatively rapid in the Thiès region, and moderate in the Diourbel region. However, in the Thies region, the evolution of cropland and grassland has evolved weaknesses compared with other regions.
4.3. Analysis of Land Use Transitions
4.3.1. Inter-Period Transition
To understand agricultural land transition dynamics, the series is divided into three equal periods. The first period from 2009–2012 shows a decrease in grassland in favor of other variables. 944.58 km2 of grassland was transformed into cropland. Then, 12.23 km2 of grassland transformed into a permanent wetland, and 2.12 km2 became urban and built up. This first approach shows a significant decrease of grassland at the expense of urbanism and permanent wetland indeed. Urbanism and permanent wetland have occupied about 14.35 km2 of grassland. Urban and built-up alone, records 2.27 km2 on the grassland.
Transition in the second period (2012–2015) appears to be less intensive than in the first period. The transformation of cropland decreased. The area transformed from grassland to cropland went from 944.58 km2 to 363 km2, a decreasing 580.8 km2. Dynamic continues with the changes from grassland to permanent wetland with 2 km2. Similarly, 1.15 km2 of grassland has been converted to urban up and built. This situation shows a relatively slow evolution of urbanization. Therefore, compared to the first period, the results reflect a difference of 1.03 km2 of grassland converted to urban up. Concerning the last period, it witnesses transition compared to the second period. Indeed, we still note an extension of agricultural land compared to the grassland, representing 772.12 km2.
In this last part, our analysis points to a reversal of the permanent wetland and grassland. About 10.96 km2 of permanent wetland have been transformed into grassland. Urbanization as for it evolved. We observed a 2.21 km2 of grassland are again transformed into urban and built up. The inter-period analysis of land transition shows significant fluctuations. A few areas of cropland were transformed into urban and built up, in other cases, the grassland was transformed into cropland or urban and built up.
4.3.2. Changes That Occurred during the Study Period
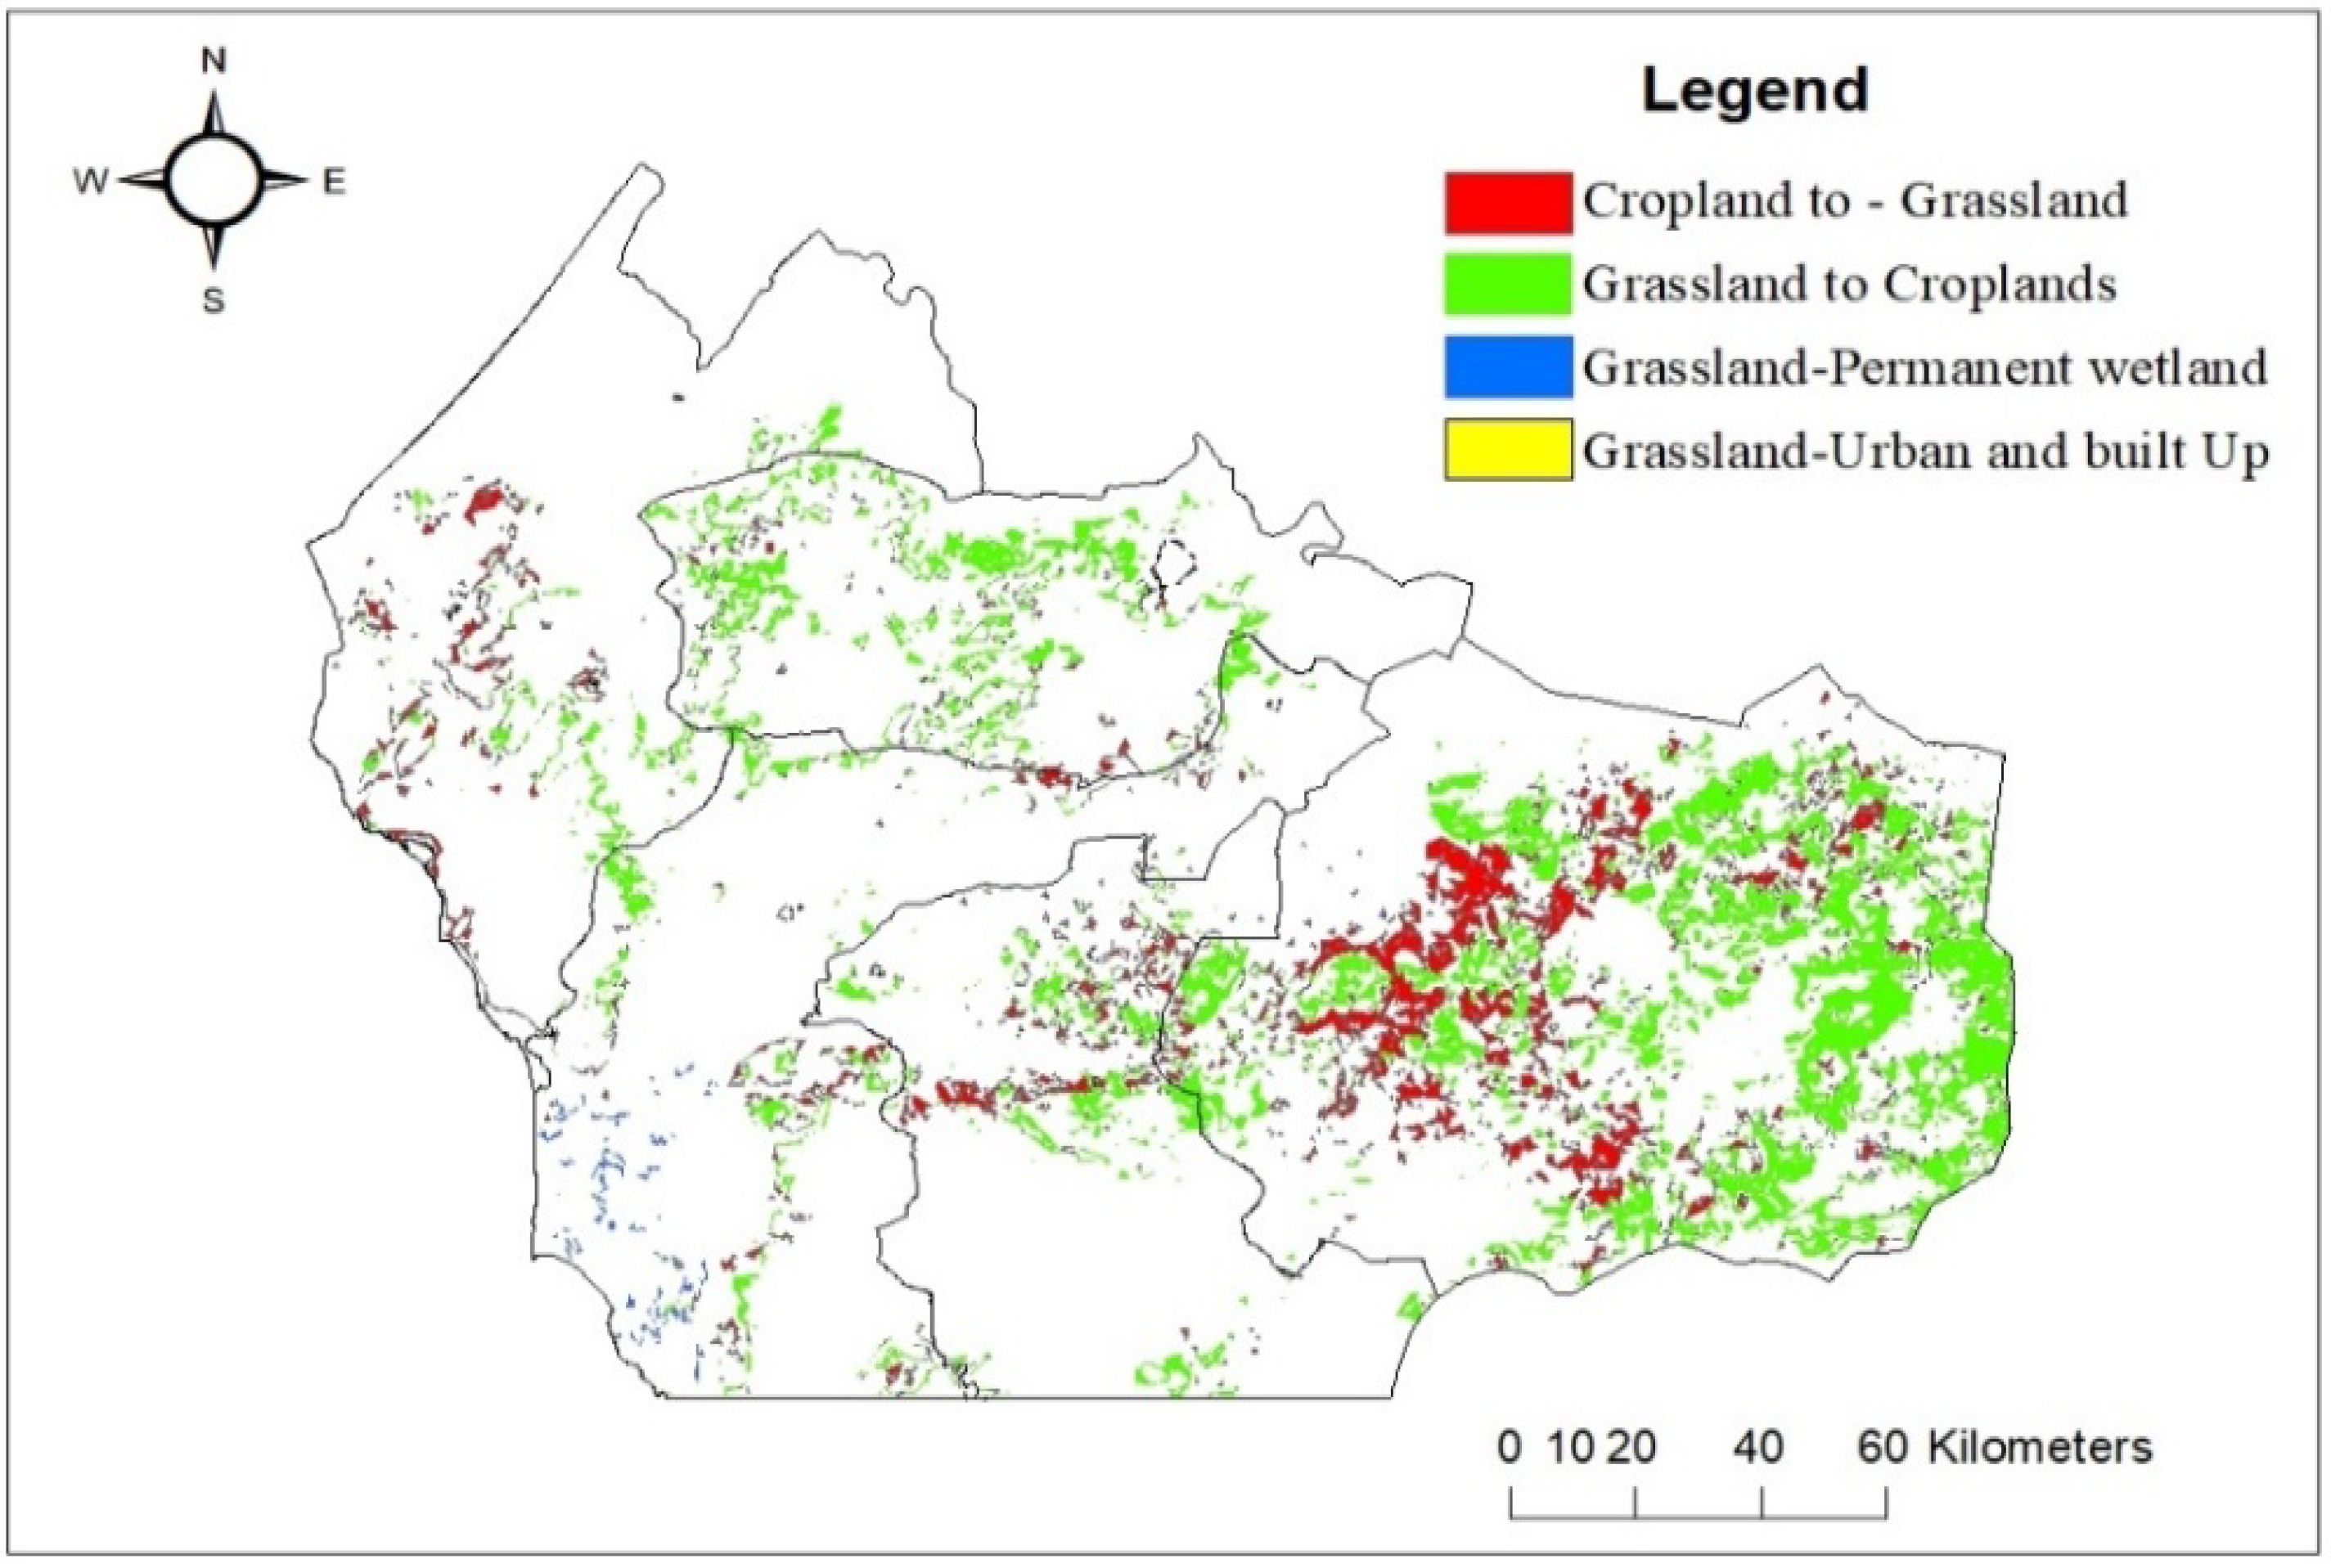
Analysis done during the period of the study period highlights some changes between the variables. Among the most significant changes, the results underline an extension of other components on the grassland. 2083.29 km2 of grassland was transformed into agricultural areas (Table 4). Similarly, 5.42 km2 of grassland was transformed into urban and built up. In addition, 3.63 km2 of grassland was transformed into a permanent wetland. We have noticed a significant change in grassland, in the study area which has continued to increase. This change is especially noticeable in the Kaffrine region (Figure 4). The balance of land-use changes observed over the study period shows that the most important relationships are between grassland and the other land use pattern, namely cropland and urban up and built.
5. Discussion
5.1. Impacts of Urbanization and Population on Agricultural Land Transition
The National Agency of Statistics and Demography (NASD) site projections of population trends in the study area show a rapid evolution. The population projections data show that there were 5.059,331 million people in 2009 and 6.436,913 million in 2018, with an increase of 27.23% in ten years. A rapid increase in population may be an explanatory factor that is at the origin of agricultural land transition because evolution in population induces demand for housing and occupation of new spaces. On the other hand, the results highlight that urbanization is expanding rapidly in the Thiès area (Figure 3). According to NASD site data, the Thiès region is the most urbanized and populated region after Dakar. This region, whose land area represents less than 2% of Senegal’s land area (196,722 km2), concentrates more than 25% of the national population [45]. As a result, the overcrowding of the capital (Dakar), partly explains the rapid development of urbanization in the Thies region. This region (70 km from Dakar) now serves as a secondary city to correct the territorial imbalance; it has been the area to major state projects such as the new Blaise Diagne International Airport. From this perspective, agricultural land fragmentation and scarcity are still mentioned as of considerable constraints on agricultural modernization. It could be exacerbated in the affected area due to a huge agricultural land acquired to support urbanization and industrialization [72]. Therefore, it is undeniable that the loss of agricultural land to urbanization is a serious threat to food security and poverty alleviation, especially in regions where many people are already poor. Consequently, agricultural development in Senegal has to face many challenges related to good land administration and planning for successful socio-economic development, particular rural economic transformation.
5.2. Climatic Factors That Influence the Evolution of Agricultural Land
The links between the land and the global climate have long been known [73]. Thus, the scientific literature provides positive examples of that problem. It points out that land degradation is a complex process involving the natural ecosystem and the socioeconomic system. Climate and land-use changes are the two predominant driving factors [74]. However, it is clear that climatic factors, including temperature or rainfall, can impact land-use. In this study, the pivotal factors that can influence agricultural land’s transition focus on the rainfall.
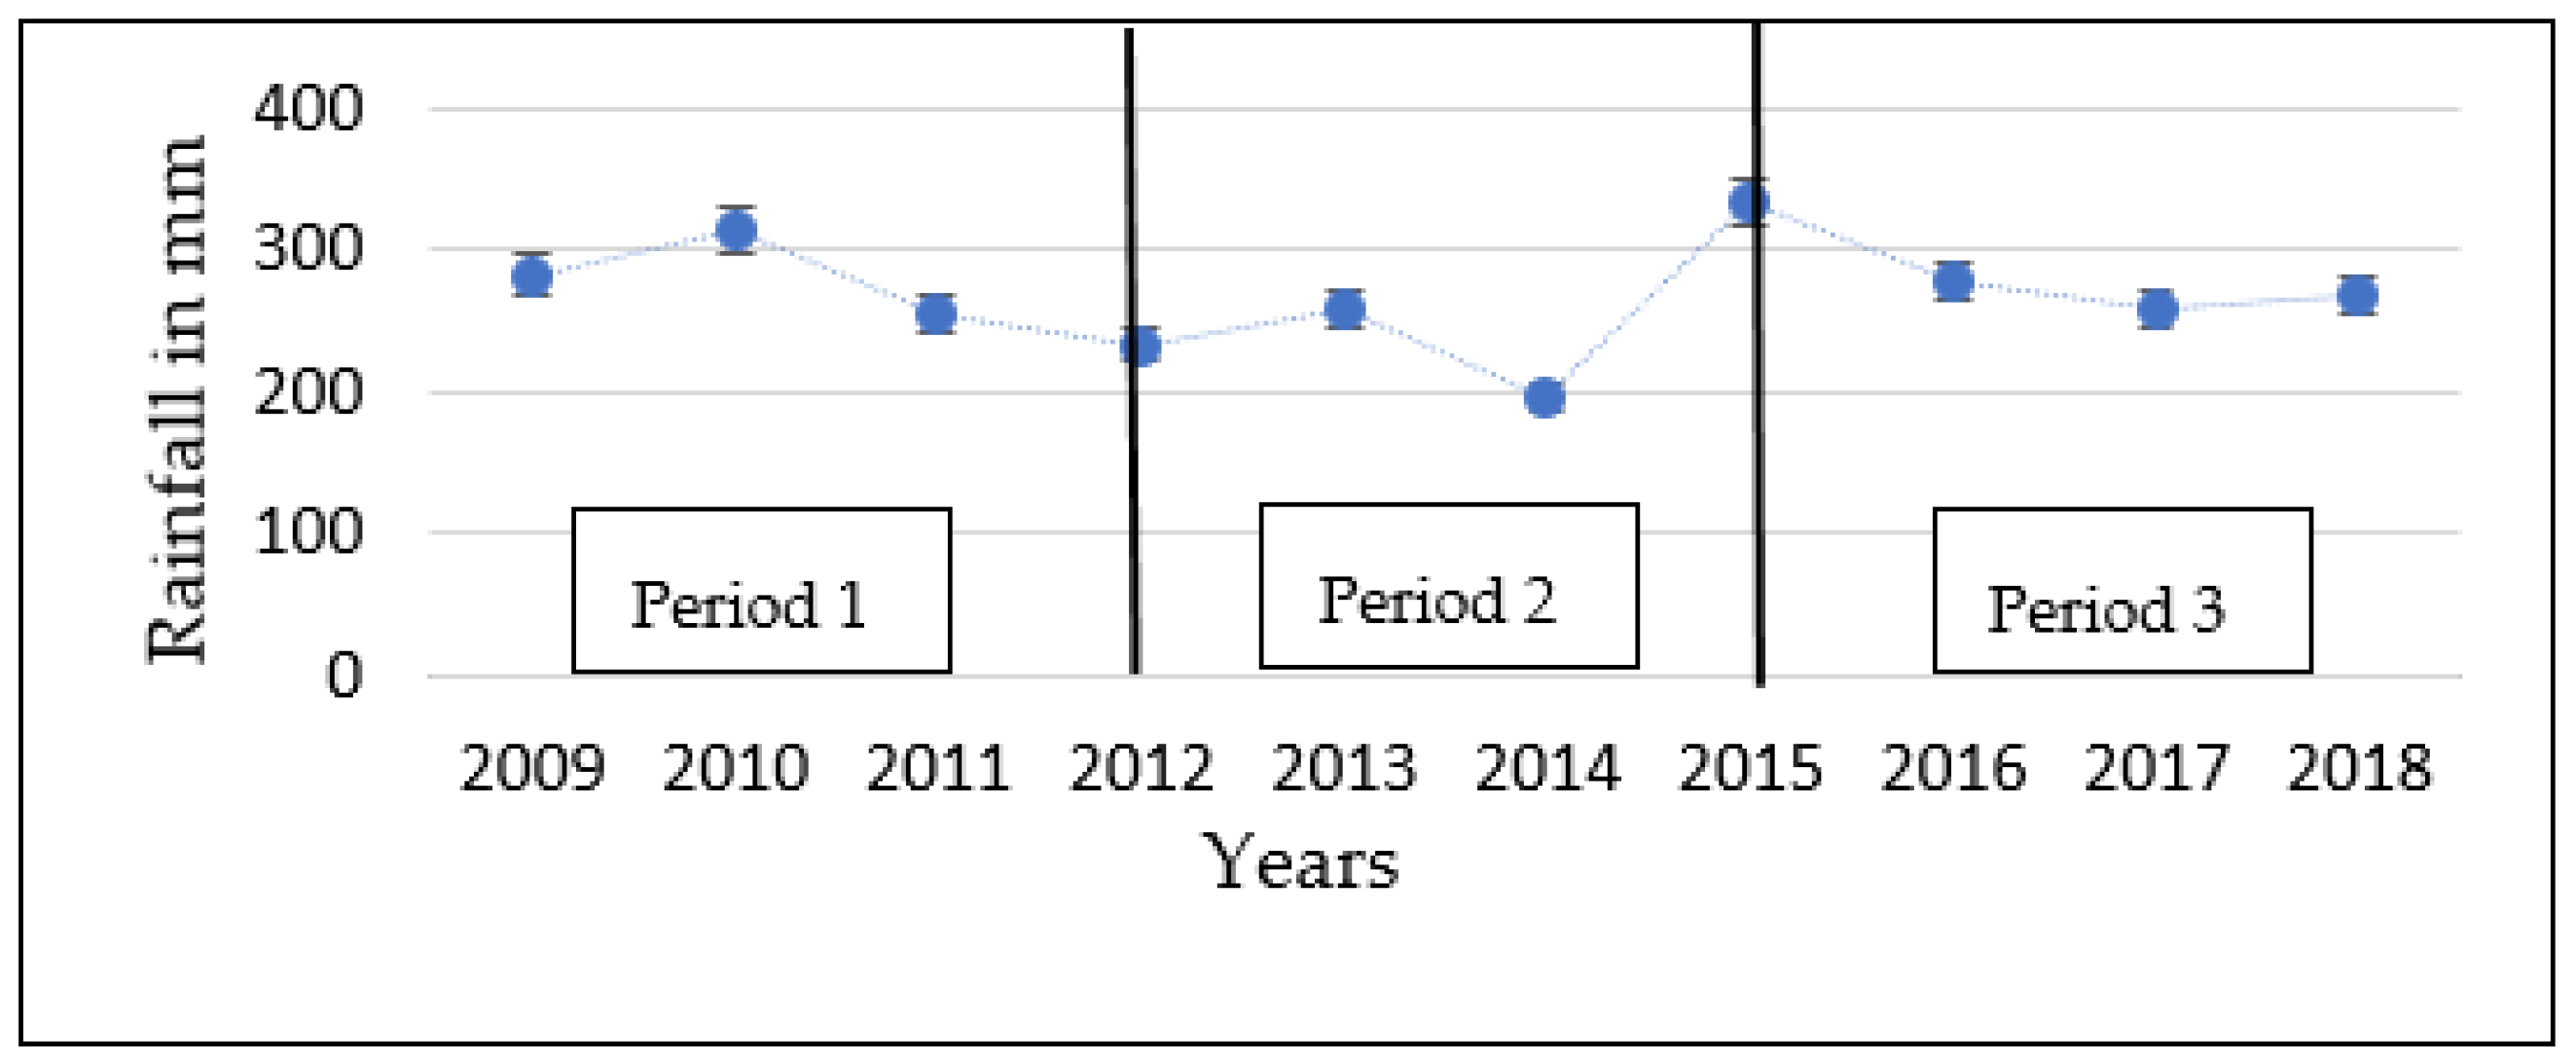
Generally, the projected changes in climate include recurring climate extremes like droughts, flooding, and outbreaks of pests and diseases exposing the region to the vulnerabilities of the changing environment [75]. The agricultural sector is one of the first affected by this change [64] because rainfall is the main factor affecting agricultural production [76]. Therefore, the erratic spatio-temporal distribution of rainfall can often be the origin of an increase or a decrease in the cropland. Past studies emphasized two normal years with a dryness trend in 2012 and 2013 in West African, particularly Senegal [77]. This dryness can have a negative influence on the area planted. For instance, our study shows a decrease in cropland during the periods of 2012–2015 and 2015–2018. Indeed, the inter-annual evolution of rainfall during the period 1985–2014 in the region of Kaolack shows thirteen years out of thirty that are deficient compared to the average of the series which is 604.0 mm of rain. The most deficient year was 2014 with 423 mm [78]. The above background confirms the rainfall results analyzed for the whole study area. Indeed, the analysis made on the evolution of the rainfall shows that the rainfall varies from one year to another. Indeed, Figure 5 shows three periods. The results of the second period show that the rainfall is decreasing and 2014 is the most deficient year of the whole period. Similarly, after an increase in rain in 2015, the rainfall decreased over the third period. Accordingly, the decrease/fluctuation in rainfall during this period may explain the reduction or increase in cropland in the Groundnut Basin.
On the other hand, our analysis reflects the decline of urban and built-up in the regions of Kaolack and Kaffrine. Formerly inhabited areas are abandoned, leaving the place to fallow. These two regions are predominantly agricultural (Figure 2). Therefore, this situation has been proven in some studies in the past. Indeed, the decline of groundnut cultivation, coupled with the disappearance of certain industrial facilities for processing this raw material, has aggravated the situation, leading to a massive displacement of populations from the former urban centers of the Groundnut Basin to the metropolis of Dakar [65]. Therefore, many socio-economic and climatic factors can influence agricultural land, and some studies demonstrate about 74% of farmers perceived that erratic rainfall seasonality contributes significantly to the land-use change and agricultural land abandonment [79].
5.3. The Means of Financial Has Effect on Agricultural Land Evolution in Senegal
This link between agricultural land transition and financial means has been highlighted in the literature. For instance, cropland increases in the United States, and pastureland decreases when government payments go up [80]. The same observation is noted in China, where economic restructuring also influences the overall evolution of farmland areas [25]. Despite a shortfall in rainfall in recent years, Senegal has significantly improved its results due to the selection of seeds and strong mechanization, which have positively impacted agricultural yields. Yields have witnessed a dramatic increase [81]. To understand this phenomenon, we have analyzed the evolution of agricultural investments. This analysis shows an identical correlation between the variables. According to data from the World Bank site, investments in the agricultural sector in Senegal have evolved considerably during the study period. They represented 16,323 million CFA ($30,471.27) in 2009 and 51,585.6 million CFA ($96,297.26) in 2018, including an increase of 35,262.6 million CFA ($65,826). Accordingly, we found that the agricultural investments for the Groundnut Basin represent 17.3% [82]. Meanwhile, fertilizer use has doubled. The use of fertilizer has evolved from 18,489,000 kg in 2008 to 37,000,000 kg in 2018, including an increase of 18,511,000 kg. These huge investments in the sector can justify the evolution of agricultural land in the area. The evolution of agricultural land in the Groundnut Basin depends more on financial means.
6. Conclusions and Recommendations
The findings of this study reveal that the agricultural land has not yet been subjected to real human pressure. From 2009–2018, urban and built-up occupies only 177.5 km2 of the total area (34,964.36 km2) and increases at 2.80%, with a dynamic attitude of 0.28. This situation is because the fact that it is an under-populated area with little urbanization. The density represented 184.10 people per km2. Therefore, basic needs such as housing, infrastructure, and services are poorly developed in the area. Analysis of the regional difference shows that the Thiès region alone occupies 54.61 km2. Today, this region is considered an integral part of the Dakar region (25% of the country’s population), which is the most urbanized in the country [83]. The most visible case in the study is the extension of cropland on the grassland. It represents 14,569.53 km2 in 2009 and 16,687.16 km2 in 2018, including an increase of 2117.63 km2 (14.53%). The region of Kaffrine alone recorded an increase of 1337.95 km2 (22.80%) and followed by Diourbel (19.50%). The justifying factors can be related to agricultural investments and climatic performances such as rainfall or fertilizer. The use of fertilizer is increase reaching about 18,511,000 kg over the period. For the transition of areas is relatively intense, and the results reflected that 2083.29 km2 of the grassland was transformed into cropland; 5.36 km2 of the grassland was transformed into urban and built up. In general, the agricultural land in the study area has not yet undergone a major transition.
According to these findings, recommendations are necessary to ensure efficient and balanced management of agricultural land in the future. First, agricultural land use planning is essential. Given the increasing urbanization and large-scale agriculture, the establishment of an agricultural nature protection zone is necessary, to develop and seek consensus on rules guiding the sustainable utilization of agricultural resources. Second, the agricultural land is disappearing faster than population growth. It is therefore imperative to move towards zero lands “artificialization”. That is to say that we must resort to the restoration of degraded land to compensate for the land newly occupied by urban and built up. Third, land tenure management. Secure land and property rights are critical for reducing poverty and for enhancing economic development, gender equality, social stability, and sustainable resource use. We propose a restructuring of the basics of law No. 64–46 of 17 June 1964 to facilitate access to and proper management of agricultural land.
Thus, the restructuring of this law will strive to put in the place a legal system that will facilitate access to and management of land in general and agricultural land in particular. However, it is relevant to integrate all stakeholders in the reform process, strengthen the existing land access procedure, and to further include land issues in the decentralization and agricultural development policy laws. In addition, access and control over land are problematic in Senegal, especially under customary rule [84]. Therefore, a more equitable redistribution of access to land, especially to those who can invest in agricultural development, might be an important point in restructuring this law.
Furthermore, land issues are becoming increasingly complex due to economic development and population growth. Thus, the lack of coordination between socio-economic development laws can be seen as a blocking factor in the reform. Similarly, customary laws on land rights are increasingly challenged in the context of globalization. However, the lack of a clear delineation between the state and private domain may be a limiting factor in the reconstruction of this law. Therefore, it is necessary to formulate rural (such urban) spatial planning promotes; promote the implementation of comprehensive land consolidation projects throughout the region; and optimizes agricultural, ecological, and construction space [85].
Author Contributions
Conceptualization, B.F. and G.D.; methodology, B.F.; validation, G.D., and B.F.; formal analysis, G.D; resources, B.F.; data curation, B.F.; writing—original draft preparation, B.F.; writing—review and editing, G.D.; visualization, B.F.; supervision, G.D.; project administration, G.D.; acquisition of funding, G.D. Both authors have read and agreed to the published version of the manuscript.
Funding
This research was funded by the National Natural Science Foundation of China, Grant Number 41571167.
Institutional Review Board Statement
Not applicable.
Informed Consent Statement
Informed consent was obtained from all subjects involved in the study.
Data Availability Statement
The data presented in this study are available online. Kindly check the Table 1.
Acknowledgments
We would like to express our gratitude to the professionals of the Northeast Agricultural University who encouraged us to make this project a success.
Conflicts of Interest
The authors declare no conflict of interest.
References
- Vanbergen, A.J.; Aizen, M.A.; Cordeau, S.; Garibaldi, L.A.; Garratt, M.P.; Kovács-Hostyánszki, A.; Lecuyer, L.; Ngo, H.T.; Potts, S.G.; Settele, J.; et al. Transformation of agricultural landscapes in the Anthropocene: Nature’s contributions to people, agriculture and food security. Adv. Ecol. Res. 2020, 63, 193–253. [Google Scholar] [CrossRef]
- Sachs, J.; Schmidt-Traub, G. The Sustainable Development Goals Report 2020; Cambridge University Press: Cambridge, UK, 2020. [Google Scholar]
- Bolca, M.; Turkyilmaz, B.; Kurucu, Y.; Altinbas, U.; Esetlili, T.; Gulgun, B. Determination of Impact of Urbanization on Agricultural Land and Wetland Land Use in Balçovas’ Delta by Remote Sensing and GIS Technique. Environ. Monit. Assess. 2007, 131, 409–419. [Google Scholar] [CrossRef] [PubMed]
- Holman, I.; Brown, C.; Janes, V.; Sandars, D. Can we be certain about future land use change in Europe? A multi-scenario, integrated-assessment analysis. Agric. Syst. 2017, 151, 126–135. [Google Scholar] [CrossRef]
- Al Tarawneh, W.M. Urban Sprawl on Agricultural Land (Literature Survey of Causes, Effects, Relationship with Land Use Planning and Environment) A Case Study from Jordan (Shihan Municipality Areas). J. Environ. Earth Sci. 2014, 4, 97–124. [Google Scholar]
- Rubiera-Morollón, F.; Garrido-Yserte, R. Recent Literature about Urban Sprawl: A Renewed Relevance of the Phenomenon from the Perspective of Environmental Sustainability. Sustainability 2020, 12, 6551. [Google Scholar] [CrossRef]
- Duranton, G.; Puga, D. The Growth of Cities. 2013. Available online: https://www.oecd.org/economy/growth/Growth_of_cities_Duranton.pdf (accessed on 29 August 2021).
- Eurostat Regional Yearbook. Land Cover and Land Use. 2011. Available online: https://ec.europa.eu/eurostat/documents/3217494/5728541/KS-HA-11-001-12-EN.PDF.pdf/88b77a74-2628-4ed7-bb9f-24244d6c78a1?t=1414775978000 (accessed on 10 August 2021).
- Sroka, W.; Mikolajczyk, J.; Wojewodzic, T.; Kwoczynska, B. Agricultural Land vs. Urbanisation in Chosen Polish Metropolitan Areas: A Spatial Analysis Based on Regression Trees. Sustainability 2018, 10, 837. [Google Scholar] [CrossRef] [Green Version]
- United Nations. Department of Economic and Social Affairs—Population Division. World Urbanization Prospects. The 2014 Revision; ST/ESA/SER.A/366; UN: New York, NY, USA, 2015; Available online: https://population.un.org/wup/Publications/Files/WUP2014-Report.pdf (accessed on 27 July 2021).
- Food and Agriculture Organization (FAO). The Future of Food and Agriculture Trends and Challenges; Food and Agriculture Organization: Rome, Italy, 2017. [Google Scholar]
- Ambros, P.; Granvik, M. Trends in Agricultural Land in EU Countries of the Baltic Sea Region from the Perspective of Resilience and Food Security. Sustainability 2020, 12, 5851. [Google Scholar] [CrossRef]
- György, K.T.; Sadowski, A.; Bandlerova, A. Land Use and Land Reform in former Central and East European Countries. 2007. Available online: https://www.researchgate.net/publication/23508765_Land_use_and_land_reform_in_former_Central_and_East_European_countries (accessed on 27 July 2021).
- Cook, E. Agriculture, Forestry and Fishery Statistics 2018 Edition; European Commission: Luxembourg, 2018; pp. 28–31. Available online: https://ec.europa.eu/eurostat (accessed on 16 September 2021). [CrossRef]
- Popovici, E.A.; Balteanu, D.; Kucsicsa, G. Assessment of changes in land-use and land-cover pattern in Romania using CORINE Land Cover database. Carpathian J. Earth Environ. Sci. 2013, 8, 195–208. Available online: https://www.researchgate.net/publication/272161616_Assessment_of_changes_in_land-use_and_land-cover_pattern_in_Romania_using_CORINE_Land_Cover_database (accessed on 28 August 2021).
- De Arriba Bueno, R. Evaluating land reform and market in Bulgaria. J. Econ. Bus. 2007, 10, 11–13. [Google Scholar]
- Csaki, C.; Lerman, Z. Agricultural Transition Revisited: Issues of Land Reform and Farm Restructuring in East Central Europe and the Former USSR. 1996. Available online: https://www.researchgate.net/publication/290007608_Agricultural_transition_revisited_Issues_of_land_reform_and_farm_restructuring_in_East_Central_Europe_and_the_former_USSR (accessed on 27 July 2021).
- Izakovičová, Z.; Mederly, P.; Petrovič, F. Long-Term Land Use Changes Driven by Urbanisation and Their Environmental Effects (Example of Trnava City, Slovakia). Sustainability 2017, 9, 1553. [Google Scholar] [CrossRef] [Green Version]
- European Commission. Urban Sprawl in Europe—The Ignored Challenge—European Environment Agency. 2006. Available online: https://www.eea.europa.eu/publications/eea_report_2006_10/eea_report_10_2006.pdf/view (accessed on 29 July 2021).
- Roy, J.; Bose, C.; Bose, R.; Das, S.; Dhakal, S.; Dasgupta, M.; Ghate, R.; Roy, S.S.; Konar, M.; Wickramasinghe, A.; et al. Development Pathway. In Global Environmental Changes in South Asia; Springer: Berlin/Heidelberg, Germany, 2000; pp. 14–53. [Google Scholar] [CrossRef]
- Liu, Y.; Li, J.T.; Yang, Y. Strategic adjustment of land use policy under the economic transformation. Land Use Policy 2018, 74, 5–14. [Google Scholar] [CrossRef]
- Satterthwaite, D.; McGranahan, G.; Tacoli, C. Urbanization and its implications for food and farming. Philos. Trans. R. Soc. B Biol. Sci. 2010, 365, 2809–2820. [Google Scholar] [CrossRef]
- Long, H.; Li, Y.; Liu, Y.; Woods, M.; Zou, J. Accelerated restructuring in rural China fueled by ‘increasing vs. decreasing balance’ land-use policy for dealing with hollowed villages. Land Use Policy 2012, 29, 11–22. [Google Scholar] [CrossRef]
- Liu, Y.; Yang, R.; Long, H.; Gao, J.; Wang, J. Implications of land-use change in rural China: A case study of Yucheng, Shandong province. Land Use Policy 2014, 40, 111–118. [Google Scholar] [CrossRef]
- Zhou, X.; Li, X.; Song, W.; Kong, X.; Lu, X. Farmland Transitions in China: An Advocacy Coalition Approach. Land 2021, 10, 122. [Google Scholar] [CrossRef]
- Boudreaux, K.; Sacks, D. Land Tenure Security and Agricultural Productivity. MERCATUS ON POLICY N0.57. 2009. Available online: https://www.mercatus.org/publications/development-economics/land-tenure-security-and-agricultural-productivity (accessed on 28 August 2021).
- Bambio, Y.; Agha, S.B. Land tenure security and investment: Does strength of land right really matter in rural Burkina Faso? World Dev. 2018, 111, 130–147. [Google Scholar] [CrossRef]
- Segura Warnholtz, G.; Fernández, M.; Smyle, J.; Springer, J. Securing Forest Tenure Rights for Rural Development: Lessons from Six Countries in Latin America; PROFOR: Washington, DC, USA, 2017; ISBN 9780991040780. [Google Scholar]
- Kasimbazi, E. Global Land Outlook Working Paper Land Tenure and Rights for Improved Land Management and Sustainable Development. 2017. Available online: https://knowledge.unccd.int/sites/default/files/2018-06/5.Land%2BTenure%2Band%2BRights__E_Kasimbazi.pdf (accessed on 29 August 2021).
- Singirankabo, U.A.; Ertsen, M.W. Relations between Land Tenure Security and Agricultural Productivity: Exploring the Effect of Land Registration. Land 2020, 9, 138. [Google Scholar] [CrossRef]
- Nasrin, M.; Uddin, M.T. Land Tenure System and Agricultural Productivity in a Selected Area of Bangladesh. Progress. Agric. 2013, 22, 181–192. [Google Scholar] [CrossRef] [Green Version]
- International Fund for Agricultural Development. Improving Access to Land and Tenure Security. 2008. Available online: https://www.ifad.org/documents/38711624/39417918/land_e.pdf/99f1a767-4ed1-41fc-a341-9bbd7fd2fe7f (accessed on 29 August 2021).
- International Fund for Agricultural Development. Land Tenure Security and Poverty Reduction. 2015. Available online: https://www.ifad.org/documents/38714170/39148759/Land+tenure+security+and+poverty+reduction.pdf/c9d0982d-40e4-4e1e-b490-17ea8fef0775 (accessed on 29 August 2021).
- Byamugisha, F. Securing Land Tenure and Easing Access to Land. 2016. Available online: www.acetforafrica.org (accessed on 29 August 2021).
- Secretary-General of the OECD. Cities in the World: An New Perspective on Urbanization. 2020. Available online: www.oecd.org/regional/regional-statistics (accessed on 28 August 2021).
- UN-DESA (United Nations Department of Economic and Social Affairs). World Population Prospects 2019: Highlights. Available online: https://population.un.org/wpp/Publications/Files/WPP2019_Highlights.pdf (accessed on 3 April 2021).
- Yawson, D.O.; Mulholland, B.J.; Ball, T.; Adu, M.O.; Mohan, S.; White, P.J. Effect of Climate and Agricultural Land Use Changes on UK Feed Barley Production and Food Security to the 2050s. Land 2017, 6, 74. [Google Scholar] [CrossRef] [Green Version]
- Hinz, R.; Sulser, T.B.; Huefner, R.; Mason-D’Croz, D.; Dunston, S.; Nautiyal, S.; Ringler, C.; Schuengel, J.; Tikhile, P.; Wimmer, F.; et al. Agricultural Development and Land Use Change in India: A Scenario Analysis of Trade-Offs Between UN Sustainable Development Goals (SDGs). Earth’s Futur. 2020, 8, e2019EF001287. [Google Scholar] [CrossRef] [Green Version]
- Verburg, P.H.; Van Berkel, D.; Van Doorn, A.M.; Van Eupen, M.; Heiligenberg, H.A.R.M.V.D. Trajectories of land use change in Europe: A model-based exploration of rural futures. Landsc. Ecol. 2009, 25, 217–232. [Google Scholar] [CrossRef]
- Jepsen, M.R.; Kuemmerle, T.; Müller, D.; Erb, K.; Verburg, P.H.; Haberl, H.; Vesterager, J.P.; Andric, M.; Antrop, M.; Austrheim, G.; et al. Transitions in European land-management regimes between 1800 and 2010. Land Use Policy 2015, 49, 53–64. [Google Scholar] [CrossRef]
- Centre de Suivi Ecologique. Annuaire sur l’environnement et les Ressources Naturelles au Sénégal, 4th ed.; Centre de Suivi Ecologique: Dakar, Senegal, 2018; pp. 12–19. Available online: https://www.cse.sn/index.php (accessed on 28 August 2021).
- Bourgoin, J.; Diop, D.; Dia, D.; Sall, M.; Zagré, R.; Grislain, Q.; Anseeuw, W. Regard sur le modèle agricole sénégalais: Pratiques foncières et particularités territoriales des moyennes et grandes exploitations agricoles. Cah. Agric. 2020, 29, 18. [Google Scholar] [CrossRef]
- Faye, N.F.; Gérard, F.; Sall, M.; Affholde, F.; Roudier, P. Poverty and Inequality in Rural Areas of Central Senegal: Status, Causes and Consequences. 2021. Available online: https://agritrop.cirad.fr/598426/1/Ndeye%20et%20al.%20SFER%202021.pdf (accessed on 25 July 2021). (In French).
- Toure, A.K.; Diakhate, M. Descriptive Analysis of The Influence of Rainfall and Temperature Indicators on Agricultural Yields in Senegal. 2020. Available online: https://www.researchgate.net/publication/338698842_Analyse_descriptive_de_l%27influence_des_indicateurs_de_pluie_et_de_la_temperature_sur_les_rendements_agricoles_au_Senegal (accessed on 10 August 2021). (In French).
- National Agency Statistics and Demography. General Census of Population and Housing Senegal. 2013. Available online: https://satisfaction.ansd.sn/ (accessed on 30 April 2021). (In French).
- New Partnership for Africa’s Development-FAO. Project to Restore the Agricultural Production Base in The Groundnut Basin. 2006. Available online: http://www.fao.org/3/ah215f/ah215f00.htm (accessed on 30 April 2021). (In French).
- Ricome, A.; Affholder, F.; Gérard, F.; Muller, B.; Poeydebat, C.; Quirion, P.; Sall, M. Are subsidies to weather-index insurance the best use of public funds? A bio-economic farm model applied to the Senegalese groundnut basin. Agric. Syst. 2017, 156, 149–176. [Google Scholar] [CrossRef] [Green Version]
- United States Agency for International Development. Feed the Future Senegal Naatal Mbay Project: Women’s Economic Empowerment Strategy. 2016. Available online: https://pdf.usaid.gov/pdf_docs/PA00MMW4.pdf (accessed on 24 May 2021).
- Sanogo, D. The Living Hedge in the Southern Groundnut Basin of Senegal: Adoption and Agro-Ecological Consequences. Ph.D. Thesis, Cheikh Anta Diop University of Dakar, Dakar, Senegal, 2000. [Google Scholar]
- Ndour, M. Investing in Rural People in Senegal; International Fund for Agricultural Development: Rome, Italy, 2015; Available online: https://www.ifad.org/documents/38714170/39972302/Investir+dans+les+populations+rurales+au+Sénégal.pdf/60b009ed-ef32-45f5-ab1d-35fe04674825 (accessed on 5 July 2021).
- Mbow, M. The Challenges of Senegalese Agriculture in a Climate Change Perspective. Master’s Thesis, University of Sherbrooke, Sherbrooke, QC, Canada, 2017. [Google Scholar]
- Gueye, G.; Fall, M.; Edwige, C.; Louhounghou, R. Characterization and Typology of Family Farms in Senegal: Volume 3 Groundnut Basin. 2008. Available online: https://www.bameinfopol.info/IMG/pdf/Expl._Fam_2.pdf (accessed on 30 April 2021). (In French).
- Ramde, F.; Lo, B.S. The Role of The Agricultural Sector in The Senegal Economy. 2015. Available online: https://mpra.ub.uni-muenchen.de/81906/ (accessed on 11 May 2021). (In French).
- National Agency Statistics Demography. Republic of Senegal Provisional 2017 and Final 2016 National Accounts (2014 Base). 2019. Available online: http://www.ansd.sn/ressources/publications/NOTE%20ANALYSE%20COMPTES%20NATIONAUX%202017_.pdf (accessed on 11 May 2021). (In French).
- Ambiente, Y.M. Les Paysages de l’Afrique de l’Ouest: Une Fenêtre sur un Monde en Pleine Évolution; U.S. Geological Survey EROS: Garretson, SD, USA, 2016; pp. 279–280. [Google Scholar]
- Ndong, J.-B. L’évolution de la pluviométrie au Sénégal et les incidences de la sécheresse récente sur l’environnement/The evolution of rainfall in Senegal and the consequences of the recent drought on the environment. Rev. De Geogaphie Lyon 1995, 70, 193–198. [Google Scholar] [CrossRef]
- Faye, M.; Fall, A.; Faye, G.; Van Hecke, E. La variabilité pluviométrique et ses incidences sur les rendements agricoles dans la région des Terres Neuves du Sénégal oriental. Belgeo 2018. [Google Scholar] [CrossRef] [Green Version]
- D’Alessandro, S.; Fall, A.A.; Grey, G.; Simpkin, S.; Wane, A. Senegal Agricultural Sector Risk Assessment. 2015. Available online: Agritrop.cirad.fr/583362/ (accessed on 29 July 2021).
- Rowland, J.; Funk, C. Famine Early Warning Systems Network-Informing Climate Change Adaptation Series A Climate Trend Analysis of Senegal. 2012. Available online: Fews.net/sites/default/files/documents/reports/FS12-3123.pdf (accessed on 24 May 2021).
- Mechiche-Alami, A.; Abdi, A.M. Agricultural productivity in relation to climate and cropland management in West Africa. Sci. Rep. 2020, 10, 1–10. [Google Scholar] [CrossRef]
- Faye, C. Analysis of Drought Trends in Senegalese Coastal Zone on Different Climatic Domains (1951–2010). An. Univ. Din Oradea Ser. Geogr. 2018, 28, 231–244. Available online: https://www.researchgate.net/publication/329351771_ANALYSIS_OF_DROUGHT_TRENDS_IN_SENEGALESE_COASTAL_ZONE_ON_DIFFERENT_CLIMATIC_DOMAINS_1951-2010 (accessed on 29 July 2021).
- Food and Agriculture Organization of the United Nations and African Development Bank Group. Agricultural Growth in West Africa as a Market and Policy Driver. 2015. Available online: http://www.fao.org/3/i4337f/i4337f.pdf (accessed on 30 April 2021). (In French).
- Niang, A.; Knapman, C. Land Access for Senegal’s Small Producers under Threat; International Institute for Environment and Development: London, UK, 2017; Available online: https://pubs.iied.org/17375iied (accessed on 29 April 2021).
- The Republic of Senegal. National Land Reform Commission Land Policy Document. 2016. Available online: http://www.hubrural.org/IMG/pdf/version_preliminaire_du_document_de_politique_fonciere.pdf (accessed on 30 April 2021). (In French).
- Oya, C.; Ba, C.O. Agricultural policies 2000–2012: Between Voluntarism and Incoherence. 2013. Available online: https://eprints.soas.ac.uk/16799/1/04Oya-Ba130131%20proof.pdf (accessed on 29 April 2021). (In French).
- Faroukh, A.T.; Tellal, R.; Qarro, M. Analysis of socio-economic mutations in the Benslimane forest Lever for sustainable development (Province of Benslimane, Morocco). J. Mater. Environ. Sci. 2017, 8, 4415–4425. [Google Scholar] [CrossRef]
- Agro-Innov, R. Voluntary Cooperation Program for Innovative and Sustainable Agricultural Entrepreneurship Senegal Portrait-Diagnosis of Agricultural Soil Health. 2017. Available online: https://docplayer.fr/158367777-Programme-de-cooperation-volontaire-pour-un-entrepreneuriat-agricole-innovant-et-durable-senegal-portrait-diagnostic-de-la-sante-des-sols-agricoles.html (accessed on 30 April 2021). (In French).
- Díaz-Pacheco, J.; van Delden, H.; Hewitt, R. The importance of scale in land use models: Experiments in data conversion, data resampling, resolution and neighborhood extent. In Geomatic Approaches for Modeling Land Change Scenarios; Springer: Madrid, Spain, 2018; pp. 163–186. [Google Scholar] [CrossRef]
- Guoming, D.; Jingpan, M.; Xiang, C. Study on the transformation of arable land use patterns in modern agricultural areas. Angew. Chemie Int. 2018, 6, 951–952. [Google Scholar] [CrossRef]
- Thierry, A.; Martin, P.; Ismaïla, T.I.; Brice, T. Modelisation des Changements D’occupation des Terres en Région Soudanienne au Nord-Ouest du Benin. Eur. Sci. J. ESJ 2018, 14, 248. [Google Scholar] [CrossRef] [Green Version]
- Sagna, P.; Ndiaye, O.; Diop, C.; Niang, A.D.; Sambou, P.C. Les variations récentes du climat constatées au Sénégal sont-elles en phase avec les descriptions données par les scénarios du GIEC? Pollut. Atmos. 2015, 227. [Google Scholar] [CrossRef] [Green Version]
- Thi, N.P.; Kappas, M.; Faust, H. Impacts of Agricultural Land Acquisition for Urbanization on Agricultural Activities of Affected Households: A Case Study in Huong Thuy Town, Thua Thien Hue Province, Vietnam. Sustainability 2021, 13, 8559. [Google Scholar] [CrossRef]
- Faye, A.; Lejeune; Neya, O. The IPCC Special Report on Climate Change and Land What Impacts for Africa? 2019. Available online: www.climateanalytics.org/publications (accessed on 11 August 2021).
- Li, Z.; Deng, X.; Yin, F.; Yang, C. Analysis of Climate and Land Use Changes Impacts on Land Degradation in the North China Plain. Adv. Meteorol. 2015, 2015, 1–11. [Google Scholar] [CrossRef]
- Nhemachena, C.; Nhamo, L.; Matchaya, G.; Nhemachena, C.R.; Muchara, B.; Karuaihe, S.T.; Mpandeli, S. Climate Change Impacts on Water and Agriculture Sectors in Southern Africa: Threats and Opportunities for Sustainable Development. Water 2020, 12, 2673. [Google Scholar] [CrossRef]
- Jarju, A.M.; Solly, B. Analysis of the Efficiency of Precipitation on the Evolution of Agricultural Production in Upper-Casamance (South Senegal) between 1985 and 2018. 2020. Available online: www.researchgate.net/publication (accessed on 3 September 2021).
- Nouaceur, Z.; Murarescu, O. Rainfall Variability and Trend Analysis of Rainfall in West Africa (Senegal, Mauritania, Burkina Faso). Water 2020, 12, 1754. [Google Scholar] [CrossRef]
- Faye, B. The Problems of the Agricultural Sector in the Face of Rainfall Variability in the Commune of Dara Mboss, Kaolack Region from 1980 to 2014. Marster’s Thesis, Cheikh Anta Diop University of Dakar, Dakar, Senegal, 2016; pp. 28–47. [Google Scholar]
- Rajpar, H.; Zhang, A.; Razzaq, A.; Mehmood, K.; Pirzado, M.B.; Hu, W. Agricultural Land Abandonment and Farmers’ Perceptions of Land Use Change in the Indus Plains of Pakistan: A Case Study of Sindh Province. Sustainability 2019, 11, 4663. [Google Scholar] [CrossRef] [Green Version]
- Mu, J.E.; Sleeter, B.M.; Abatzoglou, J.T.; Antle, J.M. Climate impacts on agricultural land use in the USA: The role of socio-economic scenarios. Clim. Chang. 2017, 144, 329–345. [Google Scholar] [CrossRef] [Green Version]
- Davies, M.; Camara, T.; Diop, S. Invest in Senegal: A Competitive Investment Destination in West Africa; Deloitte: London, UK, 2017; p. 28. [Google Scholar]
- Senegal Emergent Plan. National Agricultural Investment Program for Food Security and Nutrition. PNIASAN Senegal 2018–2022, Final Report. 2016. Available online: https://www.dapsa.gouv.sn/sites/default/files/publications/PNIASAN%20v4%20D%c3%a9c_1.pdf (accessed on 30 August 2021).
- World Bank. Revue de l’Urbanisation: Villes Emergentes pour un Sénégal Emergent; World Bank: Washington, DC, USA, 2017. [Google Scholar] [CrossRef]
- Pronat, E.; LANdac. Securing Women Land Rghts in Africa Working paper 3: Securing Women Land Rights in Africa-Senegal. 2018. Available online: http://www.landgovernance.org/assets/20181127-A4-Working-paper-03_Senegal.pdf (accessed on 12 August 2021).
- Lyu, L.; Gao, Z.; Long, H.; Wang, X.; Fan, Y. Farmland Use Transition in a Typical Farming Area: The Case of Sihong County in the Huang-Huai-Hai Plain of China. Land 2021, 10, 347. [Google Scholar] [CrossRef]
Figure 1.
Geographic information: (A) represents the blue color represents the localization of the study area within Senegal; (B) represents the Groundnut Basin with five regions.
Figure 1.
Geographic information: (A) represents the blue color represents the localization of the study area within Senegal; (B) represents the Groundnut Basin with five regions.

Figure 2.
(a–d) show land use evolution patterns in years of 2009, 2012, 2015, and 2018 in the study area.
Figure 2.
(a–d) show land use evolution patterns in years of 2009, 2012, 2015, and 2018 in the study area.

Figure 3.
Regional differences in land use evolution from 2009 to 2018 (%).

Figure 4.
Land use transition throughout the study period (2009–2018).

Figure 5.
Annual evolution of rainfall: 2009 to 2018. Source CRHS 2021.


Table 1.
Data sources information.
| Types | Information | |
|---|---|---|
| Spatial data | Source | The spatial data used for this study are obtained from USGS (United States Geological Survey) and NASA (National Aeronautics and Space Administration), Modis land cover-Modis MCD12Q1V6 (acquisition data: 26 March 2021) https://earthexplorer.usgs.gov/ |
| Types | cropland; grassland; urban and built-up; permanent wetland (four images in 2009; 2012; 2015, and 2018 between June and October) | |
| Socio-economic data | Source | National Agency for Statistics and Demography (NASD) (acquisition data: 30 March 2021) https://satisfaction.ansd.sn/ |
| Types | Evolution of the population; characteristics of farm household members; farm household members with agricultural education. | |
| Agricultural data | Sources | World Bank (W.B) and Food and Agriculture Organization (FAO) (acquisition data: 30 March 2021) http://www.fao.org/faostat/fr/#data https://donnees.banquemondiale.org/indicator |
| Types | Fertilizer consumption; permanent cropland (% of land area); agriculture value added (% of gross domestic product) | |
| Climatic data | Sources Types | Data Portal: Center for Hydrometeorology and Remote sensing—available online: https://chrsdata.eng.uci.edu/ (acquisition data: 28 August 2021) Rainfall data (between June and October) |
Table 2.
The statistics of the land-use area in years 2009, 2012, 2015 and 2018 (km2).
| Land Use Pattern | Years/Values | |||
|---|---|---|---|---|
| 2009 | 2012 | 2015 | 2018 | |
| Cropland | 14,569.53 | 15,541.06 | 15,913.48 | 16,687.16 |
| Grassland | 18,656.27 | 17,704.38 | 17,295.78 | 16,566.23 |
| Permanent wetland | 758.80 | 778.41 | 779.76 | 768.63 |
| Urban and built up | 172.49 | 174.85 | 175.41 | 177.32 |
| Other | 807.27 | 765.66 | 799.93 | 765.02 |
| The total surface of the study area | 34,964.36 | 34,964.36 | 34,964.36 | 34,964.36 |
Table 3.
Dynamic land-use evolution in the period of 2009–2012, 2012–2015 and 2015–2018 (%).
| Land Use Pattern | |||||
|---|---|---|---|---|---|
| Number | Periods | Cropland | Grassland | Permanent Wetland | Urban and Built Up |
| P1 | 2009–2012 | +6.67 | −5.10 | +2.58 | +1.37 |
| P2 | 2012–2015 | +2.40 | −2.31 | +0.17 | +0.32 |
| P3 | 2015–2018 | +4.86 | −4.22 | −1.43 | +1.09 |
| The study period | 2009–2018 | +14.53 | −11.20 | +1.30 | +2.80 |
(−) Decrease in area; (+) increase in area.
Table 4.
Land use transition over the study period (2009–2018) in km2.
| Cropland | Grassland | Permanent Wetland | Urban and Built Up | |
|---|---|---|---|---|
| Cropland | 13,288.12 | x | x | x |
| Grassland | 2083.29 | 15,202.92 | 3.63 | 5.42 |
| Permanent Wetland | x | x | 747.53 | x |
| Urban and built up | x | x | x | 166.35 |
Publisher’s Note: MDPI stays neutral with regard to jurisdictional claims in published maps and institutional affiliations. |
© 2021 by the authors. Licensee MDPI, Basel, Switzerland. This article is an open access article distributed under the terms and conditions of the Creative Commons Attribution (CC BY) license (https://creativecommons.org/licenses/by/4.0/).
Share and Cite
MDPI and ACS Style
Faye, B.; Du, G. Agricultural Land Transition in the “Groundnut Basin” of Senegal: 2009 to 2018. Land 2021, 10, 996. https://doi.org/10.3390/land10100996
AMA Style
Faye B, Du G. Agricultural Land Transition in the “Groundnut Basin” of Senegal: 2009 to 2018. Land. 2021; 10(10):996. https://doi.org/10.3390/land10100996
Chicago/Turabian StyleFaye, Bonoua, and Guoming Du. 2021. "Agricultural Land Transition in the “Groundnut Basin” of Senegal: 2009 to 2018" Land 10, no. 10: 996. https://doi.org/10.3390/land10100996
Note that from the first issue of 2016, this journal uses article numbers instead of page numbers. See further details here.