Adhesion Percolation Determines Global Deformation Behavior in Biomimetic Emulsions
 Lorraine Montel1
  Iaroslava Golovkova1
  Silvia Grigolon1
  Elie Wandersman1
  Alexis M. Prevost1
  Thibault Bertrand2*
  Lea-Laetitia Pontani1*
- 1Sorbonne Université, CNRS, Institut de Biologie Paris-Seine (IBPS), Laboratoire Jean Perrin (LJP), Paris, France
- 2Department of Mathematics, Imperial College London, London, United Kingdom
Characterizing the mechanical properties of tissues is key for the understanding of fundamental biological processes such as morphogenesis or tumor progression. In particular, the intercellular adhesion forces, mediated by transmembrane proteins like cadherins, are expected to control the topology and viscoelastic behavior of tissues under mechanical stress. In order to understand the influence of adhesion in tissues, we use biomimetic emulsions in which droplets mimic cells and adhere to each other through specific bonds. Here, we tune both the binding energy of the adhesive inter-droplets contacts as well as the fraction of contacts that are adhesive, thereby defining a so-called adhesiveness. Our experimental results show that adhesion prevents the emergence of local order in emulsions even at high packing fractions by preventing energetically costly droplet rearrangements. By studying the deformation of droplets within packings with different average adhesiveness values, we reveal the existence of a threshold value of adhesiveness above which all droplets in a packing are deformed as adhesive ones irrespective of their local adhesive properties. We show that this critical adhesiveness coincides with the threshold for percolation of adhesive structures throughout the tissue. From a biological point of view, this indicates that only a fraction of adhesive cells would be sufficient to tune the global mechanical properties of a tissue, which would be critical during processes such as morphogenesis.
1 Introduction
The macroscopic response of tissues is characterized by an elastic response at short timescales and a plastic one at long timescales, during which cells undergo rearrangements [1]. Deciphering the mechanical properties of tissues will help gain a better understanding of key biological processes including morphogenesis [2], wound healing [3] or cancer invasion [4]. Indeed, previous studies showed that proper embryo development requires a precise spatiotemporal tuning of the viscoelastic properties of the tissue [2, 5]. In particular, spatiotemporal changes in material characteristics like elastic modulus, yield strength or viscosity can strongly affect morphogenetic processes like tissue spreading or body axis elongation [6–9]. In addition to the regulation of force generation in tissues, regulating material properties thus offers a mechanism for controlling morphogenesis.
At the scale of the tissue, this viscoelastic behavior depends on the physical properties of the individual cells as well as on their adhesive properties through cadherin homophilic interactions. Moreover, cells respond to an applied force through mechanotransduction processes [10], thus providing a feedback loop between the exerted forces and the mechanical properties of the tissue. The viscoelastic response of a tissue is therefore controlled by both biochemical pathways [11–13] and biomechanical processes [14], relying on the interplay between forces at the scale of single cells [15, 16] and cell-cell adhesion [17, 18]. In order to deepen our understanding of these complex processes, it is thus important to characterize the properties of biological tissues from a materials standpoint and to decipher the role of intercellular adhesion on the tissues properties. Further, changes in tissue properties can be fast and drastic, whereby a small change in properties at the cellular scale can lead to large changes in the macroscopic properties of the tissue. Recent approaches have therefore tackled the study of tissue mechanics by using the language and tools of phase transitions to highlight potential unifying principles.
The idea that the mechanics of tissues can be understood within the framework of a jamming or a rigidity transition scenario is now widely accepted [19–23]. For inert materials, the phase behavior of particulate systems is primarily controlled by the particle or droplet volume fraction ρ. Indeed, above a critical volume fraction ρc, a disordered solid develops a non-zero yield stress below which the material responds elastically and above which it flows plastically [24–28]. The distance to the jamming point (ρ − ρc) generically governs the mechanical response of these disordered systems [24, 26, 29–31]. Recently, the existence of a connection between jamming and geometry spanning both inert particulate systems and living systems was conjectured [22]. Like in jamming for inert particles, jamming in epithelial tissues was linked to caging by immediate neighbors, propagating force chains and cooperative cellular dynamics. For instance, in vitro epithelial monolayers were shown to display density-dependent glassy dynamics [32–35]. Further, a recent study argued that the zebrafish blastoderm morphogenesis is governed by a tissue rigidity phase transition which is successfully predicted by a rigidity percolation theory on the basis of the local cell connectivity network [23].
Intercellular adhesion was shown to be one of the key components of jamming in biological tissues during development, highlighting the role of adhesion on tissue rigidity [8, 23]. The maturation and strengthening of cell-cell and cell-substrate adhesions has thus been shown to lead to the jamming of amorphous configurations in confluent epithelial tissues [34]. Moreover, computational models of confluent tissues based on the active vertex model class also display rigidity transitions controlled by cellular motility properties on the one hand, and the balance between intercellular adhesion and cortical tension on the other hand [36–38]. Likewise, adhesion was shown to stabilize higher order vertices in cell tilings, which in turn is linked to the fluid-to-solid transition of the tissue [39].
However, a quantitative approach to decipher the role of adhesion on the rigidity or jamming of tissues is difficult to reach since the binding energy between cells is not readily accessible. Moreover, the topological properties of tissues cannot generically be tuned independently of other parameters. The development of computational or biomimetic approaches is thus useful to study the role of adhesion on the structure and mechanics of biological tissues in a quantitative manner. The effect of attractive interactions in model soft matter systems has been probed experimentally and through simulations; it has been shown to drastically change the nature of the jamming transition [40–43]. For instance, normal attraction forces have been shown to stabilize structures below isostaticity in granular packings, leading to a higher compactivity [40, 44]. Furthermore, attractive emulsions have been shown to display soft gel-like elastic structures capable of sustaining stresses below isostaticity [45–48]. Finally, a recent computational model also highlighted the crucial role of tension fluctuations for tissue rigidity transitions [49], by using a framework derived from deformable particle approaches [50, 51] and explicitly introducing adhesion between the cells.
In this context, biomimetic emulsions have been developed to reproduce in vitro the mechanical and adhesive properties of cells in tissues [52]. These systems have shed light on the importance of compressive forces for adhesion growth within tissues and can serve as a general platform to study surface interactions through biological proteins [53]. More recently they have also probed the elasto-plastic response of tissues under mechanical stress [54] and revealed a global polarizing effect of adhesion in elongating tissues [55].
In this work, we use biomimetic emulsions in order to probe the influence of adhesion on the structure and droplet deformations in static 2D packings. We use different types of binders between the droplets, which allows us to tune not only the binding energy between the droplets, but also the number of adhesive contacts one droplet can establish with its neighbors, by varying the proportion of droplets carrying complementary binders in the emulsion. Inspired by Ref. [56], we characterize packings via their adhesiveness. Interestingly, we find that adhesion impairs local crystalline order even in emulsions at high packing fractions, suggesting that the presence of adhesion patches hinders emulsion remodelling, in agreement with our previous work [55]. We also show that an increased binding energy or an increased proportion of adhesive contacts in the packing lead to an increase in droplets deformation as a function of their local packing fraction. However, for any given experimental condition, i.e., one type of binder and a fixed proportion of complementary droplets, all the droplets in the packings exhibit the same deformation level independently of their local adhesive neighborhood. We relate this property to a threshold adhesiveness above which the adhesive contacts between droplets form a percolating network in the emulsion. From a biological standpoint, this suggests that tuning the adhesive properties of only a fraction of the cells could affect the global mechanical behavior of a tissue.
2 Materials and Methods
2.1 Emulsion Preparation
An oil-in-water emulsion stabilized by Sodium Dodecyl Sulfate (SDS, Sigma Aldrich) was first prepared by emulsifying silicone oil (50 cSt, Sigma Aldrich) in a 10 mM SDS solution, using a pressure emulsifier as described in [54]. The droplets stabilization was then modified by replacing the SDS with a mixture of egg L-α-phosphatidylcholine (EPC) lipids and DSPE-PEG(2000)-biotin lipids from Avanti Polar Lipids, at a mass ratio of 9:1, using the protocol described in [55]. At the end of this stabilization process, we obtain an emulsion of phospholipid-stabilized droplets in a 10 mM Tris, pH = 7.2 ± 0.2, 1 mM SDS buffer (referred thereafter as TS buffer) and we let it cream for the functionalization steps. The resulting droplets exhibit a mean diameter of 33μm, with an 18% polydispersity (see Supplementary Figure S1 for the size distribution).
2.1.1 Streptavidin Functionalization
In order to graft streptavidin onto the biotinylated lipids distributed on the droplets surface, 7.1 μL of Alexa Fluor 555-conjugated (Invitrogen) was added to 193 μL TS buffer and 50 μL of creamed biotinylated emulsion. The droplets were incubated during 1 hour at room temperature in the dark, and mixed gently once every 10 minutes in order to re-suspend the creamed emulsion. After incubation, the emulsion was washed by removing the 200 μL of aqueous lower phase, and subsequently adding 200 μL of TS buffer. This washing step is repeated 3 times to remove all unbound streptavidins that could remain in the water phase, leaving an emulsion of droplets partially covered with fluorescent streptavidin (see Figures 1A,C). In order to induce adhesion between the droplets, the TS buffer is replaced by a buffer supplemented in Magnesium (10 mM Tris, 1 mM SDS, 2mM MgCl2, pH = 7.2), hereafter named TM2S buffer.
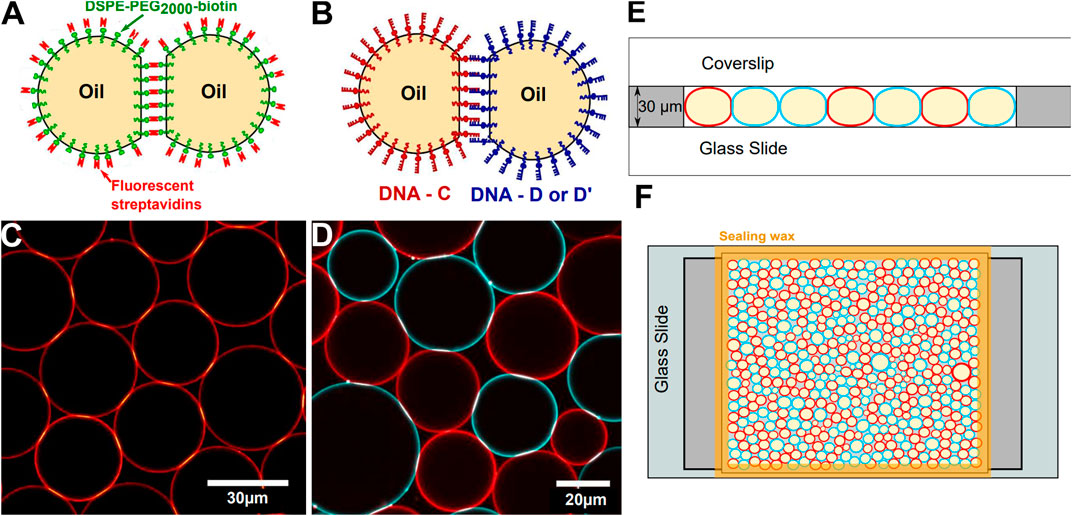
FIGURE 1. Experimental setup—Sketch of adhesive droplets functionalized with streptavidin (A) or DNA binders (B). (C) Confocal image of a 2D packing of droplets stabilized with fluorescent streptavidin. (D) Confocal image of a 2D packing of droplets functionalized with C and D DNA sequences labelled respectively with Alexa Fluor-555 (red) and -488 (blue) streptavidins. In (C, D), brighter patches at droplet-droplet junctions denote adhesion patches enriched in fluorescent binders. (E) Side-view of the experimental chamber, (F) Sketch of a top view of the experimental chamber containing a packing of complementary DNA-functionalized droplets.
2.1.2 DNA Functionalization
DNA-functionalized droplets were prepared as described in [57] (see Figures 1B,D). DNA sequences consisted in a non-sticky biotinylated 49 base pairs (bp)-long backbone followed by an 11 bp-long sticky end. The 49 bp-long backbone can be hybridized with its complementary sequence (CS) to create a rigid double-stranded backbone. We used three complementary sticky ends:
C: 5′ GGA TGA AGA TGA GCA TTA CTT TCC GTC CCG AGA GAC CTA ACT GAC ACG CTT CCC ATC GCT A Biotin-3′
D: 5′ CAT CTT CAT CCA GCA TTA CTT TCC GTC CCG AGA GAC CTA ACT GAC ACG CTT CCC ATC GCT A Biotin-3′
D′: Biotin-5′ AGC ATT ACT TTC CGT CCC GAG AGA CCT AAC TGA CAC GCT TCC CAT CGC TAC ATC TTC ATC C 3′
CS: TAG CGA TGG GAA GCG TGT CAG TTA GGT CTC TCG GGA CGG AAA GTA ATG C.
The C sequence complements both D and D′ (see slanted parts of the sequences for C/D and C/D′ complementarity), as sketched in Figure 1B.
In order to functionalize the droplets, the DNA sequences C, D or D′ were first hybridized with their complementary backbone CS: 113 pmol of CS and 113 pmol of C, D or D′ were incubated together in 200 μL of 10 mM Tris, 1 mM SDS, and either 4 mM or 2 mM MgCl2 buffer (TM4S or TM2S buffer), for 45 min at room temperature. These proportions were chosen so that DNA strands and streptavidins are in 1:1 proportions and the streptavidin-DNA complexes occupy theoretically at most one fourth of the total droplet surface. Note that only three experiments were carried out with the TM4S buffer. However, none of the experimental measurement differed between 2 and 4 mM MgCl2. Only the kinetics of streptavidin patches formation was impacted. Patches were formed in both cases well below the 45 min incubation before observation. Therefore, we pool together all experiments carried out with 2 and 4 mM MgCl2 magnesium for a given ratio of droplets functionalized with complementary DNA strands.
Fluorescent streptavidin was then added to the DNA sequences. To do so, 7.1 μg of Alexa-488 streptavidin or Alexa-555 streptavidin at 1 mg/ml was added to the solution, and incubated during 1 h at room temperature in the dark to combine with the biotinylated end of the DNA sequences. The C sequence was associated to the Alexa-555 streptavidin and the D sequence to the Alexa-488 streptavidin, as shown in Figure 1D.
Finally, 207 μL of the DNA solution was added to 50 μL of creamed biotinylated droplets, and incubated for 1 hour at room temperature in the dark, with a gentle agitation every 10 min to re-suspend the droplets. These proportions were chosen so that DNA strands and streptavidin are in 1:1 proportions, and the streptavidin-DNA complexes occupy theoretically at most one fourth of the droplet total surface. After the final incubation, the droplets are rinsed with the same buffer 3 times as described above. Immediately before the experiment, the two populations of complementary DNA droplets are mixed together (see Figure 1D).
2.2 Experimental Set-Up
The experimental chamber for 2D packings is made with a glass slide and a coverslip separated by two lateral 30 μm high adhesive spacers (polymethylmethacrilate -PMMA-film, Goodfellow) as illustrated in Figure 1E,F. A solution of 0.5 mg/ml casein (β-casein from bovine milk, Sigma Aldrich) is first injected inside the chamber to prevent non-specific interactions between the droplets and the walls of the chamber and left aside for 15 min. The chamber is then rinsed with water and dried under nitrogen.
For all droplet types, the functionalized emulsion is resuspended in a water/glycerol solution (60:40 v:v), with the same composition as the desired buffer: TS buffer for non-adhesive streptavidin covered droplets, TM2S for adhesive streptavidin droplets, TM4S or TM2S for adhesive DNA droplets. The use of glycerol in the continuous phase ensures that the optical index of the water phase better matches that of the silicone oil in order to improve droplet edges visualization. This emulsion (≈10 μL) is then injected in the chamber which is subsequently sealed with hot wax (Dental Sticky Wax from Kerr). We then acquire 2D fluorescence images of the droplet packings through spinning-disk confocal microscopy (Spinning Disc Xlight V2, Gataca systems), using a ×20 objective.
2.3 Image Analysis
2.3.1 Image Segmentation and Shape Measurements
Raw images are segmented using Ilastik [58], as illustrated in Supplementary Figure S2B. Segmented images are then skeletonized to obtain a binary image of the contour of droplets and a surface Voronoi tesselation is performed on the segmented images with Fiji (see Figure 2A and Supplementary Figure S2C). All subsequent image analysis are performed with the Sci-kit image Python module. At this stage, the size and circularity 4πa/p2 are calculated for all binarized objects, with p the perimeter and a the projected surface of the identified objects. We detect two kinds of objects: voids (typical area 25μm2, typical circularity 0.45) and droplets (typical area 700μm2, typical circularity 0.9). Only the objects with an area larger than 253 μm2, (i.e., a radius r > 9μm, the size of our smallest droplets) and a circularity larger than 0.67 are classified as droplets. Droplets whose Voronoi cell touch the border of the image are also excluded from the analysis.
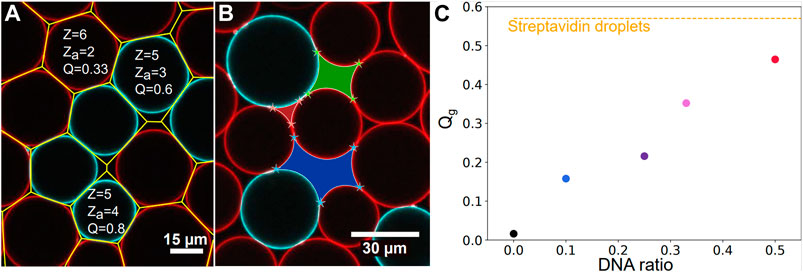
FIGURE 2. Image analysis—(A) Surface Voronoi analysis (yellow lines) of a packing of complementary droplets coated with C (red droplets) and D (blue droplets) DNA sequences. Local coordination, number of adhesive contact and the resulting adhesiveness are given as an example for three droplets in the packing. The number of adhesive contacts za is here given by the number of surrounding droplets exhibiting a complementary color to the central droplet and a local increase in fluorescence at the contact site with the central droplet. (B) Illustration of void analysis displaying a 3-sided (red), a 4-sided (green) and a 5-sided (blue) void in a DNA droplets packing. (C) Global adhesiveness Qg calculated over all droplets in all images acquired as a function of the chosen ratio of complementary DNA droplets. Qg grows as the ratio is increased from 1:9 to 1:1. The global adhesiveness calculated for the streptavidin packings Qg = 57% is shown with the yellow dashed line.
We next calculate the shape parameter
2.3.2 Neighborhood and Adhesion Patches Measurements
The Region Adjacency Graph [59] module from the Sci-kit image Python package [60] was used to determine the neighborhood properties in the packing, as illustrated in Supplementary Figure S2D. In particular, for a given droplet, the number of neighbors n refers to adjacent Voronoi cells. Within those neighbors, a number of droplets are in direct contact with the central one, thus defining its number of contacts z, i.e., its coordination number (see Supplementary Material for more details).
For every droplet-droplet contact, we detect the presence of an adhesion patch by comparing the fluorescence intensity in the contact to the one on the free surface of the droplet. For two droplets of the same color, we identify a binding patch if the fluorescence intensity at the droplet-droplet contact is at least twice larger than the intensity on the free surface (for more details, see Supplementary Material and Supplementary Figure S4). Moreover, we only consider patches that are larger than 1 μm2 in order to exclude artifacts such as small protein aggregates (see Supplementary Figure S2F for an example of detected patches and aggregates). For DNA complementary droplets of different colors, the fluorescence intensity in the patch is not additive. We identify a binding patch when the intensity in the patch is 1.5 times larger than the intensity on the free surface for each color. This threshold was chosen using the intensity histogram of the image, and adjusted by trial and error to match the patches detected by eye, as is explained in more details in section 2.4 of the Supplementary Material.
The local adhesiveness of a droplet Ql is defined as the ratio between its number of contacts displaying an adhesive patch za and its total number of contacts with the surrounding droplets z (see two examples in Figure 2A).
2.3.3 Void Measurements
Regions discarded from the droplet analysis are the void areas between droplets. We excluded all the voids touching the border of the images from the analysis. For each void, we counted the number of corners detected with a Harris corner detector [61], and assumed that the number of corners was equal to the number of sides of the voids, as shown in Figure 2B. Then for each image, we measured the packing fraction (as the total area fraction of the droplets on the image), and the probability of a void having n sides on the image.
2.4 Experimental Conditions
Two-dimensional packings of droplets were prepared as described in the Materials and Methods section. Six distinct experimental conditions were explored in order to tune the number of adhesive droplet-droplet contacts in the packings. To do so, we used droplets coated with streptavidin or DNA complementary strands and, in the latter case, explored a range of ratios for the droplets carrying each strand of DNA. For each condition, we calculated the resulting global adhesiveness Qg by averaging the local adhesiveness of all droplets in all images corresponding to a given experimental setting (for instance one given ratio of complementary DNA droplets).
Packings of non-adhesive droplets were prepared by using streptavidin coated droplets in the absence of the salts necessary to trigger adhesion (in the so-called TS buffer). In the absence of salt, it was shown that compression could lead to biotin-streptavidin-biotin patches between droplet surfaces over the timescale of hours [52, 55]. To avoid this effect in the case of control experiments, we imaged the samples immediately after they were formed, which indeed yielded a close to zero adhesiveness (Qg = 2%). To complement these control experiments, we also prepared packings of DNA coated droplets in which only one strand was introduced, namely the C strand. In the absence of a complementary strand to hybridize with, these emulsions also displayed a zero adhesiveness (see Figure 2C). As a result, these experiments were pooled together and labelled as repulsive packings [52, 55]. Adhesive emulsions were prepared with two distinct strategies. First, we used streptavidin biotin adhesion between the droplets in order to maximize the number of potentially adhesive contacts between the droplets. Second, we used droplets coated with complementary strands of DNA such that only a fraction of the contacts on average can form an adhesion [57]. For streptavidin driven adhesion, the droplets were incubated for 90 min in TM2S buffer in the observation chamber, allowing adhesive patches to form between contacting droplets. We refer to these conditions as Streptavidin droplets experiments in the following. The adhesiveness of these emulsions was measured to be Qg = 57%, as shown on Figure 2C. Note that the adhesiveness does not reach 100%, meaning that not all contacts are adhesive. This is due to the fact that the number of available streptavidins or biotins to form patches can differ from one droplet to the other, and may not allow to form patches with all contacting droplets. Moreover, as binders may cluster inside the adhesive patches, a droplet can run out of binders to form additional patches with the other contacting droplets, which could account for the limited adhesiveness in these packings.
In addition to this, partially adhesive droplets experiments were prepared by using various proportions of droplets functionalized with complementary DNA strands. Two distinct sets of complementary strands were used: C/D or C/D’ (see Materials and Methods). Since both pairs of DNA strands display the same number of complementary bases, they have the same binding energy of about 26 kBT [62]. The experiments carried out with C/D or C/D’ strands were thus pooled together. The complementary droplets were mixed together immediately before injection in the chamber in proportions ranging from 1:9 (for instance 1.5 μL of C emulsion mixed with 13.5 μL of D emulsion), to 1:3, 1:2 and 1:1. The 1:1 DNA experiment had a mean adhesiveness of 46% as seen on Figure 2C, and is labelled DNA droplets in Figures 3, 4. The resulting global adhesiveness Qg in the packings for the different proportions of complementary droplets is shown in Figure 2C. The Ql cumulative distribution for each global adhesiveness Qg is available on Supplementary Figure S5.
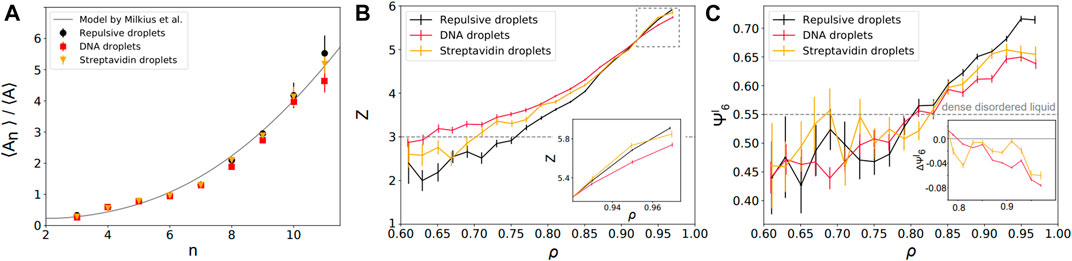
FIGURE 3. Local structural properties of static packings—(A) Average area of the Voronoi cells as a function of their number of neighbors n. Repulsive (black disks) and adhesive emulsions (DNA: red squares; streptavidin: yellow triangles) agree with the theoretical predictions of a granocentric model (black line) [70]. (B) Mean local droplet coordination number z as a function of their local packing fractions for repulsive (black) and adhesive packings (DNA: red; streptavidin: yellow). Inset: zoom at high packing fractions near confluence. (C) Mean local bond orientational order
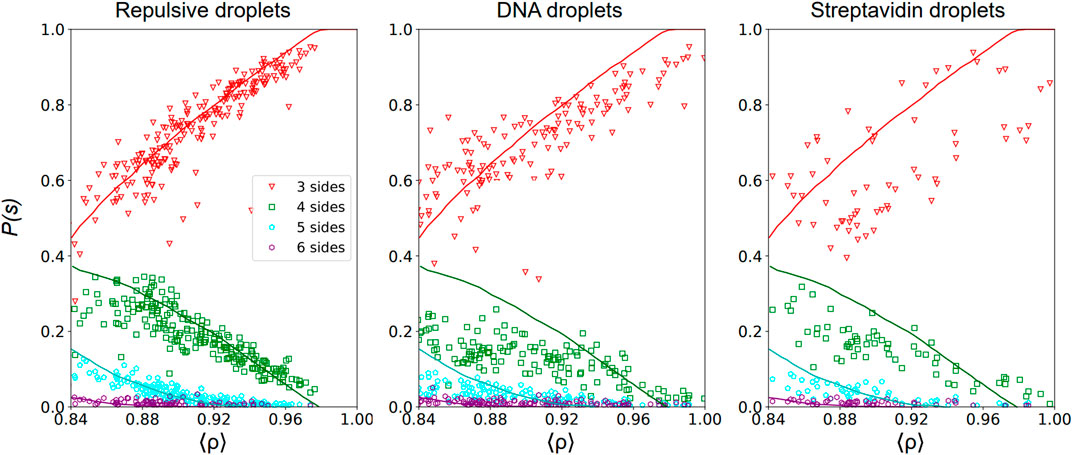
FIGURE 4. Topology of the voids—Probability P(s) to have a void with s sides with s = 3 (red triangles), 4 (green squares), 5 (cyan pentagons) and 6 (purple hexagons) as a function of the packing fraction ⟨ρ⟩ calculated as in Eq. 1 in 2D Packing images of repulsive emulsions (left), DNA emulsions (center) and streptavidin emulsions (right). The void probability is normalized such that ∑sPs(ρ) = 1 at each packing fraction. We superimpose on our experimental data results of numerical simulations of jammed packings in a deformable particle model introduced in [51].
After sample preparation and injection in the microfluidic chamber, fluorescent images were acquired at various locations in the sample. Each captured region of interest contains ∼ 200–300 droplets. After image analysis, we obtain for each droplet i its area ai and the area of its associated Voronoi cell
3 Results
3.1 Structural Properties of Static Packings
Isotropically compressed systems composed of repulsive and frictionless particles, such as emulsions, typically jam and develop a non-zero yield stress at a critical packing fraction ρc ≈ 0.84 [24, 63, 64]. For ρ < ρc, the particles have an insufficient number of interparticle contacts for the packing to be mechanically stable. At the jamming onset, Maxwell’s criterion dictates that the average coordination in 2D disordered packings of repulsive spheres be given by zc = 4; in other words, the packing develops a connected interparticle contact network which is exactly isostatic at the critical point ρc [24, 63, 65, 66]. If the system is further compressed to ρ > ρc, the average coordination is expected to increase. We first study how the coordination number grows with the packing for adhesive and non-adhesive packings. To do so, we look at each image independently and measure their average coordination and packing fraction, given respectively by
where the sum runs over the number of droplets which sit entirely in the frame. We compare the data obtained for non-adhesive packings with the two most adhesive conditions: streptavidin packings (corresponding to Qg = 0.57) and DNA packings with a 1:1 ratio (corresponding to Qg = 0.46). As seen in Supplementary Figure S7, the average coordination increases with the global packing fraction and our data is in agreement with recently developed models of deformable particles (in which droplets are deformable but cannot overlap, see Supplementary Material). Note that in this representation, adhesive and repulsive conditions overlap above the jamming onset, which does not allow us to test the effect of adhesion for the packing of deformable particles.
3.2 Local structural Properties of Static Packings
We then study the local structural properties of static packings. In particular, we look at the local neighborhood properties of particles in the framework of the granocentric model [67–69]. According to this model, random packings of frictionless spheres can be described locally by the assembly of nearest neighbors around a central particle. After filling the available solid angle around it, one randomly chooses which of those neighbors are in contact with the central particle. The granocentric point of view thus reduces the complexity of understanding the global structure of packings to a local stochastic process.
We first examine the relationship between the area of the Voronoi cell associated to each droplet and its number of neighbors n (i.e., the number of faces of the Voronoi cell). Qualitatively, one expects that larger droplets can accommodate a higher number of neighbors around them. In our experiments, we find that the average area ⟨An⟩ of cells with n neighbors normalized by the average area over all cells ⟨A⟩ increases nonlinearly with the number of neighbors n (see Figure 3A) as was previously observed for soap foams and emulsions in 3D (in which one instead considers the volume of the Voronoi cells) [71]. Strikingly, we find that all adhesion conditions follow the same law and are in agreement with previous extensions of the granocentric model in 2D [70]. This independence with respect to adhesion hints at the fact that repulsive and adhesive emulsions pave space the same way, i.e., their Voronoi cells have the same number of neighbors for a given size. Rather, the difference between repulsive and adhesive emulsions is to be found in the statistics of their number of contacts which is the local parameter that should be sensitive to interdroplet adhesion.
To study this in further detail, we measure the coordination of each droplet z (i.e., its number of contacts) as a function of its local packing fraction ρ. We find that adhesive droplets maintain a higher coordination than repulsive droplets at low packing fractions (ρ < ρc), see Figure 3B. In fact, DNA emulsions exhibit local coordination numbers that are located above the value of 3, corresponding to the minimum z for local mechanical stability, far below jamming. This is in agreement with previous observations on packings of attractive droplets in which voids were stabilized with attraction, leading to mechanically stable structures below the jamming transition [40]. At high local packing fraction ρ ∼ 1, the coordination of repulsive droplets converges to z = 6. Indeed, compression is accompanied by structural rearrangements in these packings of non-adhesive droplets. While polydisperse emulsions are fully disordered close to jamming, local crystalline order is expected to emerge under compression. This will lead to locally hexagonal lattices associated to a coordination z = 6 in 2D. In contrast, we can observe a slight deficit in coordination in strongly adhesive emulsions when ρ approaches 1 (see inset for DNA functionalized droplets in Figure 3B). Qualitatively, this observation is in agreement with the fact that adhesion impairs one degree of freedom in the system. This might also explain why the effect is only visible for DNA bonds that have a higher binding energy of ≈26kBT [62] than streptavidin-biotin bonds associated with ≈15kBT [72, 73]. Indeed, while adhesion patches between droplets can move freely on their surface [57], their rupture is energetically costly which hinders the reorganizations that are leading to local ordering of the system.
To further quantify the emergence of local order in our emulsions, we measure the positional order in our packings as a function of adhesion. To do so, we calculate the bond orientational order parameter ψ6 which measures hexagonal crystalline order [74, 75]. The local bond orientational order is given by
where nk is the number of neighbors of drop k. The angles θkj are defined as the angle between the vector joining the centers of droplet k and one of its Voronoi neighbors j and an axis of reference. Here, we focus on the local definition of the bond orientational order as polydispersity would prevent any long-range crystalline order. Indeed, in a polycrystalline system, one potentially observes large values of
In Figure 3C, we represent the average
3.3 Void Statistics
To characterize fully the local topology of the packings, we further study the structure of the voids between droplets as a function of the mean packing fraction ⟨ρ⟩ above jamming in each image. From our image segmentation, we can extract the void space and characterize the topology of the voids by counting their number of edges.
In Figure 4, we represent the probability P(s) to have a void with s sides in repulsive, DNA and streptavidin emulsions as a function of the global packing fraction calculated in each acquired image. For repulsive packings, we observe that the probabilities of three- and 4-sided voids are similar near the jamming onset ρc, and greatly exceed the probability of having 5- or 6-sided voids. As the packing fraction increases, structural rearrangements lead to a strong increase of the probability of 3-sided voids while the probability of finding any other type of voids decreases, which is consistent with the emergence of hexagonal order at higher packing fractions. In Figure 4, we show quantitative agreement between our experimental data for repulsive emulsions and results of numerical simulations of jammed packings in a deformable particle model [51]. Instead, analysis results for adhesive packings (both DNA and streptavidin droplets) deviate from the numerical results of this purely repulsive model. All distributions are flatter in both cases and the proportion of 3-sided voids are consistently lower than the theoretical curve derived for repulsive packings at high packing fractions. This is again consistent with the idea that adhesion prevents local ordering upon compression in such emulsion packings, or in other terms that droplets have less freedom to rearrange. This would lead in turn to more constrained void topologies as evidenced by distributions that are less sensitive to the packing fraction.
3.4 Local Deformations and Adhesion
We next study the deformation of the droplets as a function of their local packing fraction. To do so, we measure the shape parameter
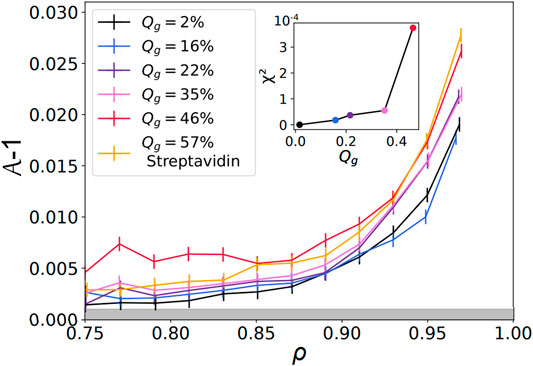
FIGURE 5. Shape factor as a function of the packing fraction —
Finally, the curve corresponding to streptavidin experiments, at Qg = 57%, is located below the highest DNA curve at Qg = 46%. This shift can be explained by the difference in binding energy between these two types of binders. Indeed, a biotin-streptavidin bond is associated with an energy gain of about ≈15kBT, while a sticky DNA sequence of 11 base pairs is estimated to yield ≈26kBT. As the size of an adhesion patch between two droplets is set by the balance between the binding energy gain upon adhesion versus the elastic cost due to surface deformation, higher binding energies per bond could lead to larger patches and higher values of
Surprisingly, the trend is very different if one looks at local droplet adhesiveness Ql within one experimental condition, i.e., one given Qg. Indeed, we sorted all the droplets in one given condition as a function of their local adhesiveness and pooled them in bins of local adhesiveness Ql. For each bin, one can plot again the evolution of their shape factor as a function of the local packing fraction. Strikingly, one can see with this representation that the curves overlap independently of their Ql, as evidenced both for DNA and streptavidin emulsions in Figures 6A–C. This observation is again quantified by a calculation of the χ2 value between the control curve and all other ones at higher local adhesiveness (see Supplementary Figure S6). We conclude from this analysis that the droplets cannot be separated from each other as a function of their local adhesiveness Ql within a given experimental condition (associated to a given Qg). In other words, this means that the non-adhesive droplets within adhesive packings display the same behavior as the whole packing independently of their local binding topology. Qualitatively, if a non-adhesive droplet is caged by a ring of adhesive ones, one can understand how the contraction of this adhesive ring will automatically induce deformations in the central droplet, as illustrated in Figure 6D.
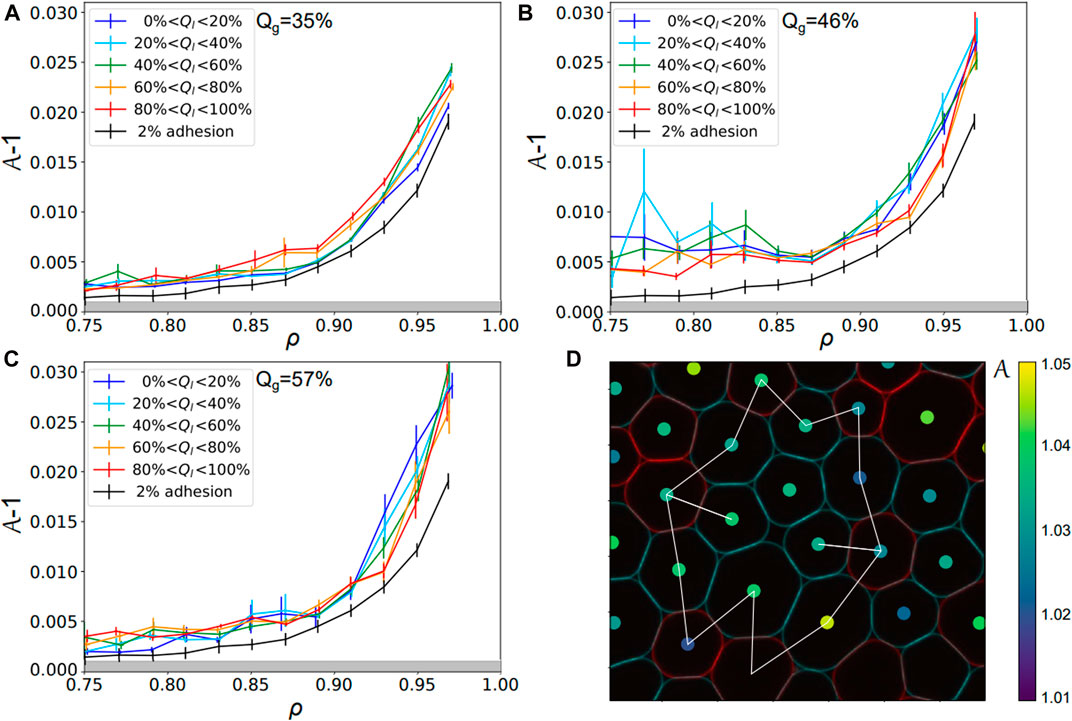
FIGURE 6. Droplets local adhesiveness for various global adhesion conditions—Shape factor
Therefore, a continuous cage of adhesive droplets should be sufficient to induce deformation on all the non-adhesive droplets enclosed in that chain. Conversely, if adhesive contacts are too sparse, individual non-adhesive droplets will not feel the adhesion. In order to quantify this effect, we measured the percolation of adhesive contacts within all emulsions. We defined the adhesive network as the network formed by contacts displaying an adhesive patch. For each image, we check the existence of a path along the adhesive network going from any droplets on one border to any droplet on the opposite border of the image, as shown in Figures 7A,B. If at least one such path exists between two opposite borders, the network on the image is classified as percolated. We then measure the average adhesiveness in each of these images and plot the probability of percolation as a function of the image adhesiveness for all experimental conditions. We find that, independently of the Qg value, all points superimpose onto a master curve showing a sharp transition between packings with non percolating and percolating conditions (see Figure 7C). We thus argue that the mechanical properties and local structure of our packings are controlled by a percolation transition for adhesive contacts. We fit the experimental points by a sigmoid function and obtain a critical value of 0.39 for the global adhesiveness above which packings are percolated, which coincides with the value at which the deformation curve significantly deviated from the repulsive case (see inset of Figure 5).
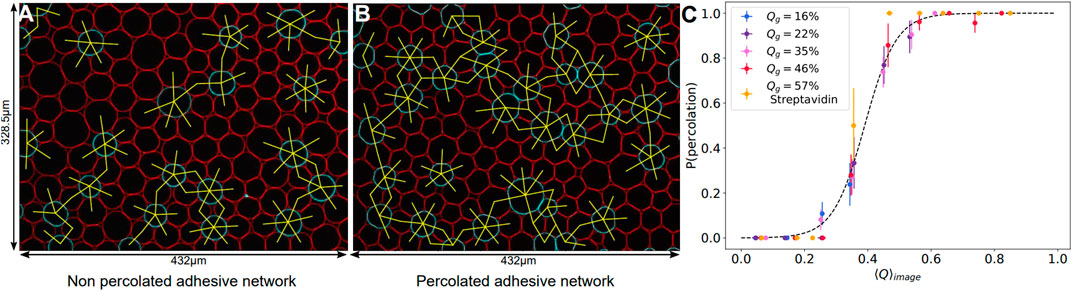
FIGURE 7. Adhesive contact percolation—(A, B) Example images of adhesive networks for DNA droplets, with connections between adhesive droplets in yellow. If there is no continuous path between opposite borders, the network is non percolated (A), if a path exists, the network is percolated (B). Image sizes: 432 μm × 328.5 μm. (C) Probability of percolation in networks of adhesive droplets. The probability of forming a continuous adhesive path between two opposite borders of each image is plotted against the mean adhesiveness ⟨Q⟩image calculated in the corresponding image. All experimental conditions collapse on the same curve and can be fitted by a sigmoid of equation
4 Discussion
In recent years, approaches borrowed from soft matter have led to the introduction of new frameworks to decipher the physical ingredients at the origin of important biological processes. For instance, recent studies have highlighted the importance of a precise regulation of the mechanical properties of tissues for the shaping of organs during morphogenesis [2, 5–9]. In this context, cell-cell adhesion has been identified as a key parameter in the control of the viscoelastic behavior of tissues. Cellular adhesion is expected to impact the mechanical properties of tissues at multiple levels; indeed, it can tune the topology of cellular tilings [36, 38–40], but also modify their elasto-plastic response under perturbation [54, 55].
Here, we have developed a simplified approach to probe the role of adhesion on the local structure and rigidity of cellular monolayers based on the study of static 2D packings of biomimetic emulsions. In particular, we mimic cellular tissues by using functionalized droplets with controllable adhesion properties. The use of different types of binders between the functionalized droplets allows us to control not only the binding energy between the droplets, but also to tune the structure of the network of adhesive contacts in the 2D packings, by varying the proportion of droplets carrying complementary binders in the emulsion.
The strength of the interdroplet adhesion depends on both the binding energy and the density of binders in the adhesion patches. We calculate the density of binders in the adhesive patches by using a force balance model [76]. To do so, we focused on configurations below the jamming transitions to approximate each droplet as a portion of a sphere and a flat region corresponding to the contact area (Supplementary Figure S8). Imposing the force balance equation in the system, i.e., considering the droplets at a stationary state in mechanical equilibrium, we obtained an expression for the average binder density
Besides differences in the intercellular interaction potential, in such particulate systems the mechanical response directly depends on its structure in the framework of the jamming transition. We therefore studied the impact of adhesion on the structural properties of static packings. Below jamming, we observed that adhesive droplets form more locally stable structures by having a higher number of contacting neighbors than in the repulsive case, remaining above isostaticity far below the jamming volume fraction for repulsive systems. This is consistent with existing literature showing that adhesive emulsions can exhibit a finite elastic modulus below jamming [43, 48]. Conversely, packings with strong interdroplet adhesion reveal a deficit in droplet coordination number and lower bond orientational order parameter when approaching confluence. We argue that this is due to the fact that adhesion prevents local crystalline order by preventing droplet rearrangements which would require breaking adhesive bonds. By preventing ordering, adhesion can have an impact on the response of compressed emulsions under stress as higher crystalline order in particulate materials has been shown to promote large rearrangements along disclination planes when subjected to shear [55, 80, 81].
Rearrangements in jammed packings participate in the release of stored elastic energy; as adhesion prevents these rearrangements, it is then not surprising that adhesion would promote higher droplet deformation in compressed emulsions. We confirm this intuition and show more specifically that the deformation level in adhesive emulsions is controlled by a percolation transition. Indeed, we observed that percolation of the network formed by adhesive contacts in the packing sets the level of deformation for all droplets, independently of their local environment. More precisely, we found that 40% of adhesive contacts are sufficient to induce a global change in the deformation level of all droplets in the assembly. Qualitatively, percolated networks of adhesive interdroplet contacts promotes local caging of droplets surrounded by strong adhesion rings. Droplets in these cages will thus display the same level of deformation as surrounding droplets with high adhesiveness independently of their own adhesiveness.
Going back to biological tissues, our observation means that the upregulation of adhesion in a small number of cells could induce large global changes in the tissue through mechanosensitive pathways. We argue that the tissue rigidity transition, which is key to fundamental morphogenetic processes, can thus take place with only a low fraction of adhesive contacts between the cells given that their spatial distribution ensures percolation of the adhesive contacts network. Interestingly, a recent study argues that a rigidity percolation transition similar to ours controls the mechanical properties of the zebrafish blastoderm throughout morphogenesis but also across experimental perturbations of cell fate, division, contractility and adhesion [23]. Akin to our observation, it was shown that cell-cell adhesion defines the cell connectivity which in turn, modulates the tissue rigidity. In particular, small changes in cell-cell adhesion were linked to drastic and abrupt changes in tissue viscosity. Overall, this is all consistent with the idea that being close to the rigidity percolation critical point allows a tissue to change its material properties rapidly and drastically [82].
In conclusion, our work explores the physics of jamming and rigidity percolation in tissues from two perspectives. First, from a granular point of view, the structural properties of the packings are controlled by the packing fraction. In this context, we confirm here that adhesion stabilize packings at densities below the jamming onset for repulsive systems. In that sense, the jamming onset (understood as the critical density at which the packing acquires a non zero yield stress) should be defined at a lower threshold packing fraction in the presence of adhesion. Importantly, we further show that long range collective effects control the deformation of individual droplets in our system. We argue here that this observation can be understood in the context of the transition to percolation of the adhesive contacts network. Our work thus paves the way for a redefinition of the jamming phase diagram for tissues, in which the axis related to the intercellular adhesion energy (or the packing fraction) could be replaced by a measurement that combines this value with the spatial arrangement of the adhesive interfaces.
Data Availability Statement
The raw data supporting the conclusions of this article will be made available by the authors, without undue reservation.
Author Contributions
L-LP conceived the project, LM and IG performed experiments, TB and SG performed theoretical modelling, LM and TB performed data analysis. L-LP, TB, and LM wrote the original draft, SG, EW, and AP reviewed and edited the manuscript. All authors participated to scientific discussions on the results and commented on the manuscript.
Funding
L-LP acknowledges financial support from Agence Nationale de la Recherche (BOAT, ANR-17-CE30-0001) and from Emergence(s) Ville de Paris.
Conflict of Interest
The authors declare that the research was conducted in the absence of any commercial or financial relationships that could be construed as a potential conflict of interest.
Publisher’s Note
All claims expressed in this article are solely those of the authors and do not necessarily represent those of their affiliated organizations, or those of the publisher, the editors and the reviewers. Any product that may be evaluated in this article, or claim that may be made by its manufacturer, is not guaranteed or endorsed by the publisher.
Acknowledgments
The authors thank Corey S. O’Hern for sharing the numerical data shown in Figure 4, as well as Jacques Fattaccioli for letting us use his pressure emulsifier.
Supplementary Material
The Supplementary Material for this article can be found online at: https://www.frontiersin.org/articles/10.3389/fphy.2021.744006/full#supplementary-material
References
1. Marmottant P, Mgharbel A, Käfer J, Audren B, Rieu J-P, Vial J-C, et al. The Role of Fluctuations and Stress on the Effective Viscosity of Cell Aggregates. Proc Natl Acad Sci (2009) 106:17271–5. doi:10.1073/pnas.0902085106
2. Forgacs G, Foty RA, Shafrir Y, Steinberg MS. Viscoelastic Properties of Living Embryonic Tissues: a Quantitative Study. Biophysical J (1998) 74:2227–34. doi:10.1016/S0006-3495(98)77932-9
3. Barriga EH, Mayor R. Adjustable Viscoelasticity Allows for Efficient Collective Cell Migration. Semin Cel Developmental Biol (2019) 93:55–68. doi:10.1016/j.semcdb.2018.05.027
4. Streitberger K-J, Lilaj L, Schrank F, Braun J, Hoffmann K-T, Reiss-Zimmermann M, et al. How Tissue Fluidity Influences Brain Tumor Progression. Proc Natl Acad Sci USA (2020) 117:128–34. doi:10.1073/pnas.1913511116
5. Petridou NI, Heisenberg CP. Tissue Rheology in Embryonic Organization. EMBO J (2019) 38:e102497. doi:10.15252/embj.2019102497
6. Morita H, Grigolon S, Bock M, Krens SFG, Salbreux G, Heisenberg C-P. The Physical Basis of Coordinated Tissue Spreading in Zebrafish Gastrulation. Developmental Cel (2017) 40:354–66. doi:10.15252/embj.2019102497
7. Barriga EH, Franze K, Charras G, Mayor R. Tissue Stiffening Coordinates Morphogenesis by Triggering Collective Cell Migration In Vivo. Nature (2018) 554:523–7. doi:10.1038/nature25742
8. Mongera A, Rowghanian P, Gustafson HJ, Shelton E, Kealhofer DA, Carn EK, et al. A Fluid-To-Solid Jamming Transition Underlies Vertebrate Body axis Elongation. Nature (2018) 561:401–5. doi:10.1038/s41586-018-0479-2
9. Petridou NI, Grigolon S, Salbreux G, Hannezo E, Heisenberg C-P. Fluidization-mediated Tissue Spreading by Mitotic Cell Rounding and Non-canonical Wnt Signalling. Nat Cel Biol (2019) 21:169–78. doi:10.1038/s41556-018-0247-4
10. Farge E. Mechanotransduction in Development. Curr Top Dev Biol (2011) 95:243–65. doi:10.1016/B978-0-12-385065-2.00008-6
11. Kutejova E, Briscoe J, Kicheva A. Temporal Dynamics of Patterning by Morphogen Gradients. Curr Opin Genet Development (2009) 19:315–22. doi:10.1016/j.gde.2009.05.004
12. Meinhardt H. Models for the Generation and Interpretation of Gradients. Cold Spring Harbor Perspect Biol (2009) 1:a001362. doi:10.1101/cshperspect.a001362
13. Wartlick O, Kicheva A, González-Gaitán M. Morphogen Gradient Formation. Cold Spring Harb Perspect Biol (2009) 1:a001255. 10.1101/cshperspect.a001255.
14. Ladoux B, Mège R-M. Mechanobiology of Collective Cell Behaviours. Nat Rev Mol Cel Biol (2017) 18:743–57. doi:10.1038/nrm.2017.98
15. Mammoto T, Mammoto A, Ingber DE. Mechanobiology and Developmental Control. Annu Rev Cel Dev. Biol (2013) 29:27–61. doi:10.1146/annurev-cellbio-101512-122340
16. Heisenberg C-P, Bellaïche Y. Forces in Tissue Morphogenesis and Patterning. Cell (2013) 153:948–62. doi:10.1016/j.cell.2013.05.008
17. Barone V, Heisenberg C-P. Cell Adhesion in Embryo Morphogenesis. Curr Opin Cel Biol (2012) 24:148–53. doi:10.1016/j.ceb.2011.11.006
18. Foty RA, Steinberg MS. Differential Adhesion in Model Systems. Wires Dev Biol (2013) 2:631–45. doi:10.1002/wdev.104
19. Sadati M, Taheri Qazvini N, Krishnan R, Park CY, Fredberg JJ. Collective Migration and Cell Jamming. Differentiation (2013) 86:121–5. doi:10.1016/j.diff.2013.02.005
20. Nnetu KD, Knorr M, Käs J, Zink M. The Impact of Jamming on Boundaries of Collectively Moving Weak-Interacting Cells. New J Phys (2012) 14:115012. doi:10.1088/1367-2630/14/11/115012
21. Oswald L, Grosser S, Smith DM, Käs JA. Jamming Transitions in Cancer. J Phys D: Appl Phys (2017) 50:483001. doi:10.1088/1361-6463/aa8e83
22. Atia L, Bi D, Sharma Y, Mitchel JA, Gweon B, DeCamp SSJ, et al. Geometric Constraints during Epithelial Jamming. Nat Phys (2018) 14:613–20. doi:10.1038/s41567-018-0089-9
23. Petridou NI, Corominas-Murtra B, Heisenberg C-P, Hannezo E. Rigidity Percolation Uncovers a Structural Basis for Embryonic Tissue Phase Transitions. Cell (2021) 184:1914–28. doi:10.1016/j.cell.2021.02.017
24. O’Hern CS, Silbert LE, Liu AJ, Nagel SR. Jamming at Zero Temperature and Zero Applied Stress: The Epitome of Disorder. Phys Rev E (2003) 68:011306. doi:10.1103/PhysRevE.68.011306
25. Cates ME, Wittmer JP, Bouchaud J-P, Claudin P. Jamming, Force Chains, and Fragile Matter. Phys Rev Lett (1998) 81:1841–4. doi:10.1103/PhysRevLett.81.1841
26. Olsson P, Teitel S. Critical Scaling of Shear Viscosity at the Jamming Transition. Phys Rev Lett (2007) 99:178001. doi:10.1103/PhysRevLett.99.178001
27. Goyon J, Colin A, Ovarlez G, Ajdari A, Bocquet L. Spatial Cooperativity in Soft Glassy Flows. Nature (2008) 454:84–7. doi:10.1038/nature07026
28. Chen DTN, Wen Q, Janmey PA, Crocker JC, Yodh AG. Rheology of Soft Materials. Annu Rev Condens Matter Phys (2010) 1:301–22.
29. O'Hern CS, Langer SA, Liu AJ, Nagel SR. Random Packings of Frictionless Particles. Phys Rev Lett (2002) 88:075507. doi:10.1103/PhysRevLett.88.075507
30. Ellenbroek WG, Somfai E, van Hecke M, van Saarloos W. Critical Scaling in Linear Response of Frictionless Granular Packings Near Jamming. Phys Rev Lett (2006) 97:258001. doi:10.1103/PhysRevLett.97.258001
31. Majmudar TS, Sperl M, Luding S, Behringer RP. Jamming Transition in Granular Systems. Phys Rev Lett (2007) 98:058001. doi:10.1103/PhysRevLett.98.058001
32. Angelini TE, Hannezo E, Trepat X, Marquez M, Fredberg JJ, Weitz DA. Glass-like Dynamics of Collective Cell Migration. Proc Natl Acad Sci (2011) 108:4714–9. doi:10.1073/pnas.1010059108
33. Basan M, Elgeti J, Hannezo E, Rappel W-J, Levine H. Alignment of Cellular Motility Forces with Tissue Flow as a Mechanism for Efficient Wound Healing. Proc Natl Acad Sci (2013) 110:2452–9. doi:10.1073/pnas.1219937110
34. Garcia S, Hannezo E, Elgeti J, Joanny J-F, Silberzan P, Gov NS. Physics of Active Jamming during Collective Cellular Motion in a Monolayer. Proc Natl Acad Sci USA (2015) 112:15314–9. doi:10.1073/pnas.1510973112
35. Sepúlveda N, Petitjean L, Cochet O, Grasland-Mongrain E, Silberzan P, Hakim V. Collective Cell Motion in an Epithelial Sheet Can Be Quantitatively Described by a Stochastic Interacting Particle Model. Plos Comput Biol (2013) 9:e1002944–12. doi:10.1371/journal.pcbi.1002944
36. Bi D, Lopez JH, Schwarz JM, Manning ML. A Density-independent Rigidity Transition in Biological Tissues. Nat Phys (2015) 11:1074–9. doi:10.1038/nphys3471
37. Bi D, Yang X, Marchetti MC, Manning ML. Motility-driven Glass and Jamming Transitions in Biological Tissues. Phys Rev X (2016) 6. doi:10.1103/PhysRevX.6.021011
38. Merkel M, Manning ML. A Geometrically Controlled Rigidity Transition in a Model for Confluent 3d Tissues. New J Phys (2018) 20:022002. doi:10.1088/1367-2630/aaaa13
39. Yan L, Bi D. Multicellular Rosettes Drive Fluid-Solid Transition in Epithelial Tissues. Phys Rev X (2019) 9:011029. doi:10.1103/PhysRevX.9.011029
40. Jorjadze I, Pontani L-L, Newhall KA, Brujic J. Attractive Emulsion Droplets Probe the Phase Diagram of Jammed Granular Matter. Proc Natl Acad Sci (2011) 108:4286–91. doi:10.1073/pnas.1017716108
41. Trappe V, Prasad V, Cipelletti L, Segre PN, Weitz DA. Jamming Phase Diagram for Attractive Particles. Nature (2001) 411:772–5. doi:10.1038/35081021
42. Lois G, Blawzdziewicz J, O’Hern CS. Jamming Transition and New Percolation Universality Classes in Particulate Systems with Attraction. Phys Rev Lett (2008) 100:028001. doi:10.1103/PhysRevLett.100.028001
43. Koeze DJ, Tighe BP. Sticky Matters: Jamming and Rigid Cluster Statistics with Attractive Particle Interactions. Phys Rev Lett (2018) 121:188002. doi:10.1103/PhysRevLett.121.188002
44. Henkes S, van Hecke M, van Saarloos W. Critical Jamming of Frictional Grains in the Generalized Isostaticity Picture. Epl (2010) 90:14003. doi:10.1209/0295-5075/90/14003
45. Bécu L, Manneville S, Colin A. Yielding and Flow in Adhesive and Nonadhesive Concentrated Emulsions. Phys Rev Lett (2006) 96:138302. doi:10.1103/PhysRevLett.96.138302
46. Bibette J, Mason TG, Gang H, Weitz DA, Poulin P. Structure of Adhesive Emulsions. Langmuir (1993) 9:3352–6. doi:10.1021/la00036a006
47. Poulin P, Bibette J, Weitz DA. From Colloidal Aggregation to Spinodal Decomposition in Sticky Emulsions. Eur Phys J B (1999) 7:277–81. doi:10.1007/s100510050614
48. Datta SS, Gerrard DD, Rhodes TS, Mason TG, Weitz DA. Rheology of Attractive Emulsions. Phys Rev E (2011) 84:041404. doi:10.1103/PhysRevE.84.041404
49. Kim S, Pochitaloff M, Stooke-Vaughan GA, Campàs O. Embryonic Tissues as Active Foams. Nat Phys (2021) 17:859–66. doi:10.1038/s41567-021-01215-1
50. Boromand A, Signoriello A, Ye F, O’Hern CS, Shattuck MD. Jamming of Deformable Polygons. Phys Rev Lett (2018) 121:248003. doi:10.1103/PhysRevLett.121.248003
51. Boromand A, Signoriello A, Lowensohn J, Orellana CS, Weeks ER, Ye F, et al. The Role of Deformability in Determining the Structural and Mechanical Properties of Bubbles and Emulsions. Soft Matter (2019) 15:5854–65. doi:10.1039/C9SM00775J
52. Pontani L-L, Jorjadze I, Viasnoff V, Brujic J. Biomimetic Emulsions Reveal the Effect of Mechanical Forces on Cell-Cell Adhesion. Proc Natl Acad Sci (2012) 109:9839–44. doi:10.1073/pnas.1201499109
53. Pontani L-L, Jorjadze I, Brujic J. Cis and Trans Cooperativity of E-Cadherin Mediates Adhesion in Biomimetic Lipid Droplets. Biophysical J (2016) 110:391–9. doi:10.1016/j.bpj.2015.11.3514
54. Golovkova I, Montel L, Wandersman E, Bertrand T, Prevost AM, Pontani L-L. Depletion Attraction Impairs the Plasticity of Emulsions Flowing in a Constriction. Soft Matter (2020) 16:3294–302. doi:10.1039/c9sm02343g
55. Golovkova I, Montel L, Pan F, Wandersman E, Prevost AM, Bertrand T, et al. Adhesion as a Trigger of Droplet Polarization in Flowing Emulsions. Soft Matter (2021) 17:3820–8. doi:10.1039/D1SM00097G
56. Pawlizak S, Fritsch AW, Grosser S, Ahrens D, Thalheim T, Riedel S, et al. Testing the Differential Adhesion Hypothesis across the Epithelial−mesenchymal Transition. New J Phys (2015) 17:083049. doi:10.1088/1367-2630/17/8/083049
57. Feng L, Pontani L-L, Dreyfus R, Chaikin P, Brujic J. Specificity, Flexibility and Valence of Dna Bonds Guide Emulsion Architecture. Soft Matter (2013) 9:9816. doi:10.1039/c3sm51586a
58. Berg S, Kutra D, Kroeger T, Straehle CN, Kausler BX, Haubold C, et al. Ilastik: Interactive Machine Learning for (Bio)image Analysis. Nat Methods (2019) 16:1226–32. doi:10.1038/s41592-019-0582-9
59. Tremeau A, Colantoni P. Regions Adjacency Graph Applied to Color Image Segmentation. IEEE Trans Image Process (2000) 9:735–44. 10.1109/83.841950.
60. Van der Walt S, Schönberger JL, Nunez-Iglesias J, Boulogne F, Warner JD, Yager N, et al. Scikit-Image: Image Processing in python. PeerJ (2014) 2:e453. doi:10.7717/peerj.453
61. Harris CG, Stephens M. A Combined Corner and Edge Detector. Alvey Vis Conf (Citeseer) (1988) 15:10–5244. doi:10.5244/c.2.23
62. Rogers WB. A Mean-Field Model of Linker-Mediated Colloidal Interactions. J Chem Phys (2020) 153:124901. doi:10.1063/5.0020578
63. van Hecke M. Jamming of Soft Particles: Geometry, Mechanics, Scaling and Isostaticity. J Phys Condens Matter (2009) 22:033101. doi:10.1088/0953-8984/22/3/033101
64. Mason TG, Bibette J, Weitz DA. Elasticity of Compressed Emulsions. Phys Rev Lett (1995) 75:2051–4. doi:10.1103/PhysRevLett.75.2051
65. Liu AJ, Nagel SR. The Jamming Transition and the Marginally Jammed Solid. Annu Rev Condens Matter Phys (2010) 1:347–69.
66. Maxwell JC. L. On the Calculation of the Equilibrium and Stiffness of Frames. Lond Edinb Dublin Philosophical Mag J Sci (1864) 27:294–9. doi:10.1080/14786446408643668
67. Clusel M, Corwin EI, Siemens AON, Brujić J. A 'granocentric' Model for Random Packing of Jammed Emulsions. Nature (2009) 460:611–5. doi:10.1038/nature08158
68. Corwin EI, Clusel M, Siemens AON, Brujić J. Model for Random Packing of Polydisperse Frictionless Spheres. Soft Matter (2010) 6:2949–59. doi:10.1039/C000984A
69. Newhall KA, Jorjadze I, Vanden-Eijnden E, Brujic J. A Statistical Mechanics Framework Captures the Packing of Monodisperse Particles. Soft Matter (2011) 7:11518–25. doi:10.1039/C1SM06243C
70. Miklius MP, Hilgenfeldt S. Analytical Results for Size-Topology Correlations in 2d Disk and Cellular Packings. Phys Rev Lett (2012) 108:015502. doi:10.1103/PhysRevLett.108.015502
71. Newhall KA, Pontani LL, Jorjadze I, Hilgenfeldt S, Brujic J. Size-topology Relations in Packings of Grains, Emulsions, Foams, and Biological Cells. Phys Rev Lett (2012) 108:268001. doi:10.1103/PhysRevLett.108.268001
72. Walker SA, Chiruvolu S, Zasadzinski JA, Schmitt F-J, Israelachvlli JN. Controlled Multi-Stage Self-Assembly of Vesicles. MRS Proc (1994) 372:95–100. doi:10.1557/proc-372-95
73. General IJ, Dragomirova R, Meirovitch H. Absolute Free Energy of Binding of Avidin/Biotin, Revisited. J Phys Chem B (2012) 116:6628–36. doi:10.1021/JP212276M
74. Steinhardt PJ, Nelson DR, Ronchetti M. Bond-orientational Order in Liquids and Glasses. Phys Rev B (1983) 28:784–805. doi:10.1103/PhysRevB.28.784
75. Schreck CF, O'Hern CS, Silbert LE. Tuning Jammed Frictionless Disk Packings from Isostatic to Hyperstatic. Phys Rev E Stat Nonlin Soft Matter Phys (2011) 84:011305
76. Maître J-L, Berthoumieux H, Krens SFG, Salbreux G, Jülicher F, Paluch E, et al. Adhesion Functions in Cell Sorting by Mechanically Coupling the Cortices of Adhering Cells. Science (2012) 338:253–6. doi:10.1126/science.1225399
77. Miyaguchi K.Ultrastructure of the Zonula Adherens Revealed by Rapid-Freeze Deep-Etching. J Struct Biol (2000) 132:169–78. doi:10.1006/JSBI.2000.4244
78. Dreyfus R, Leunissen ME, Sha R, Tkachenko AV, Seeman NC, Pine DJ, et al. Simple Quantitative Model for the Reversible Association of Dna Coated Colloids. Phys Rev Lett (2009) 102:048301. doi:10.1103/PhysRevLett.102.048301
79. Leckband D, Prakasam A. Mechanism and Dynamics of Cadherin Adhesion. Annu Rev Biomed Eng (2006) 8:259–87. doi:10.1146/annurev.bioeng.8.061505.095753
80. Gai Y, Leong CM, Cai W, Tang SKY. Spatiotemporal Periodicity of Dislocation Dynamics in a Two-Dimensional Microfluidic crystal Flowing in a Tapered Channel. Proc Natl Acad Sci USA (2016) 113:12082–7. doi:10.1073/pnas.1606601113
81. Zaiser M. Scale Invariance in Plastic Flow of Crystalline Solids. Adv Phys (2006) 55:185–245. doi:10.1080/00018730600583514
Keywords: viscoelasticity, biomimetic emulsions, adhesion, biological tissues, deformation, percolation, topology
Citation: Montel L, Golovkova I, Grigolon S, Wandersman E, Prevost AM, Bertrand T and Pontani L-L (2021) Adhesion Percolation Determines Global Deformation Behavior in Biomimetic Emulsions. Front. Phys. 9:744006. doi: 10.3389/fphy.2021.744006
Received: 19 July 2021; Accepted: 07 September 2021;
Published: 22 September 2021.
Edited by:
Jose J Munoz, Universitat Politecnica de Catalunya, SpainReviewed by:
Francois Sicard, University College London, United KingdomMorgan Chabanon, CentraleSupélec, France
Copyright © 2021 Montel, Golovkova, Grigolon, Wandersman, Prevost, Bertrand and Pontani. This is an open-access article distributed under the terms of the Creative Commons Attribution License (CC BY). The use, distribution or reproduction in other forums is permitted, provided the original author(s) and the copyright owner(s) are credited and that the original publication in this journal is cited, in accordance with accepted academic practice. No use, distribution or reproduction is permitted which does not comply with these terms.
*Correspondence: Lea-Laetitia Pontani, lea-laetitia.pontani@sorbonne-universite.fr; Thibault Bertrand, t.bertrand@imperial.ac.uk