
Feature Selection and Ensemble-Based Intrusion Detection System: An Efficient and Comprehensive Approach


1
College of Computer Science and Technology, Guizhou University (GZU), Guiyang 550025, China
2
School of Information Communication and Technology, University of The Gambia (UTG), Banjul, Peace Building, Kanifing P.O. Box 3530, The Gambia
*
Author to whom correspondence should be addressed.
Symmetry 2021, 13(10), 1764; https://doi.org/10.3390/sym13101764
Submission received: 16 August 2021
/
Revised: 12 September 2021
/
Accepted: 15 September 2021
/
Published: 22 September 2021
(This article belongs to the Special Issue Information Technologies and Electronics Ⅱ)
Abstract
:The emergence of ground-breaking technologies such as artificial intelligence, cloud computing, big data powered by the Internet, and its highly valued real-world applications consisting of symmetric and asymmetric data distributions, has significantly changed our lives in many positive aspects. However, it equally comes with the current catastrophic daily escalating cyberattacks. Thus, raising the need for researchers to harness the innovative strengths of machine learning to design and implement intrusion detection systems (IDSs) to help mitigate these unfortunate cyber threats. Nevertheless, trustworthy and effective IDSs is a challenge due to low accuracy engendered by vast, irrelevant, and redundant features; inept detection of all types of novel attacks by individual machine learning classifiers; costly and faulty use of labeled training datasets cum significant false alarm rates (FAR) and the excessive model building and testing time. Therefore, this paper proposed a promising hybrid feature selection (HFS) with an ensemble classifier, which efficiently selects relevant features and provides consistent attack classification. Initially, we harness the various strengths of CfsSubsetEval, genetic search, and a rule-based engine to effectively select subsets of features with high correlation, which considerably reduced the model complexity and enhanced the generalization of learning algorithms, both of which are symmetry learning attributes. Moreover, using a voting method and average of probabilities, we present an ensemble classifier that used K-means, One-Class SVM, DBSCAN, and Expectation-Maximization, abbreviated (KODE) as an enhanced classifier that consistently classifies the asymmetric probability distributions between malicious and normal instances. HFS-KODE achieves remarkable results using 10-fold cross-validation, CIC-IDS2017, NSL-KDD, and UNSW-NB15 datasets and various metrics. For example, it outclassed all the selected individual classification methods, cutting-edge feature selection, and some current IDSs techniques with an excellent performance accuracy of 99.99%, 99.73%, and 99.997%, and a detection rate of 99.75%, 96.64%, and 99.93% for CIC-IDS2017, NSL-KDD, and UNSW-NB15, respectively based on only 11, 8, 13 selected relevant features from the above datasets. Finally, considering the drastically reduced FAR and time, coupled with no need for labeled datasets, it is self-evident that HFS-KODE proves to have a remarkable performance compared to many current approaches.
1. Introduction
The wide-scale adoption of cutting-edge technologies such as big data, the Internet of Things (IoT), and the elastic computing and storage resource of cloud computing has led to the world witnessing data deluge, meaning the simultaneous massive data generation by humans and IoT [1]. Consequently, changing society and the world of business in many aspects. According to McKinsey in reference [2], the competitive edge in the global market is currently driven by harnessing efficient and productive big data and cutting-edge technologies. Therefore, making these infrastructures not only attracts attention from the government and the business industries, but also from illegal attempts to access these sensitive and valuable data. However, these valuables data are generally partial in many big data and real-world applications, categorized into asymmetric and symmetric data distributions. For instance, the symmetric relationships among the data of social networks and the asymmetric probability distribution of malicious and regular network traffic. Regardless of the missing information within these real-world applications, there are still rich hidden patterns and knowledge. Therefore, establishing an efficient and effective means of filtering these valuable patterns is significant [3].
Likewise, the growing dependency on the internet and its facilities have led to a persistent risk against computer systems and networks [4]. For instance, various kinds of cyber-attacks have evolved dramatically since the inception of the internet and the rapid rise of revolutionary technologies. Irrespective of the tireless efforts of security experts in terms of defense mechanisms, hackers have always found ways to get away with targeted resources from valuable and most trusted sources worldwide by launching versatile, sophisticated, and automated cyber-attacks. As a result, causing tremendous havoc to governments, businesses, and even individuals [5]. For instance, the authors of [6] fascinatingly present a summary of various cyber-attacks and their consequences. Firstly, the paper highlights the forecast of six trillion US dollars of cyber-crimes by 2021 and the various global cutting-edge cyber-crimes that could lead to the loss of one billion US dollars globally. Finally, a whopping 1.5 trillion US dollars of cyberattack revenues resulting from two to five million computers compromised daily.
Subsequently, the last few decades have witnessed the increasing popularity of Intrusion Detection Systems (IDSs) as a result of its inherent ability to detect an intrusion in real-time [4,7]. For instance, the authors of [8] provided a meaningful overview of the worth of security properties in monitoring cloud computing platforms. Additionally, they proposed a novel, intelligent, and effective three-level cloud-based IDS that used rules to represent Event Calculus’s specification and monitoring properties. Furthermore, the proposed approach used the virtualization architecture to focus on the supervision of applications during runtime and support these applications’ automatic reconfigurations. Finally, the paper claimed to have improved the security of cloud-based computing significantly.
According to the authors of [9], “Intrusion Detection is the process of monitoring the events occurring in a computer system or network, and analyzing them for signs of intrusion”, moreover, they define an intrusion as an attempt to bypass the security mechanisms of a network or a computer system, and then compromising the Confidentiality, Integrity, and Availability (CIA). Finally, the authors of [10,11] define an IDS as a piece of hardware or software program that monitors diverse malicious activities within computer systems and networks based on network packets, network flow, system logs, and rootkit analysis. The detailed roles and functionalities of a standard intrusion detection system are found in reference [12].
There are two main approaches to detecting intrusions within computer systems or networks: misused detection (knowledge or signature-based) and anomaly-based approaches. Nevertheless, the past decade has witnessed the rapid rise of the hybrid-based technique, which typically exploits the advantages of the two methods mentioned above to yield a more robust and effective system [13].
In summary, a Misused Intrusion Detection System (MIDS) is an approach where a set of specific signatures of well-known attacks are stored and eventually mapped with real-time network events to detect an intrusion or intrusive activities. MIDS usually gives excellent detection accuracy, particularly for previously known intrusions. Nonetheless, this approach is questionable due to its inability to detect novel attacks and requires more extended time to analyze and process the massive volume of data in the signature database [14,15,16]. The authors of [17] proposed an exceptional signature-based intrusion detection system that effectively enhanced the detection rate of SQL injections within a database. Moreover, this approach significantly lessens the throughput in the signature database by only extracting patterns with suspicious content. Nonetheless, it is only designed for database intrusion and cannot be generalized as a misused intrusion detection for a classical network environment with various behavior and functionalities.
In contrast, the main design idea of anomaly-based IDSs is to outline and represent the usual and expected standard behavior profile through observing activities and then defining anomalous activities by their degree of deviation from the standard behavior profile. Moreover, this approach can strongly generalize and detect new attacks such as the zero-day attack [18]. However, many false alarm rates resulting from the changing cyber-attack landscape are among the most profound challenges [19]. The authors of [20] intelligently used logistic regression, decision tree, and gradient boosting to propose an optimized and effective anomaly-based ensemble classifier. They evaluate their model using the original 80 features of the CSE-CIC-IDS2018 dataset, with 80% for the training phase and the remaining 20% for testing the model. Moreover, they utilized chi-square with Spearman’s rank correlation to efficiently select the most relevant 23 features from the original features, demonstrating impressive results of 98.8% accuracy, 98.8%, 97.1%, and 97.9% of precision, recall, and F1-score, respectively.
Furthermore, irrespective of the phenomenal achievements of researchers and professionals in mitigating the escalating security challenges through IDSs, the challenges of improving the detection rate, accuracy, detection of novel attacks, and reducing false alarm rates are still issues yet to be addressed in the research domain of IDSs. Moreover, the mind-blowing complexity of the present cutting-edge networks has challenged the detection capability of many existing IDSs [21]. Consequently, the past years have seen many researchers and professionals exploit the novelty of machine learning techniques to address the problems mentioned earlier by designing, developing, and deploying effective and efficient IDSs [11]. Additionally, ML approaches can have strong generalizability and strongly discover the critical differences between normal and abnormal data with very high accuracy [9,11].
Machine learning is a flourishing AI technique that has the features of automatically learning valuable information from massive datasets. In addition, with adequate training datasets, machine learning-based IDSs can achieve pleasing detection results and good generalization, [7,11]. On the same note, supervised and unsupervised learning are the two leading machine learning models researchers and the industry commonly use in designing and developing IDSs.
Firstly, supervised learning is the concept of discovering valuable information from labeled datasets. Nevertheless, the need to manually label datasets is time-consuming, error-prone, and equally expensive. Therefore, making it difficult to acquire enough training datasets for such models, which seriously hinders the large-scale adoption and implementation of supervised learning-based IDSs [22]. However, they have very high detection accuracy for known attacks. Interestingly, unsupervised machine learning does not need to rely on labeled datasets because it can extract valuable information from unlabeled datasets without human intervention, making training data more accessible than the supervised models [11].
Given the prospective applications of machine learning approaches in developing efficient and robust IDSs without the need for label data or any prior knowledge of a given network environment. Clustering algorithms such as K-means and DBSCAN attract significant research interest to mitigate the shortcomings of processing massive complex unlabeled datasets. Consequently, improving the detection accuracy and substantially reduces the significant false alarm rate of existing IDSs [21]. For example, the authors of [23] used a classical machine learning approach to implement a novel semi-supervised anomaly detection system. They used the prominent K-means algorithm, which enables them to differentiate the standard samples into a unique cluster during the training phase. The threshold value was calculated based on the above results, which serve as the main factor in distinguishing the proposed system’s normal and abnormal samples. Aside from that, the proposed method effectively determined anomalies due to the clusters’ center’s distance being more than the calculated threshold value. Finally, the authors attained an 80.119% detection accuracy rate while testing their proposed system’s efficiency with the NSL-KDD dataset.
Nevertheless, the existing literature has argued that the single weak learners and the uneven data distribution of the regular and malicious traffics within networks and computer systems have severely hindered the original idea of machine learning application in the research of IDSs [15]. Thus, the past years have seen researchers harnessing the potentials of ensemble classifiers in IDSs. It is an innovative approach to combining various individual classifiers into a unified intelligent classifier using bagging, boosting, stacking, with majority voting for classification problems, and weighted averaging for regression [24]. The authors of [25] utilizes a collection of small neural networks (autoencoders) to propose a unique and fascinating plug-and-play NIDS named Kitsune, powered by an anomaly detection engine called KitNET. To address the challenges of neural networks, such as the need for computational resources and labeled datasets, the authors systematically combine collections of autoencoders as an ensemble, which effectively and efficiently differentiate between malicious and regular network traffics. Moreover, the proposed approach is suitable for online and offline modes with acceptable performance on lightweight devices such as Raspberry Pi. The authors claimed Kitsune could accurately detect numerous attacks compare to many offline IDS, thereby qualifying it to serve as an economical and practical IDS among current cutting-edge IDSs.
Similarly, to address the high computational challenges for memory and storage. Researchers have been equally studying feature selection, which constitutes selecting highly relevant features of the vast datasets and removing the irrelevant features that lead to unnecessary computational cost and poor performance of IDSs. For example, the misclassification of attacks resulting from high bias and variance in machine learning models [15]. Likewise, the authors of [26] presents an innovative and practical approach to feature reduction using an IDS consisting of support vector machines, Random Forest (RF), Naive Bayes, and KNN. The authors efficiently used principal component analysis (PCA) and recursive feature elimination (RFE) techniques for the feature reduction phase. They created various subsets of selected features like 11, 12, 13, and 15 and compared them with the original 41 features for evaluating the proposed method. They claimed to have achieved promising results with the feature reduction with RF achieving the best results for the Denial of Service (DoS) attack, such as accuracy of 99.63%, f1-score of 99.58%, a recall of 99.6%, and 99.53% precision.
Finally, the existing literature has justified that researchers have attained incredible progress in improving the detection accuracy of IDSs with fewer FAR rates through the studies and applications of ensemble classifiers and feature selection. However, according to the authors’ knowledge, there are no studies that provide comprehensive experiments of the capabilities of an unsupervised clustering-based ensemble IDSs classifier that constitutes K-means, One-Class SVM, DBSCAN, and Expectation-Maximization, abbreviated (KODE) with detailed comparative analysis using current IDS datasets such as CIC-IDS2017, UNSW-NB15, and NSL-KDD. Furthermore, the proposed system provides an effective and trustworthy hybrid feature selection approach abbreviated HFS, which efficiently selects relevant features among the imbalance and countless instances of the various benchmark datasets to enable a timely, effective, and reliable classification of attacks. It is important to note that our objective of using these two approaches together is to target symmetry, meaning both approaches are crucially significant and mutually played a great role in addressing the challenges of intrusion detection and prevention [27]. The following are an overview of the main contributions of this research work:
- The authors proposed an efficient and reliable feature selection approach that incorporates genetic search technique, rule-based engine, and CfsSubsetEval, which effectively selects the relevant features for increasing the performance of models.
- The authors proposed a comprehensive and practical ensemble approach that combines the above four mentioned algorithms as an ensemble classifier.
- A comprehensive comparative analysis using various current IDS datasets, which consequently yields yet an accurate, reliable, and efficient IDS.
- The proposed system outshines its equivalent systems using various evaluation metrics on three current IDS datasets: NSL-KDD, UNSW-NB15, and CIC-IDS2017.
- Finally, the proposed approach has recorded negligible FAR, MBT, and MTT compared to many current studies and equally solves the low detection challenge of the UNSW-NB15 dataset discussed in subsequent sections.
The rest of the paper’s organization is as follows: Section 2 discusses some important background concepts. Section 3 presents a review of the related works. Similarly, Section 4 explains the materials and methods of the proposed system. Section 5 highlights the results and discussions of the proposed approach. Finally, the paper concludes in Section 6.
2. Fundamental Concepts
This section summarized the necessary concepts utilized in this research work, which will provide readers with the essential facts to understand this research and similar works better.
2.1. Ensemble Learning
Ensemble learning is a rapidly rising innovative machine learning technique that utilizes multiple weak learners to yield a higher predictive classifier than single machine learning models for a given problem. The primary objective of ensemble learning is to improve the detection accuracy and lower the false alarm rates of predictive classifiers by combining the strengths and capabilities of various weak learners to achieve a robust, efficient, and effective classifier [6,15,28]. Moreover, ensemble methods seek to create a set of hypotheses or learners and combine them to solve a given problem compared to conventional machine learning techniques, attempting to learn a single hypothesis from the training data [29].
The critical potential of ensemble learning is splitting a single problem into components that could be assigned to the various modules of the ensemble learner with different sets of features and algorithms to identify different types of attacks. There may be multiple machine learning algorithms in each module, depending on the adopted ensemble approach. It does not require excellent performance by every learner, but somewhat better than random guessing [30]. This approach has proven to be very effective and efficient in designing and developing IDSs. It is self-evident that a single intrusion detection system cannot cover all types of input data or detect all types of attacks. Therefore, different weak learners are employed to identify diverse kinds of attacks. However, the significant problem with ensemble approaches is choosing the correct way to integrate suitable individual classifiers and the decision function to combine the selected algorithms’ outcomes [28]. The three most popular combination schemes of ensemble learning are bagging, boosting, stacking in the form of weighted averaging for regression, and majority voting for classification problems [30]. However, this paper will only provide a brief description of these common combination methods.
Synopsis of Bagging, Boosting and Stacking
Firstly, reference [31] is believed to have first proposed the concept of bagging. The authors intelligently used random draw with replacement to create several samples of the training dataset and train various models, and averaged their score with the ensemble technique of voting. Bagging is one of the most straightforward yet effective and robust ensemble techniques [32]. The bagging procedure operates on the concept of bootstrapping and aggregation. It utilizes the bootstrap sampling method to generate multiple versions of N samples with replacements from the original N training dataset to guarantee a well-balanced training dataset for the selected weak learners. Similarly, an optimized, efficient, and effective final model is obtained by aggregating the base learners and using majority voting to choose the most occurrence among the classification results of the various weak learners as the final classification, thereby leading to improved performance compared to the traditional machine learning approach [32,33,34]. Furthermore, the bagging technique has significantly mitigated the challenges associated with the massive number of instances in IDS datasets with a high dimensional nature [30]. Reference [33] entails the comprehensive details of the bagging approach, such as the algorithm and other relevant information.
Secondly, boosting is a sequential ensemble method in which the first weak learner constructed from an entire training dataset complements the next weak learners for improved results. The fundamental idea is assigning weights to samples in the training sets based on the classification results, such as giving small weights to correctly classified samples and large weights to wrongly classified instances [32]. Then the following weak classifiers are trained based on the previous weak learner’s output for an improved final model. This sequential procedure continues until the final improved model is obtained. Finally, the involved weak learners’ parameters are determined by decreasing the loss function imposed by the previous model on the training dataset [30].
Additionally, the concept of increasing the weights of the misclassified instances is to improve their probability of appearing for the next weak learner. In contrast, the correctly classified instances have a lower likelihood of appearing in the training dataset, which goes a long way in augmenting the subsequent weak learners’ performance [32]. However, boosting could become computationally expensive to fit various complex models sequentially, unlike the bagging approach. Consult reference [33] for an inclusive detail of the boosting method.
Finally, in contrast to boosting and bagging, stacking is a reliable yet straightforward ensemble method of aggregating several heterogeneous weak learners like the Random Forest, neural networks, logistic regression, and support vector machines in a two-tier procedure. For instance, the base learner (based models) and the meta learner (meta-model) stages [35,36]. The stacked generalization-based learner level enables the aggregation of varied weak learners to learn from a k-fold training dataset and construct N number of classifiers for classifications.
In contrast, the meta learner level utilizes the base models’ results as a new training dataset to produce a final improved output [14]. For example, suppose we wished to build a staking ensemble of N number of weak learners, the following steps can be followed: Firstly, we can split the training data into two-fold. Secondly, fit the N weak learners with the first-fold of the training dataset, observe the N weak learners’ predictions, and finally used these predictions as input during the fitting of the meta-level model on the second-fold training dataset. However, complex meta learner models are among the leading cause of overfitting challenges. Therefore, favoring linear regression and other naiver models as meta learners [30,33].
2.2. Feature Selection
The exponential evolution of the innovative Internet applications and related technologies has led to the substantial accumulation of unbalanced and high dimensional data at a high velocity, significantly challenging traditional machine learning approaches [37]. As a result, feature selection over the last decade has been practically and theoretically demonstrated to be very effective in processing unbalanced and high dimensional data of various research domains, especially in IDSs [15,28,33,38], thereby leading to improved performance of IDSs classifiers [29].
Feature selection is a core machine learning concept that uses specific selection measures to manually or automatically choose relevant subsets among the massive irrelevant and redundant features of an originally given dataset with less computational overhead and high training accuracy without negatively affecting the classification accuracy [39].
The feature selection process plays a significant role in addressing colossal pre-processing challenges, model building, training, evaluations, and interpretation, as shown in Figure 1. For example, reducing the model complexity, thus strictly minimizing the computational cost. Secondly, an improved classifier performance as a result of efficiently minimizing the negative consequences of the curse of dimensionality. Additionally, it also facilitates the provision of a low dimensional and well-balanced dataset input, thereby significantly minimizing overfitting, reducing the time of model training, improving the training accuracy, and enhancing the straightforward interpretation of the learning results [40].
According to the authors of [41,42,43], the algorithms of feature selections can be categorized into unsupervised, semi-supervised, and supervised feature selection approaches. The commonly used feature selection methods are filter, wrapper, and embedded. The core concept of supervised feature selection is utilizing the correlation and relevance among features and classes to select important feature subsets. In contrast, unsupervised feature selection is driven by the fundamental concept of choosing a significant feature subset without a target variable but instead uses evaluation criteria and clustering to improve the accuracy [37].
Moreover, the four basic steps of a standard feature selection method are: subset generation, subset evaluation, stopping criteria, and validation procedure. Firstly, a specified search strategy will be utilized to select a possible feature subset, evaluated based on a particular evaluation measure. Then based on the stopping conditions, the feature subset that fully corresponds to the chosen evaluation benchmark is selected as the relevant features, which can be endorsed by a validation dataset or a domain expert [44].
Summary of Filter, Wrapper and Embedded Models
The filter method is a fast, effective, and scalable technique of distinguishing the model training bias from the feature selection algorithm, enabling the reliable selection of only relevant features based on a given dataset’s essential properties using a calculated score. The calculated score helps retain features with a high score and discard those with a low score [45]. The two main deterministic evaluation techniques of classical feature selection algorithms are the multivariate and univariate. The two main conventional steps of a filter algorithm are using a particular criterion to rank features and training a classification model with the highest-ranking feature. The leading performance criteria are mutual information-based methods, ReliefF of algorithms, and Fisher score [46,47,48].
Algorithm 1, depicts the generalized filter algorithm, which illustrates the necessary steps of efficiently choosing relevant features of a given dataset. Interested readers can refer to reference [49] for detailed information.
| Algorithm 1 A Classical Filter Algorithm |
| Input: D (F0, F1, …, Fn−1) // A training dataset of N features |
| So // A specified starting subset for the search of an optimal subset |
| Ω // A specified stopping condition |
| Output Sbest // A desired optimal subset |
| 01 begin |
| 02 Initialize: Sbest = So; |
| 03 λbest = eval (So, D, α); // So is evaluated Using an Independent Measure α |
| 04 do begin |
| 05 S = generate (D); // Generate a subset for evaluation |
| 06 λ = eval (S, D, α); // Evaluating the current generated subset S by α |
| 07 if (λ is better than λbest); |
| 08 λbest = λ; |
| 09 Sbest = S; |
| 10 end until (Ω is reached or fulfilled); |
| 11 return Sbest |
| 12 end; |
Moreover, wrapper methods use the model prediction accuracy, which is initially trained on a training set to select the best feature subsets by evaluating the best performance of various potential feature subsets to alleviate the substantial disadvantages of the filter method, such as disregarding the effects of the chosen feature subset on a particular classifier’s performance [50]. Nonetheless, the selection of optimal feature subset based on classifier performance comes with some benefits and drawbacks. For instance, the assurance that selected features from the wrapper techniques is reliable with good classification strengths. However, a low model prediction accuracy cannot be guaranteed the same.
Furthermore, the accurate predictions of wrapper methods come with the need for more computational resources. Moreover, a standard wrapper method performs the following basic three steps given a predetermined classifier model: firstly, the search of a subset of features, then utilizing the performance of the classifier to evaluate the selected subsets of features, and finally repeating the above two steps until a preferred optimal feature subset is obtained [51]. Genetic algorithm (GA) and recursive feature elimination (RFE) are some of the well-known wrapper techniques [52].
Algorithm 2, represents a classical wrapper algorithm. Interested readers can refer to reference [49] for more information.
| Algorithm 2 A Classical Wrapper Algorithm |
| Input: D (F0, F1, …, Fn−1) // A training dataset of N features |
| So // A specified starting subset for the search of an optimal subset |
| Ω // A specified stopping condition |
| Output Sbest // A desired optimal subset |
| 01 begin |
| 02 Initialize: Sbest = So; |
| 03 λbest = eval (So, D, Ψ); // So is evaluated Using a Specified Algorithm Ψ |
| 04 do begin |
| 05 S = generate (D); // Generate a subset for evaluation |
| 06 λ = eval (S, D, Ψ); // Evaluating the current generated subset S by algorithm Ψ |
| 07 if (λ is better than λbest); |
| 08 λbest = λ; |
| 09 Sbest = S; |
| 10 end until (Ω is reached or fulfilled); |
| 11 return Sbest |
| 12 end; |
The embedded method is an accurate and efficient approach proposed to mitigate the challenges of the filter and wSrapper method. It exploits the advantages of both techniques mentioned earlier, such as selecting an optimal subset with the highest classification accuracy and retaining the computational efficiency of the filter method. However, it necessitates using a parameter that defines the cut-off score for the measured scores of the features. Additionally, in this approach, both the optimal feature selection and the fitting of the model occur concurrently. The features with the classification model’s high score are kept, and those with a low score are discarded, like the wrapper method [49].
However, it has a lower computational cost because the model fitting is done at once to determine these scores instead of the iterative nature of the wrapper model [49]. Finally, the most common embedded approaches are the models with integrated feature selection such as C4.5 and ID3 [53] and objective function-based regularization models that enforced the coefficient to be a small value or exactly zero while minimizing the fitting error. As a result, usually leading to improved performances and drawing growing consideration over the past years [54]. Interested readers can refer to reference [49] for details of the algorithm.
3. Related Works
Based on existing literature, specifically IDC Cybersecurity Spending Guide 2019, the global expenditure on security for 2022 might exceed 133.8 billion US dollars. Similarly, while security experts continue to architect cutting-edge security solutions, the intruders also continue engineering more innovative attacks. Therefore, to address these security challenges, the past years have seen the massive adoption of machine learning techniques in designing and implementing IDSs. It has achieved great success due to the considerable amount of publicly available datasets and the various cutting-edge machine learning [55]. As a result, the following sections discuss some of the most remarkable works in the various ensemble and feature selection approaches.
First of all, the authors of [56] proposed an approach that concentrated on exploiting various feature selection methods such as IG, correlation, relief, and symmetrical uncertainty, which enables the extraction of the relevant features from NSL-KDD datasets. They used extracted features to build different decision tree models, out of which C4.5 combined with IG and symmetrical uncertainty, records the best accuracy of 99.68% and 99.64% with only 17 and 11 selected features, respectively.
Additionally, the authors of [57] proposed a classifier with low false positives and a more significant classification accuracy using an intelligent bagging ensemble and feature selection approach. They used the genetic algorithm to reduce the NSL-KDD dataset to only 15 relevant features and used the Partial Decision Tree (PART) algorithm as a base classifier. They used the 10-fold cross-validation to evaluate their model and claimed an agreeable classification accuracy of 99.7166%. However, the same system only achieved 78.3712% on the test datasets, with C4.5 recording the best performance. Similarly, they concluded that the model build time was significant, thereby not feasible for real-life network environments.
The authors of [34] present a bagging ensemble method to address the significant model building time of reference [57], but with a REPTree base classifier. They claimed to have achieved less model building time with a lower false positive. However, they recorded a lower accuracy of 99.67% on the 10-fold cross-validations but a better accuracy of 81.29% on the test dataset.
The authors of [58] use ensemble methods such as stacking, bagging, and boosting to mitigate the high false alarm rates and enhance the detection rate of the system proposed in reference [32]. The proposed ensemble method used artificial neural networks, decision trees, Naïve Bayes, rule induction, k-nearest neighbor, and genetic algorithms. They claimed to achieve an accuracy of 99% in detecting known attacks. However, it could only achieve 60% detection accuracy for novel attacks with the longest execution time.
Furthermore, the authors of [59] present an insightful ensemble model that constitutes various base classifiers such as Naive Bayes, Partial Decision List (PART), J48, and C5.0. They claimed exciting findings, for example, better accuracy for J48, C5.0, Naïve Bayes, and PART. In conclusion, the paper claimed to have observed the most accurate results when J48, Naïve Bayes, and PART classifiers were combined.
Moreover, the authors of [50] presented a promising approach, including a preprocessing stage that efficiently selects the ideal features subsets of the KDD99 and UNSW-NB15 datasets. In addition, the paper uses a genetic algorithm search strategy and a logistic regression learner-based wrapper approach for feature selection, selecting the best features by maximizing classification accuracy and minimizing the number of features. Finally, they utilize C4.5, NBTree, and the Random Forest algorithm on relevant feature subsets as an enhanced classifier. As a result, they claimed encouraging results of 99.90% accuracy, a detection rate of 99.81%, a false alarm rate of 0.105%, and a detection rate of 99.98% for denial of service attack with only 18 features of the KDD99 dataset. Moreover, the paper claimed a reasonable classification accuracy and a FAR of 6.39% for the UNSW-NB15 dataset. Lastly, the authors highlight the complexity of the UNSW-NB15 dataset and recommend more research on various approaches to improve its classification accuracy, which has been achieved in this paper.
Equally, the authors of [60] proposed a system that minimizes the model building time and dataset complexity. It uses IG to select related features for each available attack and combine the different obtained features used during the classification stage. They evaluated their models using the test dataset and claimed to achieve better results when the PART and Random forest classifiers are used with the product probability rule.
The authors of [15] proposed an intelligent and efficient feature selection using correlation-based feature selection (CFS) and an ensemble classifier of C4.5, Random Forest (RF), and Forest by Penalizing Attributes (Forest PA) algorithms. They used the voting method to aggregate the probability distributions of the base classifiers for attack classification. The authors evaluated the CFS-BA-ensemble technique on three different datasets: NSL-KDD, Aegean WiFi Intrusion Dataset (AWID), CIC-IDS2017 dataset, and they claimed to have outperformed many related cutting-edge approaches. In summary, using 10-fold cross-validation, the proposed ensemble approach claimed a performance accuracy of 99.8%, 0.1% FAR, and 36.28 s model building time for the NSL-KDD. Likewise, an accuracy of 99.9% and 99.5%, and a model-building time of 92.62, and 98.42 s for the AWID and CIC-IDS2017, respectively. Finally, they performed various statistical and detailed comparative analyses.
Furthermore, the authors of [28] produced a novel trustworthy dataset named Game Theory and Cyber Security (GTCS) with 83 attributes and a labeled class of normal or attack that helps to mitigate the current IDS dataset challenges and simulate negligible attacks like botnet, infiltration, DDoS, and brute force. The authors use the InfoGainAttributeEval algorithm with Ranker to simply the novel dataset, then evaluated it with an enhanced ensemble based on multiple classifiers with different Hyperparameter optimization to address the current accuracy and FAR challenges. The ensemble classifier uses the majority voting technique to combine the prediction of the best three classifiers, like J48, IBK, and MLP. The authors used 10-fold cross-validation, and the proposed method outperformed all the three base classifiers with an accuracy of 98.62% and a false positive of 0.029. Therefore, the authors concluded that the proposed system could improve detection accuracy, increase TPR, and minimize FPR.
In conclusion, regardless of the immense contribution of the above and existing literature in mitigating the challenges of current IDSs, it is evident that there is still an urgent need to propose new approaches to help improve the significant findings in these existing pieces of literature. For example, the proposal of a much diverse, comprehensive, and optimized ensemble classifier with a much better detection accuracy, a negligible false alarm rate, and most importantly, an acceptable model building and testing time. Additionally, most of the current studies predominantly use supervised machine learning algorithms to designed and deployed IDSs with better detection and lower false alarm rates, which comes with colossal challenges of acquiring sufficient labeled datasets. Therefore, in contrast to most of the above studies, this paper focuses on the systematic design, implementation, and evaluation of robust and efficient unsupervised machine learning algorithms with numerous strengths, abbreviated KODE.
Unlike many existing studies, this paper also comprehensively evaluated the proposed efficient feature selection method and ensemble classifier on three benchmark datasets to ensure reliable and consistent results. Finally, based on the authors’ knowledge, this paper, for the first time, also integrates these four different types of unsupervised algorithms (KODE) as an ensemble classifier. Therefore, based on the above contribution, one can conclude that this paper has somehow contributed to the existing knowledge of this research domain.
4. Materials and Methods
This section briefly discussed the synopsis and statistical details of the three standard IDS datasets used for performance evaluation and discussed the various approaches utilized for the data preprocessing phase. Finally, it presents the methodologies utilized to design and implement the proposed system and concludes with the evaluation metrics utilized for the performance analysis.
4.1. Summary and Statistical Details of the Benchmark Datasets
The phenomenal effort of the security experts in crafting data security measures for real-life network environments and computer systems such as encryption, data anonymization, and some data privacy laws like the EU’s GDPR has stimulated an incredible difficulty in obtaining evaluation datasets for IDSs [61]. Thereby leads to massive challenges of acquiring real-life network traffic and computer systems datasets.
Nonetheless, the past decades have witnessed numerous simulated datasets to address the challenges mentioned earlier. Almost all these datasets mimic the essential features of real-life network traffics [15]. The standard freely available datasets for IDSs performance evaluation are DARPA98, NSL-KDD, ADFA, KDDCUP 99, CIC-IDS2017, and UNSW-NB15. Based on this existing trend and the systematic analysis of reliability and consistency, this paper chose CIC-IDS2017, UNSW-NB15, and NSL-KDD datasets to evaluate the proposed system. The following sections briefly describe the chosen datasets for the evaluation of our system.
4.1.1. Summarized Description of the CIC-IDS2017 Dataset
The Canadian Institute for Cybersecurity presents a novel, sophisticated, and comprehensive CIC-IDS2017 dataset [62], satisfying the eleven significant standards. For instance, attack diversity, the wide-ranging feature set of 80 network flow features, and the essential protocols for building a trustworthy and comprehensive benchmark dataset. Moreover, the authors intelligently designed the dataset to capture network traffic for five days from Monday-Friday, which comprises benign traffic for Monday, regarded as the regular day, and the remaining days with state-of-the-art attack traffics such as DDoS, Brute Force, Heart-bleed, and Infiltration. Finally, considering the computational overhead of the entire CIC-IDS2017 dataset, a subset of this dataset was made by arbitrarily picking 565,053 occurrences for test evaluation. Table 1 provides the statistical summary of the CIC-IDS2017 dataset.
4.1.2. Synopsis of the UNSW-NB15 Dataset
According to the authors of [63], the UNSW-NB15 IDS dataset is motivated to address the immense challenges of its predecessor datasets. For example, massive irrelevant records, an incomprehensive reflection of current attacks, numerous fundamental missing values, and the imbalance between the benign and attack records. This dataset has 175,341 records, which entails the realistic representation of actual modern normal network behaviors and modern-day malicious attack events [36].
Additionally, the design of this dataset is more complex in correlation with the other benchmark datasets, for example, KDDCUP 99, consequently enhancing the performance evaluation of current NIDs. The IXIA traffic generator assembled the records for UNSW-NB15 with three virtual servers. The two servers disseminated the regular traffic packets, and the third one was assigned to spread the malicious network traffic. Interested readers can refer to reference [63] for details of the technical documentation of the dataset, and Table 2 presents the statistical synopsis of the dataset.
4.1.3. Outline of the NSL-KDD Dataset
Lastly, the authors of [64] proposed an enhanced version of KDDCup’99, commonly referred to as NSL-KDD, to alleviate the earlier mentioned challenges [15,63]. It constitutes a fair proportion of 125,973 training to 47,600 testing samples, respectively. Regardless of the significant inherent challenge of the NSL-KDD dataset, for instance, the inadequate reflection of current low footprint attack scenarios, it is still considered the most preferred IDSs evaluation dataset because of its distinctive attribute of maximizing predictions for classifiers [15]. It consists of four attack categories with 41 attributes and a single labeled class distinguishing between malicious or regular network traffic [21]. Finally, interested readers can refer to reference [64] for the detailed theoretical and technical documentation of the NSL-KDD dataset. Table 3 presents the statistical outline of the attack and regular records of the NSL-KDD dataset.
4.2. Data Preprocessing
According to the authors of [59], data preprocessing is the most tedious but fundamental step in data mining because it can simplify and improve the effectiveness of data mining processes. Moreover, data usually comes from heterogeneous platforms and can be noisy, excess, incomplete, and conflicting. As a result, it is imperative to change unpolished data into meaningful data for investigation and information disclosure. Consequently, this study’s pre-preprocessing steps include the following processes as summarized in the subsequent sections:
4.2.1. Data Cleaning and Removal of White Spaces
This paper starts with an essential practice of removing or fixing incorrect, duplicate or incomplete records and filling missing values within the given datasets, commonly referred to as data scrubbing or cleaning, which significantly ensure accurate, efficient, effective, and reliable predictions [65]. Based on the author’s findings, there were no redundant records in the UNSW-NB15’s test set with only a few duplicates in the training datasets. However, we removed the repeated features of NSL-KDD and CIC-IDS2017 datasets. Equally, we remove the white or blank spaces of the multi-class labels to avoid misleading the models during training.
4.2.2. Label Encoding
Some features of the datasets are categorical values, which is not acceptable as an appropriate input for most machine learning algorithms such as the K-means. Therefore, it is essential to encode these features into numerical values before fitting our models. Among the two most popular approaches are one-hot and ordinal encoding. Consequently, using these techniques, this paper assigned integer values to each categorical value [15]. For instance, the values of 0, 1, and 2 are assigned to ICMP, TCP, and UDP protocol types of the NSL-KDD dataset, respectively, and the remaining datasets’ categorical values have been handle as well. Finally, binary labels of all the datasets are already in 0’s and 1’s.
4.2.3. Data Normalization
The authors of [28] have significantly highlighted how various imbalance scales of features can seriously deteriorate the performance of regression or classification models. Therefore, it is imperative to normalize these discrepancies within the dataset features so that negligible and dominant values can be within an acceptable range. For instance, the large values of “Src Bytes”, “Dst Bytes”, and “Duration” of the connection of the CIC IDS2017 dataset can dominate the smaller values of “Num Failed Logins”. As a result, this paper systematically chooses the minimum-maximum technique [66] to normalize the dataset features within the normalized range of [0, 1], enabling an easy understanding of the data. The standard equation of the minimum-maximum method is as follows:
where Xnormalized_value represents the normalized outcome, equally, the Xmin_value and Xmax_value values of the results are 0 and 1, respectively, and the remaining values would be within these ranges, which enables the features to have the same range and base point. Thus, this approach overcomes the issues of bias, immensely reduces the model training and testing time, and enables a fast convergence rate, thereby improving the reliability and classification performance [66].
4.3. Utilized Base Clustering Algorithms
Due to the volume of the work, we will only provide a brief introduction of the base clustering algorithms used for this research with references for detailed information. The interested readers can also contact the corresponding author for detailed documentation of the parameters of the classifiers and additional data. The clustering concept is an unsupervised technique that enables a set of patterns usually in multidimensional space vectors to be clustered into groups so that objects of the same groups or clusters are more similar, whereas the objects from different clusters are unrelated [67]. Similarly, it is a crucial task of clustering related objects into the same cluster such that they are dissimilar to the objects of other clusters. Assuming λ is a set of objects, let ƛ be the set of cluster identifiers. Assuming the function of the distance between objects δ (ε, ε’) is given for set ƛ. It is essential to distribute the set λ into subsets or clusters, such as assigning a label έj ∈ ƛ to each object εi ∈ λ in such a technique that the objects within each cluster are closely correlated to the metric δ, and the objects from unlike clusters vary significantly [68]. However, cluster analysis is a challenging problem due to numerous methods of determining the concept of similarity and dissimilarity. Therefore, to find a set of clusters efficiently, we need to determine new similarity measures with some established rules for assigning data points to various clusters or groups. For instance, the Euclidean distances (D) is a standard similarity metric between data points Ẍ and Ỹ, defined as [69].
Additionally, it is essential to note that smaller Euclidian distances mean more symmetry, whereas more considerable distances mean less symmetry, which is commonly utilized in the K-means and DBSCAN algorithms. Lastly, symmetry is one of the basic structures of objects and shapes, meaning almost every fascinating area around us comprises a generalized form of symmetry [70]. Therefore, since symmetry is a widespread phenomenon in the natural world, we can make concrete assumptions that clusters or objects contain some symmetry, thereby qualifying our approach to be in the realm of symmetry phenomenon.
Firstly, K-means is a popular, simple, and yet a robust unsupervised centroid-based clustering algorithm that clusters a given dataset into predetermined k clusters, such that each sample is grouped with the nearest mean or similar data points. However, irrespective of its advantages, it has a disadvantage of defining the fixed number of k clusters before the training begins. Both K-means and DBSCAN commonly use the Euclidean distances as the distance metrics for analysis [71].
Secondly, DBSCAN, (Density-Based Spatial Clustering of Applications with Noise) [72] is also an unsupervised density-based clustering algorithm. It begins with an arbitrary point and increases the cluster if a certain minimum number of points lie within a certain radius of the point and iteratively grows the cluster by equally considering all points in the radius and reiterating until there are no more points to add [72].
Moreover, the authors of [73] proposed the One-Class SVM, an upgraded version of the supervised SVM, to mitigate the need for label datasets. The unsupervised algorithm separates the entire data points from the original dataset by targeting the region where most data points lie, labels it as +1, and assigns the remaining data points as −1. Finally, it attempts to find a hyperplane that divides data points from the original with the highest margin [14].
Lastly, the Expectation-Maximization (EM) algorithm uses a maximum likelihood sort of parameter estimation technique and is perfectly suited for situations in which the available dataset is partial. EM is an iterative technique that under specified definite circumstances converges to values at a local or global maximum of the likelihood function, and it comprises an expectation and a maximization step [74].
4.4. Feature Selection
The massive irrelevant and redundant features of real-world applications have considerably challenged the effective and reliable classification of attacks by IDSs. Similarly, IDSs built on these challenges usually require more training and testing time with high demand for processing resources and, interestingly, very difficult to interpret [15,40]. Therefore, this study proposed a hybrid feature selection approach, which incorporates genetic search technique, rule-based engine, and CfsSubsetEval. A subset evaluator figures correlation among all attributes and classes [75]. The attribute-class relationship with a stronger correlation is more likely to be chosen, referred to as feature assessment. The genetic algorithm assesses the importance of each property based on this feature assessment. If two-element subsets have similar wellness esteem, the rule assessment stage returns the feature subset with the lowest features count. Finally, the selected features are passed as input to KODE for attack classification and produce the model.
4.4.1. Genetic Search
Based on a natural selection process, the genetic search utilizes the basic genetic algorithm, which exploits computer systems to reproduce the cycle of natural selection and evolution. The genetic algorithm (GA) is an optimization method for data mining, which usually starts with a haphazardly created populace of individual projects [50]. Every population contains an individual, and each individual possesses a different subset of algorithmic parameters. An individual fitness value is determined for each individual of the population during each generation using a different fitness measure. Electronic genetic recombination and blending are performed on the current populace of individuals during each iteration to replace individuals with poor fitness scores with high-performing ones. The fittest individuals replace the individuals with low fitness rates for the next computing iteration [52].
4.4.2. CfsSubsetEval
The CfsSubsetEval is a filter-based evaluator method that assesses the significance of any subsets of indicators based on the predictive ability of specific features alongside the level of inter-correlation among the measured individual features. Consequently, favoring subsets that are exceptionally correlated with the class but have low inter-correlation. Similarly, it also enables the efficient identification of the predictive ability of every available feature within the dataset. Nevertheless, the factor of redundancy among features plays a significant role in this method [62,75].
4.4.3. Rule-Based Engine
The past decades have witnessed many researchers of machine learning applications utilizing the rule-based engine. It is a derivation engine that selects one among numerous choices depending on the relationship between the rule and the data. Additionally, it matches the specified rules to input values and efficiently picks the ideal choice for execution [76], commonly referred to as “conflict resolution”.
Table 4 entails the summarized procedures of the proposed hybrid feature selection model, and the subsequent section presents details of the feature selection steps and algorithm’s pseudo-code depicting the approaches of the proposed system.
4.4.4. Feature Selection Steps
1. Defining Subset
An attribute or feature Xi is supposed to be significant if and only if there lies some xi and y where q (Xi = xi) > 0 to such an extent that:
Q (Z = z | Xi = xi) ≠ q (Z = z)
Based on the above definition, Xi is important if finding out its value can alter the approximations for the class label Z, or in other words, if Z is conditionally dependent on Xi.
2. Defining CfsSubsetEval
In case we know the correlation among all features in the wake of a test and the external variable and inter-correlation among all pairs provided, at that point, correlation in a composite test comprising the summed-up segments as well as an external variable might be anticipated as below:
where R(xi) is the relationship between all summed-up segments and an external variable, T is the total number of segments, while R(xc) is the average correlation between segments and external variable, while rii is the average relationship between segments.
3. Defining Genetic Search
GA is an inquiry enlivened by regular advancement. This hereditary inquiry utilizes the fitness process, which is the straight mix of accuracy and simplicity.
Here X denotes a subset of features, while A represents average accuracy for cross-validation and S denotes the number of training tests, while F represents the subset of features.
4. Rule Assessment Step
The rule base engine returns a subset of features (Vi) with minimum features (XF) in case there are multiple subsets for features (F>) with comparable fitness esteem, else turning features subset with highest fitness esteem (Fhi) to the base classifier as shown in the formula below:
The summarized procedures of the proposed hybrid feature selection model and the details of the algorithm are equally presented in Algorithm 3.
| Algorithm 3 The Proposed Hybrid Feature Selection Algorithm |
| Input: S (F1, F2, …, Fk, Fc) //A training dataset of 𝓃 features |
| Output Class Ci //A desired optimal subset |
| 01 Start by arbitrarily creating an underlying populace P. |
| 02 Process correlation (CfsSubsetEval) between features subsets and classification |
| 03 Select subset of features with high correlation |
| 04 Ascertain f(x:CfsSubsetEval) for every part x ∈ p. |
| 05 Characterize a likelihood dissemination p over the individuals from p where p(x)/f(x). |
| 06 Select two populace individuals x and y regarding p. |
| 07 Applying hybrid to x as well as y to create novel populace individuals x’ as well as y’ |
| 08 Apply change to x’ as well as y’ |
| 09 Supplement x’ as well as y’ into p’. |
| 10 In the event that |p’| < |p|, iterate to step 4 |
| 11 Now let p← p’ |
| 12 If there exist more generations to measure, iterate to 2. |
| 13 Return x ∈ p where f(x) is most noteworthy. |
| 14 if any two subsets of features have a similar fitness value |
| 15 Return the subset of features lowest number of subset attributes or features |
| 16 beginning weight ←irregular (x) |
| 17 for all cases p as well as for each output node j |
| 18 Compute Activation (j) |
| 19 for every input node i to output node (j) Do |
| 20 Delta W = LearningConst * Error-j * Activation-i |
| 21 W (t) = W + DeltaW until error is adequately little or expires |
| 22 For I = length of p |
| 23 For J = L (length) of t, if (j = = i) & ci = t[j] |
| 24 Else increase i by 1 |
| 25 return Ci |
| 26 End; |
Table 5 presents the best-selected features of the proposed hybrid feature selection method, which has demonstrated the capability of efficiently selecting relevant features for attack classification of the asymmetric probability distributions between malicious and normal instances, which proved to have significantly reduced the issue of the curse of dimensionality and overfitting consequences. Furthermore, the authors of [77] have demonstrated that integrating symmetry concepts into the model design and building can drastically reduce model overfitting and complexity challenges, eventually necessitating less training data, training time, and computing resources, all of which have been achieved in our approach. Therefore, we can conclude that our work has some correlation with the symmetry phenomenon. It is essential to note that the feature selection objective of this research is not to present all the sets of selected features during the entire experiment using the k-fold cross-validation. Instead, suggest or choose a few combinations of relevant features from each dataset that significantly enhanced the accurate and consistent detection of various malicious attacks within the utilized datasets.
The confusion matrices presented in Figure 2A–C illustrate the performance of the proposed feature selection and ensemble method on 10-fold cross-validation. The subsequent section highlights the performance in detail.
As presented in Figure 3, the proposed experimental framework summarized the critical steps of the HFS-KODE ensemble classifier. Firstly, the utilized datasets go through a preprocessed phase, as explained earlier in material and methods section. The next step involves the feature selection phase, where we measure and select feature subsets with higher correlation using methods explained in the feature selection steps. Finally, the training phase uses these features to build an efficient and consistent ensemble classifier consisting of K-means, One-Class SVM, DBSCAN, and Expectation-Maximization (KODE). Moreover, we use the final trained model (Detection Engine) in the classification phase with the average of probabilities rule and voting technique to classify the test dataset as benign or various attacks types within the test dataset based on the clusters created during the training phased.
4.5. Adopted Model Evaluation Metrics
According to the authors of [78], the most commonly used evaluation metrics for the current intrusion detection models are Accuracy (ACC), Detection rate (DR), and FAR. However, the authors in [79] claimed that DR is the most crucial metric for IDS performance evaluation. Hence, this work used Precision, F-measure, and MBT, and MTT for a more comprehensive and reliable evaluation of the proposed model in addition to the metrics mentioned above.
It is important to note that a synopsis of the four measures, as shown in Table 6, is required to understand the utilized metrics better, and a summary of the adopted metrics also follows [40]:
4.5.1. Accuracy (ACC)
It evaluates the ratio of network traffic flows that are classified correctly over the total network traffic, and it is one of the most intuitive performance measures and calculated as follows:
4.5.2. Detection Rate (DR)
Similarly called recall or sensitivity, it calculates the percentage of correctly predicted intrusion traffic flow to all the instances in the actual class, and computed as given below:
4.5.3. Precision
It evaluates the ratio of detected intrusion traffic that is correct to all the predicted positive observations, computed as follows:
4.5.4. F1-Measure (F1)
Likewise termed as F1-score is a more effective measure than accuracy, especially for evaluating IDSs’ imbalanced datasets. It is simply the harmonic average of detection rate and precision, computed as given below:
4.5.5. False Alarm Rate (FAR)
Likewise termed as false-positive rates are the percentage of regular network traffic flows that are incorrectly classified, computed as given below:
4.5.6. Model Building/Testing Time (MBT/MTT)
Excluding the factors like the task switching of the CPU, model building, and model testing time are the time taken to train and test our models to predict attacks on a new dataset, which excludes the time taken for the feature selection phase. Furthermore, the authors avoid executing heavy programs during the training and testing phase to minimize possible interferences.
5. Results and Discussion
This section presents a detailed systematic analysis and performance validation of the proposed system. For instance, measuring how well it can efficiently select the relevant features among thousands of records and use these few selected features to classify network traffics into either benign or malicious traffic accurately. Additionally, it provides a thorough performance evaluation of the individual classifiers and KODE on each of the three raw datasets, the selected features, various combination methods, and state-of-the-earth approaches based on numerous metrics such as FAR, ACC, DR, Precision, F1-measure, MBT, and MTT. Additionally, to mitigate the challenges of data sampling, the k-fold cross validation parts are set to explicit limits of testing and training percentages that are not apparent in the training stage to test the model’s quality, generalizability, and reliability. Finally, to ensure effective and reliable results, all the performance results presented in this work are based on the average output values of all ten repetitions of the k-fold cross-validation approach, where the value of k is 10 (k = 10). Finally, all the results presented in this work are obtained using the various test datasets of the utilized benchmark datasets.
5.1. Comparison of Feature Selection with No Feature Selection
This section meticulously evaluates the performance of the proposed novel approach using the original features of the three datasets and the selected features. Firstly, the hybrid feature selection method has demonstrated the capability of efficiently selecting relevant features for attack classification, as presented in Table 5, which significantly reduced the curse of dimensionality. Furthermore, the overall performance evaluation of feature selection for the three datasets has demonstrated the accurate classification of most of the attacks within the utilized datasets, except for only a few of the attacks not correctly classified, as demonstrated in Figure 2A–C. Therefore, the subsequent sections present the systematic comparative evaluation of the proposed unsupervised clustering-based ensemble (KODE) with the utilized base classifiers to assess their performance based on the metrics mentioned earlier. Table 7 present the performance of the base classifiers and KODE on the test dataset based on the average values of the 10-fold cross-validation for the metrics, which reveals exciting findings for the original and the selected features of the NSL-KDD datasets. For instance, it reveals that KODE did not perform as expected on the original dataset features, such as a performance accuracy of 92.03%, a detection rate of 0.90, and 2140.2 s of model testing time. Moreover, KODE records the highest model building time of 441.6 s with a vast false alarm rate of 0.090, while the EM records only 65.4 s model building time but a massive 671.4 s of model testing time. Consequently, the authors correlate the poor performance of KODE to the curse of dimensionality and the complexity of the original features of the dataset [59].
Interestingly, K-means records the best performance accuracy of 95.34%, a detection rate of 0.996, and only 12 s model building time among the base classifiers. However, it records a massive 531.6 s of model testing time and a colossal false alarm rate of 0.133. The authors associated the performance of K-means with efficient hyperparameter tuning. However, due to the lack of expert domains, the authors cannot conclusively agree to why K-means achieved such a decent performance on the original features of the dataset. Moreover, the EM algorithm records the overall poorest performance on the original and selected features with a performance accuracy of 71.03 and a detection rate of 0.71 and 212.4 s of model testing time. Finally, KODE yields pleasing results for the selected features, such as accuracy of 99.73%, 0.999 detection rate, the lowest FAR of only 0.010. Likewise, it also recorded better performance for the remaining metrics, like a drastically reduced model building and testing time of 120 and 208.8 s, respectively. Thus, based on the above performance evaluation, we can conclude that our hybrid feature selection method yielded the best results when combined with the ensemble classifier. Moreover, the proposed method has achieved its objective of strictly minimizing the false alarm rates, model building, and testing time, thereby outperforming the individual base classifiers as anticipated.
Similarly, KODE recorded some unpleasing results for the original features of CIC-IDS2017 datasets, as presented in Table 8. For example, it records a performance accuracy of only 89.15%, a detection rate of 0.891, and a false alarm rate of 0.012. Unfortunately, it also records the highest model testing time of 4958.4 s but only 217.2 s of model building time. These poor performances could result from the sophisticated and imbalanced nature of the dataset, as discussed in reference [62]. Surprisingly, K-means recorded good results like an F-measure of 0.971, a performance accuracy of 97.89%, and a detection rate of 0.978. However, it recorded the highest FAR of 0.129 with a massive 3669 s model testing time contrary to KODE, which records the lowest false alarm rate of 0.012 but with a much higher model testing time. The EM algorithm achieves the minimum model building and testing time of 185.4 and 25.8, respectively, but with an overall poorest performance for the remaining metrics.
Additionally, using the selected features of the CIC-IDS2017 datasets as shown in Table 8A, KODE registers some exciting results like the highest accuracy and detection rate of 99.99% and 0.997, respectively. Further, it records a precision of 0.992 and an F-measure of 0.993 together with a negligible model building and testing time of 120.0 and 208.8 s. In contrast, K-means records the highest model building and testing time, while one-class SVM and DBSCAN achieve the lowest model building and testing time, respectively. Therefore, the authors conclusively agreed that the proposed feature selection and the ensemble approach have effectively and efficiently selected the relevant features and reliably classified most attacks within the utilized datasets.
Furthermore, based on the results presented in Table 9, DBSCAN, Expectation-Maximization, and KODE did not perform well as presumed for the original features of the imbalanced UNSW-NB15 dataset. However, One-Class SVM and K-means produce exciting results on the same original features. For instance, a performance accuracy of 96.79 and a detection rate of 0.9679 for K-means, whereas One-Class SVM records 96.23 performance accuracy and a detection rate of 0.962. However, they recorded the highest false alarm rates of 0.121 and 0.051, except for DBSCAN, which records 0.103. Similarly, they recorded the highest performance on the original features with a precision of 0.965 and 0.962, an F-measure of 0.976 and 0.962 for K-means and One-Class SVM, respectively. Nonetheless, except for DBSCAN and Expectation-Maximization, they also recorded the highest model building and testing time. Considering the findings presented in Table 9A, KODE achieves the overall best performances for the selected features of the UNSW-NB15 dataset, with the Expectation-Maximization recording the overall lowest performance. For example, it achieves the highest accuracy of 99.99% with a lesser model building and testing time. More importantly, it achieves a nominal false alarm rate of only 0.01 with a decent F-measure and precision. Interestingly, both K-means and KODE achieve impressive accuracy, detection rate, precision, and F-measure for the selected features. However, as mentioned above, KODE recorded the lowest false alarm rate, thereby achieving an overall best performance compared to K-means and the remaining base classifiers.
5.2. Assessment of the Proposed HFS with Other Feature Selection Methods
To further assess the consistency and performance of the proposed hybrid feature selection method. This section presents numerous experiments, which intuitively compares the performance of the proposed method with well-established feature selection methods. Some of the systematic selected methods for this comparison are Correlation-based Feature Selection (CFS), Bat Algorithm (BA), Genetic Algorithm (GA), Information Gain (IG), and Passive-Aggressive (PA).
The findings presented in Figure 4A,B summarized the results of the evaluation of HFS with various cutting-edge feature selection methods using the three benchmark datasets with various metrics. Figure 4A illustrates that the proposed method (HFS) achieves the best accuracy on all three datasets compared to other well-known methods. For example, it achieves a performance accuracy of 99.91%, 99.73%, and 99.9% on the UNSW-NB15, NSL-KDD, and CIC-IDS2017 datasets, respectively. On the other hand, although the BA method records a decent performance accuracy compared to the remaining adopted approaches, such as 99.46%, 98.82%, and 98.85% on the three datasets, it is still below the performance of HFS. Additionally, all the adopted methods, including HFS, achieved the lowest score for the NSL-KDD compared to the remaining two datasets with CFS, IG, and PA only recording 95.36%, 95.12%, and 95.64% on the NSL-KDD, respectively.
Similarly, HFS obtained the highest detection rate for all the datasets, with the highest of 99.93 on the UNSW-NB15 dataset, addressing the low detection rate highlighted in reference [50]. Nonetheless, it only records a detection rate of 94.64% on the NSL-KDD dataset. Likewise, the BA method records reasonable detection rates for all the datasets like 97.23 and 96.45 on UNSW-NB15 and CICIDS-2017, respectively. However, it only manages to achieve 91.34% on the NSL-KDD dataset. At the same time, IG, CFS, and PA attained the lowest performance, especially on the NSL-KDD dataset. Based on these performances, it is evident that HFS has demonstrated pleasing results compared to the adopted methods, thereby it is an efficient and reliable method among all the selected approaches for the evaluation.
Moreover, Figure 5A,B present the evaluation results of HFS with other methods for the false alarm rates and F-measure metrics. As illustrated in Figure 5B, the HFS method has outclassed all the other methods. For example, an F-measure of 0.999, 0.997, and 0.998 for UNSW-NB15, NSL-KDD, and CICIDS-2017, respectively. On the same note, it is essential to note that BA has performed very well on all the datasets but below the performance of the proposed HFS method. In addition, the NSL-KDD dataset recorded the lowest F-measure in all the adopted approaches, including HFS. However, the authors can only correlate this to the complex nature of the dataset as of now.
Interestingly, HFS achieves all the above pleasing results with the lowest false alarm rate for all the datasets, like 0.11, 0.16, and 0.09 for UNSW-NB15, NSL-KDD, and CIC-IDS2017, respectively, as presented in Figure 5A. Similarly, except for the BA and CFS methods, all the other methods, including HFS, recorded the highest false alarm rates on the NSL-KDD dataset. It is worth noting that CFS and IG achieved the highest false alarm rate of 3.98 on both the UNSW-NB15 and NSL-KDD datasets. Considering the overall performance of the HFS method, it would be fair to state that it has significantly outperformed the other conventional methods, thereby making it superior among the selected approaches in many current studies in terms of efficiency, reliability, and performance.
Figure 6A,B presents the evaluation results of the number of selected features with their respective time for HFS and other methods. For example, Figure 6A illustrated that the HFS method achieved a notable performance in terms of the features selected, such as achieving the lowest selected features of 8 features for the NSL-KDD dataset and the same time, acceptable records of 11 and 13 selected features for the UNSW-NB15 and CIC-IDS2017, respectively. Similarly, BA, IG, and PA achieve a realistic performance on the number of selected features, with the BA and PA methods recording the lowest number of selected features after the HFS method. In contrast, CFS emerged with the lowest performance on all the datasets, like 26 and 21 selected features on UNSW-NB15, and CIC-IDS2017, respectively. Similarly, Information Gain also struggled by selecting 21 and 17 features on the UNSW-NB15 and CIC-IDS2017.
Finally, despite the considerable reduction in the model building and testing time on the selected features from all the datasets, HFS has underperformed in feature selection time compared to other methods, as shown in Figure 6B, especially for the CFS and IG method. On the other hand, the CFS and IG methods outperformed our proposed method in the time taken to select features. However, this is not very important considering the overall performance of HFS. Additionally, the results presented in Figure 6A,B have revealed exciting findings of the NSL-KDD dataset. For instance, all the methods recorded the least time for selecting features and selected the minimum number of features on NSL-KDD compared to other datasets, and this also could have a possible correlation with the poor performance of the said dataset in some of the initial evaluations. However, the authors cannot conclude why this happened. To conclude, looking at the above performance, one can conclude that HFS has demonstrated the ability to efficiently and effectively select the necessary features within an acceptable time frame, thereby having a competitive advantage compared to other methods.
5.3. Evaluation of KODE with (Voting) and Other Classification Methods
Likewise, the authors conducted yet another set of experiments with the hybrid feature selection to further evaluate the performance of KODE with other state-of-the-art classification methods, such as AdaBoost, C4.5, Gradient Boosted Machine (GBM), and KNN. Initially, KODE-based voting with the Average of Probabilities (AOP) combination rules is selected as it emerges as the best combination rule method during the experiment, as explained in the subsequent sections. It is important to note that all the results presented in this evaluation are the average values of the outputs of the 10-fold cross-validation approach [80]. Additionally, to validate the reliability and effectiveness of the comparison, it is essential to ensure an accurate comparison of the classifiers and similarly crucial to calculate the statistical significance of the individual classifiers [81].
Consequently, the authors have applied a statistical comparison to assess the significant differences among different classifiers as indicated in reference [82]. Finally, these evaluations adopted the null hypothesis that all the classifiers show equal performance with no performance variation to test the performance of these classifiers. Therefore, if the performance of any algorithm is different, then this hypothesis will be rejected. Moreover, this paper used the Nemenyi post-hoc test [82] to test the above null hypothesis, and the subsequent section discusses the results attained.
Based on the evaluation results of KODE with other classification methods as shown in Figure 7A,B, it is evident that KODE has outclassed the other selected classification methods with exciting F-measures for all the datasets. Similarly, all the remaining classification methods attained acceptable F-measure results but below the proposed ensemble classifier. Conversely, while KODE achieved reasonable detection rates for all the datasets, it is essential to highlight that both GBM and the KNN classification algorithm attained the least accuracy score, as indicated in Figure 6B, especially for the NSL-KDD dataset. For instance, they recorded an overall 98% accuracy for the NSL-KDD dataset, probably resulting from the complex nature of the datasets as discussed in many existing studies [62].
Lastly, Figure 8A,B presents the false alarm and detection rate of KODE with other classification methods. These findings revealed that KODE appeared as the best among all the selected algorithms for this evaluation. For instance, Figure 8A revealed that KODE with voting has attained the best performances with the highest detection rate of 99.93% and 99.73% for UNSW-NB15 and CICIDS-2017, but only managing to record a detection rate of 96.64% for the NSL-KDD dataset. However, it still emerged as the best performance for this dataset compared to other established algorithms. Similarly, all the remaining selected classification methods recorded exciting detection rates for the UNSW-NB15 and CICIDS-2017 datasets; nevertheless, they recorded the lowest detection rates for the NSL-KDD dataset with C4.5 and KNN recording the least of 94.83, and 94.51, respectively. Likewise, the findings presented in Figure 8B illustrated that KODE has drastically mitigated the false alarm rate challenges with just 0.11, 0.16, and 0.9 for the UNSW-NB15, NSL-KDD, and CICIDS-2017 datasets. However, Adaboosting, GBM, KNN appeared to have recorded the worst performance of false alarm rates for all the datasets, especially on the UNSW-NB15 and NSL-KDD datasets. Nonetheless, C4.5 has achieved decent performances of FAR for all the datasets with only 0.082 and 0.11 for NSL-KDD, and CICIDS-2017 datasets, respectively. Based on the above performances, the authors have concluded significant performance differences among the chosen well-known algorithm and KODE, hence rejecting the earlier adopted null hypothesis.
5.4. Comparison of Various Adopted Combination Rules
This section elaborates on the various experimental results obtained using selected combination rules with the HFS-KODE based ensemble approach. The well-known combination rules used with the voting method for constructing ensemble classifiers in existing studies are the product of probabilities, majority voting, minimum probability, an average of probabilities (AOP), and maximum probability [83]. Furthermore, since the numbers of classes are more significant than the base classifiers and the decent performance of the AOP over majority voting, the authors conclusively agreed to adopt the AOP combination rule for decision-making. In this paper, the average of the predicted probabilities’ highest value determined the class label. Similarly, this paper utilized the vote meta-algorithm that uses a specified combination rule to harness the strength of various individual base classifiers. Refer to reference [15] for detailed documentation of the technical and mathematical definition of the concepts as mentioned above. Additionally, it is essential to note that all the evaluations results are obtained using the average accuracy of the output value of the 10-fold cross-validation technique to avoid model overfitting, thereby providing reliable and consistent results [21]. The subsequent section presents and discusses the findings of the experiments.
Table 10 presents the accuracy evaluation results of the selected combination rules on the available attacks of the NSL-KDD datasets. For instance, all the combination rules achieved good performances on the benign samples. The average of probabilities recorded the highest performance accuracy of 99.9% for regular instances and 99.58% for probe attacks. Nevertheless, it failed to replicate the same impressive performance accuracy for the other attacks, especially U2R. This could be due to the few instances of this attack within the dataset.
Unexpectedly, irrespective of the few available R2L and U2R instances, the majority voting rule achieves the best performance compared to the average probabilities on the NSL-KDD dataset. For example, it records an impressive performance accuracy of 99.78%, 99.67%, and 72.34% for DoS, R2L, and U2R, respectively. Finally, the U2R and R2L attacks recorded the lowest performances accuracy for all the combination rules. Nevertheless, the authors convincingly correlated this with the few available instances of these attacks within the mentioned dataset.
On the other hand, the results presented in Table 11 revealed that the average of probabilities achieves the overall best performance accuracy for all the attacks within the UNSW-NB15 dataset, with the benign instances achieving the highest performance accuracy of 99.97%. Moreover, both the Backdoor and DoS attacks achieved remarkable performance accuracies of 99.34% and 99.20%, respectively. Contrarily, the Exploits attack failed to replicate the same exciting performance accuracy with the lowest of 69.12% among all dataset attacks for the AOP. Irrespective of these poor performances, the average of probabilities achieved the best performance accuracy for this attack compared to other combination rules. Lastly, the maximum likelihood recorded the lowest performance accuracy of 48.43%. Consequently, this paper adopts the average of probabilities rule based on the performances manifested in Table 11.
Finally, Table 12 reports the final findings on comparing different combination rules on the CIC-IDS2017 dataset. These findings revealed that the average of probabilities combination rule undoubtedly succeeded as the best performing rule for most of the attack classes in the dataset as shown in Table 12. For instance, DDoS, Web Attack, and Benign achieved the highest accuracy of 99.99%, 99.97%, and 99.96%, respectively. In contrast, the performance accuracy in Botnet, FTP-Patator, and DoS are 99.15%, 99.09%, and 98.89%, respectively.
Interestingly, even though SSH_Patator consists of more instances than Botnet attack, it still records the lowest accuracy for all the combination rules, the cause of which will be investigated in future research. Finally, the Probe attack recorded the second-lowest performance with an average accuracy of 86.57% for all the combination rules, only doing better than SSH_Patator among all the attacks in the dataset. In summary, irrespective of the excellent performance of the remaining combination rules, it is indisputable that the average of probabilities achieved the overall best performance for all the different attacks of the various datasets, thereby adopting the average of probabilities as the combination rule for implementing the proposed ensemble.
5.5. Comparison of Our Proposed Approach with Other Cutting-Edge IDS Approaches
The past decade has witnessed the conventional IDS methodologies boosted with numerous powerful machine learning security frameworks [84]. Irrespective of these significant contributions, the existing literature confirms the urgent need to harness the effectiveness of feature selection and ensemble methods to design consistent and optimized IDSs with negligible false alarm rates and acceptable model building and testing time. Therefore, this section compares the proposed HSF-KODE with some unique approaches that have been published during the last five years. Most of these selected works use ensemble classifiers with feature selection, with only a few studies without any feature selection. Likewise, DCIC-IDS2017(Wed.), UNSW-NB15, AWID-CLS-R, AWID, and NSL-KDD are standard datasets used for these evaluations with parameters such as classifier(s) used, features selection method, if any, accuracy, false alarm, and detection rates. The proposed approach (HFS-KODE) has achieved a competitive advantage among the selected methods, as presented in Table 13. For instance, it has recorded an incredible performance accuracy of 99.997% with only 0.11 FAR, significantly addressing the low accuracy challenge of the same dataset in reference [73].
Similarly, HFS-KODE records the highest detection rate of 99.93% on the UNSW-NB15 dataset, compared to other studies. Moreover, the proposed approach achieved the best performance on the CIC-IDS2017 dataset with a performance accuracy of 99.99%, a detection rate of 99.75%, and only 0.09 false alarm rates compared to many available approaches. Lastly, KODE achieved the best performance on the NSL-KDD dataset with a detection rate of 96.64% and a performance accuracy of 99.73%. However, it achieved the highest false alarm rates compared to [31]. Finally, unlike the selected studies and many other approaches. HFS-KODE has demonstrated a competitive advantage among the selected studies, such as achieving an overall higher accuracy, lower false alarm rate, an acceptable model building and testing time, and a higher detection rate. Therefore, it would be fair to conclude that the proposed IDS (HFS-KODE) has outclassed many existing systems used for this assessment regarding performance accuracy, effectiveness, reliability, and efficiency.
6. Conclusions and Future Work
The massive technological advancements made over the past decade has positively influenced all aspects of life. Alongside this is the illegal mining of data, leading to the need to provide reliable and effective IDSs. Nevertheless, existing studies have shown that the curse of dimensionality from the unbalanced network traffic, low detection rates, high false alarm rates, low accuracy, and the difficulty to attain sufficient labeled datasets remain a challenge. Therefore, in this paper, we proposed a comprehensive and lightweight hybrid feature selection (HFS) and an ensemble classifier (KODE) that efficiently selected few relevant features and provided an accurate and consistent classification of the majority of attacks within the utilized datasets. Firstly, using the strengths of CfsSubsetEval, genetic search technique, and rule-based engine, this paper presents an HFS technique that selects a relevant subset of features.
Additionally, this work posits an inclusive ensemble approach that uses K-means, One-Class SVM, DBSCAN, and Expectation-Maximization algorithms as an enhanced lightweight classifier based on the average of probabilities rule. Finally, the paper evaluated the final optimized IDS model on three modern benchmark IDS datasets based on 10-fold cross-validation for consistent results, which achieved some pleasing results. For instance, HFS-KODE outperformed all the individual base classifiers on the original and selected features for the three datasets. It also outclassed state-of-the-earth feature selection methods, as discussed above. Interestingly, and most importantly, our experimental results show HFS-KODE has the best accuracy performance of 99.99%, 99.73%, and 99.997% for CIC-IDS2017, NSL-KDD, and UNSW-NB15, respectively. Likewise, both CIC-IDS2017 and UNSW-NB15 achieve the best detection rate of 99.75% and 99.93%, respectively, whereas NSL-KDD records a detection rate of 96.64%, but with a highest false alarm rate of 0.16 compared to some selected studies.
Moreover, the HFS-KODE recorded a negligible false alarm of 0.09 and 0.11, with only 11 and 13 selected features for CIC-IDS2017 and UNSW-NB15, respectively. Finally, using various metrics, HFS-KODE provides remarkable performances with much lower false alarm rates and drastically reduced model building and testing time than some cutting-edge approaches. As a result, HFS-KODE could serve as a significant competitive advantage within the IDS research domain.
However, irrespective of the impressive performance of HFS-KODE, it has some obvious drawbacks that still need improvement, such as the detection rate of NSL-KDD and reducing its false alarm rate of 0.16. Moreover, the competitive performance of KODE and K-means has challenged our approach. However, our objectives were to select few relevant features and provide consistent classification within an acceptable time frame instead of comparing KODE and the base classifiers. In the future, we intend to: (i) Build a correlation module to reduce the number of false alarm rates drastically. (ii) Investigate why K-means has better or similar performances with KODE on the original and selected features of all the three datasets, and (iii) finally evaluate the HFS-KODE with other current datasets.
Author Contributions
Conceptualization, X.W. and E.J.; data curation, X.W. and E.J.; formal analysis, X.W. and E.J.; funding acquisition, E.J.; investigation, X.W. and E.J.; methodology, X.W. and E.J.; resources, X.W. and E.J.; software, X.W. and E.J.; supervision, X.W.; validation, X.W. and E.J.; visualization, E.J.; writing—original draft, X.W. and E.J.; writing—review and editing, X.W. and E.J. All authors have read and agreed to the published version of the manuscript.
Funding
The Article Processing Charges (APC) is funded by University of The Gambia (UTG).
Institutional Review Board Statement
Not applicable.
Informed Consent Statement
Not applicable.
Data Availability Statement
The datasets used in this paper are publicly available to everyone and can be access at: https://www.unb.ca/cic/datasets/ids-2017.html (accessed on 15 August 2021), https://www.unb.ca/cic/datasets/nsl.html (accessed on 15 August 2021), and https://research.unsw.edu.au/projects/unsw-nb15-dataset (accessed on 15 August 2021), for CIC-IDS2017, NSL-KDD, and UNSW-NB15 dataset, respectively. Likewise, the remaining data will be available on request from the corresponding author.
Acknowledgments
Special thanks to Wang Xue Ming for the guidance and supervision. Sherriffo Ceesay, thanks for the insightful comments and advice. Gomez, Hydara, Assan Jahateh, the entire staff of the UTG, and the school of ICT, thanks for the significant support. Eva Lee Redding, the family, and loved ones, I am grateful for the love and support over the past year, and it has significantly contributed to this success immensely. Thanks a lot to everyone, and well appreciated.
Conflicts of Interest
The authors declare no conflict of interest.
References
- Park, J.H. Advances in Future Internet and the Industrial Internet of Things. Symmetry 2019, 11, 244. [Google Scholar] [CrossRef] [Green Version]
- Tankard, C. Big data security. Netw. Secur. 2012, 2012, 5–8. [Google Scholar] [CrossRef]
- Khan, M.; Karim, R.; Kim, Y. A Scalable and Hybrid Intrusion Detection System Based on the Convolutional-LSTM Network. Symmetry 2019, 11, 583. [Google Scholar] [CrossRef] [Green Version]
- Meryem, A.; EL Ouahidi, B. Hybrid intrusion detection system using machine learning. Netw. Secur. 2020, 2020, 8–19. [Google Scholar] [CrossRef]
- Sarker, I.H.; Kayes, A.S.M.; Badsha, S.; Alqahtani, H.; Watters, P.; Ng, A. Cybersecurity data science: An overview from machine learning perspective. J. Big Data 2020, 7, 1–29. [Google Scholar] [CrossRef]
- Damaševičius, R.; Venčkauskas, A.; Toldinas, J.; Grigaliūnas, Š. Ensemble-Based Classification Using Neural Networks and Machine Learning Models for Windows PE Malware Detection. Electronics 2021, 10, 485. [Google Scholar] [CrossRef]
- Dang, Q. Studying Machine Learning Techniques for Intrusion Detection Systems. In Future Data and Security Engineering. FDSE 2019. Lecture Notes in Computer Science; Dang, T., Küng, J., Takizawa, M., Bui, S., Eds.; Springer: Cham, Switzerland, 2019; Volume 11814. [Google Scholar]
- Muñoz, A.; Maña, A.; González, J. Dynamic Security Properties Monitoring Architecture for Cloud Computing. In Security Engineering for Cloud Computing: Approaches and Tools; IGI Globa: Hershey, PA, USA, 2013; pp. 1–18. [Google Scholar] [CrossRef]
- Kagara, B.N.; Siraj, M.M. A Review on Network Intrusion Detection System Using Machine Learning. Int. J. Innov. Comput. 2020, 10, 598–607. [Google Scholar] [CrossRef]
- Bhosale, K.S.; Nenova, M.; Iliev, G. Intrusion Detection in Communication Networks Using Different Classifiers. Technol. Soc. 2018, 2019, 19–28. [Google Scholar] [CrossRef]
- Liu, H.; Lang, B. Machine Learning and Deep Learning Methods for Intrusion Detection Systems: A Survey. Appl. Sci. 2019, 9, 4396. [Google Scholar] [CrossRef] [Green Version]
- Ashoor, A.S.; Gore, S. Importance of Intrusion Detection System (IDS). Int. J. Sci. Eng. Res. 2011, 2, 1–4. Available online: http://www.ijser.org/researchpaper%5CImportance_of_Intrusion_Detection_System.pdf (accessed on 15 August 2021).
- Saleh, A.I.; Talaat, F.M.; Labib, L.M. A hybrid intrusion detection system (HIDS) based on prioritized k-nearest neighbors and optimized SVM classifiers. Artif. Intell. Rev. 2017, 51, 403–443. [Google Scholar] [CrossRef]
- Khraisat, A.; Gondal, I.; Vamplew, P.; Kamruzzaman, J.; Alazab, A. Hybrid Intrusion Detection System Based on the Stacking Ensemble of C5 Decision Tree Classifier and One Class Support Vector Machine. Electronics 2020, 9, 173. [Google Scholar] [CrossRef] [Green Version]
- Zhou, Y.; Cheng, G.; Jiang, S.; Dai, M. Building an efficient intrusion detection system based on feature selection and ensemble classifier. Comput. Netw. 2020, 174, 107247. [Google Scholar] [CrossRef] [Green Version]
- Lyu, R.; He, M.; Zhang, Y.; Jin, L.; Wang, X. Network Intrusion Detection Based on an Efficient Neural Architecture Search. Symmetry 2021, 13, 1453. [Google Scholar] [CrossRef]
- Zhang, Y.; Ye, X.; Xie, F.; Peng, Y. A Practical Database Intrusion Detection System Framework. In Proceedings of the 2009 Ninth IEEE International Conference on Computer and Information Technology, Xiamen, China, 11–14 October 2009; Volume 1, pp. 342–347. [Google Scholar] [CrossRef]
- Song, J.; Takakura, H.; Okabe, Y.; Nakao, K. Toward a more practical unsupervised anomaly detection system. Inf. Sci. 2013, 231, 4–14. [Google Scholar] [CrossRef]
- Ullah, I.; Mahmoud, Q.H. A filter-based feature selection model for anomaly-based intrusion detection systems. In Proceedings of the 2017 IEEE International Conference on Big Data, Boston, MA, USA, 11–14 December 2017; pp. 2151–2159. [Google Scholar] [CrossRef]
- Fitni, Q.R.S.; Ramli, K. Implementation of Ensemble Learning and Feature Selection for Performance Improvements in Anomaly-Based Intrusion Detection Systems. In Proceedings of the 2020 IEEE International Conference on Industry 4.0, Artificial Intelligence and Communications Technology (IAICT), Bali, Indonesia, 7–8 July 2020; pp. 118–124. [Google Scholar] [CrossRef]
- Vaiyapuri, T.; Binbusayyis, A. Application of deep autoencoder as a one-class classifier for unsupervised network intrusion detection: A comparative evaluation. PeerJ Comput. Sci. 2020, 6, e327. [Google Scholar] [CrossRef]
- Wagh, S.K.; Kolhe, S. Effective semi-supervised approach towards intrusion detection system using machine learning techniques. Int. J. Electron. Secur. Digit. Forensics 2015, 7, 290. [Google Scholar] [CrossRef]
- Hanifi, K.; Güvensan, M.A. Makine Ö˘grenmesi Anormal Durum Belirleme Yakla¸ sımı ile A˘g Üzerinde Saldırı Tespiti: Network Intrusion Detection Using Machine Learning Anomaly Detection Algorithms. 2016. Available online: https://ieeexplore.ieee.org/document/8442693 (accessed on 15 August 2021).
- Gautam, R.K.S.; Doegar, E.A. An Ensemble Approach for Intrusion Detection System Using Machine Learning Algorithms. In Proceedings of the 2018 8th International Conference on Cloud Computing, Data Science & Engineering (Confluence), Noida, India, 11–12 January 2018. [Google Scholar] [CrossRef]
- Mirsky, Y.; Doitshman, T.; Elovici, Y.; Shabtai, A. Kitsune: An Ensemble of Autoencoders for Online Network Intrusion Detection. In Proceedings of the NDSS Symposium 2018, San Diego, CA, USA, 18–21 February 2018; pp. 18–21. [Google Scholar] [CrossRef]
- Sah, G.; Banerjee, S. Feature Reduction and Classifications Techniques for Intrusion Detection System. In Proceedings of the 2020 International Conference on Communication and Signal Processing (ICCSP), Chennai, India, 28–30 July 2020; pp. 1543–1547. [Google Scholar]
- Sarnovsky, M.; Paralic, J. Hierarchical Intrusion Detection Using Machine Learning and Knowledge Model. Symmetry 2020, 12, 203. [Google Scholar] [CrossRef] [Green Version]
- Mahfouz, A.; Abuhussein, A.; Venugopal, D.; Shiva, S. Ensemble Classifiers for Network Intrusion Detection Using a Novel Network Attack Dataset. Futur. Internet 2020, 12, 180. [Google Scholar] [CrossRef]
- Zhou, Z.-H. Ensemble Learning. In Encyclopedia of Biometrics; Li, S.Z., Jain, A., Eds.; Springer: Boston, MA, USA, 2009; pp. 270–273. [Google Scholar] [CrossRef]
- Li, Y.; Chen, W. A Comparative Performance Assessment of Ensemble Learning for Credit Scoring. Mathematic 2020, 8, 1756. [Google Scholar] [CrossRef]
- Richman, R.; Wüthrich, M.V. Nagging Predictors. Risks 2020, 8, 83. [Google Scholar] [CrossRef]
- Syarif, I.; Zaluska, E.; Prugel-Bennett, A.; Wills, G. Application of Bagging, Boosting and Stacking to Intrusion Detection. In Machine Learning and Data Mining in Pattern Recognition. MLDM 2012. Lecture Notes in Computer Science; Perner, P., Ed.; Springer: Berlin/Heidelberg, Germany, 2012; Volume 7376. [Google Scholar] [CrossRef] [Green Version]
- Aburomman, A.; Reaz, M.B.I. A survey of intrusion detection systems based on ensemble and hybrid classifiers. Comput. Secur. 2017, 65, 135–152. [Google Scholar] [CrossRef]
- Gaikwad, D.; Thool, R.C. Intrusion Detection System Using Bagging Ensemble Method of Machine Learning. In Proceedings of the International Conference on Computing Communication Control and Automation, Pune, India, 26–27 February 2015; pp. 291–295. [Google Scholar] [CrossRef]
- Demir, N.; Dalkiliç, G. Modified stacking ensemble approach to detect network intrusion. Turk. J. Electr. Eng. Comput. Sci. 2018, 26, 418–433. [Google Scholar] [CrossRef]
- Rajagopal, S.; Kundapur, P.P.; Hareesha, K.S. A Stacking Ensemble for Network Intrusion Detection Using Heterogeneous Datasets. Secur. Commun. Netw. 2020, 2020, 1–9. [Google Scholar] [CrossRef] [Green Version]
- Cai, J.; Luo, J.; Wang, S.; Yang, S. Feature selection in machine learning: A new perspective. Neurocomputing 2018, 300, 70–79. [Google Scholar] [CrossRef]
- Aljawarneh, S.; Aldwairi, M.; Yassein, M.B. Anomaly-based intrusion detection system through feature selection analysis and building hybrid efficient model. J. Comput. Sci. 2018, 25, 152–160. [Google Scholar] [CrossRef]
- Nguyen, H.T.; Petrović, S. A Comparison of Feature-Selection Methods. 2010, pp. 242–255. Available online: https://link.springer.com/chapter/10.1007/978-3-642-14706-7_19 (accessed on 15 August 2021).
- Suman, C.; Tripathy, S.; Saha, S. Building an effective intrusion detection system using unsupervised feature selection in multi-objective optimization framework. arXiv 2019, arXiv:1905.06562. [Google Scholar]
- Song, L.; Smola, A.; Gretton, A.; Borgwardt, K.M.; Bedo, J. Supervised feature selection via dependence estimation. In Proceedings of the 24th International Conference on Machine learning, New York, NY, USA, 20–24 June 2007; pp. 823–830. [Google Scholar] [CrossRef] [Green Version]
- Zhao, Z.; Liu, H. Semi-supervised Feature Selection via Spectral Analysis. In Proceedings of the 2007 SIAM International Conference on Data Mining; Society for Industrial and Applied Mathematics, Minneapolis, MN, USA, 26–28 April 2007; pp. 641–646. [Google Scholar] [CrossRef] [Green Version]
- Dy, J.G.; Brodley, C.E. Feature selection for unsupervised learning. J. Mach. Learn. Res. 2004, 5, 845–889. [Google Scholar] [CrossRef] [Green Version]
- Visalakshi, S.; Radha, V. A literature review of feature selection techniques and applications: Review of feature selection in data mining. In Proceedings of the 2014 IEEE International Conference on Computational Intelligence and Computing Research, Piscataway, NJ, USA, 18–20 December 2014; pp. 1–6. [Google Scholar] [CrossRef]
- Ambusaidi, M.A.; He, X.; Nanda, P.; Tan, Z. Building an Intrusion Detection System Using a Filter-Based Feature Selection Algorithm. IEEE Trans. Comput. 2016, 65, 2986–2998. [Google Scholar] [CrossRef] [Green Version]
- Duda, R.O.; Hart, P.E.; Stork, D.G. Pattern Classification, 2nd ed.; Wiley: New York, NY, USA, 2001; p. 738. [Google Scholar]
- Robnik, M.; Konenko, I. Theoretical and empirical analysis of ReliefF and RReliefF. Mach. Learn. 2003, 53, 23–69. [Google Scholar] [CrossRef] [Green Version]
- Peng, H.; Long, F.; Ding, C. Feature selection based on mutual information criteria of max-dependency, max-relevance, and min-redundancy. IEEE Trans. Pattern Anal. Mach. Intell. 2005, 27, 1226–1238. [Google Scholar] [CrossRef] [PubMed]
- Liu, H.; Yu, L. Toward integrating feature selection algorithms for classification and clustering. IEEE Trans. Knowl. Data Eng. 2005, 17, 491–502. [Google Scholar]
- Khammassi, C.; Krichen, S. A GA-LR wrapper approach for feature selection in network intrusion detection. Comput. Secur. 2017, 70, 255–277. [Google Scholar] [CrossRef]
- Bai, L.; Wang, Z.; Shao, Y.-H.; Deng, N.-Y. A novel feature selection method for twin support vector machine. Knowl.-Based Syst. 2014, 59, 1–8. [Google Scholar] [CrossRef]
- Rani, P.; Kumar, R.; Jain, A.; Chawla, S.K. A Hybrid Approach for Feature Selection Based on Genetic Algorithm and Recursive Feature Elimination. Int. J. Inf. Syst. Model. Des. 2021, 12, 17–38. [Google Scholar] [CrossRef]
- Quinlan, J.R. Induction of decision trees. Mach. Learn. 1986, 1, 81–106. [Google Scholar] [CrossRef] [Green Version]
- Ma, S.; Huang, J. Penalized feature selection and classification in bioinformatics. Brief. Bioinform. 2008, 9, 392–403. [Google Scholar] [CrossRef] [Green Version]
- Milenkoski, A.; Vieira, M.; Kounev, S.; Avritzer, A.; Payne, B.D. Evaluating Computer Intrusion Detection Systems. ACM Comput. Surv. 2015, 48, 1–41. [Google Scholar] [CrossRef]
- Hota, H.S.; Shrivas, A.K. Decision Tree Techniques Applied on NSL-KDD data and its Comparison with Various Feature Selection Techniques. In Advanced Computing, Networking and Informatics; Springer: Berlin/Heidelberg, Germany, 2014; Volume 1. [Google Scholar] [CrossRef]
- Gaikwad, D.; Thool, R.C. Intrusion Detection System Using Bagging with Partial Decision TreeBase Classifier. Procedia Comput. Sci. 2015, 49, 92–98. [Google Scholar] [CrossRef] [Green Version]
- Thaseen, I.S.; Kumar, C.A. Intrusion detection model using fusion of chi-square feature selection and multi class SVM. J. King Saudi Univ. Comput. Inf. Sci. 2017, 29, 462–472. [Google Scholar] [CrossRef] [Green Version]
- Paulauskas, N.; Auskalnis, J. Analysis of data pre-processing influence on intrusion detection using NSL-KDD dataset. In Proceedings of the 2017 Open Conference of Electrical, Electronic and Information Sciences (eStream), Vilnius, Lithuania, 27 April 2017; pp. 1–5. [Google Scholar]
- Abdullah, M.; Alshannaq, A.; Balamash, A.; Almabdy, S. Enhanced Intrusion Detection System using Feature Selection Method and Ensemble Learning Algorithms. Int. J. Comput. Sci. Inf. Secur. 2018, 16, 2018. [Google Scholar]
- The General Data Protection Regulation v. CCPA. 2018, pp. 1–42. Available online: https://fpf.org/wp-content/uploads/2018/11/GDPR_CCPA_Comparison-Guide.pdf (accessed on 15 August 2021).
- Sharafaldin, I.; Lashkari, A.H.; Ghorbani, A.A. Toward Generating a New Intrusion Detection Dataset and Intrusion Traffic Characterization. In Proceedings of the ICISSP 2018, Madeira, Portugal, 22–24 January 2018; pp. 108–116. [Google Scholar] [CrossRef]
- Moustafa, N.; Slay, J. UNSW-NB15: A comprehensive data set for network intrusion detection systems (UNSW-NB15 network data set). In Proceedings of the 2015 Military Communications and Information Systems Conference (MilCIS), Canberra, Australia, 10–12 November 2015. [Google Scholar] [CrossRef]
- Tavallaee, M.; Bagheri, E.; Lu, W.; Ghorbani, A.A. A detailed analysis of the KDD CUP 99 data set in Computational Intelligence for Security and Defense Applications. In Proceedings of the CISDA 2009: IEEE Symposium on Computational Intelligence for Security and Defense Applications, Ottawa, ON, Canada, 8–10 July 2009; pp. 1–6. [Google Scholar]
- Zhong, Y.; Chen, W.; Wang, Z.; Chen, Y.; Wang, K.; Li, Y.; Yin, X.; Shi, X.; Yang, J.; Li, K. HELAD: A novel network anomaly detection model based on heterogeneous ensemble learning. Comput. Netw. 2020, 169, 107049. [Google Scholar] [CrossRef]
- Devan, P.; Khare, N. An efficient XGBoost–DNN-based classification model for network intrusion detection system. Neural Comput. Appl. 2020, 32, 12499–12514. [Google Scholar] [CrossRef]
- Rodriguez, M.Z.; Comin, C.H.; Casanova, D.; Bruno, O.M.; Amancio, D.R.; Costa, L.D.F.; Rodrigues, F. Clustering algorithms: A comparative approach. PLoS ONE 2019, 14, e0210236. [Google Scholar] [CrossRef]
- Koryshev, N.; Hodashinsky, I.; Shelupanov, A. Building a Fuzzy Classifier Based on Whale Optimization Algorithm to Detect Network Intrusions. Symmetry 2021, 13, 1211. [Google Scholar] [CrossRef]
- Bouhmala, N. How Good is the Euclidean Distance Metric for the Clustering Problem. In Proceedings of the 2016 5th IIAI International Congress on Advanced Applied Informatics (IIAI-AAI), Kumamoto, Japan, 10–14 July 2016 2016; pp. 312–315. [Google Scholar] [CrossRef]
- Chou, C.H.; Su, M.C.; Lai, E. Symmetry as a new measure for cluster validity. Recent Adv. Comput. Comput. Commun. 2002, 1, 209–213. [Google Scholar]
- Bohara, A.; Thakore, U.; Sanders, W.H. Intrusion detection in enterprise systems by combining and clustering diverse monitor data. In Proceedings of the Symposium and Bootcamp on the Science of Security, Pittsburgh, PA, USA, 19–21 April 2016; pp. 7–16. [Google Scholar] [CrossRef]
- Gan, J.; Tao, Y. DBSCAN Revisited. In Proceedings of the 2015 ACM SIGMOD International Conference on Management of Data, Melbourne, Australia, 31 May–4 June 2015; Volume 2015, pp. 519–530. [Google Scholar] [CrossRef]
- Schölkopf, B.; Platt, J.; Shawe-Taylor, J.; Smola, A.J.; Williamson, R.C. Estimating the Support of a High-Dimensional Distribution. Neural Comput. 2001, 13, 1443–1471. [Google Scholar] [CrossRef]
- Mukhopadhyay, I.; Chakraborty, M. EMID: A Novel Expectation Maximization based Intrusion Detection Algorithm. In Proceedings of the IEMCON 2011, Kolkata, India, 5–6 January 2011; pp. 500–505. [Google Scholar]
- Ran, J.; Ji, Y.; Tang, B. A Semi-Supervised Learning Approach to IEEE 802.11 Network Anomaly Detection. In Proceedings of the 2019 IEEE 89th Vehicular Technology Conference (VTC2019-Spring), Kuala Lumpur, Malaysia, 28 April–2 May 2019; pp. 1–5. [Google Scholar] [CrossRef]
- Salo, F.; Nassif, A.B.; Essex, A. Dimensionality reduction with IG-PCA and ensemble classifier for network intrusion detection. Comput. Netw. 2019, 148, 164–175. [Google Scholar] [CrossRef]
- Bergman, D.L. Symmetry Constrained Machine Learning. Adv. Intell. Syst. Comput. 2019, 1038, 501–512. [Google Scholar] [CrossRef] [Green Version]
- Umar, M.A.; Zhanfang, C.; Liu, Y. Network Intrusion Detection Using Wrapper-based Decision Tree for Feature Selection. In Proceedings of the 2020 International Conference on Internet Computing for Science and Engineering, Malé, Maldives, 14–16 January 2020; pp. 5–13. [Google Scholar] [CrossRef]
- Guyon, I.; Gunn, S.; Nikravesh, M.; Zadeh, L. Feature Extraction Foundations; Springer: Berlin/Heidelberg, Germany, 2006; pp. 1–8. [Google Scholar]
- Saba, T.; Sadad, T.; Rehman, A.; Mehmood, Z.; Javaid, Q. Intrusion Detection System Through Advance Machine Learning for the Internet of Things Networks. IT Prof. 2021, 23, 58–64. [Google Scholar] [CrossRef]
- Verma, A.; Ranga, V. Machine Learning Based Intrusion Detection Systems for IoT Applications. Wirel. Pers. Commun. 2020, 111, 2287–2310. [Google Scholar] [CrossRef]
- Demšar, J. Statistical comparisons of classifiers over multiple data sets. J. Mach. Learn. Res. 2006, 7, 1–30. [Google Scholar]
- Catal, C.; Nangir, M. A sentiment classification model based on multiple classifiers. Appl. Soft Comput. 2017, 50, 135–141. [Google Scholar] [CrossRef]
- Belouch, M.; Idhammad, M.; El, S. A Two-Stage Classifier Approach using RepTree Algorithm for Network Intrusion Detection. Int. J. Adv. Comput. Sci. Appl. 2017, 8, 389–394. [Google Scholar] [CrossRef] [Green Version]
- Golrang, A.; Golrang, A.M.; Yayilgan, S.Y.; Elezaj, O. A Novel Hybrid IDS Based on Modified NSGAII-ANN and Random Forest. Electronics 2020, 9, 577. [Google Scholar] [CrossRef] [Green Version]
Figure 1.
Summary of the benefits of feature selection.

Figure 2.
Normalized Confusion Metrics for all the three datasets. (A) Normalized Confusion Matrix on CIC-IDS2017; (B) Normalized Confusion Matrix on NSL-KDD; (C) Normalized Confusion Matrix on UNSW-NB15.
Figure 2.
Normalized Confusion Metrics for all the three datasets. (A) Normalized Confusion Matrix on CIC-IDS2017; (B) Normalized Confusion Matrix on NSL-KDD; (C) Normalized Confusion Matrix on UNSW-NB15.

Figure 3.
The Framework of the proposed HFS-KODE Ensemble Classifier.

Figure 4.
Evaluation of the proposed HFS with other methods. (A) Accuracy of the feature selection approaches; (B) detection rate of the feature selection approaches.
Figure 4.
Evaluation of the proposed HFS with other methods. (A) Accuracy of the feature selection approaches; (B) detection rate of the feature selection approaches.

Figure 5.
Evaluation of the proposed HFS with other methods. (A) False Alarm Rate of the feature selection; (B) F-Measure of the feature selection approaches.
Figure 5.
Evaluation of the proposed HFS with other methods. (A) False Alarm Rate of the feature selection; (B) F-Measure of the feature selection approaches.

Figure 6.
Evaluation of the proposed HFS with other methods. (A) Number of selected features of the feature selection approaches; (B) feature selection time of the feature selection approaches.
Figure 6.
Evaluation of the proposed HFS with other methods. (A) Number of selected features of the feature selection approaches; (B) feature selection time of the feature selection approaches.

Figure 7.
Evaluation of the proposed ensemble classification (KODE) with other classification methods. (A) F-measure of (KODE) with voting and other classification methods; (B) accuracy of (KODE) with voting and other classification methods.
Figure 7.
Evaluation of the proposed ensemble classification (KODE) with other classification methods. (A) F-measure of (KODE) with voting and other classification methods; (B) accuracy of (KODE) with voting and other classification methods.

Figure 8.
Evaluation of the proposed ensemble classification (KODE) with other classification methods. (A) Attack detection rate of (KODE) with voting and other classification methods; (B) False Alarm Rate of (KODE) with voting and other classification methods.
Figure 8.
Evaluation of the proposed ensemble classification (KODE) with other classification methods. (A) Attack detection rate of (KODE) with voting and other classification methods; (B) False Alarm Rate of (KODE) with voting and other classification methods.


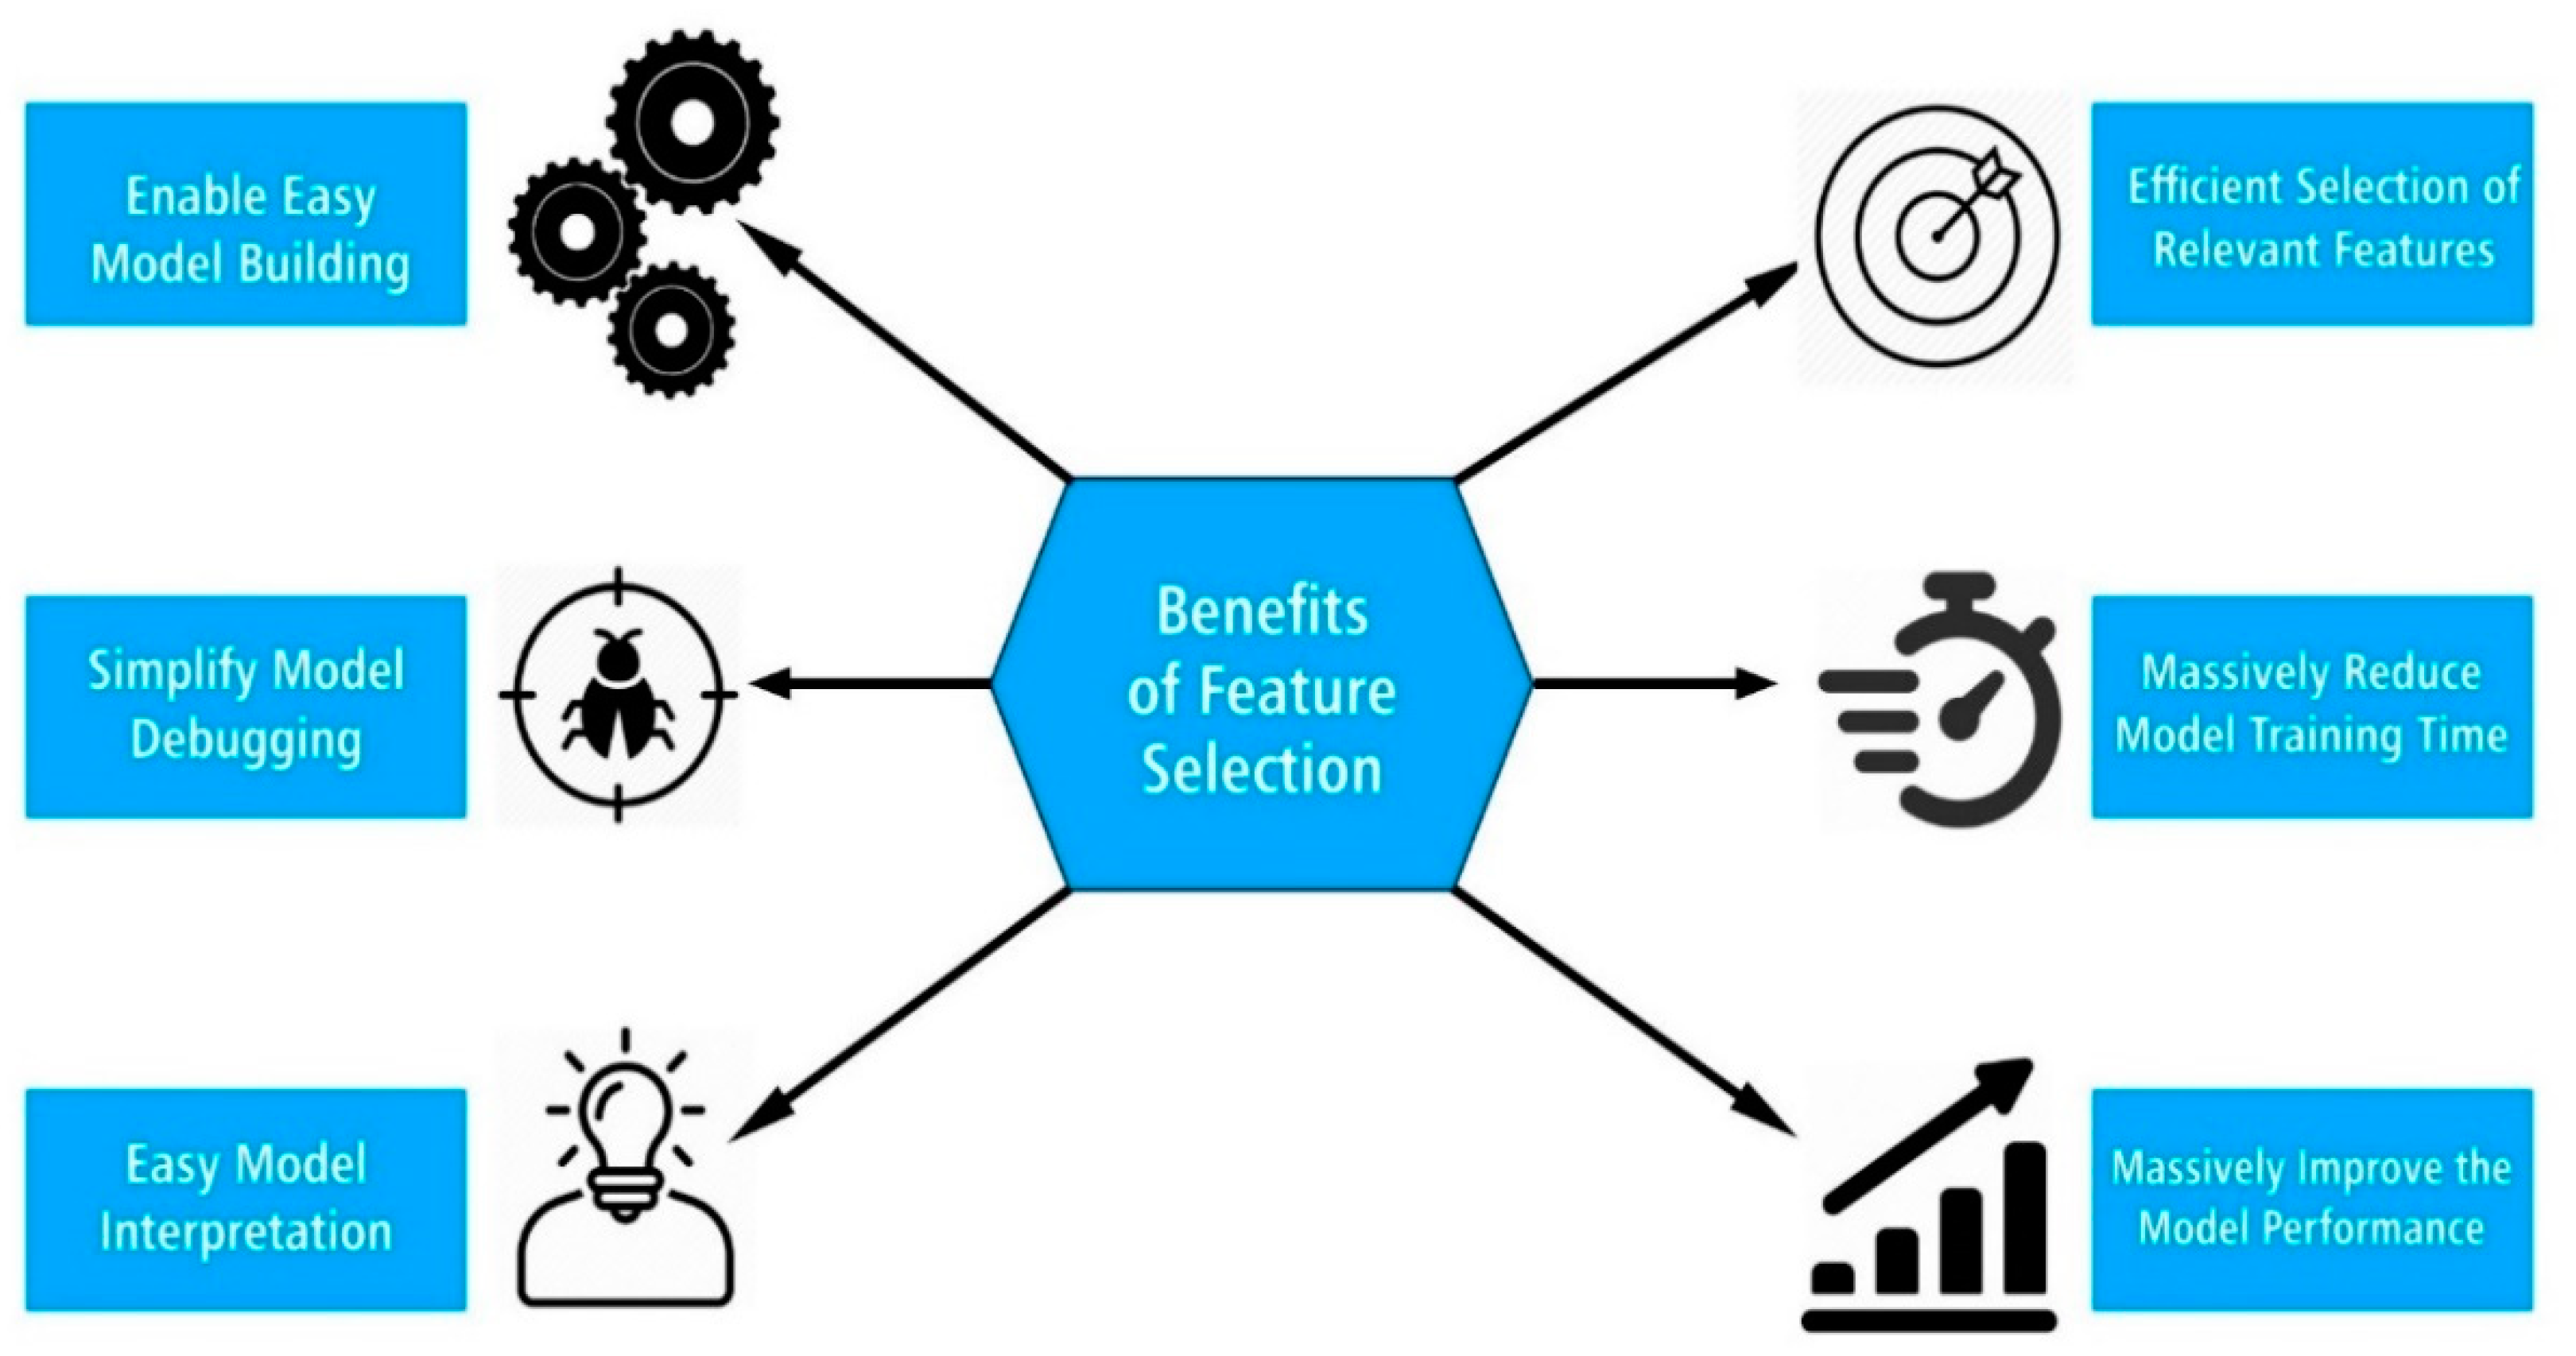
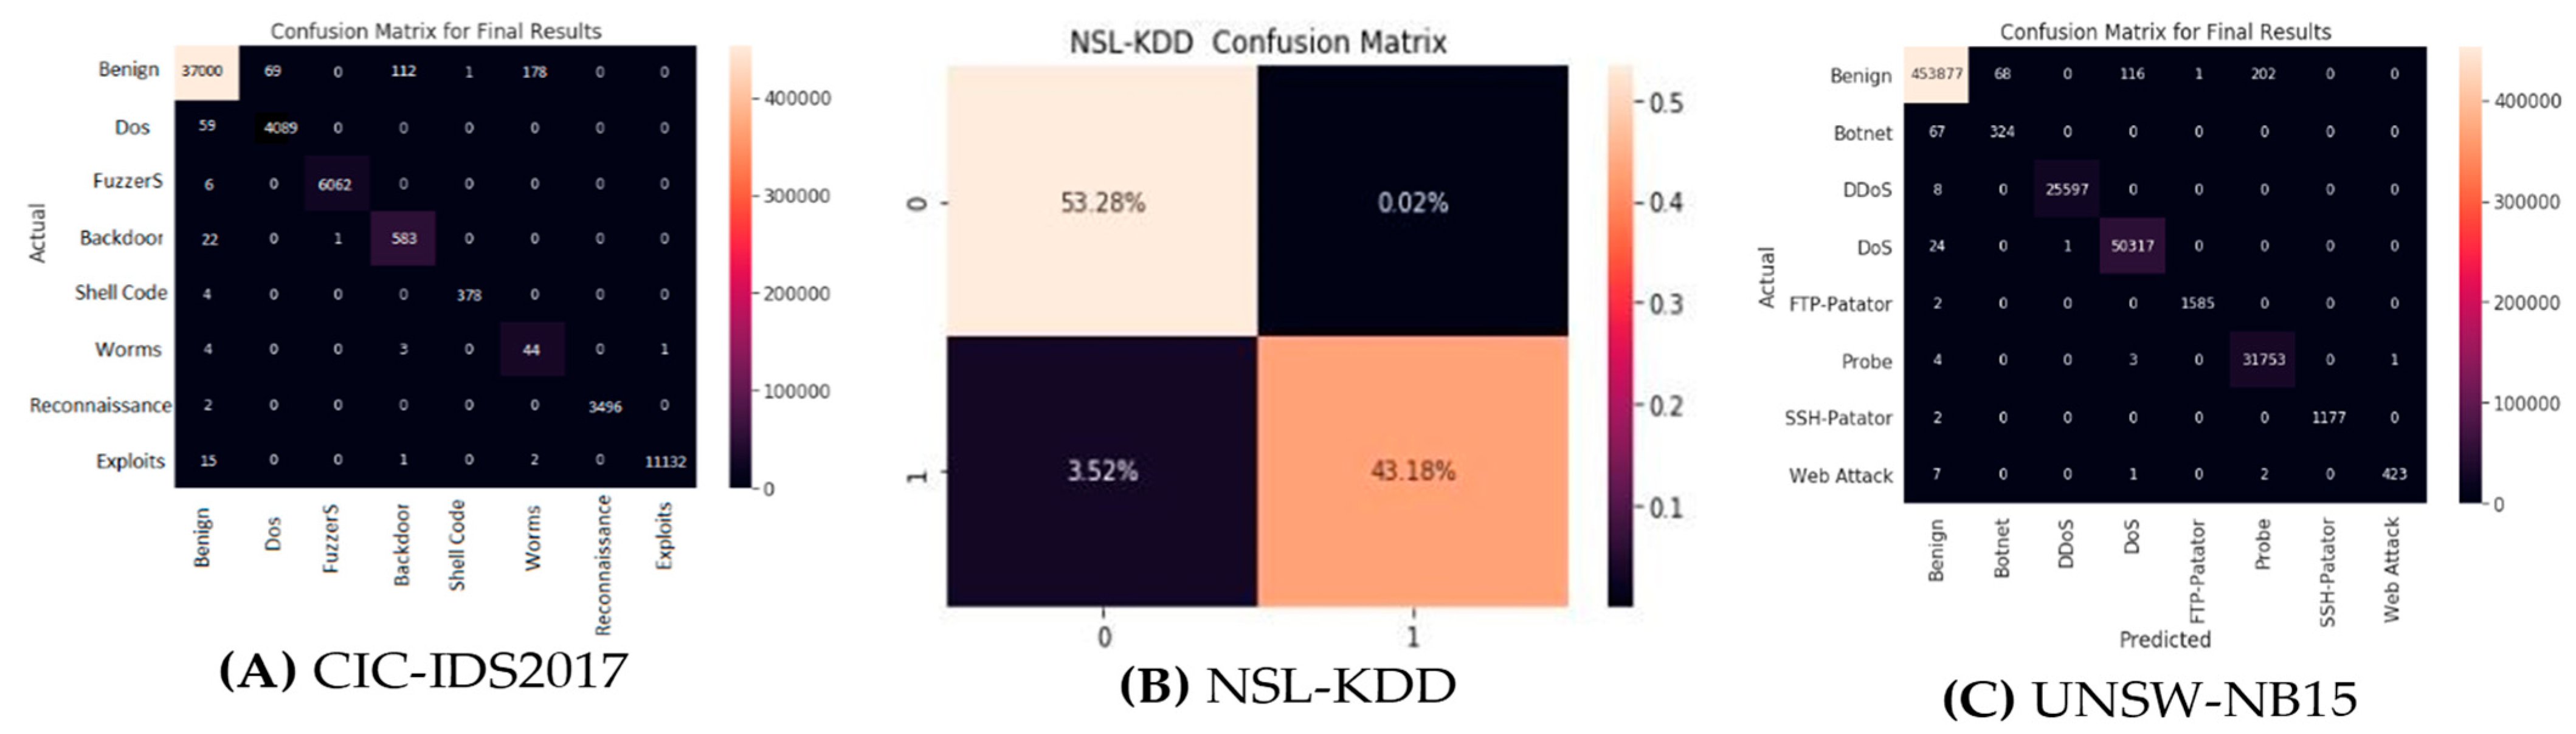
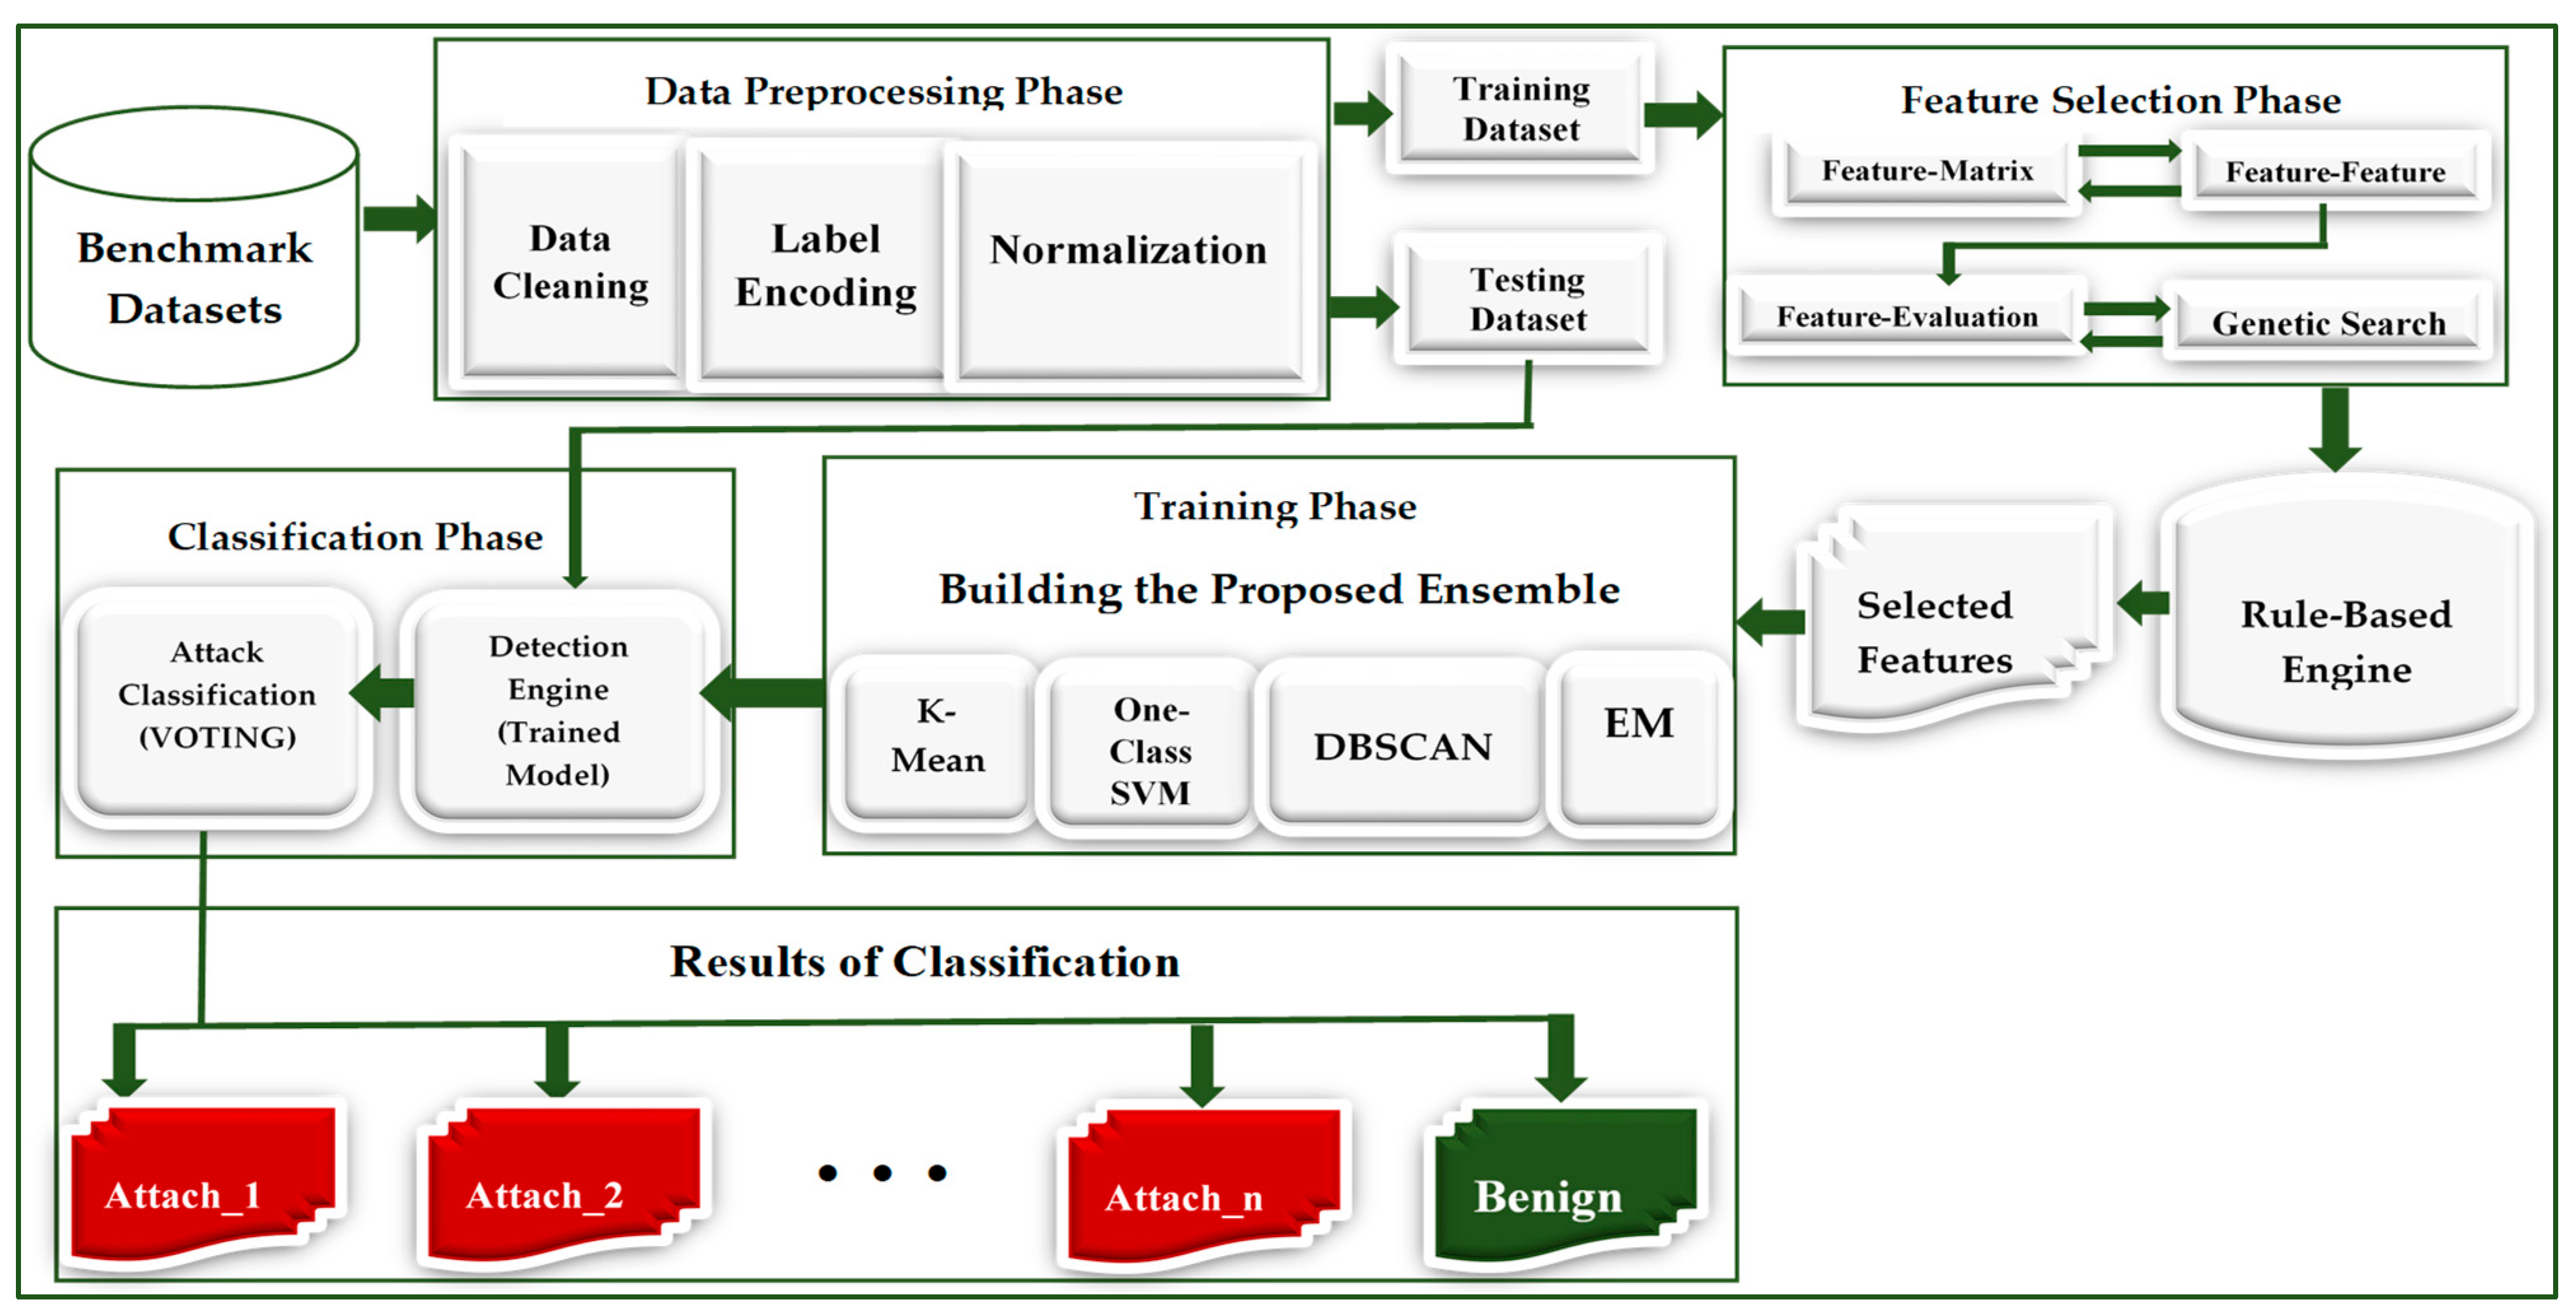
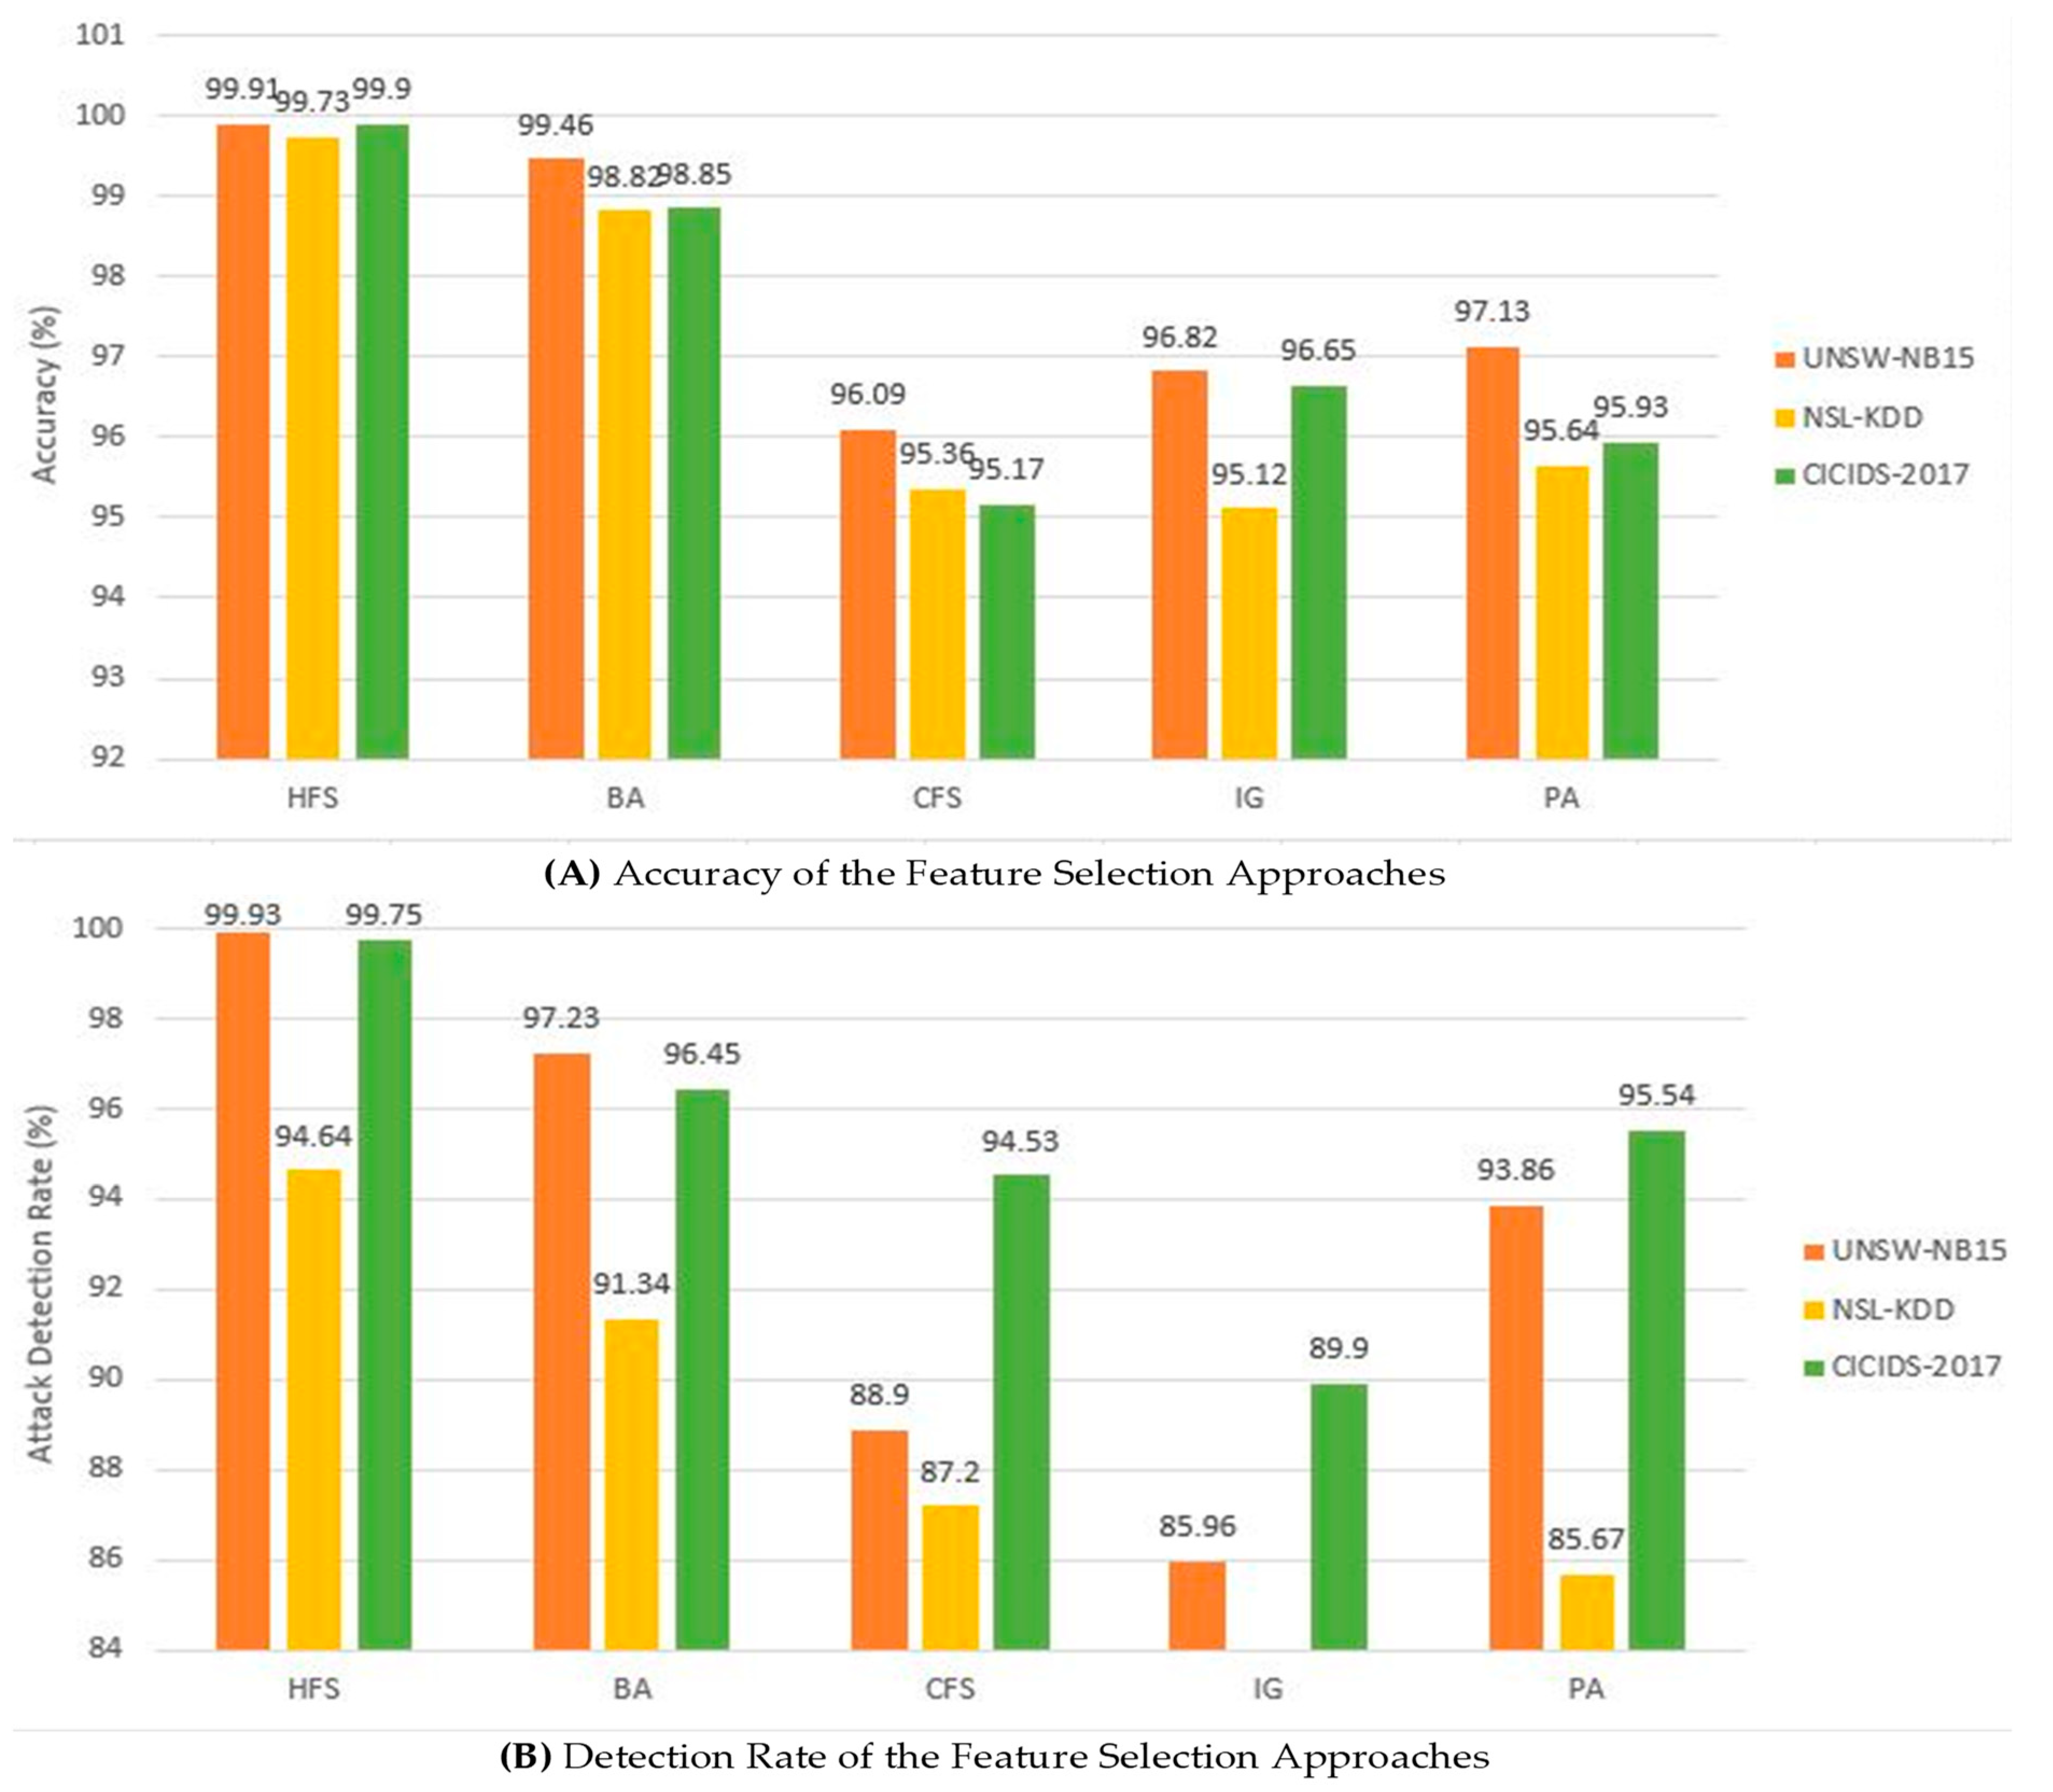
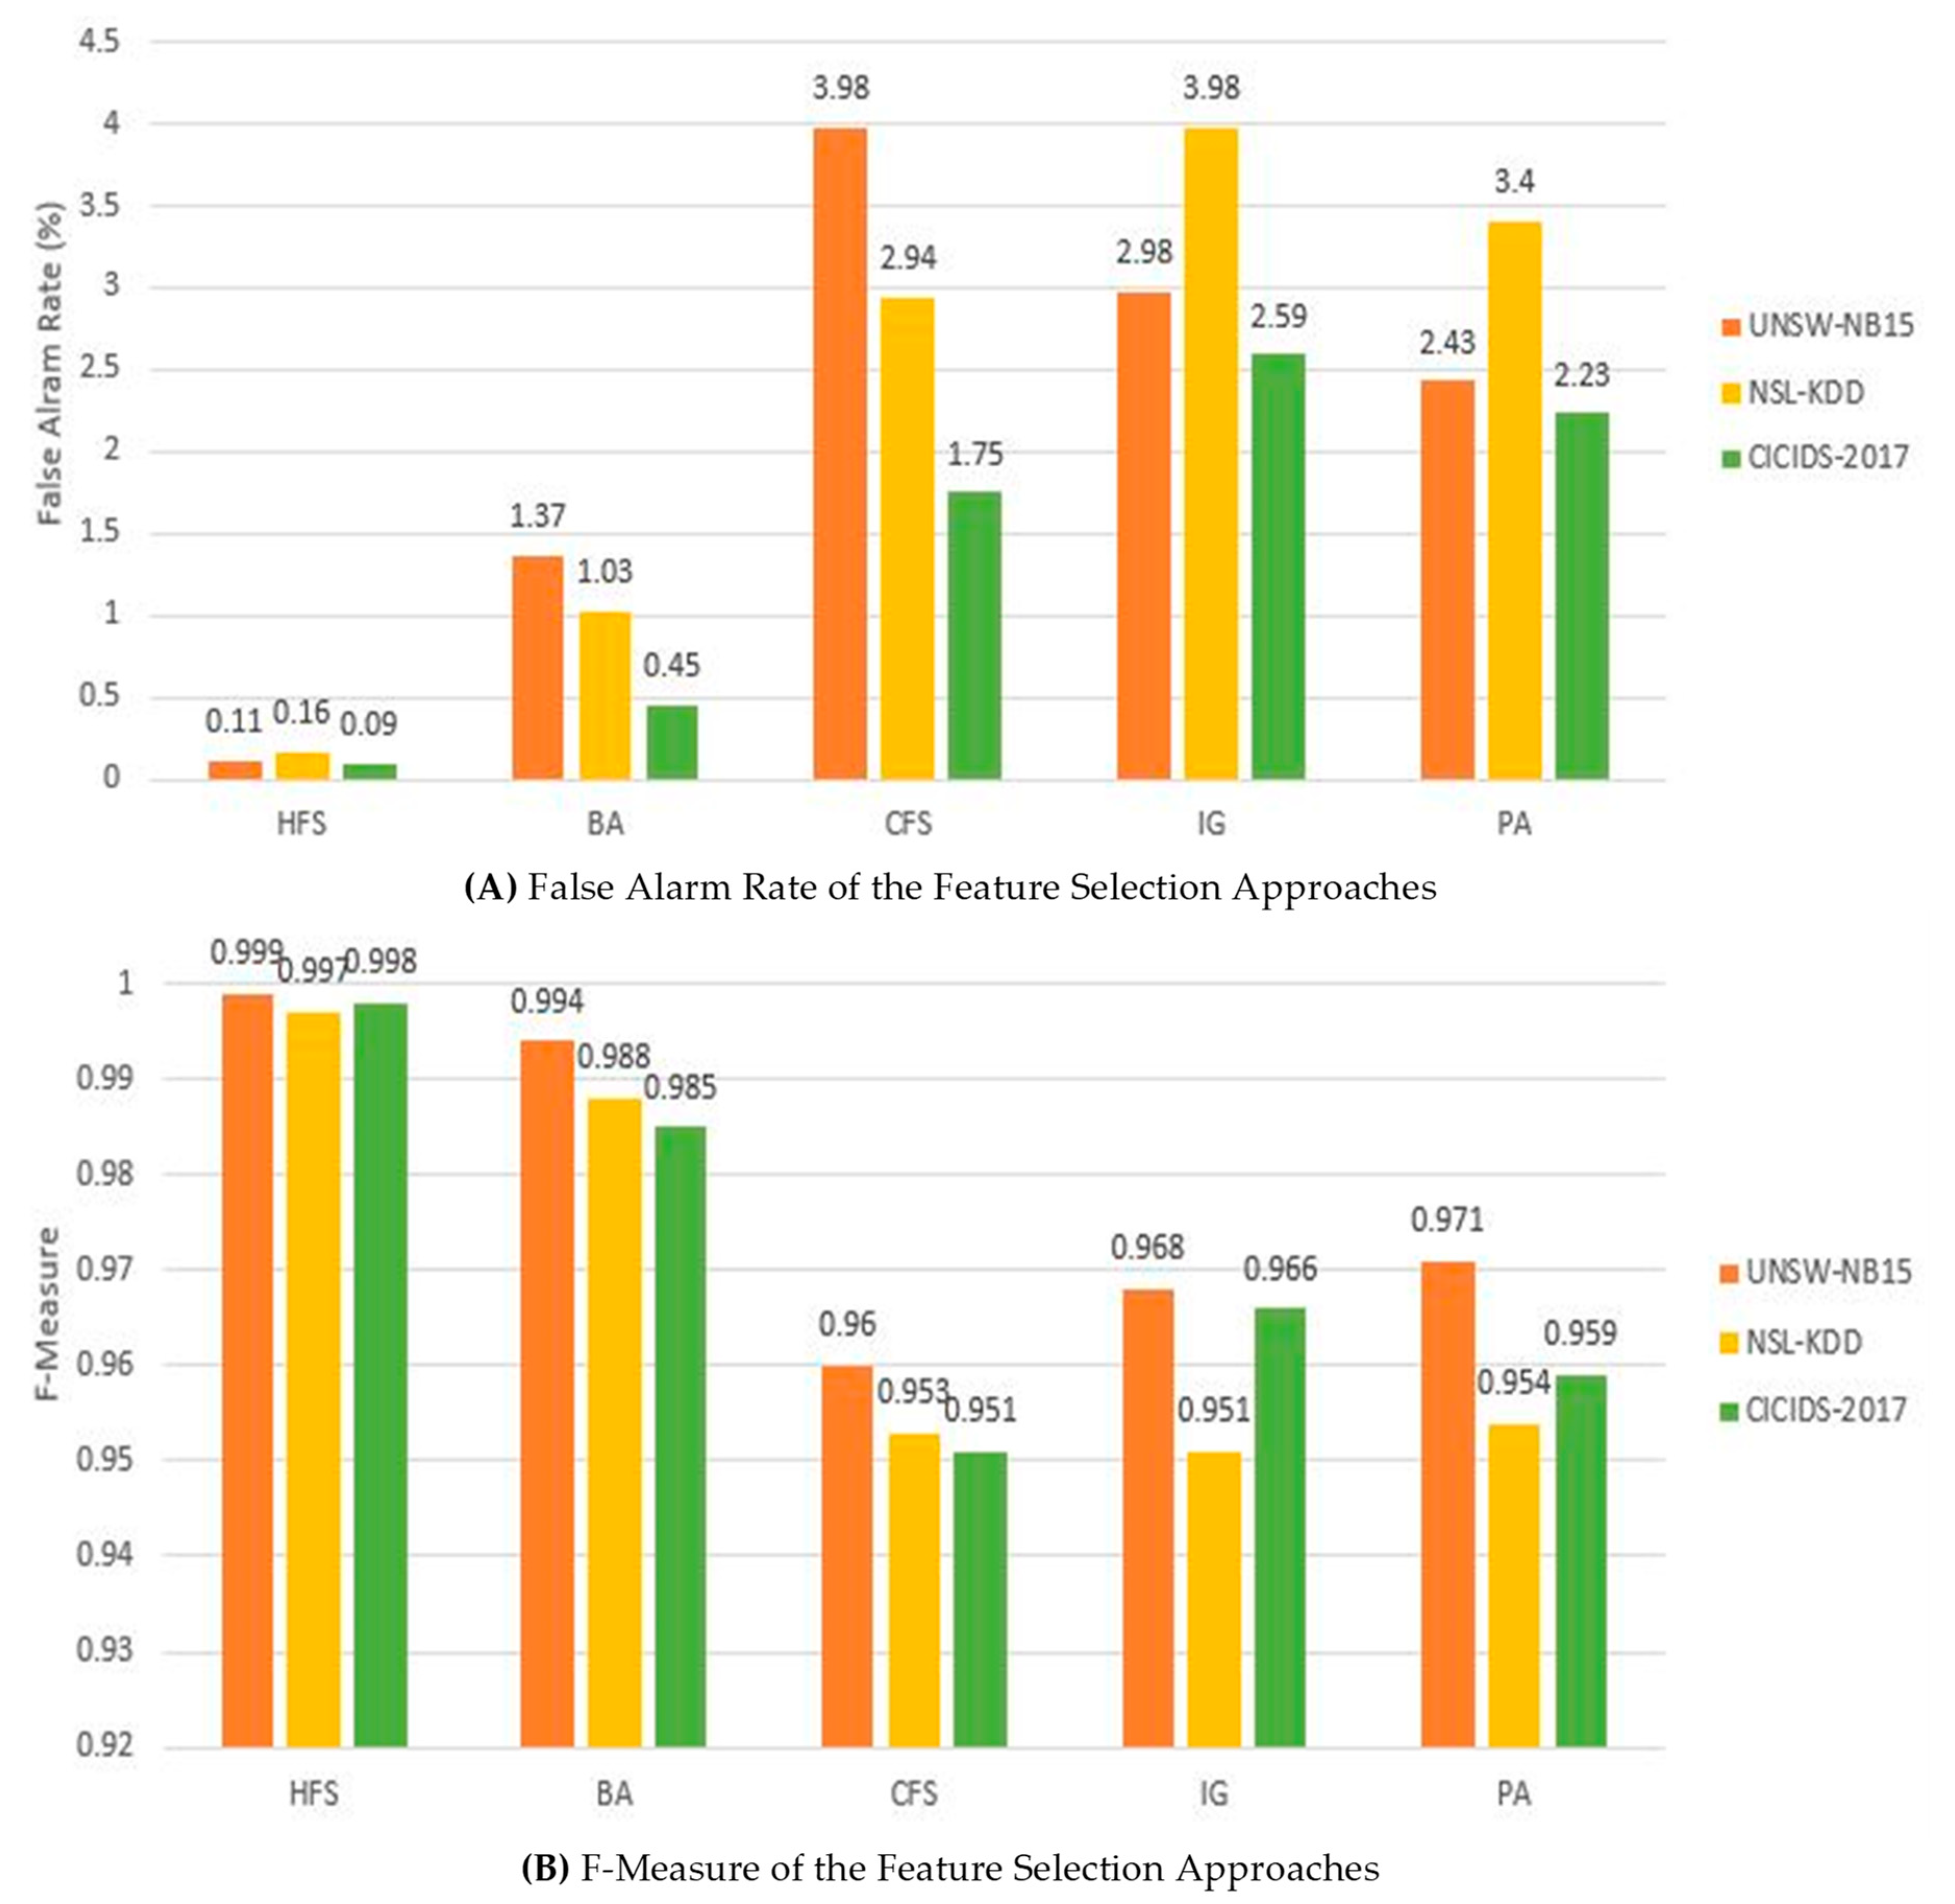
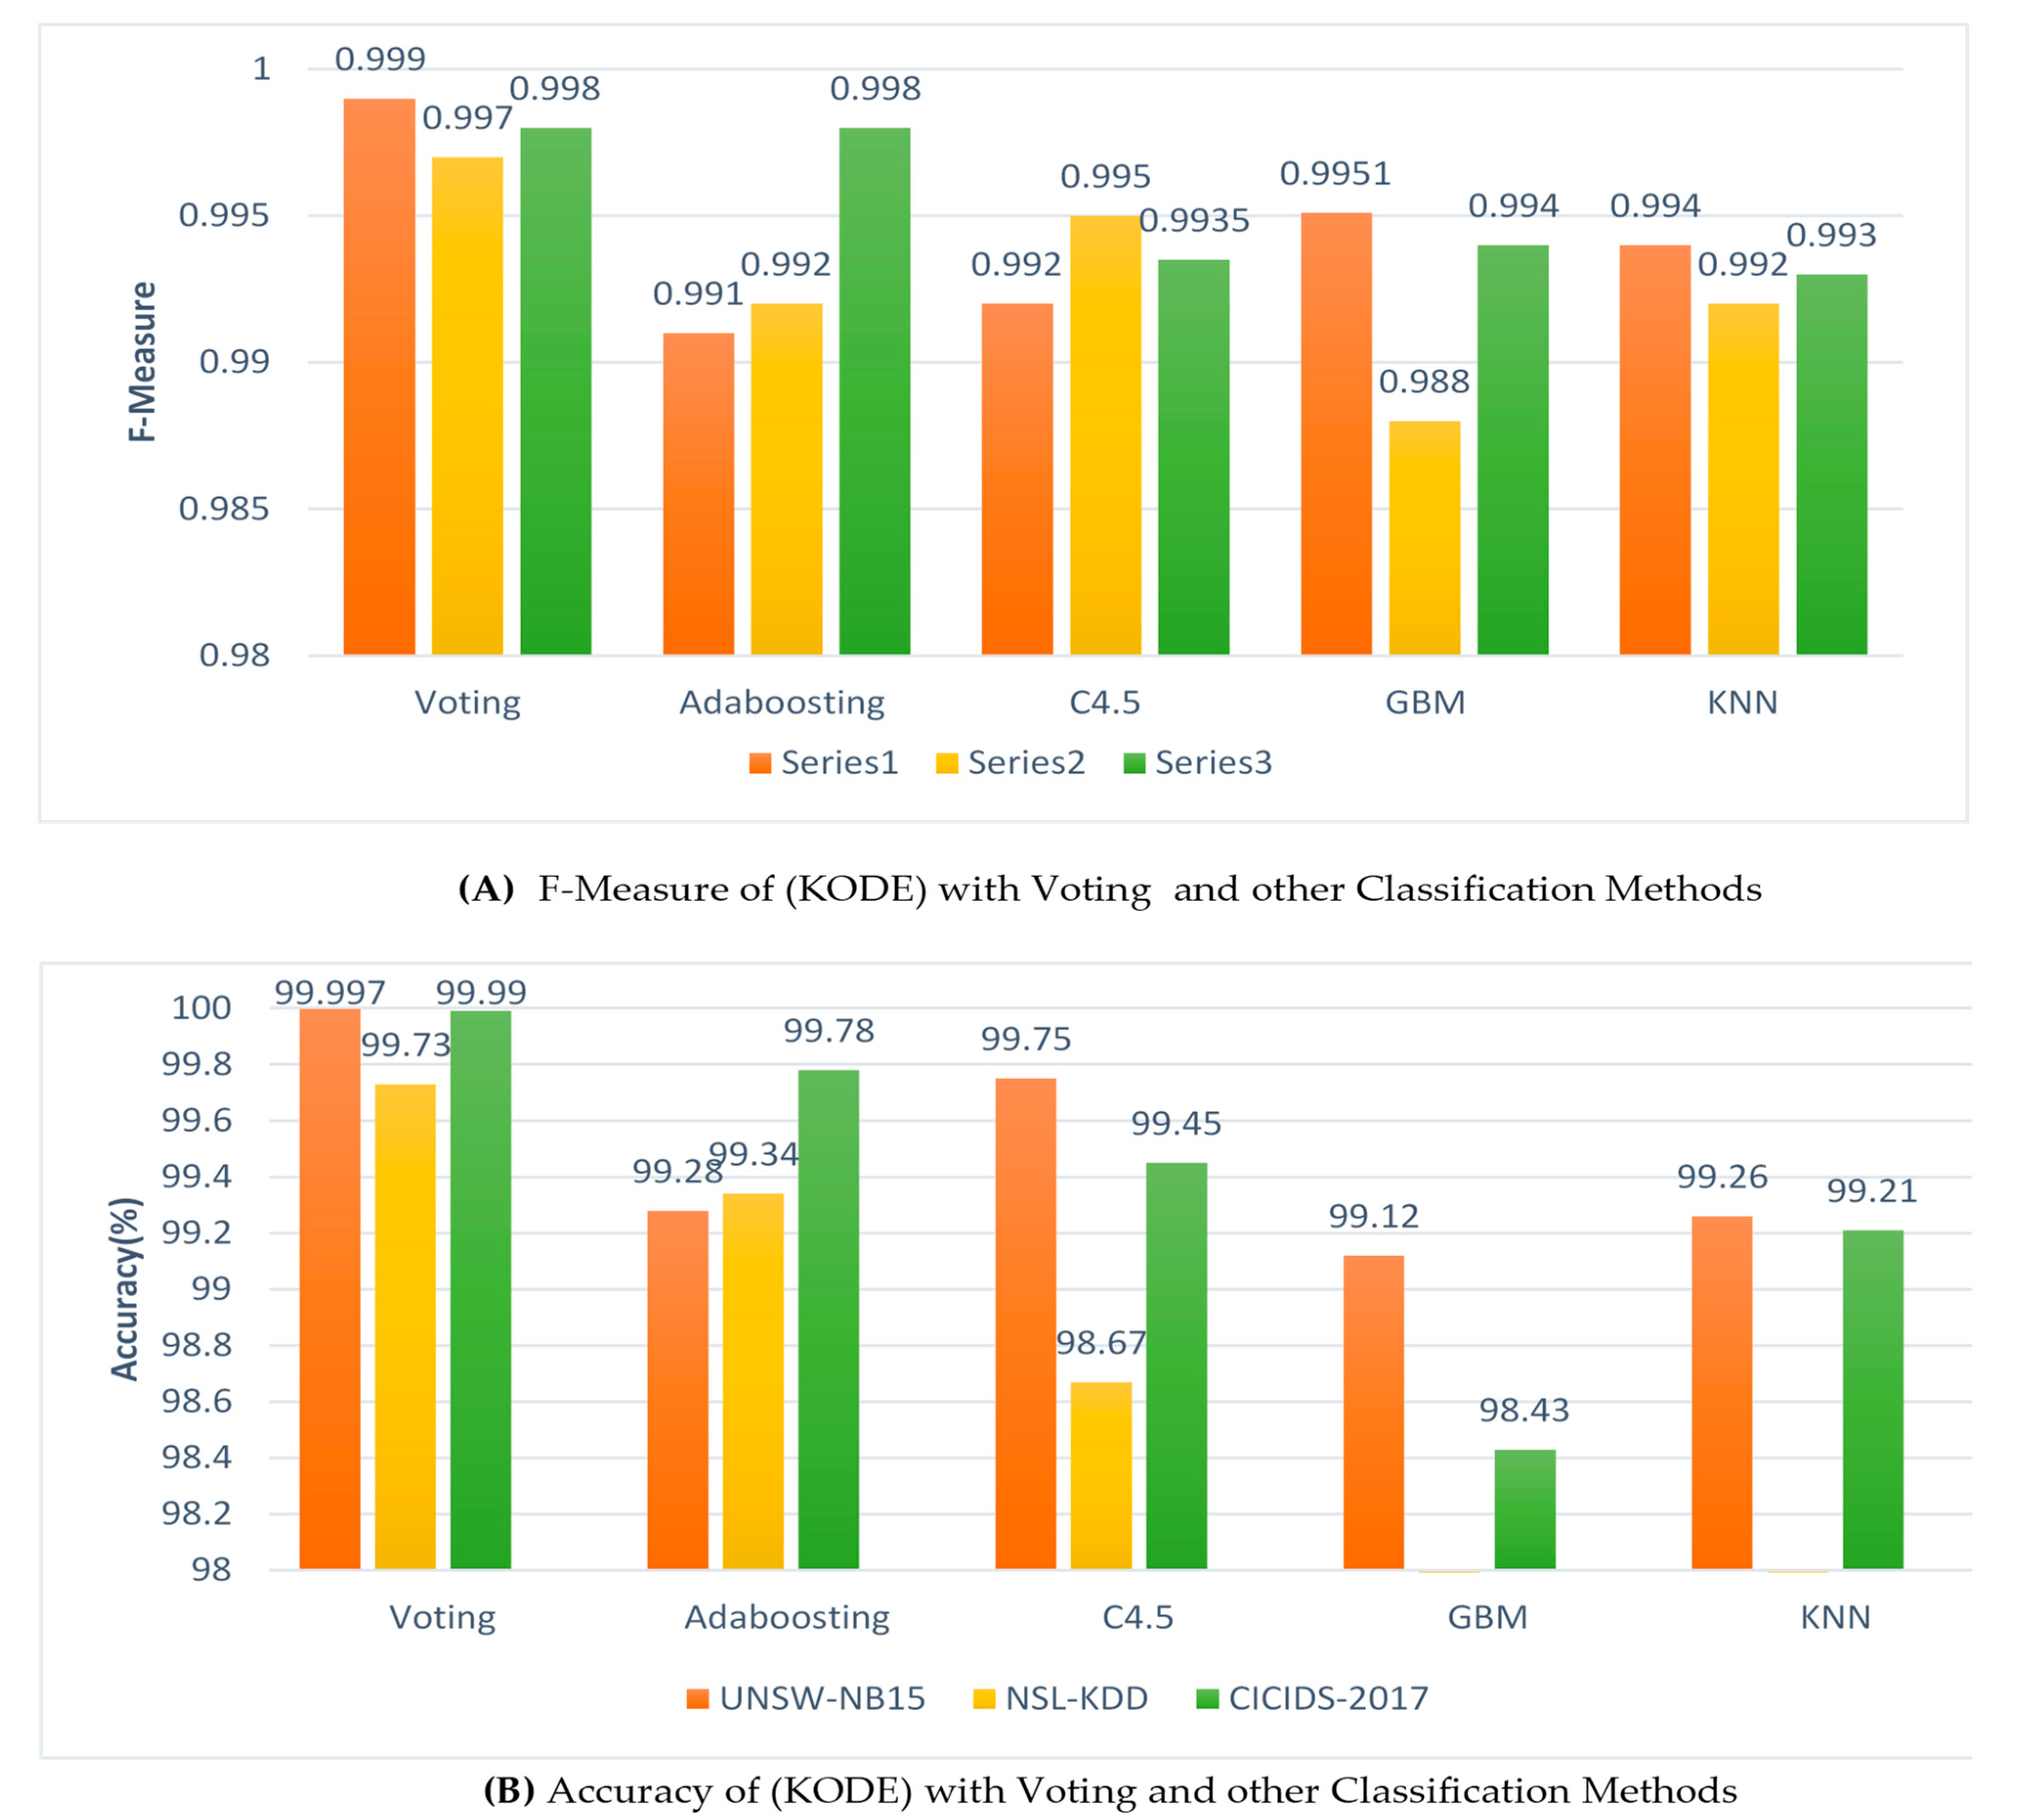
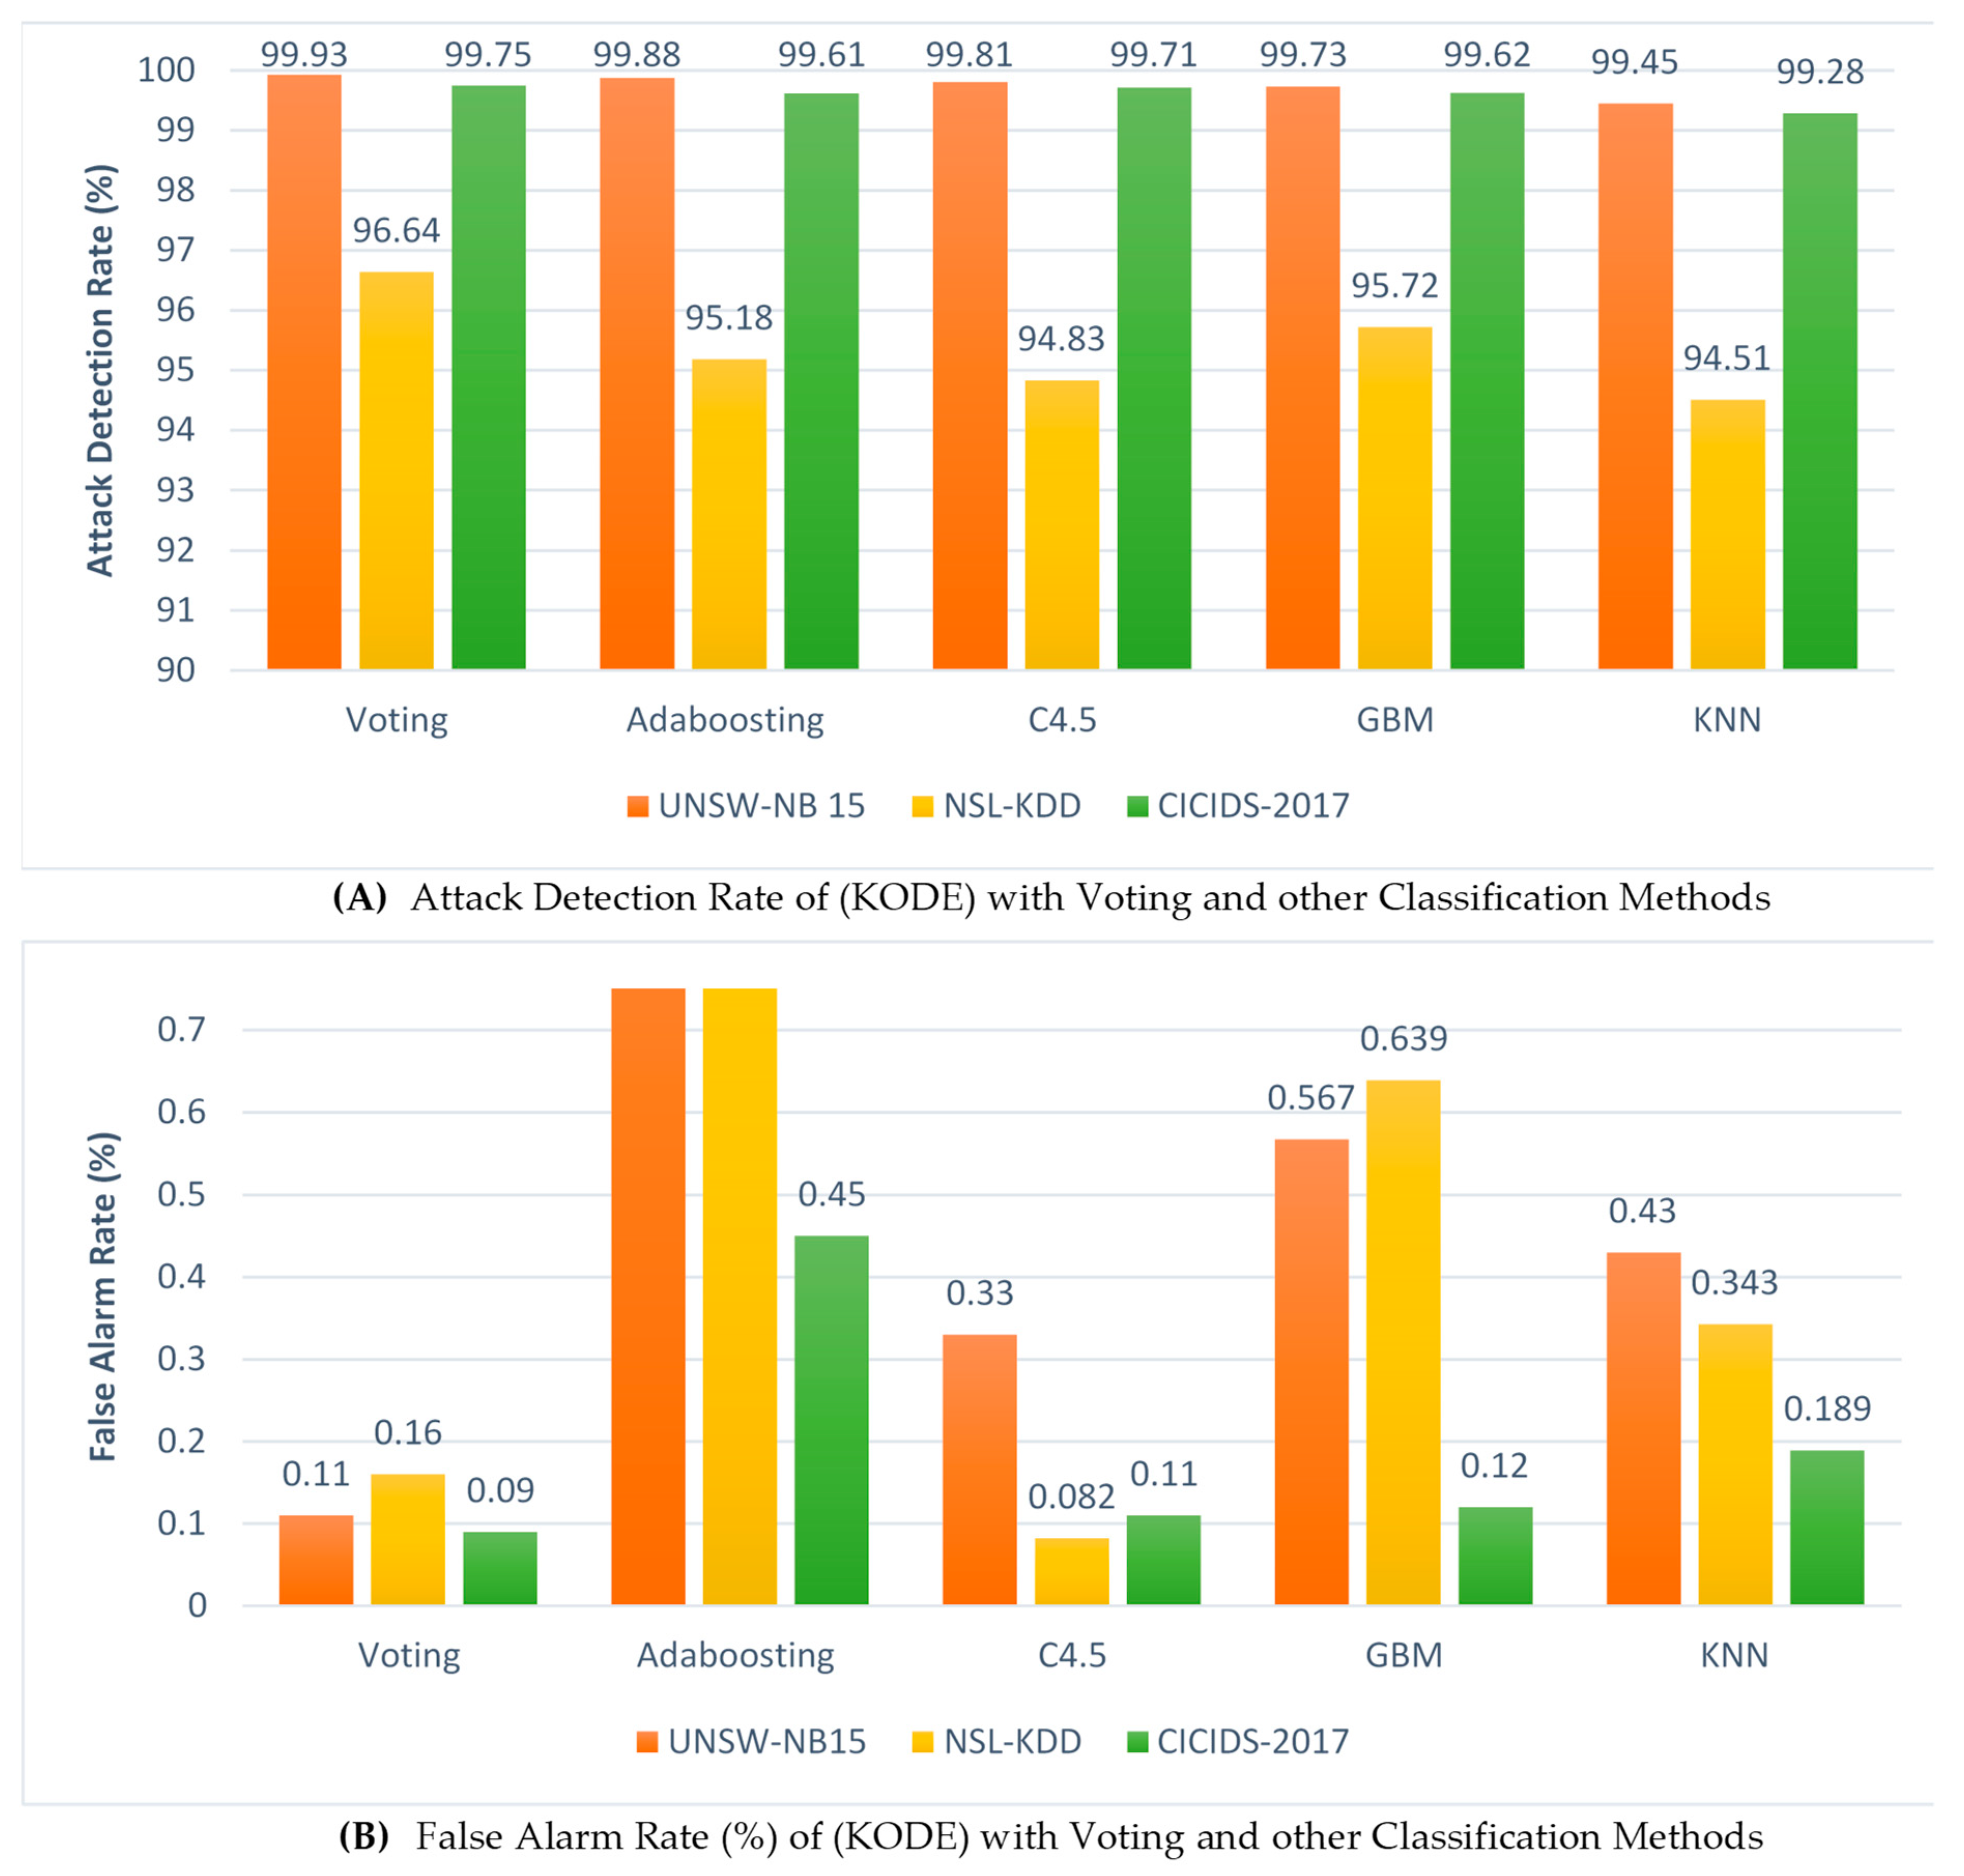
Table 1.
Statistics of CIC-IDS2017 dataset.
| Category | Training Set | Testing Set |
|---|---|---|
| Normal | 536,937 | 453,877 |
| Botnet | 1180 | 324 |
| DDoS | 34,880 | 25,597 |
| DoS | 60,765 | 50,317 |
| FTP_Patator | 4763 | 1585 |
| Probe | 36,176 | 31,753 |
| SSH_Patator | 3538 | 1177 |
| Web Attack | 4320 | 423 |
| Total Number of Records | 682,559 | 565,053 |
Table 2.
Statistics of UNSW-NB15 dataset.
| Category | Training Set | Testing Set |
|---|---|---|
| Normal | 56,000 | 37,000 |
| Attacks | 119,341 | 45,332 |
| Total Number of Records | 175,341 | 82,332 |
Table 3.
Statistics of NSL-KDD dataset.
| Category | Training Set | Testing Set |
|---|---|---|
| Normal | 67,343 | 45,000 |
| Attack | 80,046 | 2600 |
| Total Number of Records | 125,973 | 47,600 |
Table 4.
Steps of the proposed feature selection model.
| 01 Discovering correlation of feature subsets for classification. |
| 02 Selecting feature subsets with a stronger correlation. |
| 03 Compute the value of fitness for chosen feature subsets. |
| 04 Return the feature subsets with the most elevated fitness score. |
| 05 If two feature subsets have a similar value of fitness score, return a subset that has the lowest features count. |
| 06 Applying the proposed Ensemble system (KODE) on the chosen feature subsets to categorize or classify the attacks. |
Table 5.
Selected features of the NSL KDD, CIC-IDS 2017 and UNSW-NB15 datasets.
| NSL KDD | CIC-IDS 2017 | UNSW-NB15 | |||
|---|---|---|---|---|---|
| No | Feature Name | No | Feature Name | No | Feature Name |
| f_4 | flag | f_2 | Bwd.Packet.Length.Min | f_2 | dur |
| f_5 | Src_ bytes | f_3 | Fwd.Packet.Length.Min | f_3 | xport |
| f_6 | Dst_bytes | f_6 | Total.Length.of.Bwd.Packets | f_4 | xserv |
| f_15 | Min.Packet.Length | f_15 | Flow Bytes/s | f_23 | dwin |
| f_17 | radiotap.channel.type.cc | f_17 | Flow IAT Max | f_25 | tcprtt |
| f_26 | srv_serror-rate | f_21 | Subflow.Fwd.Bytes | f_27 | synack |
| f_30 | diff_ srv_ rate | f_14 | Min.Packet.Length | f_28 | ackdat |
| f_29 | same_sev_rate | f_12 | Bwd.Packet.Length.Std | f_30 | trans_dept |
| f_13 | Bwd.Packet.s | f_31 | resp_body_len35ct_srv_src | ||
| f_30 | dest_host_srv_diff_host_rate | f_36 | ct_state_ttl | ||
| f_39 | dest_host_srv_serror_rate | f_43 | attack_cat | ||
| f_45 | Down/Up Ratio | ||||
| f_59 | Idle Max | ||||
Table 6.
A taxonomy of Classical Intrusion Detection System.
| Class | Actual | Predicted | Description |
|---|---|---|---|
| True Negative | (+) | (+) | An instance classified as a legitimate network traffic. |
| False Positives | (+) | (-) | A legitimate network traffic flagged as an attack, an existing massive challenge in anomaly IDS. |
| False Negative | (-) | (+) | Unfortunate cases of classifying a malicious network traffic as a legitimate traffic, equally a huge challenge. |
| True Positive | (-) | (-) | Malicious network traffic successfully flagged as an attack. |
Where (+) represents a normal instances, and (-) represents an attack or anomalous instances.
Table 7.
Performance analysis for NSL-KDD with no feature selection on the test dataset.
| Classifier | Accuracy | DR | FAR | Precision | F-Measure | Building (S) | Testing (S) |
|---|---|---|---|---|---|---|---|
| K-mean | 95.34 | 0.996 | 0.133 | 0.913 | 0.952 | 12 | 531.6 |
| OneClass SVM | 86.03 | 0.86 | 0.089 | 0.804 | 0.832 | 128.4 | 1656.6 |
| DBSCAN | 82.27 | 0.827 | 0.128 | 0.827 | 0.823 | 235.2 | 7.8 |
| EM | 61.06 | 0.62 | 0.61 | 0.86 | 0.74 | 65.4 | 671.4 |
| KODE | 92.03 | 0.9 | 0.09 | 0.902 | 0.903 | 441.6 | 2140.2 |
| (A). Performance Analysis for NSL-KDD with Eight (8) Selected Features on the Test Dataset | |||||||
| K-mean | 99.72 | 0.997 | 0.011 | 0.992 | 0.992 | 154.2 | 213.6 |
| One-Class SVM | 98.82 | 0.988 | 0.012 | 0.992 | 0.99 | 3 | 21 |
| DBSCAN | 98.66 | 0.986 | 0.014 | 0.986 | 0.985 | 79.2 | 9 |
| EM | 71.03 | 0.71 | 0.012 | 0.714 | 0.78 | 54 | 212.4 |
| KODE | 99.73 | 0.999 | 0.01 | 0.992 | 0.993 | 120 | 208.8 |
Table 8.
Performance evaluations for CIC-IDS2017 dataset with NO feature selection on the test dataset.
Table 8.
Performance evaluations for CIC-IDS2017 dataset with NO feature selection on the test dataset.
| Classifier | Accuracy | DR | FAR | Precision | F-Measure | Building (S) | Testing (S) |
|---|---|---|---|---|---|---|---|
| K-mean | 97.89 | 0.978 | 0.129 | 0.907 | 0.971 | 394.2 | 3669 |
| One-Class SVM | 96.23 | 0.809 | 0.049 | 0.956 | 0.947 | 32.4 | 4880.4 |
| DBSCAN | 81.24 | 0.824 | 0.106 | 0.803 | 0.812 | 185.4 | 25.8 |
| EM | 79.21 | 0.78 | 0.102 | 0.789 | 0.792 | 125.4 | 24.6 |
| KODE | 89.15 | 0.891 | 0.012 | 0.908 | 0.889 | 217.2 | 4958.4 |
| (A). Performance Evaluations for CIC-IDS2017 with Thirteen (13) Selected Features on the Test Dataset | |||||||
| K-mean | 99.72 | 0.997 | 0.011 | 0.992 | 0.992 | 154.2 | 213.6 |
| One-Class SVM | 98.92 | 0.989 | 0.011 | 0.982 | 0.99 | 3 | 21 |
| DBSCAN | 97.76 | 0.977 | 0.012 | 0.986 | 0.985 | 79.2 | 9 |
| EM | 95.32 | 0.952 | 0.013 | 0.96 | 0.949 | 87.6 | 10.2 |
| KODE | 99.99 | 0.997 | 0.011 | 0.992 | 0.993 | 120 | 208.8 |
Table 9.
Performance comparisons for UNSW-NB15 dataset with NO feature selection on the test dataset.
Table 9.
Performance comparisons for UNSW-NB15 dataset with NO feature selection on the test dataset.
| Classifier | Accuracy | DR | FAR | Precision | F-Measure | Building (S) | Testing (S) |
|---|---|---|---|---|---|---|---|
| K-mean | 96.79 | 0.967 | 0.121 | 0.965 | 0.967 | 94.2 | 189 |
| One-Class SVM | 96.23 | 0.962 | 0.051 | 0.962 | 0.962 | 30.6 | 307.2 |
| DBSCAN | 81.22 | 0.812 | 0.103 | 0.812 | 0.812 | 48.72 | 72.6 |
| EM | 84.56 | 0.85 | 0.012 | 0.845 | 0.841 | 50.7 | 79.2 |
| KODE | 89.85 | 0.898 | 0.011 | 0.898 | 0.898 | 217.2 | 192 |
| (A). Performance comparisons for UNSW-NB15 with eleven (11) selected features on the test dataset | |||||||
| K-mean | 99.92 | 0.992 | 0.08 | 0.992 | 0.992 | 155.4 | 210.6 |
| One-Class SVM | 97.92 | 0.972 | 0.07 | 0.979 | 0.97 | 0.6 | 23.4 |
| DBSCAN | 98.76 | 0.987 | 0.011 | 0.987 | 0.985 | 78.6 | 129 |
| EM | 96.34 | 0.963 | 0.012 | 0.963 | 0.963 | 73.8 | 122.4 |
| KODE | 99.99 | 0.99 | 0.01 | 0.99 | 0.99 | 120 | 204.6 |
Table 10.
Accuracy comparison of different combination rules based on the NSL_KDD test dataset.
| Attack Type | Average of Probabilities | Majority Voting | Product of Probability | Minimum Probability | Maximum Probability |
|---|---|---|---|---|---|
| Normal | 99.91 | 99.89 | 97.19 | 97.56 | 98.45 |
| Dos | 99.09 | 99.78 | 99.01 | 99.31 | 99.01 |
| PROBE | 99.58 | 97.57 | 96.45 | 96.13 | 97.32 |
| R2L | 96.57 | 96.67 | 95.60 | 90.51 | 90.56 |
| U2R | 67.90 | 72.34 | 54.10 | 52.68 | 50.92 |
Table 11.
Accuracy comparison of different combination rules on the UNSW-NB15 test dataset.
| Attack Type | Average of Probabilities | Majority Voting | Product of Probability | Minimum Probability | Maximum Probability |
|---|---|---|---|---|---|
| Benign | 99.97 | 99.89 | 97.19 | 95.09 | 94.45 |
| DoS | 99.20 | 98.79 | 99.01 | 97.09 | 96.01 |
| Fuzzers | 98.94 | 97.89 | 96.15 | 94.07 | 93.32 |
| Analysis | 97.30 | 96.67 | 95.30 | 90.51 | 90.32 |
| Backdoor | 99.34 | 98.01 | 97.54 | 95.43 | 94.92 |
| Generic | 89.34 | 87.89 | 87.19 | 85.50 | 80.32 |
| Shellcode | 82.83 | 82.34 | 80.23 | 78.12 | 75.65 |
| Worms | 97.09 | 96.78 | 94.90 | 92.13 | 89.90 |
| Reconnaissance | 78.09 | 77.23 | 75.23 | 74.21 | 71.65 |
| Exploits | 69.12 | 68.67 | 54.56 | 50.32 | 48.43 |
Table 12.
Accuracy comparison of different combination rules on the CIC-IDS2017 test dataset.
| Attack Type | Average of Probabilities | Majority Voting | Product of Probability | Minimum Probability | Maximum Probability |
|---|---|---|---|---|---|
| Benign | 99.96 | 99.67 | 98.10 | 96.90 | 95.68 |
| Botnet | 99.15 | 98.34 | 96.98 | 95.90 | 93.41 |
| DDoS | 99.99 | 99.04 | 97.94 | 96.07 | 95.33 |
| DoS | 98.89 | 96.89 | 95.32 | 94.53 | 92.90 |
| FTP_Patator | 99.09 | 97.89 | 97.54 | 96.42 | 94.92 |
| Probe | 89.34 | 87.85 | 86.78 | 85.55 | 83.32 |
| SSH_Patator | 81.85 | 79.86 | 78.69 | 76.16 | 75.56 |
| Web Attack | 99.97 | 97.73 | 94.89 | 92.56 | 90.90 |
Table 13.
Comparison of current intrusion detection approaches with proposed approach.
| IDS Models | Utilized Dataset | Feature Selection | Base Classifier Used | FAR (%) | ACC (%) | DR (%) |
|---|---|---|---|---|---|---|
| [20] | CIC-IDS2018 | Spearman’s rank correlation | LR, DT, and GB | N/A | 98.8 | N/A |
| [84] | NSL-KDD | Information Gain | RepTree | N/A | 89.85 | N/A |
| [84] | UNSW-NB15 | Information Gain | RepTree | N/A | 88.95 | N/A |
| [60] | NSL-KDD | IG-Filters | Voting (Random Forest, and PART) | 0.01 | 86.697 | NA |
| [50] | UNSW-NB15 and KDD99 | Wrapper (GA-LR) | C4.5, NBTree, and Random Forest Algorithm | 0.105 | 99.90 | 99.81 |
| [78] | UNSW-NB15 | DT-based | ANN, SVM, KNN, RF and NB | 27.73 | 86.41 | 97.95 |
| [34] | NSL-KDD | Manually selected | Bagging(REPTree) | 0.148 | 81.2988 | N/A |
| [85] | NSL-KDD | NSGAII-ANN | Random Forest | 6.00 | 99.4 | N/A |
| [85] | UNSW-NB15 | NSGAII-ANN | Random Forest | 6.00 | 94.8 | N/A |
| Proposed (KODE) | CIC-IDS2017 | HFS | Voting (K-means, One-Class SVM, DBSCAN, EM) | 0.09 | 99.99 | 99.75 |
| Proposed (KODE) | NSL-KDD | HFS | Voting (K-means, One-Class SVM, DBSCAN, EM) | 0.16 | 99.73 | 96.64 |
| Approach (KODE) | UNSW-NB15 | HFS | Voting (K-means, One-Class SVM, DBSCAN, EM) | 0.11 | 99.997 | 99.93 |
Publisher’s Note: MDPI stays neutral with regard to jurisdictional claims in published maps and institutional affiliations. |
© 2021 by the authors. Licensee MDPI, Basel, Switzerland. This article is an open access article distributed under the terms and conditions of the Creative Commons Attribution (CC BY) license (https://creativecommons.org/licenses/by/4.0/).
Share and Cite
MDPI and ACS Style
Jaw, E.; Wang, X. Feature Selection and Ensemble-Based Intrusion Detection System: An Efficient and Comprehensive Approach. Symmetry 2021, 13, 1764. https://doi.org/10.3390/sym13101764
AMA Style
Jaw E, Wang X. Feature Selection and Ensemble-Based Intrusion Detection System: An Efficient and Comprehensive Approach. Symmetry. 2021; 13(10):1764. https://doi.org/10.3390/sym13101764
Chicago/Turabian StyleJaw, Ebrima, and Xueming Wang. 2021. "Feature Selection and Ensemble-Based Intrusion Detection System: An Efficient and Comprehensive Approach" Symmetry 13, no. 10: 1764. https://doi.org/10.3390/sym13101764
Note that from the first issue of 2016, this journal uses article numbers instead of page numbers. See further details here.