Article

Cell-Adapted Mutations and Antigenic Diversity of Influenza B Viruses in Missouri, 2019–2020 Season

1
Center for Influenza and Emerging Infectious Diseases, University of Missouri, Columbia, MO 65211, USA
2
Department of Molecular Microbiology and Immunology, School of Medicine, University of Missouri, Columbia, MO 65211, USA
3
Bond Life Sciences Center, University of Missouri, Columbia, MO 65211, USA
4
Institute for Data Science and Informatics, University of Missouri, Columbia, MO 65211, USA
5
Department of Family and Community Medicine, School of Medicine, University of Missouri, Columbia, MO 65211, USA
6
Viral Diseases Branch, Walter Reed Army Institute of Research, Silver Spring, MD 20910, USA
7
Department of Electrical Engineering & Computer Science, College of Engineering, University of Missouri, Columbia, MO 65211, USA
*
Author to whom correspondence should be addressed.
Viruses 2021, 13(10), 1896; https://doi.org/10.3390/v13101896
Submission received: 28 July 2021 / Revised: 12 September 2021 / Accepted: 16 September 2021 / Published: 22 September 2021
(This article belongs to the Special Issue Non-A Influenza 2.0)

Abstract

:
Influenza B viruses (IBVs) are causing an increasing burden of morbidity and mortality, yet the prevalence of culture-adapted mutations in human seasonal IBVs are unclear. We collected 368 clinical samples from patients with influenza-like illness in Missouri during the 2019–2020 influenza season and recovered 146 influenza isolates including 38 IBV isolates. Of MDCK-CCL34, MDCK-Siat1, and humanized MDCK (hCK), hCK showed the highest virus recovery efficiency. All Missourian IBVs belonged to the Victoria V1A.3 lineage, all of which contained a three-amino acid deletion on the HA protein and were antigenically distant from the Victoria lineage IBV vaccine strain used during that season. By comparing genomic sequences of these IBVs in 31 paired samples, eight cell-adapted nonsynonymous mutations were identified, with the majority in the RNA polymerase. Analyses of IBV clinical sample–isolate pairs from public databases further showed that cell- and egg-adapted mutations occurred more widely in viral proteins, including the receptor and antibody binding sites on HA. Our study suggests that hCK is an effective platform for IBV isolation and that culture-adapted mutations may occur during IBV isolation. As culture-adapted mutations may affect subsequent virus studies and vaccine development, the knowledge from this study may help optimize strategies for influenza surveillance, vaccine strain selection, and vaccine development.

1. Introduction

The seasonal influenza virus is responsible for 290,000–650,000 human deaths worldwide each year [1]. These annual epidemics are caused by the co-circulation of influenza A viruses (IAVs) and influenza B viruses (IBVs). The influenza A subtypes causing contemporary seasonal outbreaks are primarily composed of subtypes H1N1 and H3N2 viruses, which have been co-circulating in humans since 1977. The H1N1 subtype caused the 1918 pandemic and circulated in humans until 1957 [2], then re-emerged and caused seasonal outbreaks from 1977 through 2009 [3]. This was later replaced with a novel swine-origin H1N1 virus, resulting in the 2009 pandemic [4,5]. The H3N2 subtype began circulating in 1968 and caused the 1968 pandemic [6,7]. Seasonal influenza B, identified in 1940 [8], comprises two lineages, B/Yamagata/16/88-like [Yamagata] and B/Victoria/2/87-like [Victoria], which have been co-circulating since at least 1983 [9,10]. While IAVs have been responsible for the majority of seasonal influenza complications, IBVs are causing considerably high burdens of morbidity and mortality [11,12,13,14].
Both genetic and antigenic drift facilitate the annual recurrence of influenza epidemics [15]. As an RNA virus, both IAVs and IBVs have a high mutation rate, ranging from 0.4 × 10⁻³ to 2.0 × 10⁻⁶ mutations per nucleotide per year, leading to genetic drift, because the RNA-dependent RNA polymerase (RdRp) lacks the 3′ to 5′ exonuclease proofreading capability. Antigenic drift is caused by evolutionary pressures that lead to an accumulation of mutations, particularly at the hemagglutinin (HA) and neuraminidase (NA) genes [16]. IBVs evolve more slowly compared with IAVs [17,18,19]. Of the IBV lineages, the Victoria lineage is undergoing more rapid evolution with greater positive selection pressure than the Yamagata lineage [17]. Structurally, the Yamagata virus binds to the host alpha-2,6-linked sialic acid receptors, whereas the Victoria virus binds to both alpha-2,3 and alpha-2,6 receptors, contributing to their differences in antigenic drift events [20,21].
Annual influenza vaccinations serve as a primary option for the prevention and control of influenza viruses [22,23]. Current vaccines are composed of two influenza A strains (H1N1 and H3N2) and either one (trivalent) or two (quadrivalent) influenza B strains [24]. Antigenic drift can cause low efficacy of seasonal influenza vaccines and necessitate annual vaccine reformulations. Due to antigenic drift, seasonal vaccine strains have been updated almost every year, especially during the past 10 years. Comparatively, IAVs have a much higher frequency of antigenic drift events than IBVs, as is reflected with the less frequent updates of the IBV component in the seasonal influenza vaccine.
Conventional serological tests such as hemagglutinin inhibition assays used in antigenic analyses for influenza vaccine strain selection require large virus quantities, and thus, the viruses often need to be isolated and propagated in Madin–Darby canine kidney (MDCK) cell lines or embryonated chicken eggs [25]. This can lead to cell- or embryonated egg-adapted mutations during viral propagation, particularly at the HA and NA surface glycoproteins [26,27,28,29,30]. Some prior studies have suggested that viruses propagated on MDCK cells have resulted in better antigenic matches than those grown on eggs [31]. During the seasons of 2012–2013 (VE = 49%, 43,000 deaths), 2016–2017 (VE = 40%, 38,000 deaths), and 2017–2018 (VE = 38%, 61,000 deaths), egg-adaptive mutations in the HA protein caused challenges in developing antigenically matched vaccine strain with circulating strains [32,33,34,35,36]. However, most of these studies on culture-adapted mutations were on IAVs, and the frequencies and implications of cell- or egg-adaptations in IBVs are yet to be fully understood.
In this study, we collected clinical samples from Columbia, Missouri during the 2019–2020 influenza season, particularly in the influenza epidemic months of February and March of 2020, to study the genetic and antigenic evolution of IBVs in humans and to assess whether passage of clinical samples in cells induces adaptive mutations across viral genes. Specifically, we performed serological analyses to characterize antigenic properties of the circulating influenza virus strains during this period and genomic analyses to determine the genetic changes that occurred during the influenza outbreaks during the 2019–2020 season in Missouri and whether culture-adapted mutations occurred during virus isolation.

2. Materials and Methods

Clinical samples: Nasopharyngeal swab specimens (N = 368) were collected from patients with influenza-like illness, who visited any of three urgent care facilities in Columbia, Missouri between February and March 2020. Samples were collected using a BD™ Universal Viral Transport Kit (3 mL, BD, Franklin Lakes, NJ, USA) and stored at −70 °C.
Nucleic acid extraction: RNA extraction was performed using the MagMAXTM Pathogen RNA/DNA kit (Thermo Fisher Scientific Baltics, Vilnius, Lithuania) following the manufacturer’s instructions. The nucleic acid was resuspended in 90 μL of elution solution.
Quantitative reverse transcription polymerase chain reaction (qRT-PCR): The commercial kit AgPath-IDTM One-Step RT-PCR (Ambion, Austin, TX, USA) and CDC influenza A/B primers were used for screening the samples for influenza viruses in a single reaction in a QuantStudioTM 6 Flex Real time PCR System (Life Technologies, Paisley, UK). A 25 μL reaction containing 12.5 μL of the 2X reaction buffer, 0.5 μL of each primer (50 μM stock), or probe (10 μM stock) was used to reach a final concentration of 1 μL of the 25X RT-PCR enzyme mix. Additionally, 1.67 μL of detection enhancer were used.
Cell lines: Humanized MDCK cells (hCK) were kindly provided by Dr. Yoshihiro Kawaoka from the University of Wisconsin-Madison, USA. The MDCK-Siat1 cells were kindly provided by Dr. Mikhail Matrosovich from Philipps University, Germany. The MDCK-CCL34 cells were obtained from the Biodefense and Emerging Infections Research Resources Repository. All cells were maintained until use at 37 °C under 5% CO2 in Dulbecco’s modified Eagle medium (Gibco DMEM; Thermo Fisher Scientific, Waltham, MA, USA) supplemented with 10% fetal bovine serum (Gibco; Thermo Fisher Scientific Baltics, Vilnius, Lithuania). These three cell lines were selected, because hCK has overexpression of α-2,6-sialoglycans and almost completely deleted expression of α-2,3-sialoglycans, and hCK has been demonstrated to be a more efficient cell line for influenza B, A/H1N1pdm, and even more efficient for A/H3N2 virus isolation and propagation than other MDCK cells for influenza viruses [37]. MDCK-Siat1 has overexpression of α-2,6-sialyltransferase but a marginal decrease in α-2,3-sialylation [38]. Similar to hCK cells, Siat-1 has been shown to improve isolation rates over conventional MDCK cell lines (CCL34) in influenza B, A/H1N1, and especially in A/H3N2 viruses [39]. Finally, MDCK-CCL34 cells express higher levels of α-2,3-syaloglycans compared with α-2,6-syaloglycans and are widely used for influenza virus isolation and propagation, and they exhibit relatively low levels of both α-2,3- and α-2,6-sialic acids with slightly higher levels of α-2,3-sialylation compared with α-2,6-sialylation [40].
Virus isolation: Clinical samples were diluted 1:10 in Opti-MEM media containing a 1X final dilution of antibiotic–antimycotic solution for 30 min at 4 °C. A total volume of 0.5 mL was inoculated in T25 flasks containing confluent cells in Opti-MEM media with antibiotics–antimycotics at 35 °C for 3 to 4 days until 75% cytopathic effect (CPE) was observed. Supernatant was collected and centrifuged at 4000 revolutions per minute, and the hemagglutination capacity was tested using 0.5% solution of turkey erythrocytes.
Ferret antisera: The following sera were obtained from the Influenza Research Reagent Resources: FR-1617 B/Colorado/6/2017, FR-1081 B/Nevada/03/2011, FR-1305 B/Texas/02/2013, FR-392 B/Brisbane/60/2008, B/Washington/02/2019 (egg), FR-810 B/Wisconsin/1/2010.
Hemagglutination inhibition (HAI) assays: Isolated viruses were characterized antigenically following previously described protocols [41].
Antigenic cartography: HAI results were visualized by AntigenMap (https://sysbio.missouri.edu/software/AntigenMap/, accessed on 19 July 2021) [42,43,44]. A titer of 20 was used as the low reactor threshold and a low rank (rank = 2) matrix completion was used to minimize noise from the HAI data. A single unit on the antigenic map represents a log2 unit in HAI titers.
Next generation sequencing: Whole genome RT-PCR amplification was conducted using 12 pairs of primers [45,46,47]. Amplicon libraries were prepared using the Nextera DNA Flex Library Prep kit, then sequenced with MiSeq Reagent Kit v3 (600 cycles) and MiSeq sequencing system (Illumina, San Diego, CA, USA). The resulting paired-end reads were analyzed for quality, mapped to a reference genome (B/Utah/17/2020, accession: MT499571-MT499578), and assembled using CLC Genomics Workbench v21.0.3 (Qiagen, Hilden, Germany). Pairwise analyses were conducted using CutAdapt v3.4 (National Bioinformatics Infrastructure Sweden, Uppsala, Sweden) [48], Bowtie2 v2.4.4 (Johns Hopkins University, Baltimore, Maryland, USA) [49], and samtools v1.13 (https://github.com/samtools/, accessed on 4 May 2021), and polymorphisms were identified using pysamstats v1.1.2 (https://github.com/alimanfoo/pysamstats, accessed on 4 May 2021) and confirmed using the Integrated Genomics Viewer (https://software.broadinstitute.org/software/, accessed on 10 June 2021). Cell-adapted mutations were verified manually using BioEdit v7.2.5 [50]. Total reads ranged from 142,724 to 2,161,170 for each sequence, with an average of 1,092,806 reads (standard deviation (SD) = 751,073). The average number of reads for clinical samples was 1,725,216 (SD = 239,826), and the average number of reads for the isolates was 460,396 (SD = 520,405). GenBank accession numbers for these 31 IBV isolates are MZ951177–MZ951671.
Phylogenetic analyses: The basic local alignment search tool (BLAST) was used to identify sequences with the closest identities to each sample, and the top 20 sequences across all segments were included in each phylogeny. Reference genomes from the Victoria lineage (B/Rhode Island/01/2019, EPI_ISL_409247; B/Nigeria/3352/2018, EPI_ISL_330532; B/Missouri/12/2018, EPI_ISL_309120; B/Hong Kong/286/2017, EPI_ISL_276541; B/Florida/78/2015, EPI_ISL_207237; B/Brisbane/60/2008, EPI_ISL_246494; B/Brisbane/46/2015, EPI_ISL_219054; B/Hong Kong/269/2017, EPI_ISL_276540; B/Florida/103/2016, EPI_ISL_248973; B/New Jersey/1/2021, EPI_ISL_246881; B/Colorado/6/2017, EPI_ISL_277231; B/Nevada/03/2011, EPI_ISL_94747; B/Florida/78/2015, EPI_ISL_207237; B/Texas/02/2013, EPI_ISL_139913; B/Washington/02/2019, EPI_ISL_341131) and the Yamagata lineage (B/Phuket/3073/2013, EPI_ISL_517766; B/Texas/81/2016, EPI_ISL_237464; B/New Hampshire/01/2018, EPI_ISL_296628) were also included in the phylogenetic trees for each segment. These sequences were downloaded from the Global Initiative on Sharing Avian Influenza Data (GISAID) consortium EpiFlu database (http://www.gisaid.org, accessed on 2 July 2021).
All selected sequences were aligned using MUltiple Sequence Comparison by Log-Expectation (MUSCLE8, European Bioinformatics Institute, Cambridgeshire, United Kingdom). Phylogenetic analyses were performed with BEAST2 (https://www.beast2.org/, accessed on 22 July 2020) with a Hasegawa–Kishino–Yano (HKY) substitution empirical model, strict clock model, and coalescent constant population prior. Tracer v1.7.1 was used to evaluate phylogenetic quality using a cutoff of 200 for the effective sample size (ESS) to assess convergence. The consensus tree was generated using TreeAnnotator v2.6.3.0 and visualized with FigTree v1.4.4 (http://tree.bio.ed.ac.uk/software/figtree/, accessed on 2 February 2021).

3. Results

3.1. Virus Isolation in MDCK-hCK Cell Lines Showed the Highest Virus Recovery Rate

Of the 368 samples, 146 (39.7%) tested positive for influenza with 38 samples (10.3%) positive for IBV and 108 (29.3%) for IAV by qRT-PCR. Thirty-one of the IBV samples were positive to virus isolation in hCK cells. Other MDCK cell lines such as CCL34 and SIAT1 were also used to compare cell sensitivity to virus isolation. The MDCK-hCK cell lines showed the highest performance for both IAV and IBV following the first passage of the viruses with an isolation rate of 87.96% and 81.58%, respectively, compared with the CCL34 (42.12% and 57.89%, respectively) and SIAT1 (71.30% and 57.89%, respectively) cell lines (Table 1).

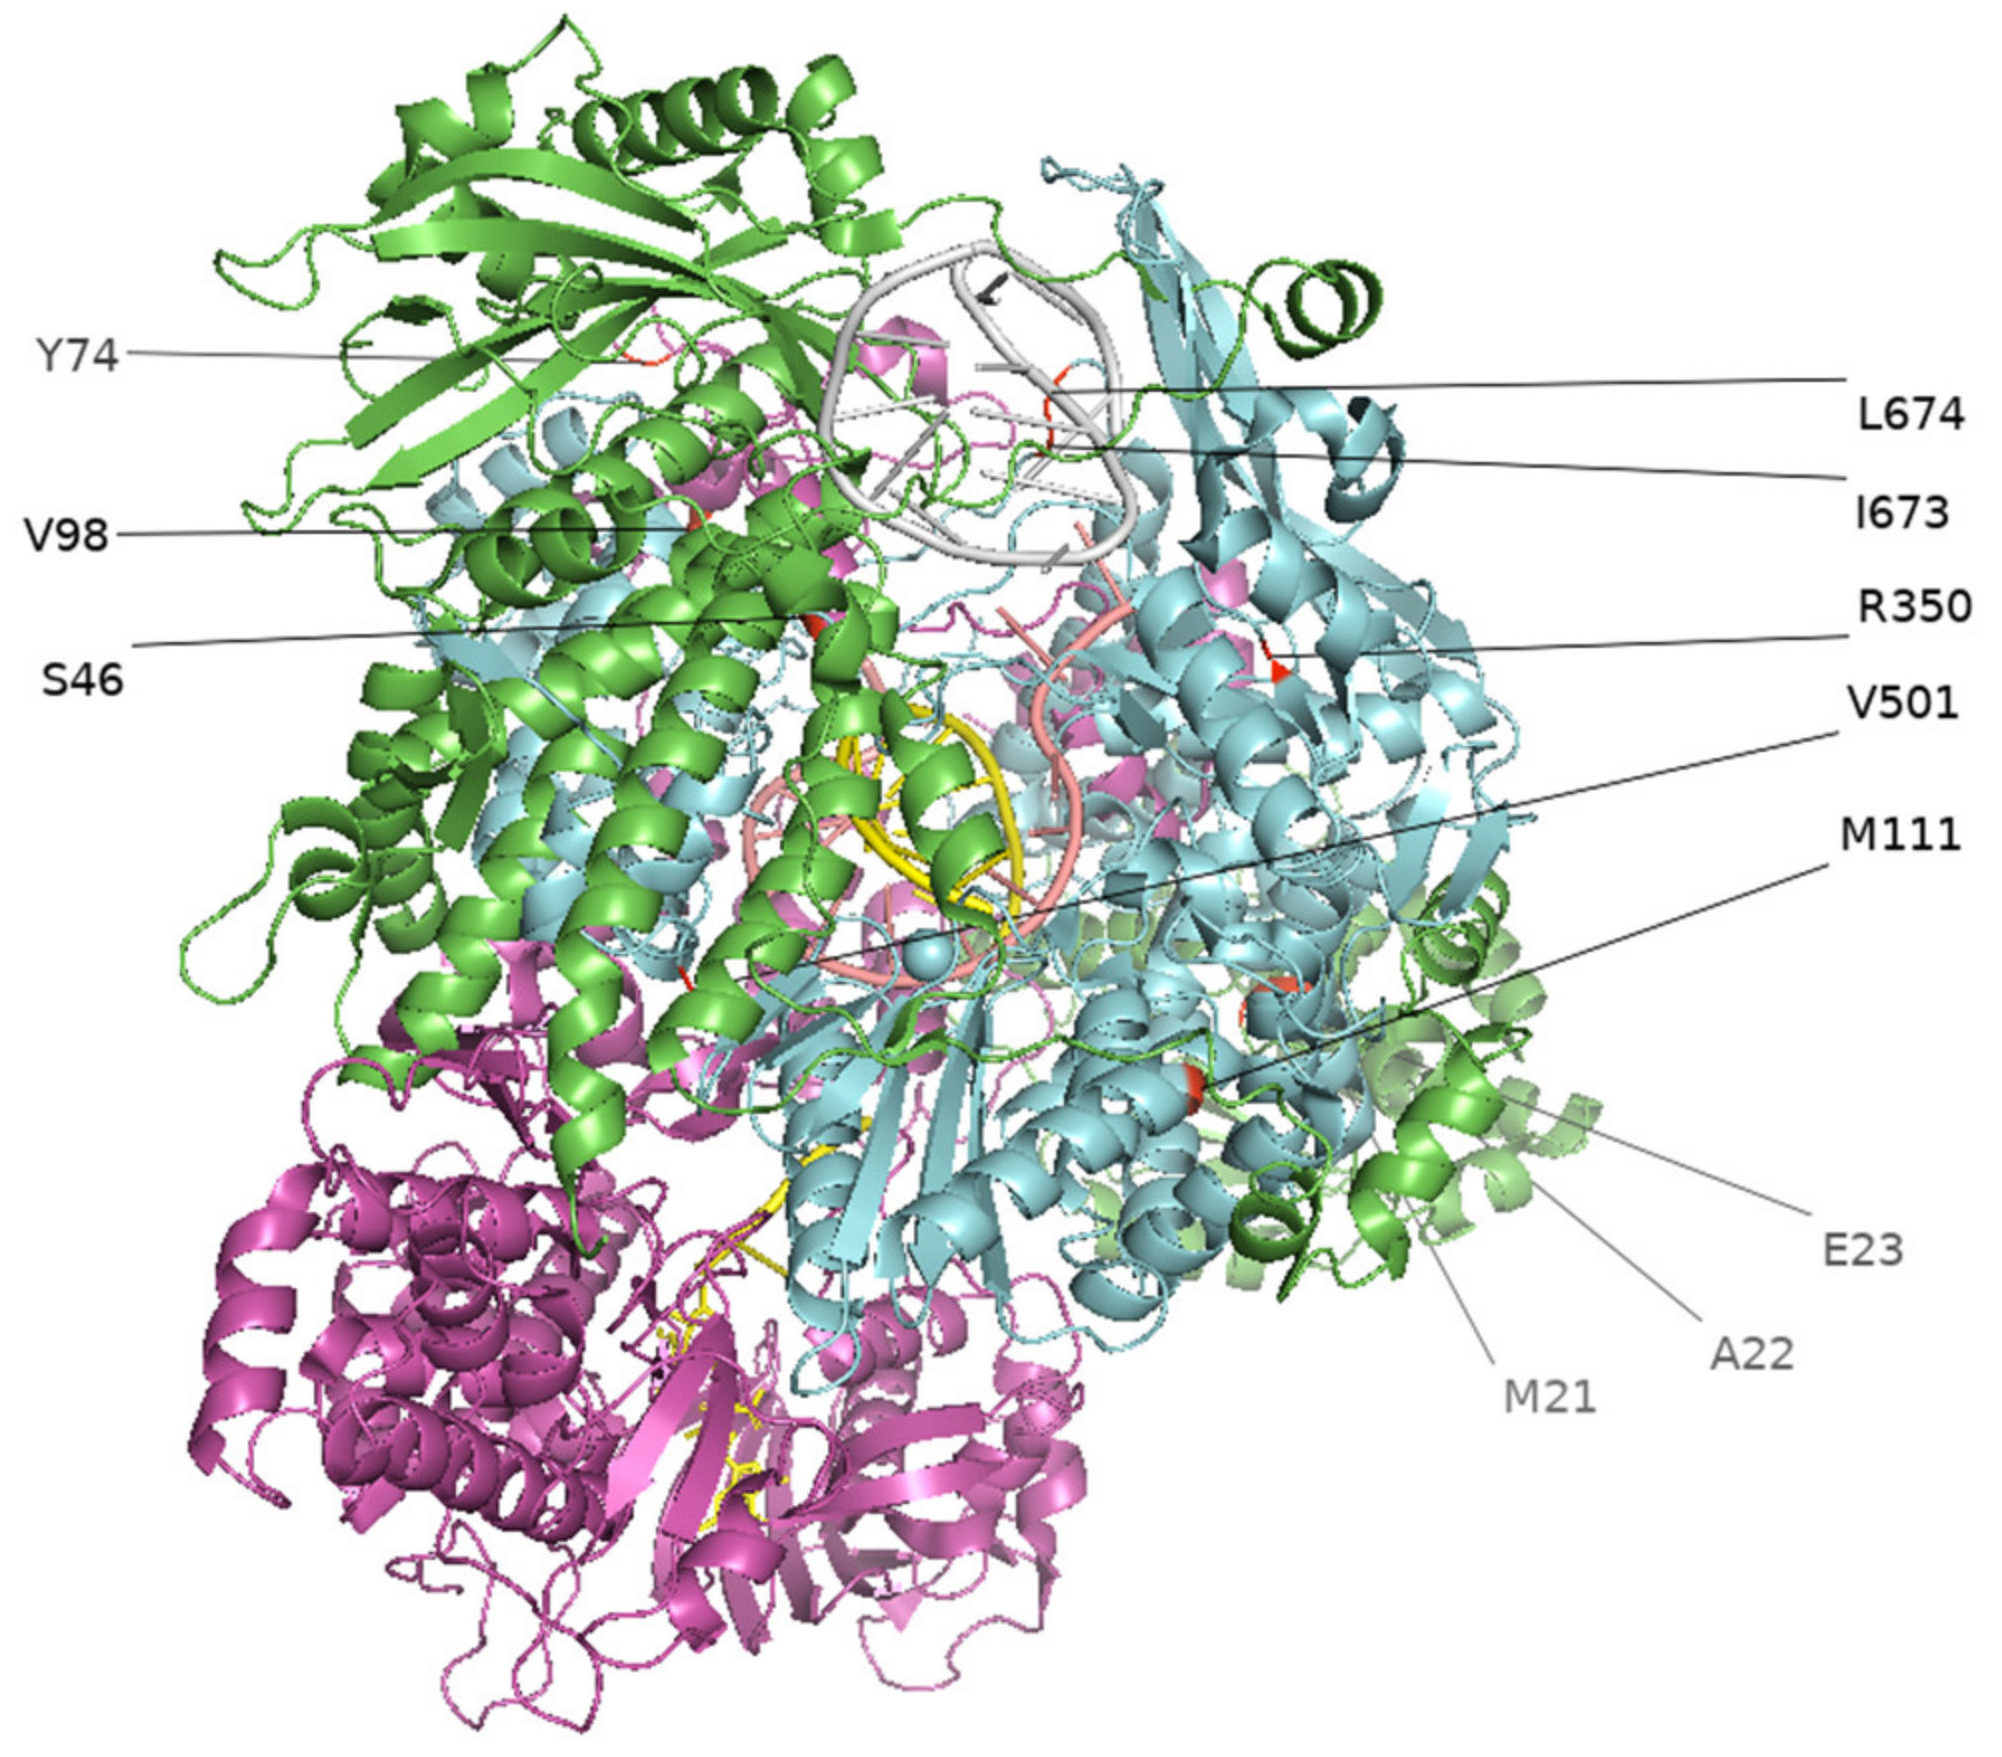
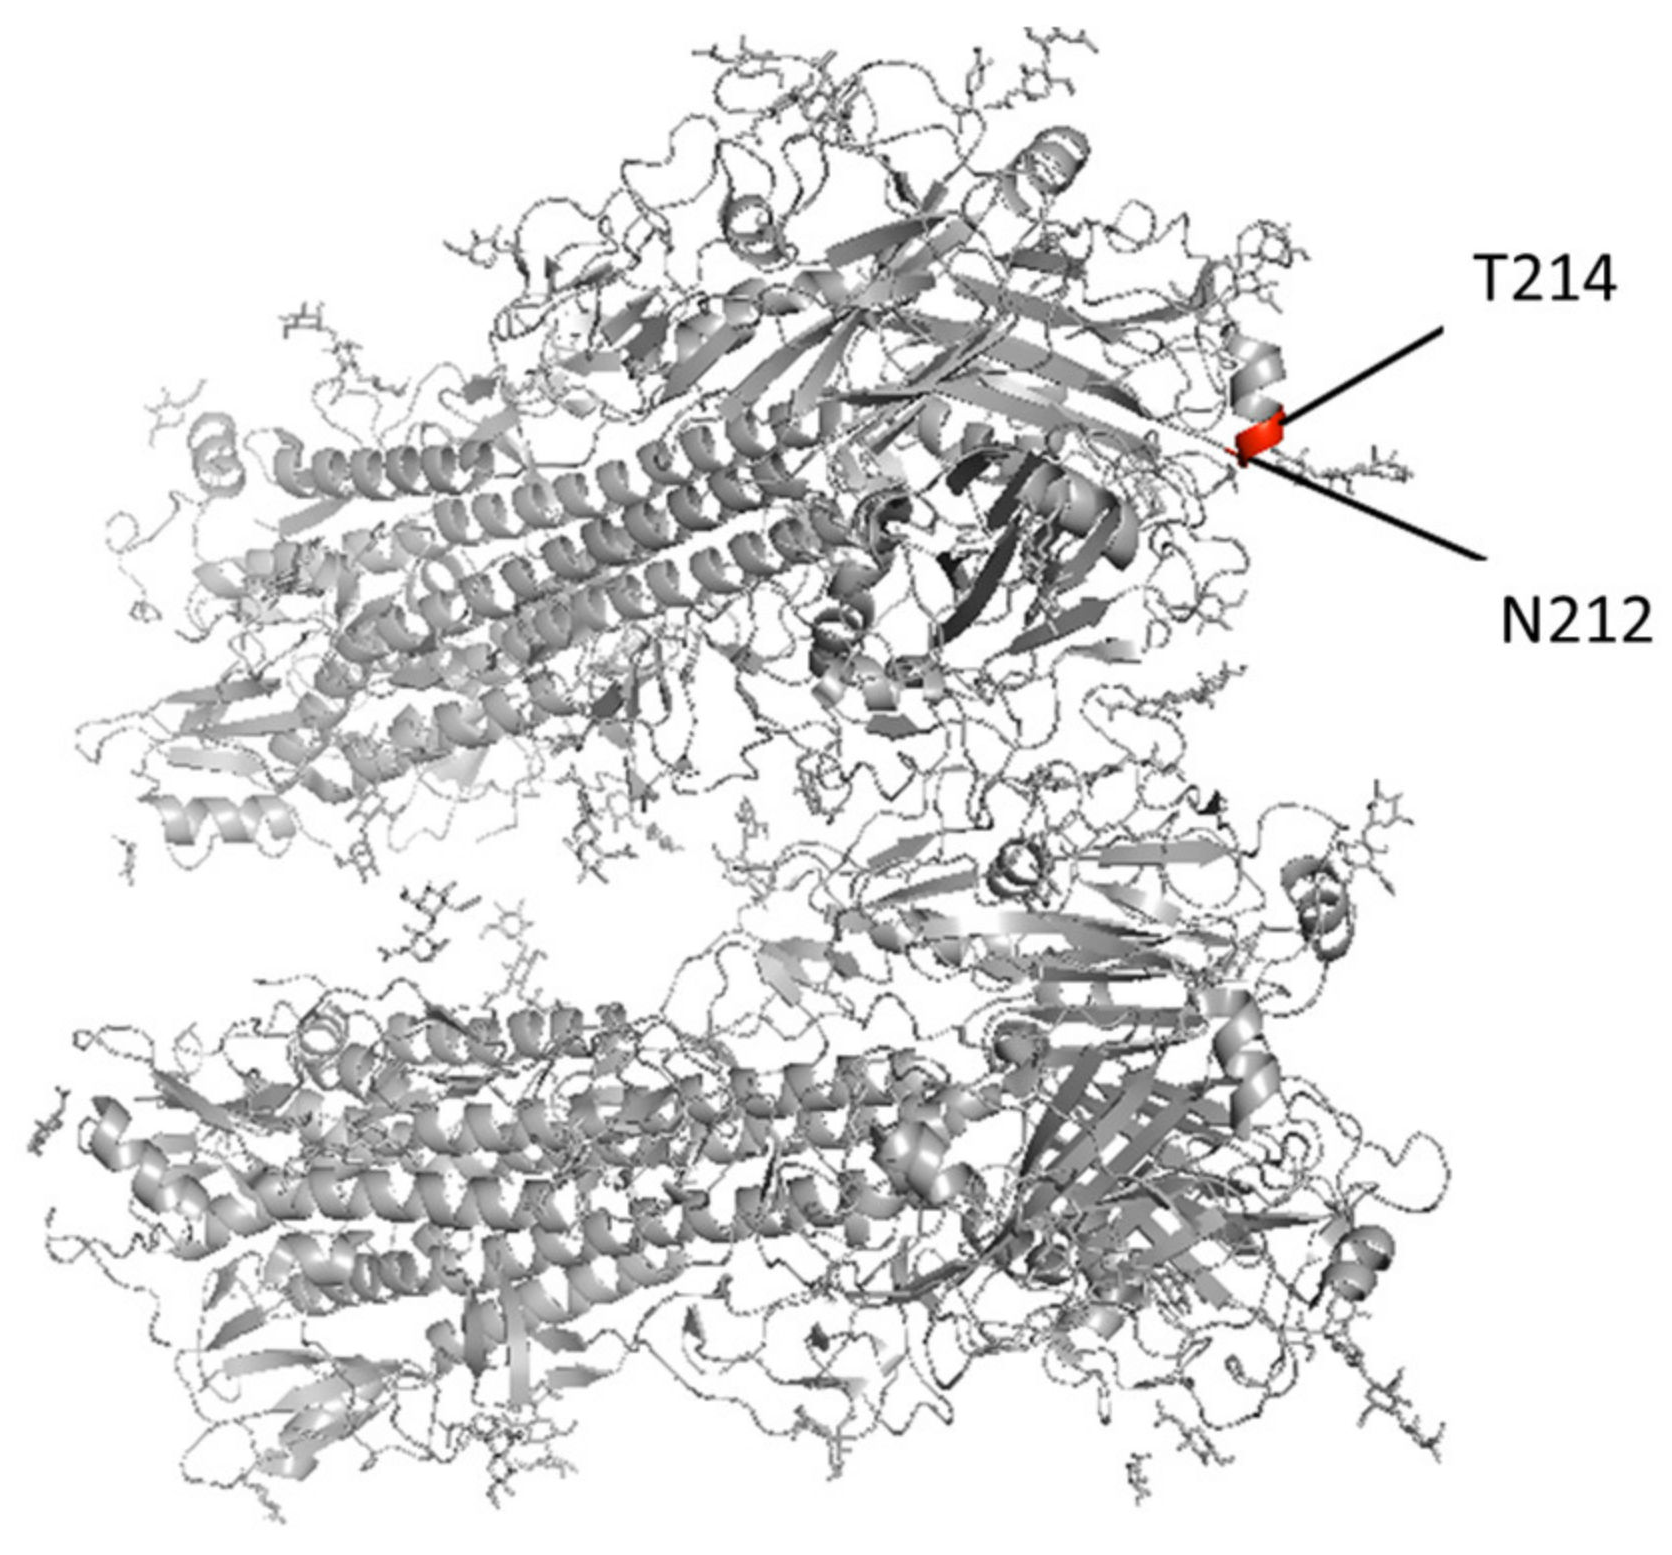
3.2. Culture-Adapted Mutations Were Identified in IBVs

To identify culture-adapted mutations, we sequenced 38 IBVs from the IBV-positive clinical swab samples. Of the 38 paired swab and isolate (hCK derived; first passage) samples subjected to MiSeq sequencing, 31 paired samples yielded complete genomic data and were included in the analysis to determine hCK cell-adapted mutations and polymorphisms. The genomes for the other seven pairs were either incomplete or with a low coverage and thus not included our subsequent analyses. From these 31 paired samples, we identified 13 cell-adapted mutations in total among nine viruses, ranging from one to three mutations in each virus, and each of these mutations was unique to each virus. We detected eight nonsynonymous mutations among these paired samples that have not been previously published (HA-R581C; PB2-T46S, PB2-V98G; PB1-E112G, PB1-R350G, PB1-V501A, PB1-L674Q; and NP-E140A), six of which were from the RNA polymerase complex (Figure 1) and five synonymous mutations (Table 2). Polymorphisms were also identified in PB2-T293G, PB2-T2097C, PB1-A255G, PB1-A1048G, PB1-T1502C, and NP-A419C (Table 2).
In addition to our samples, we analyzed all Victoria lineage IBV samples available on GISAID with a sequence from an original specimen and at least one cell or egg sequence to determine whether culture-adapted mutations also occurred among samples submitted to a public database. Passage information is not consistently reported in the GISAID strains and, thus, was not included in the analysis. Of the initial 91,884 distinct and complete Victoria lineage sequences on GISAID as of 2 July 2021, 539 strains contained at least one clinical sample–isolate pair. Pairwise comparison of these strains revealed multiple additional cell- and egg-adapted mutations (Table 3). Three distinct mutations were identified at PB2, one at PB1, two at PA, two at NS1, two at NP, two at NEP, one at NB, 11 at NA, and eight at HA. Notably, on the HA protein, 14 strains contained a cell- or egg-adapted mutation at position 212 and six strains contained a mutation at position 214 (Figure 2). Additionally, of the complete Victoria IBV sequences with paired isolates, 10.3% contained culture-adapted mutations (6.7% cell, N = 537; 38.3% egg, N = 60).

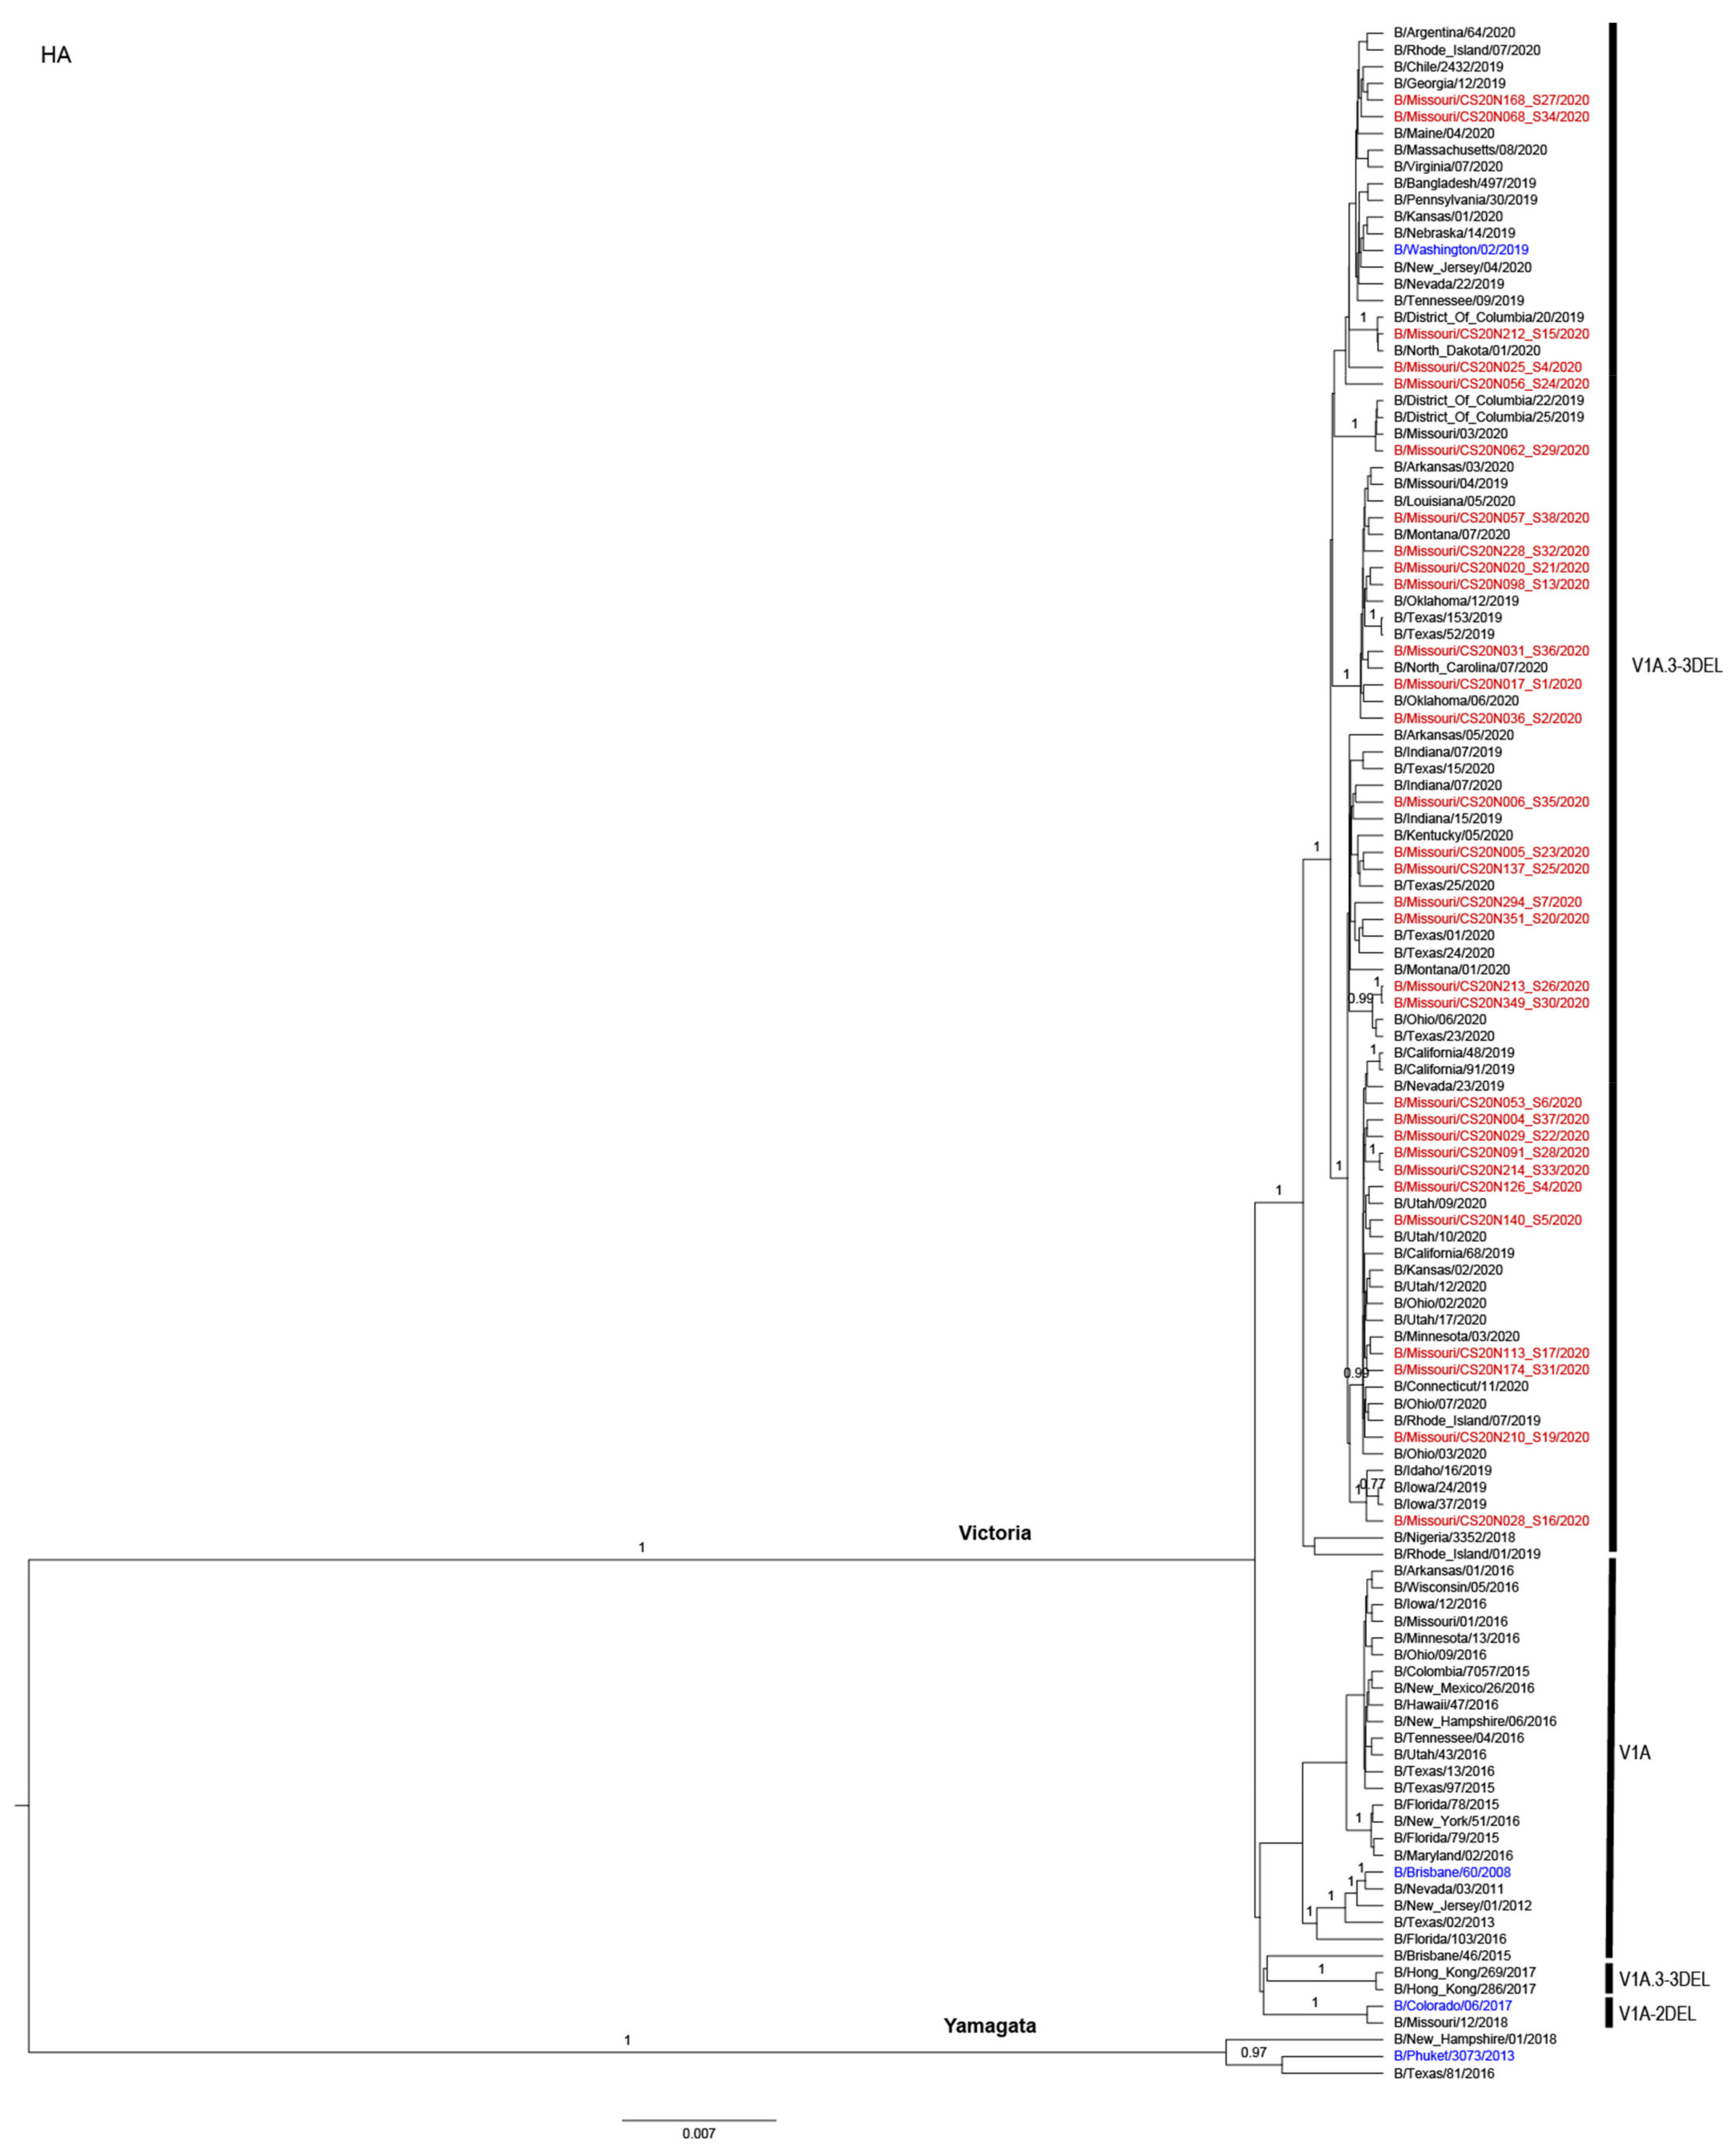
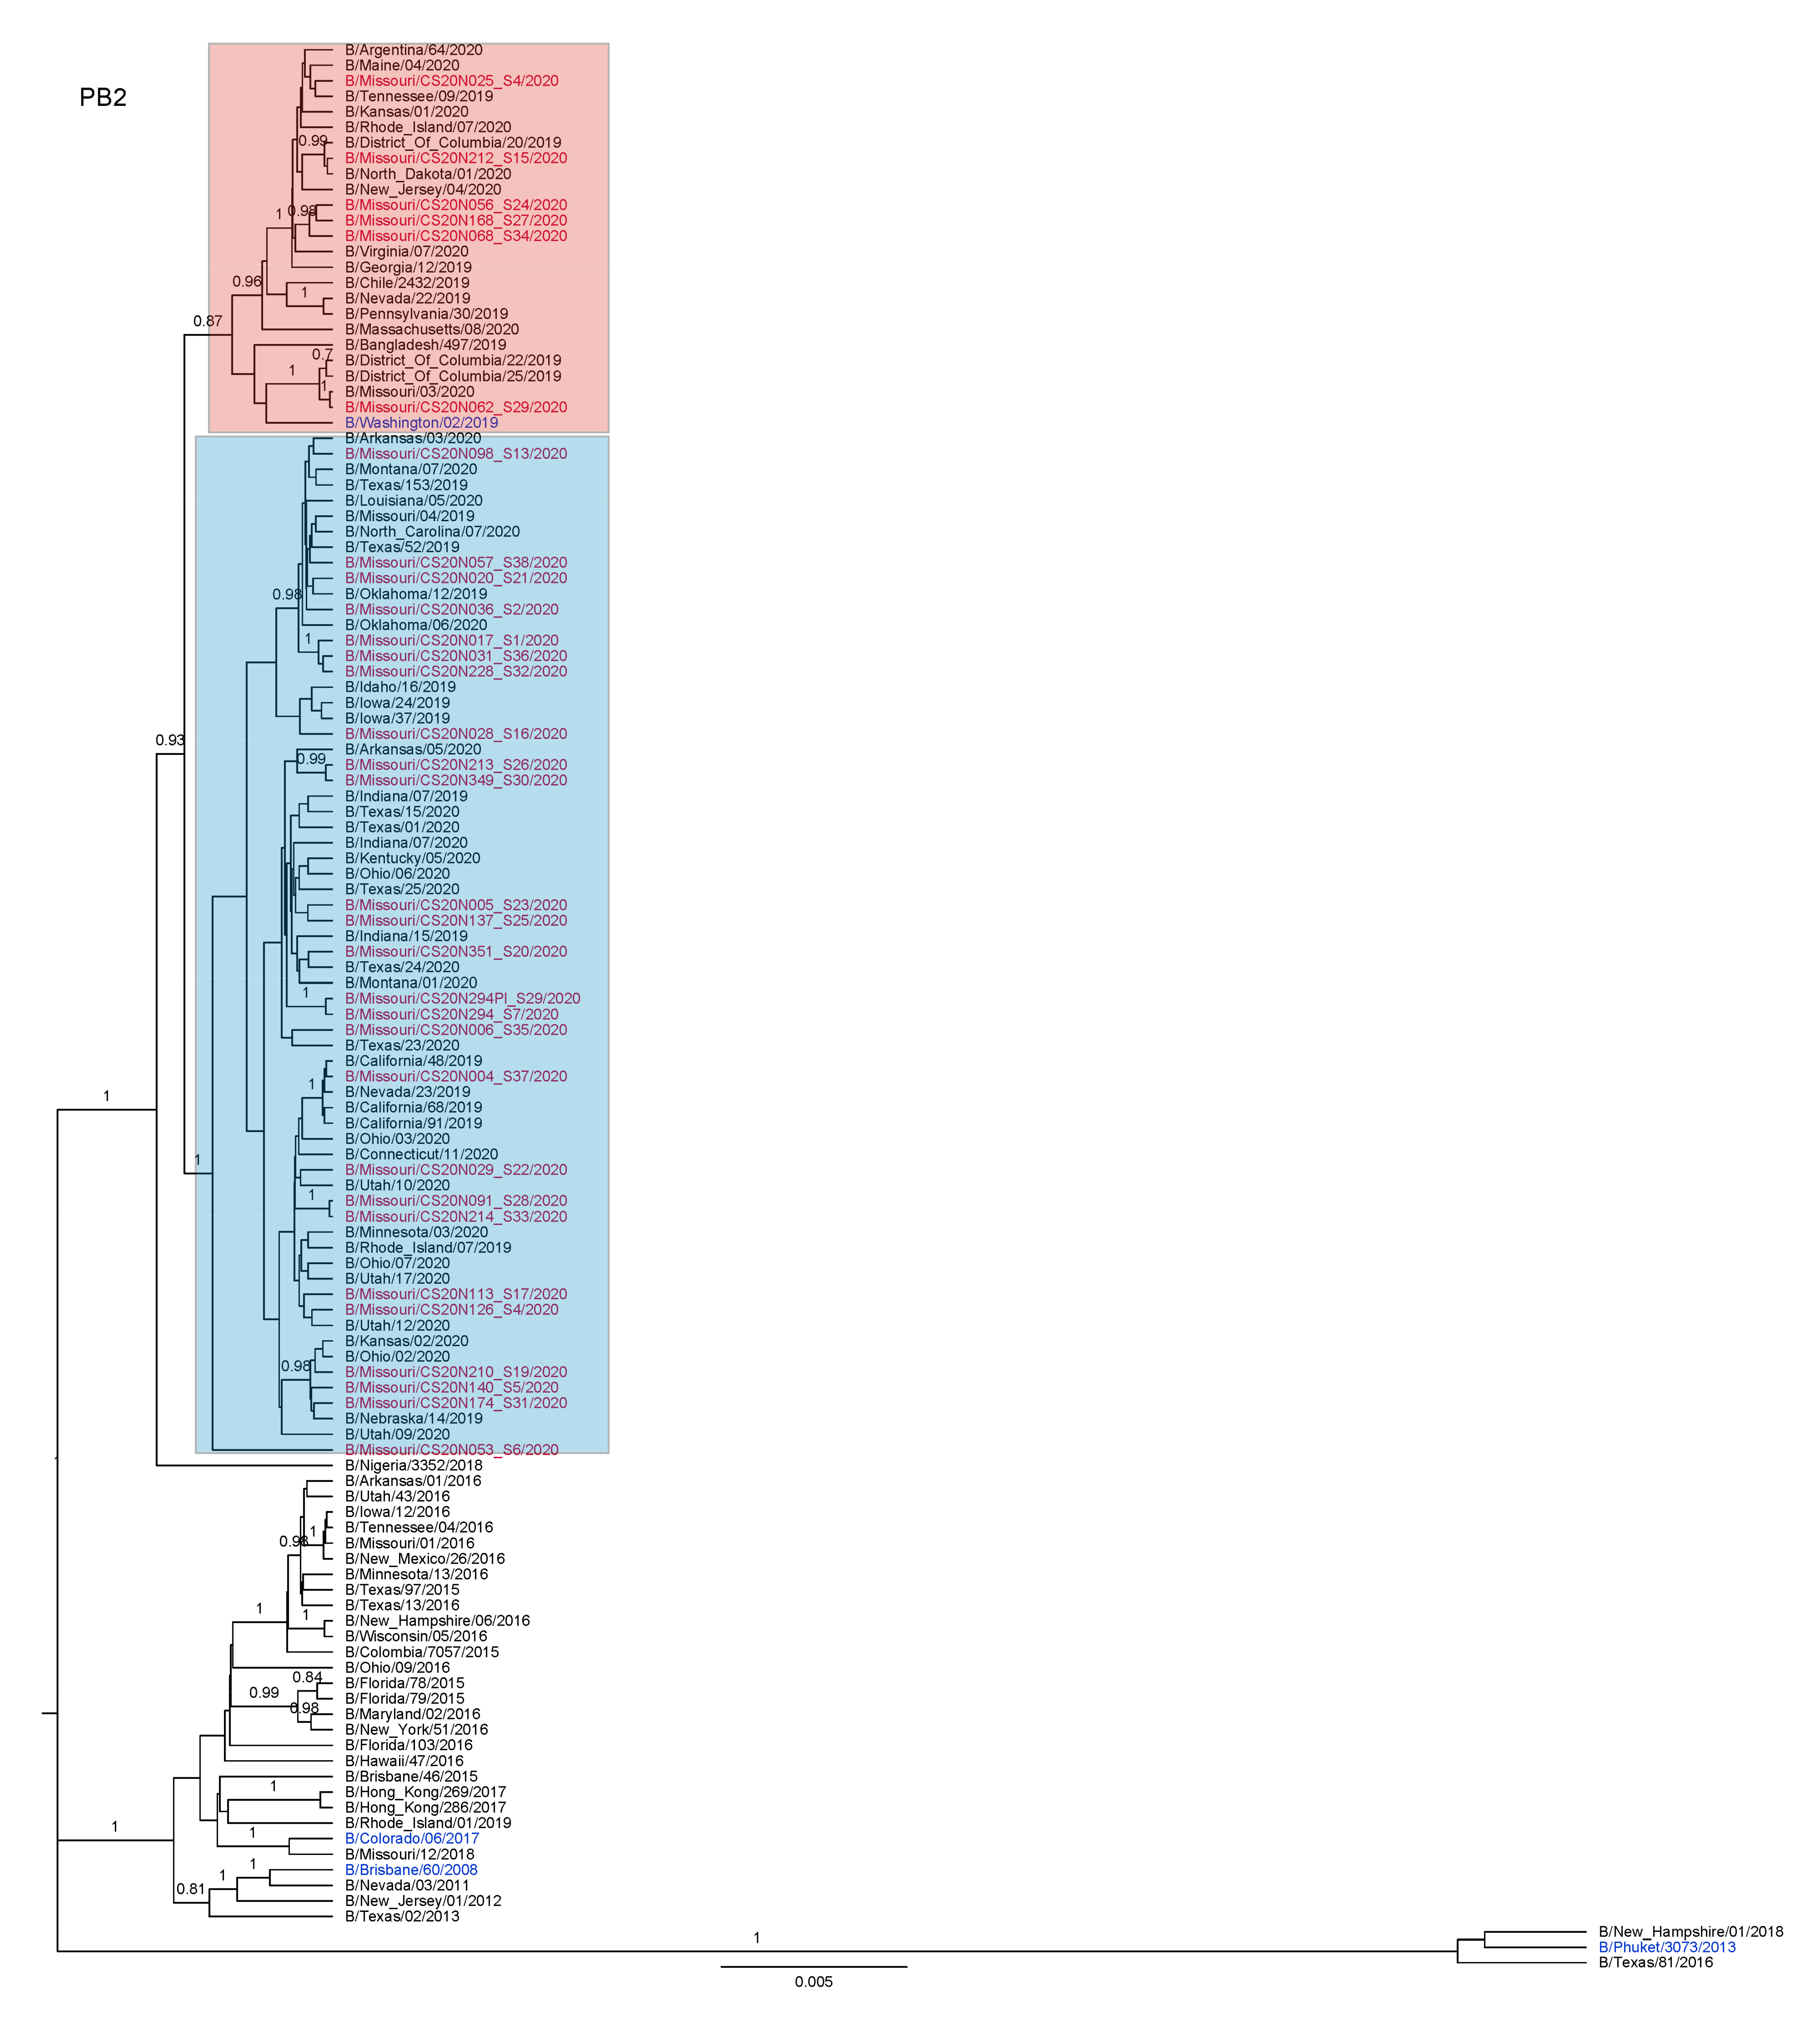
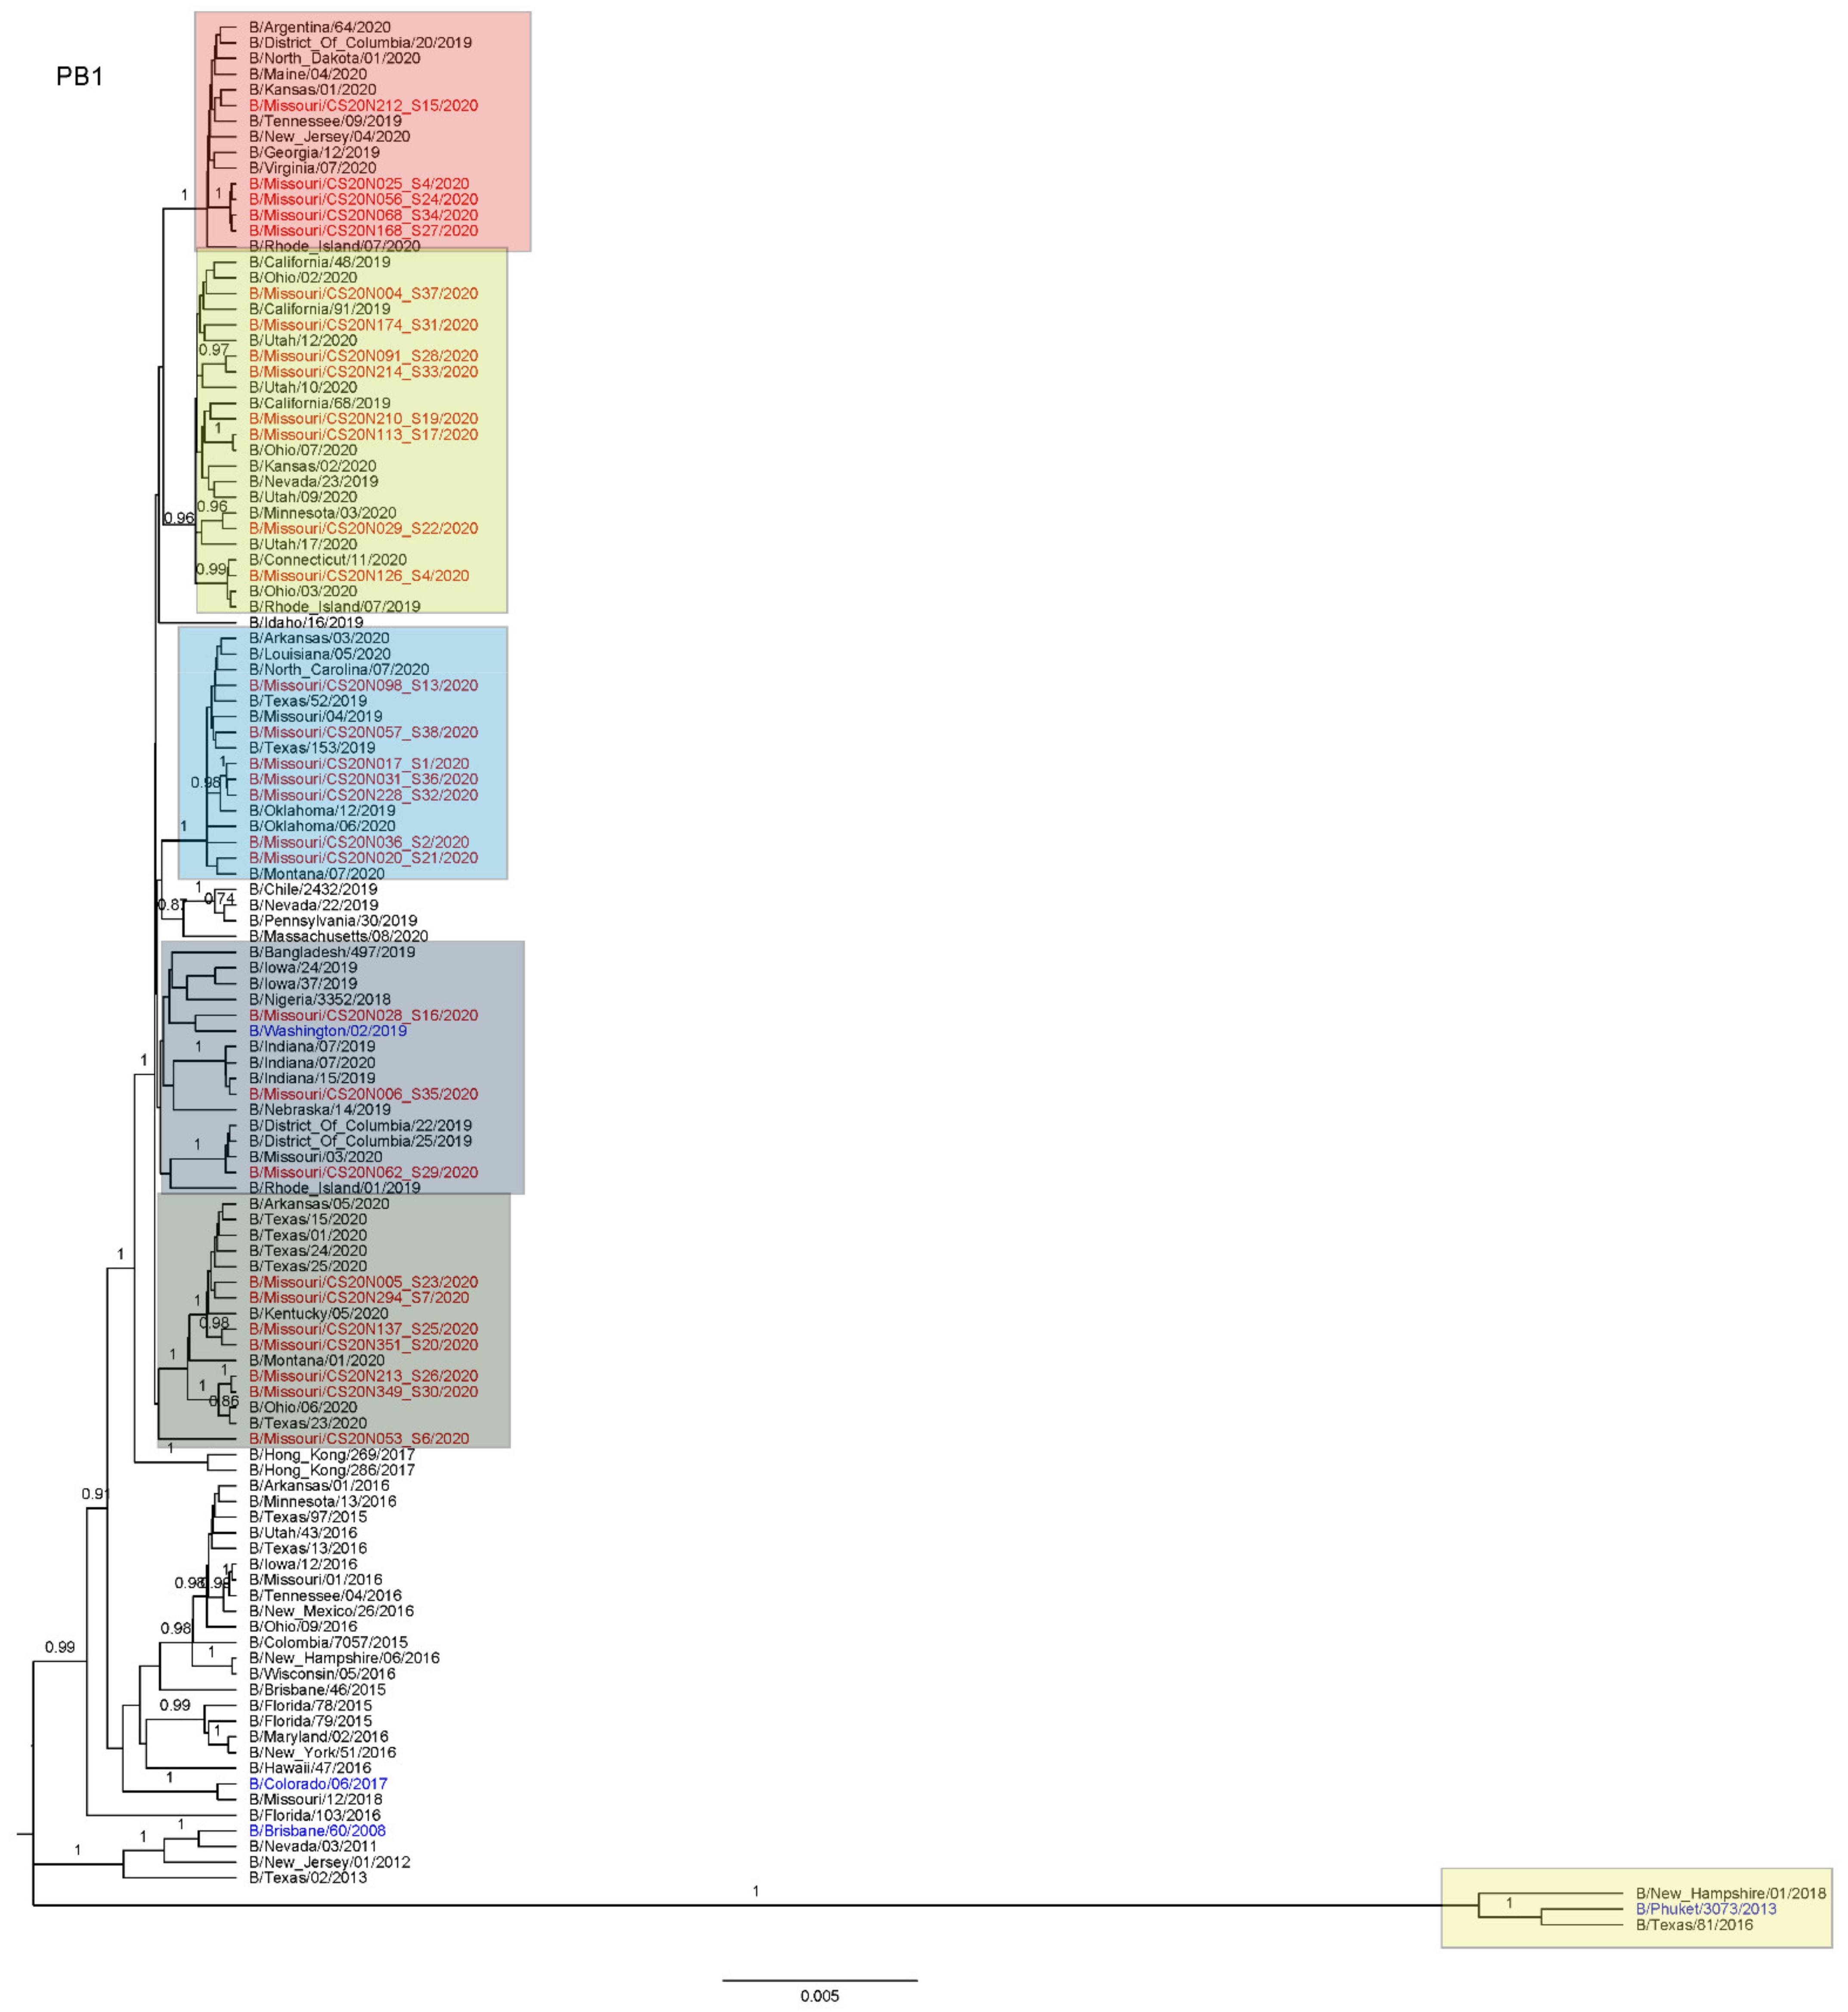
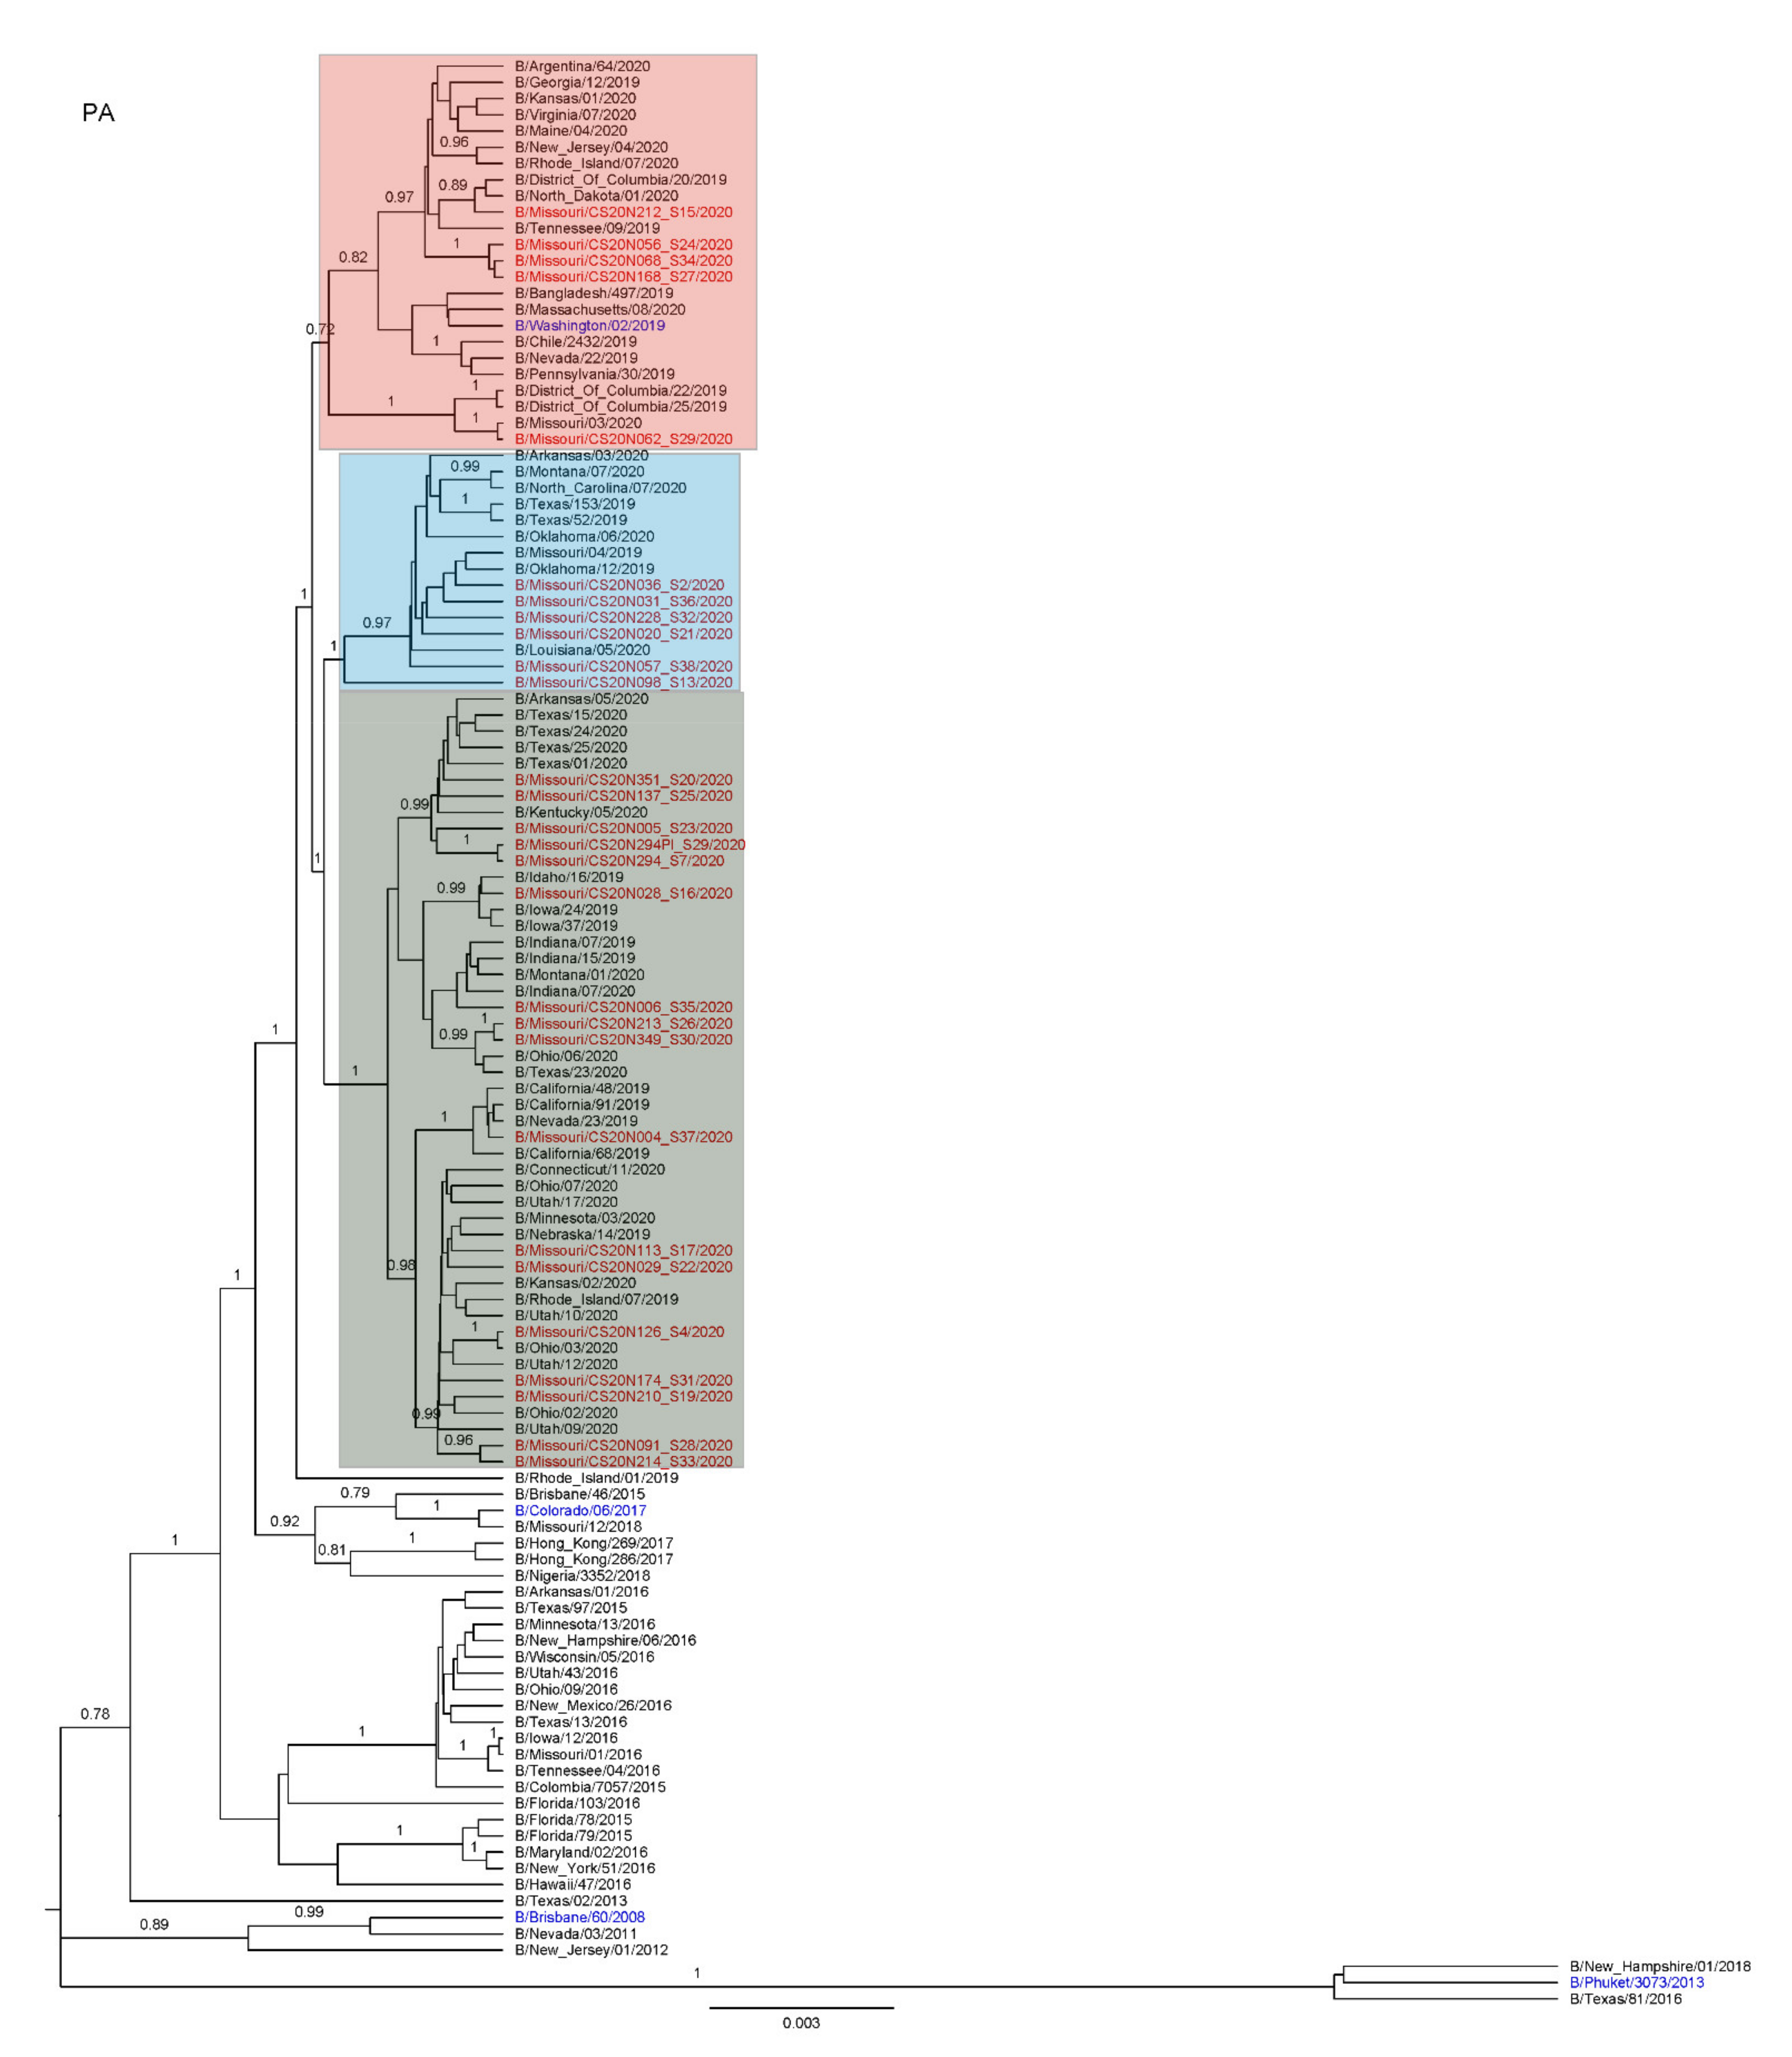
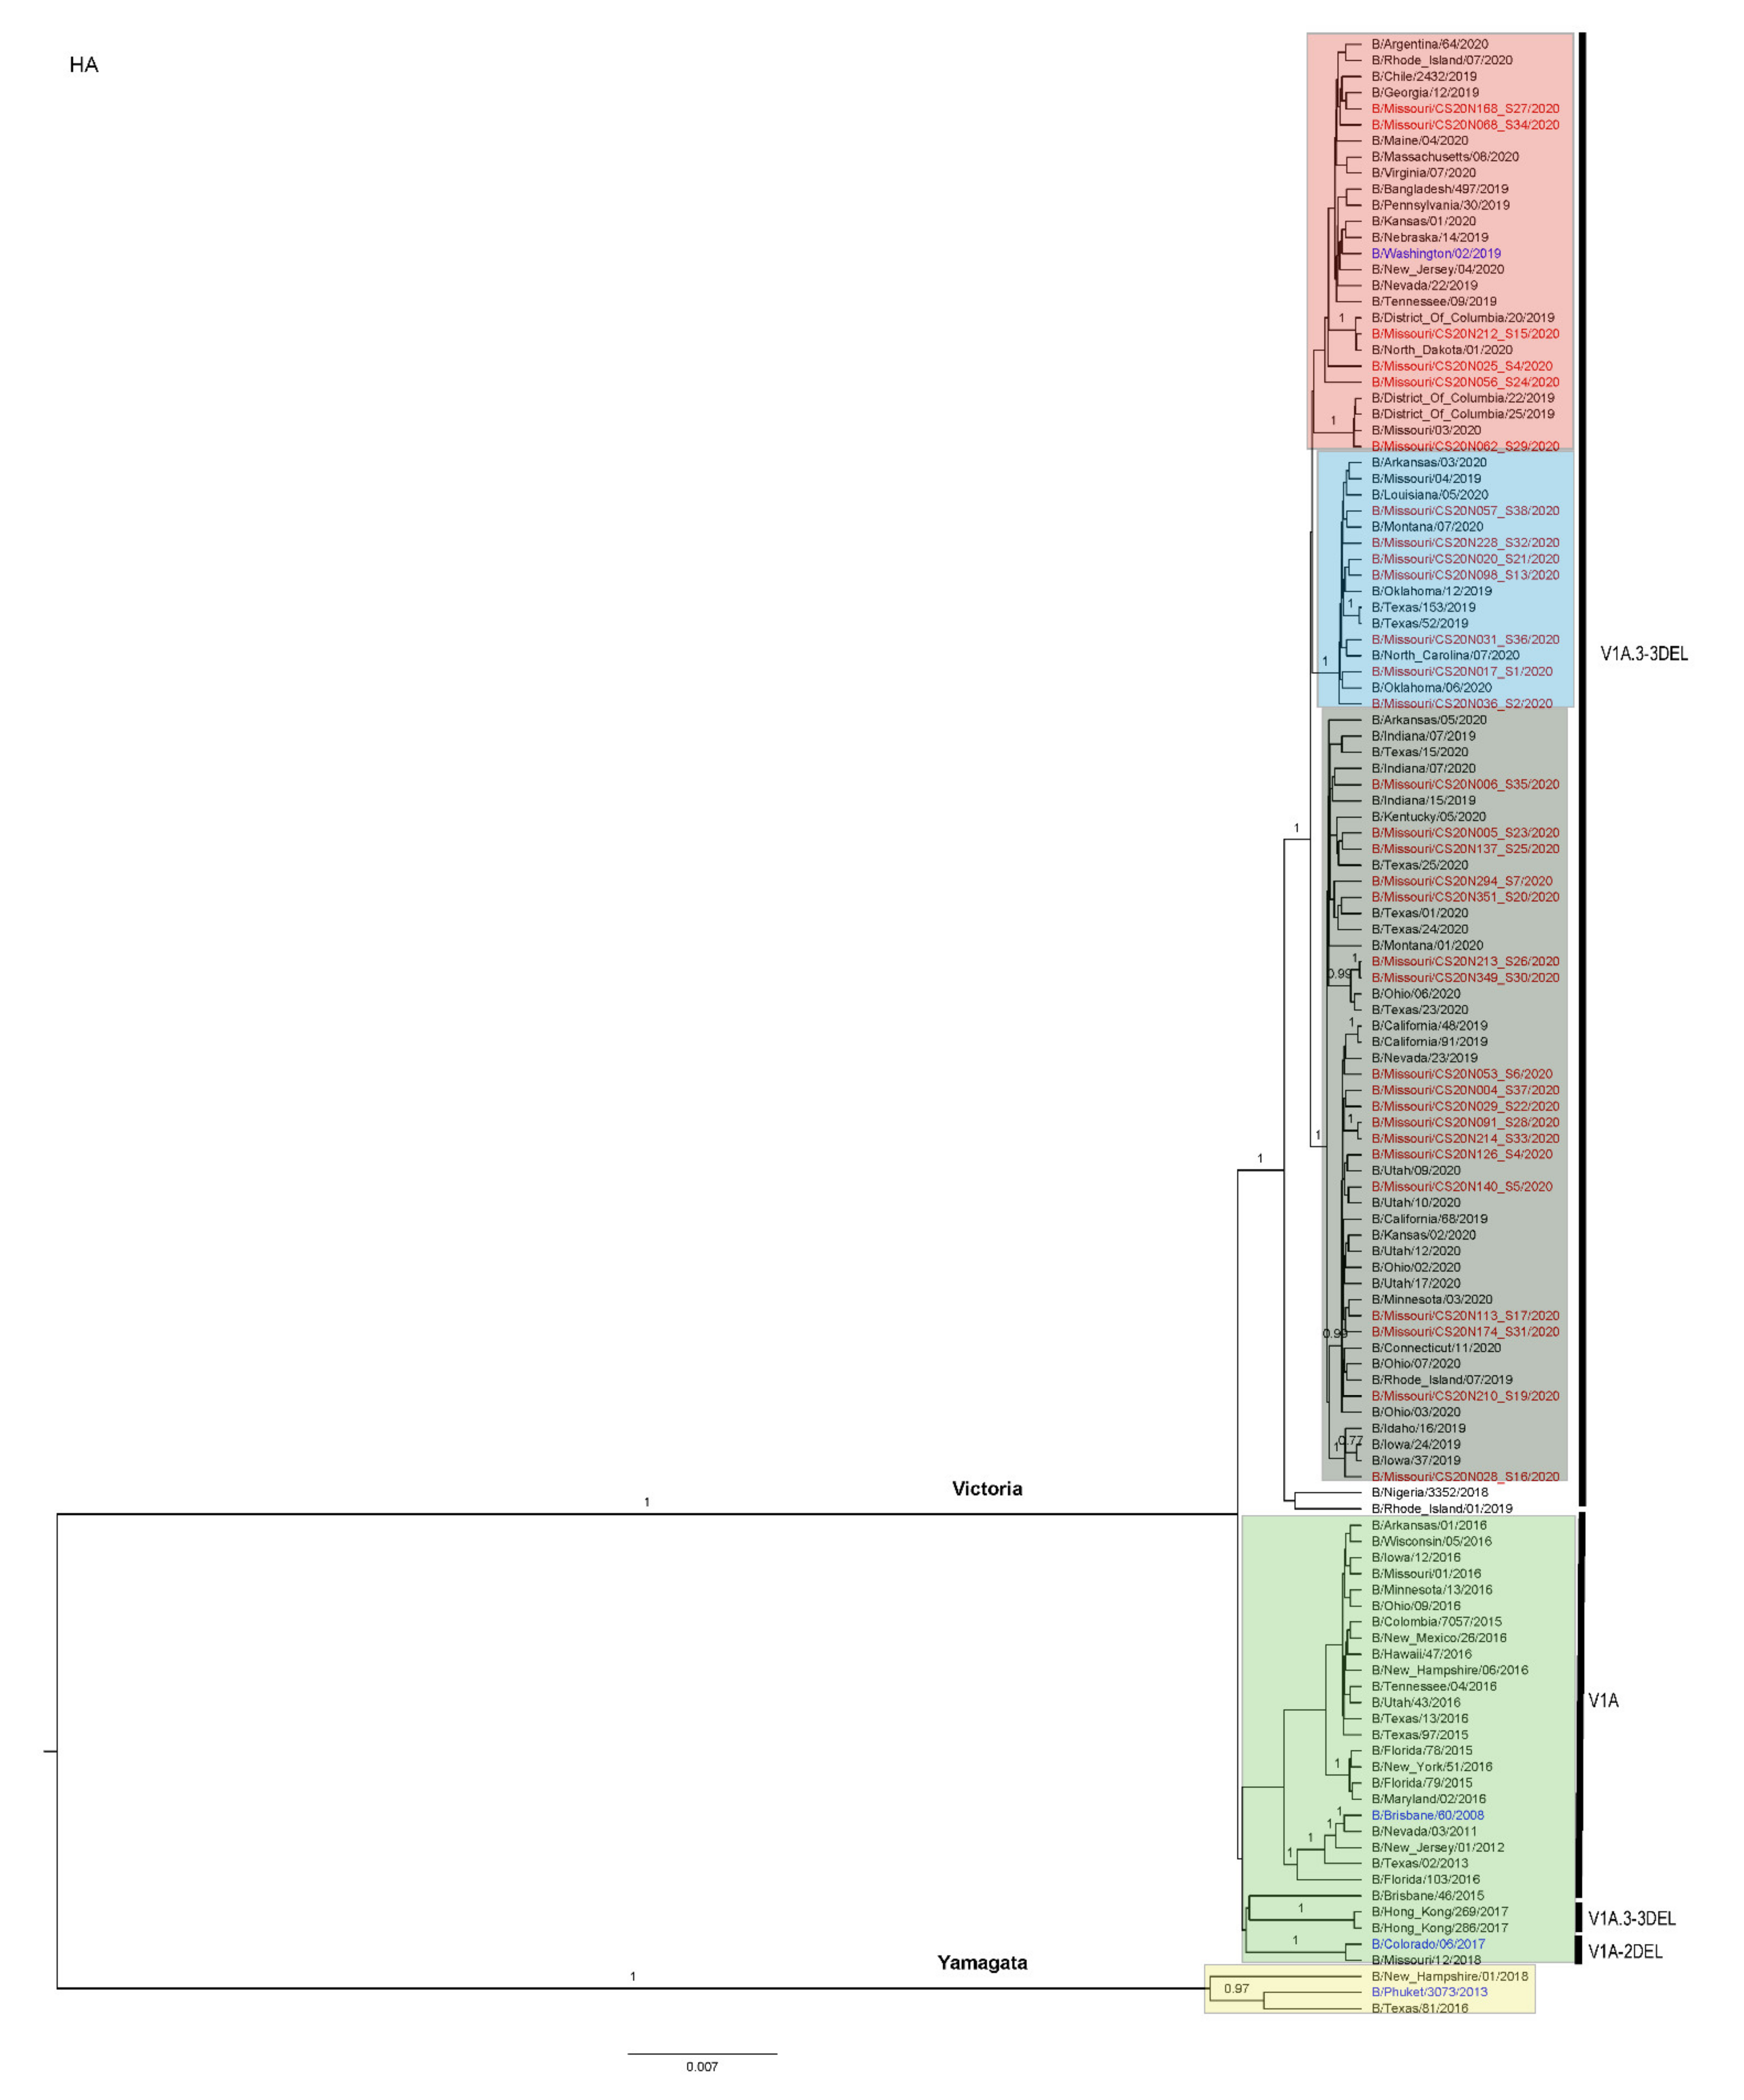
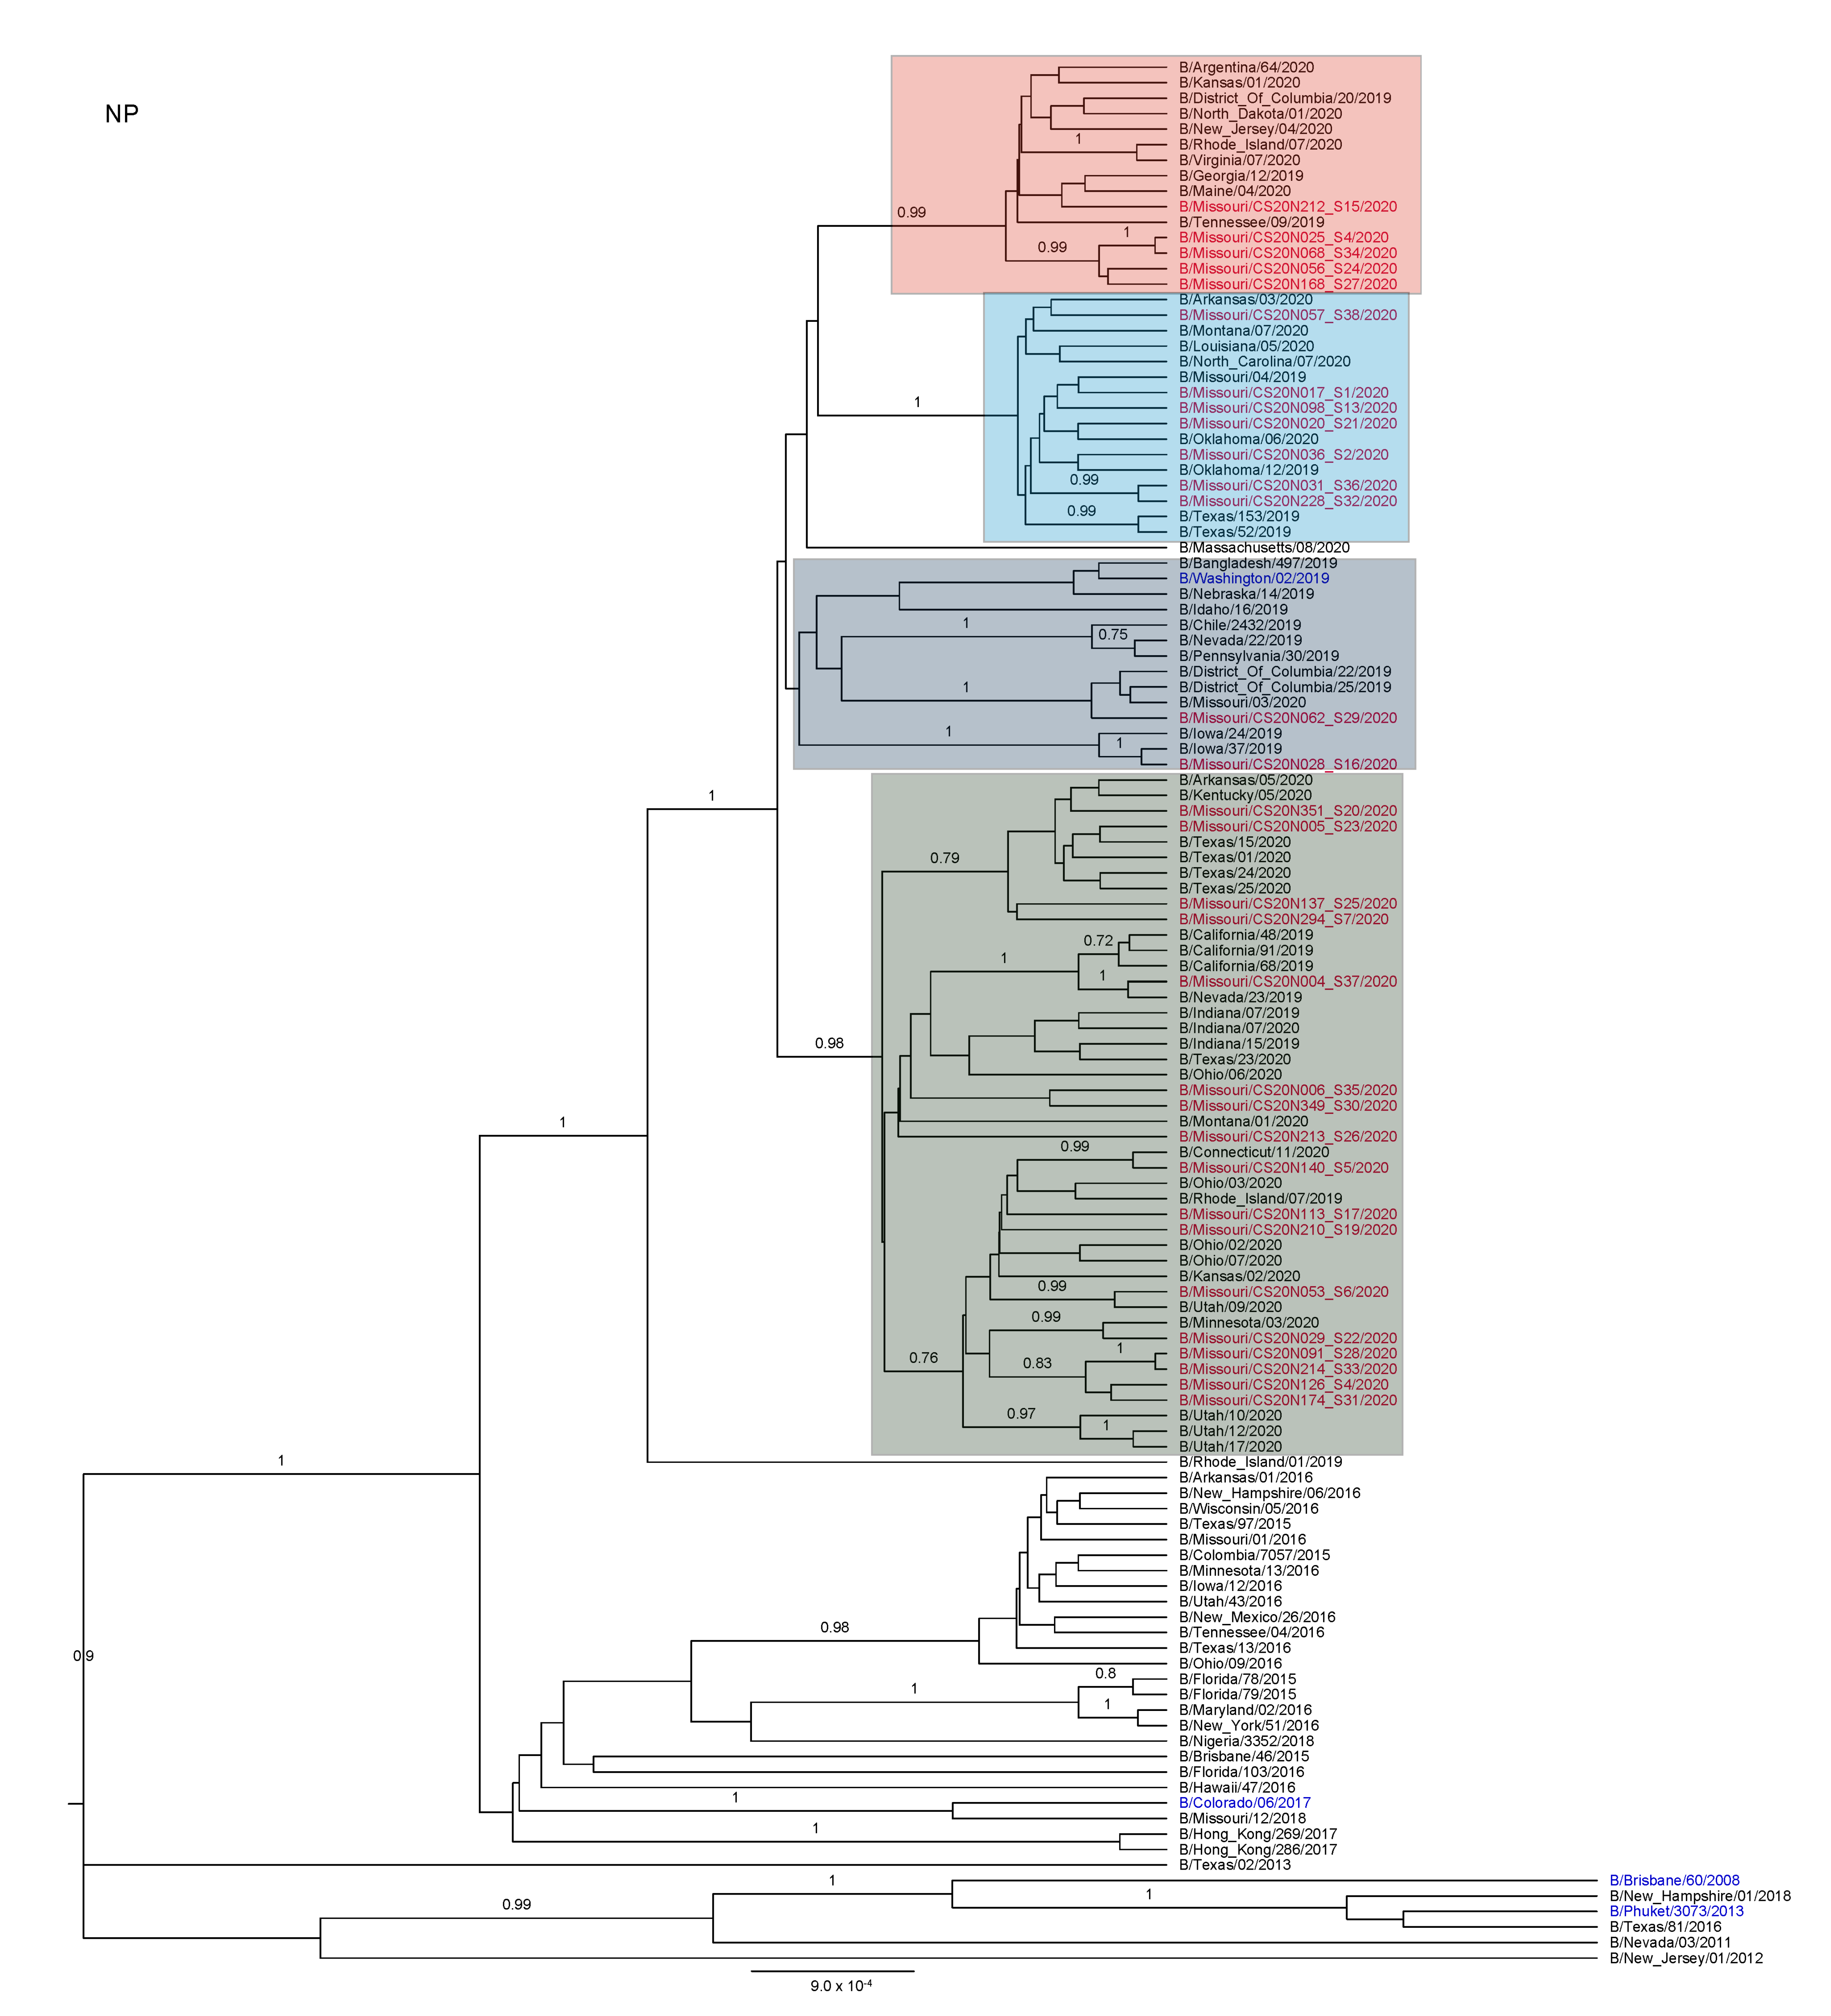
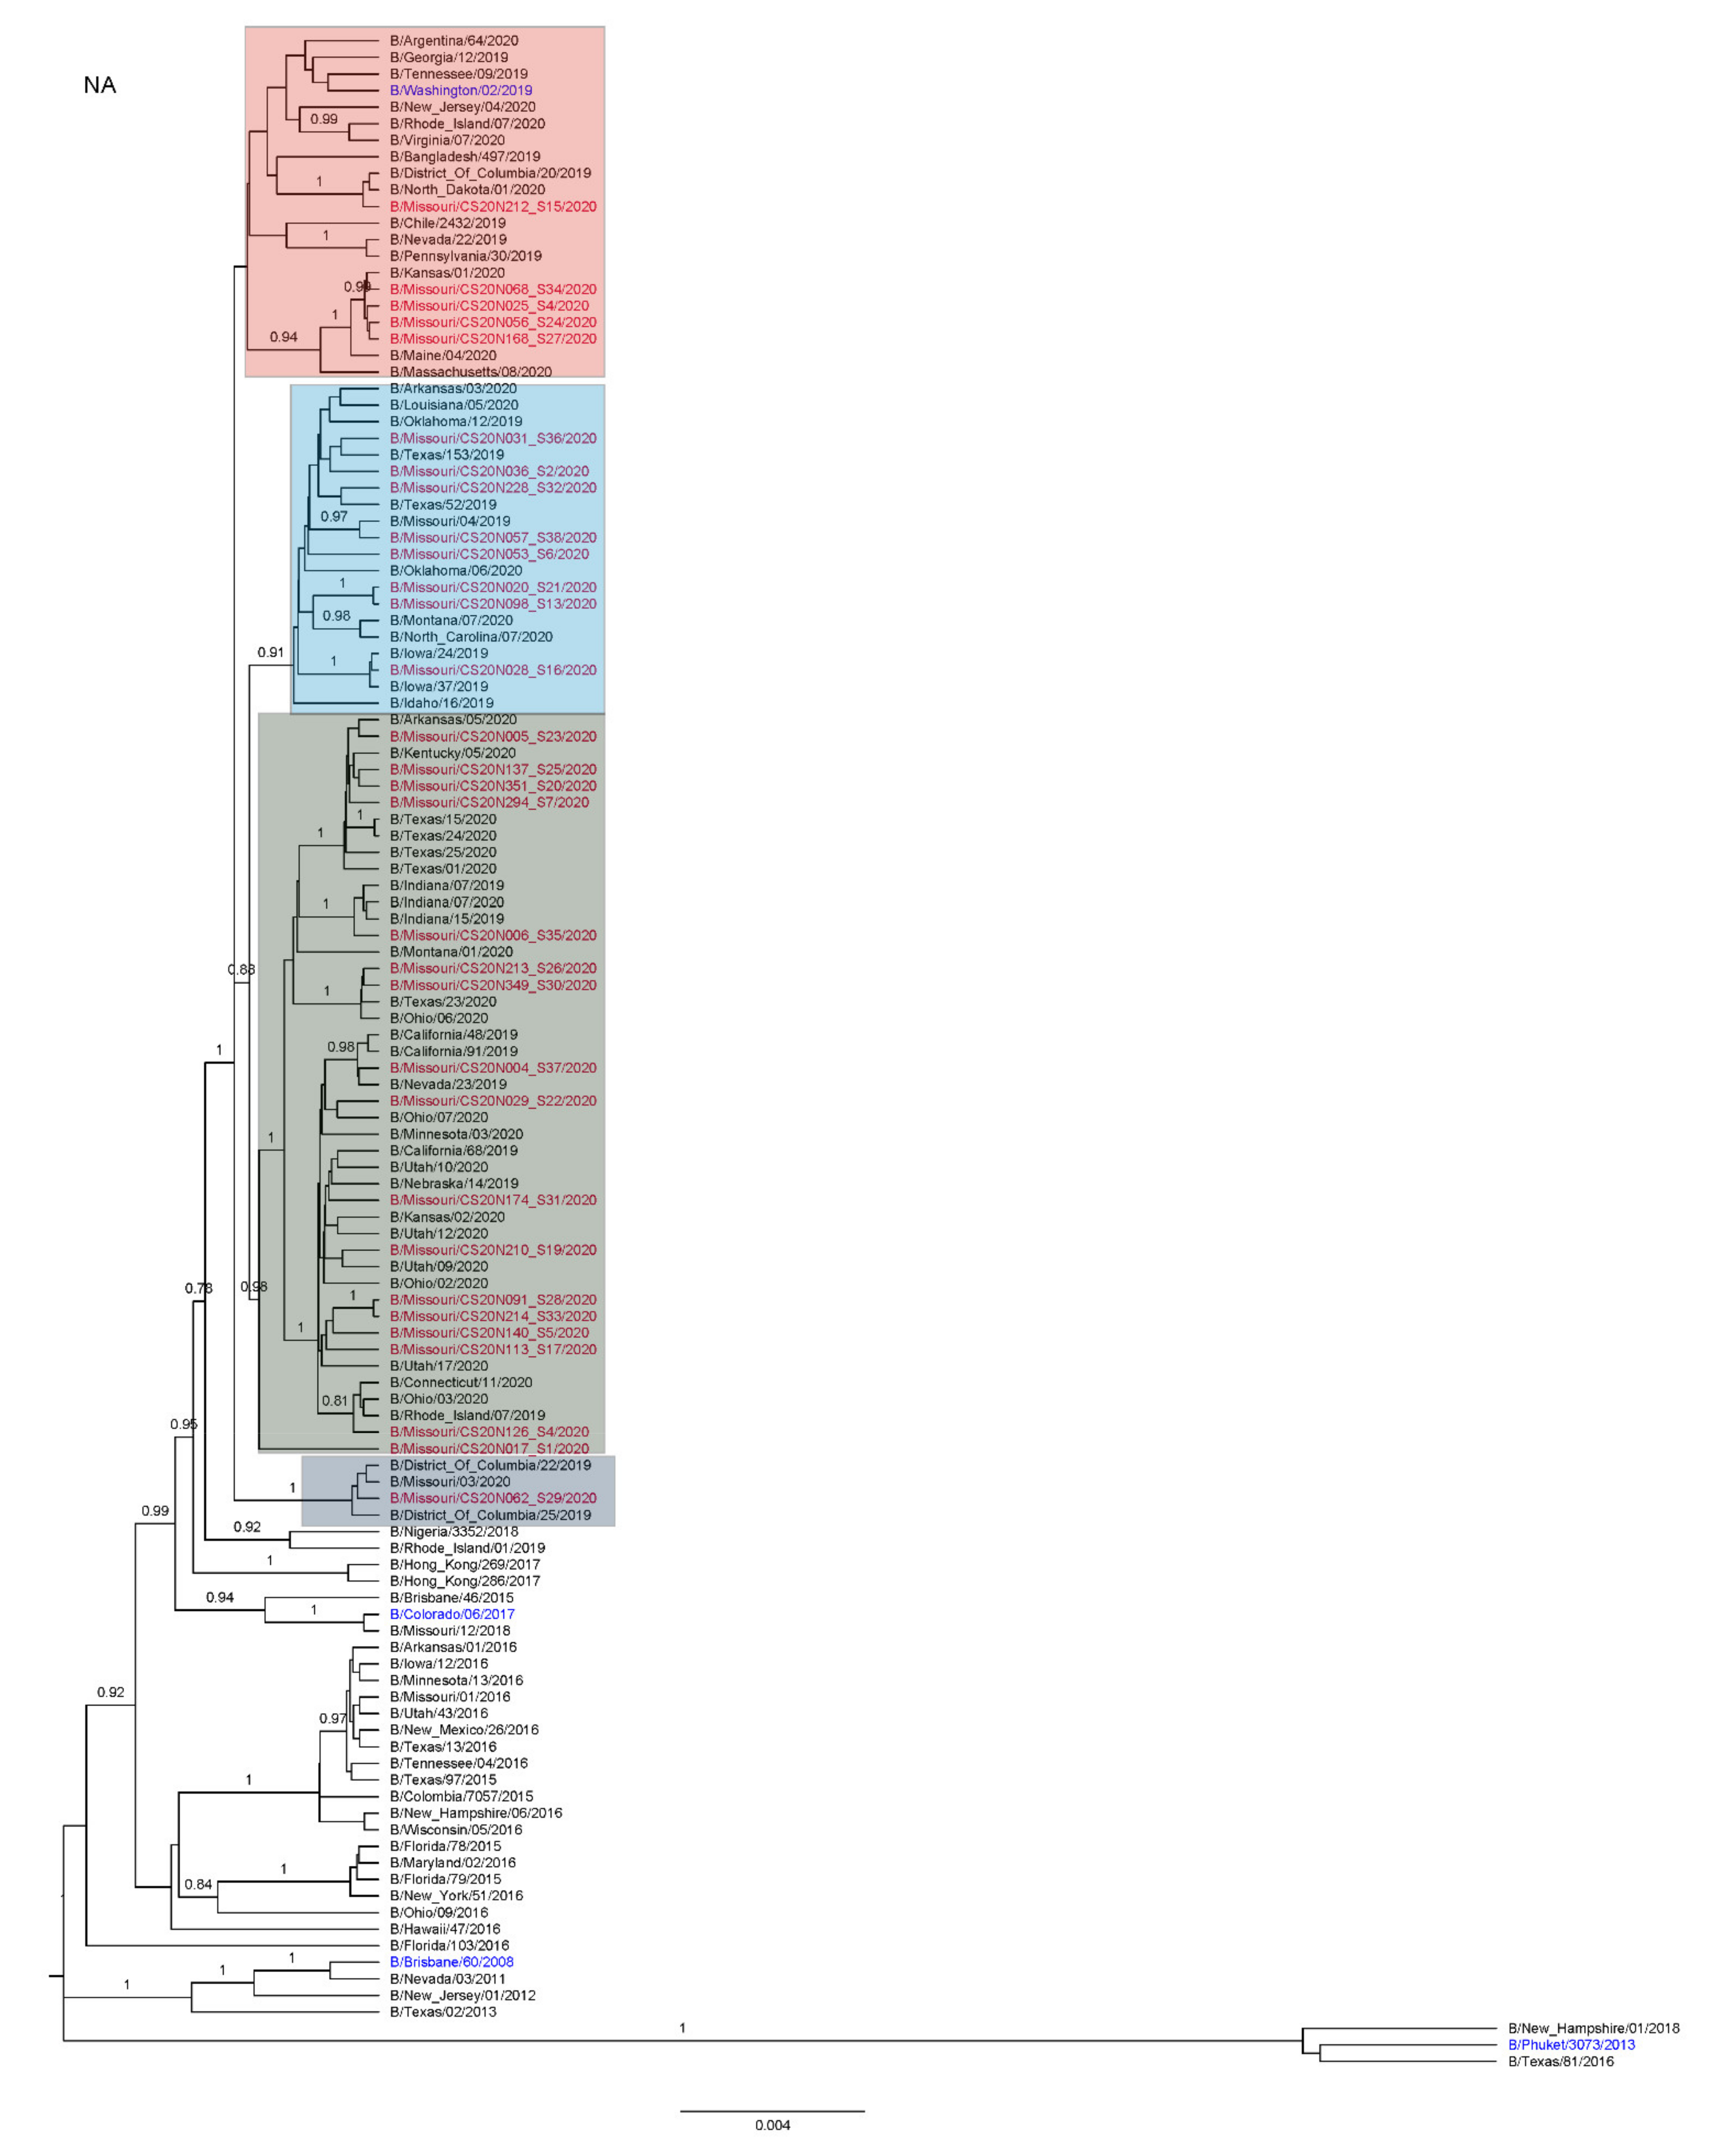
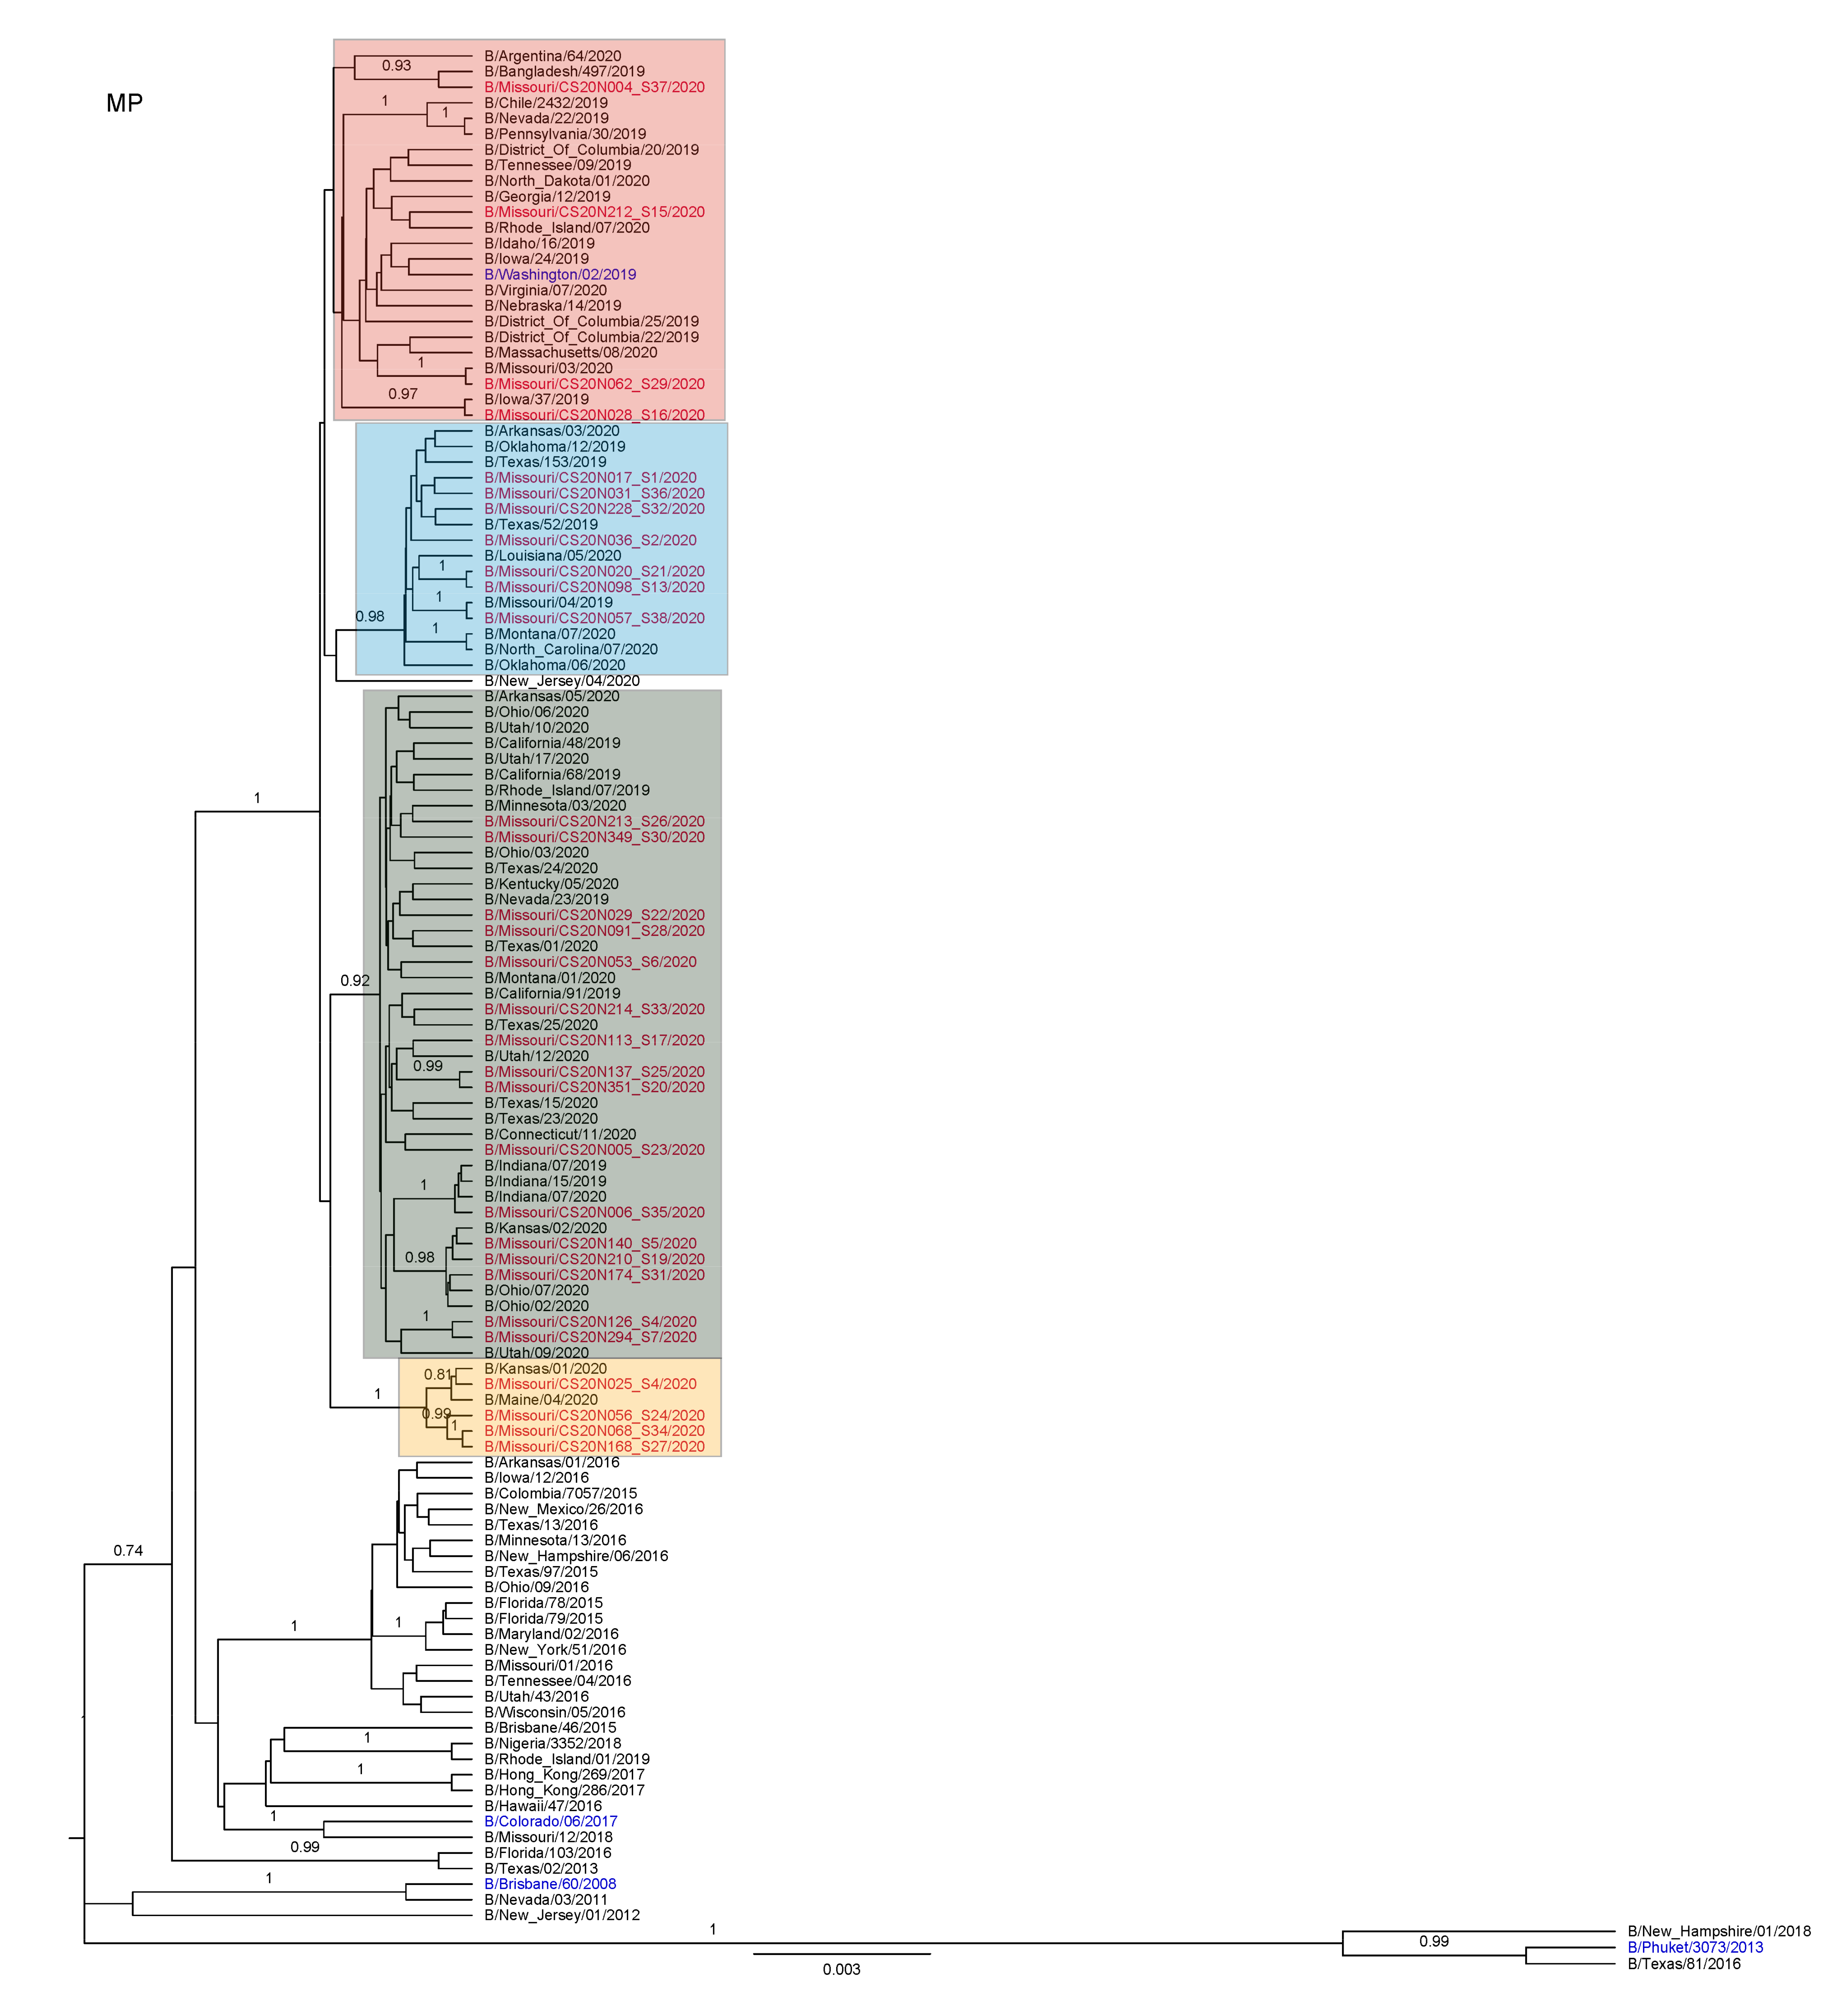
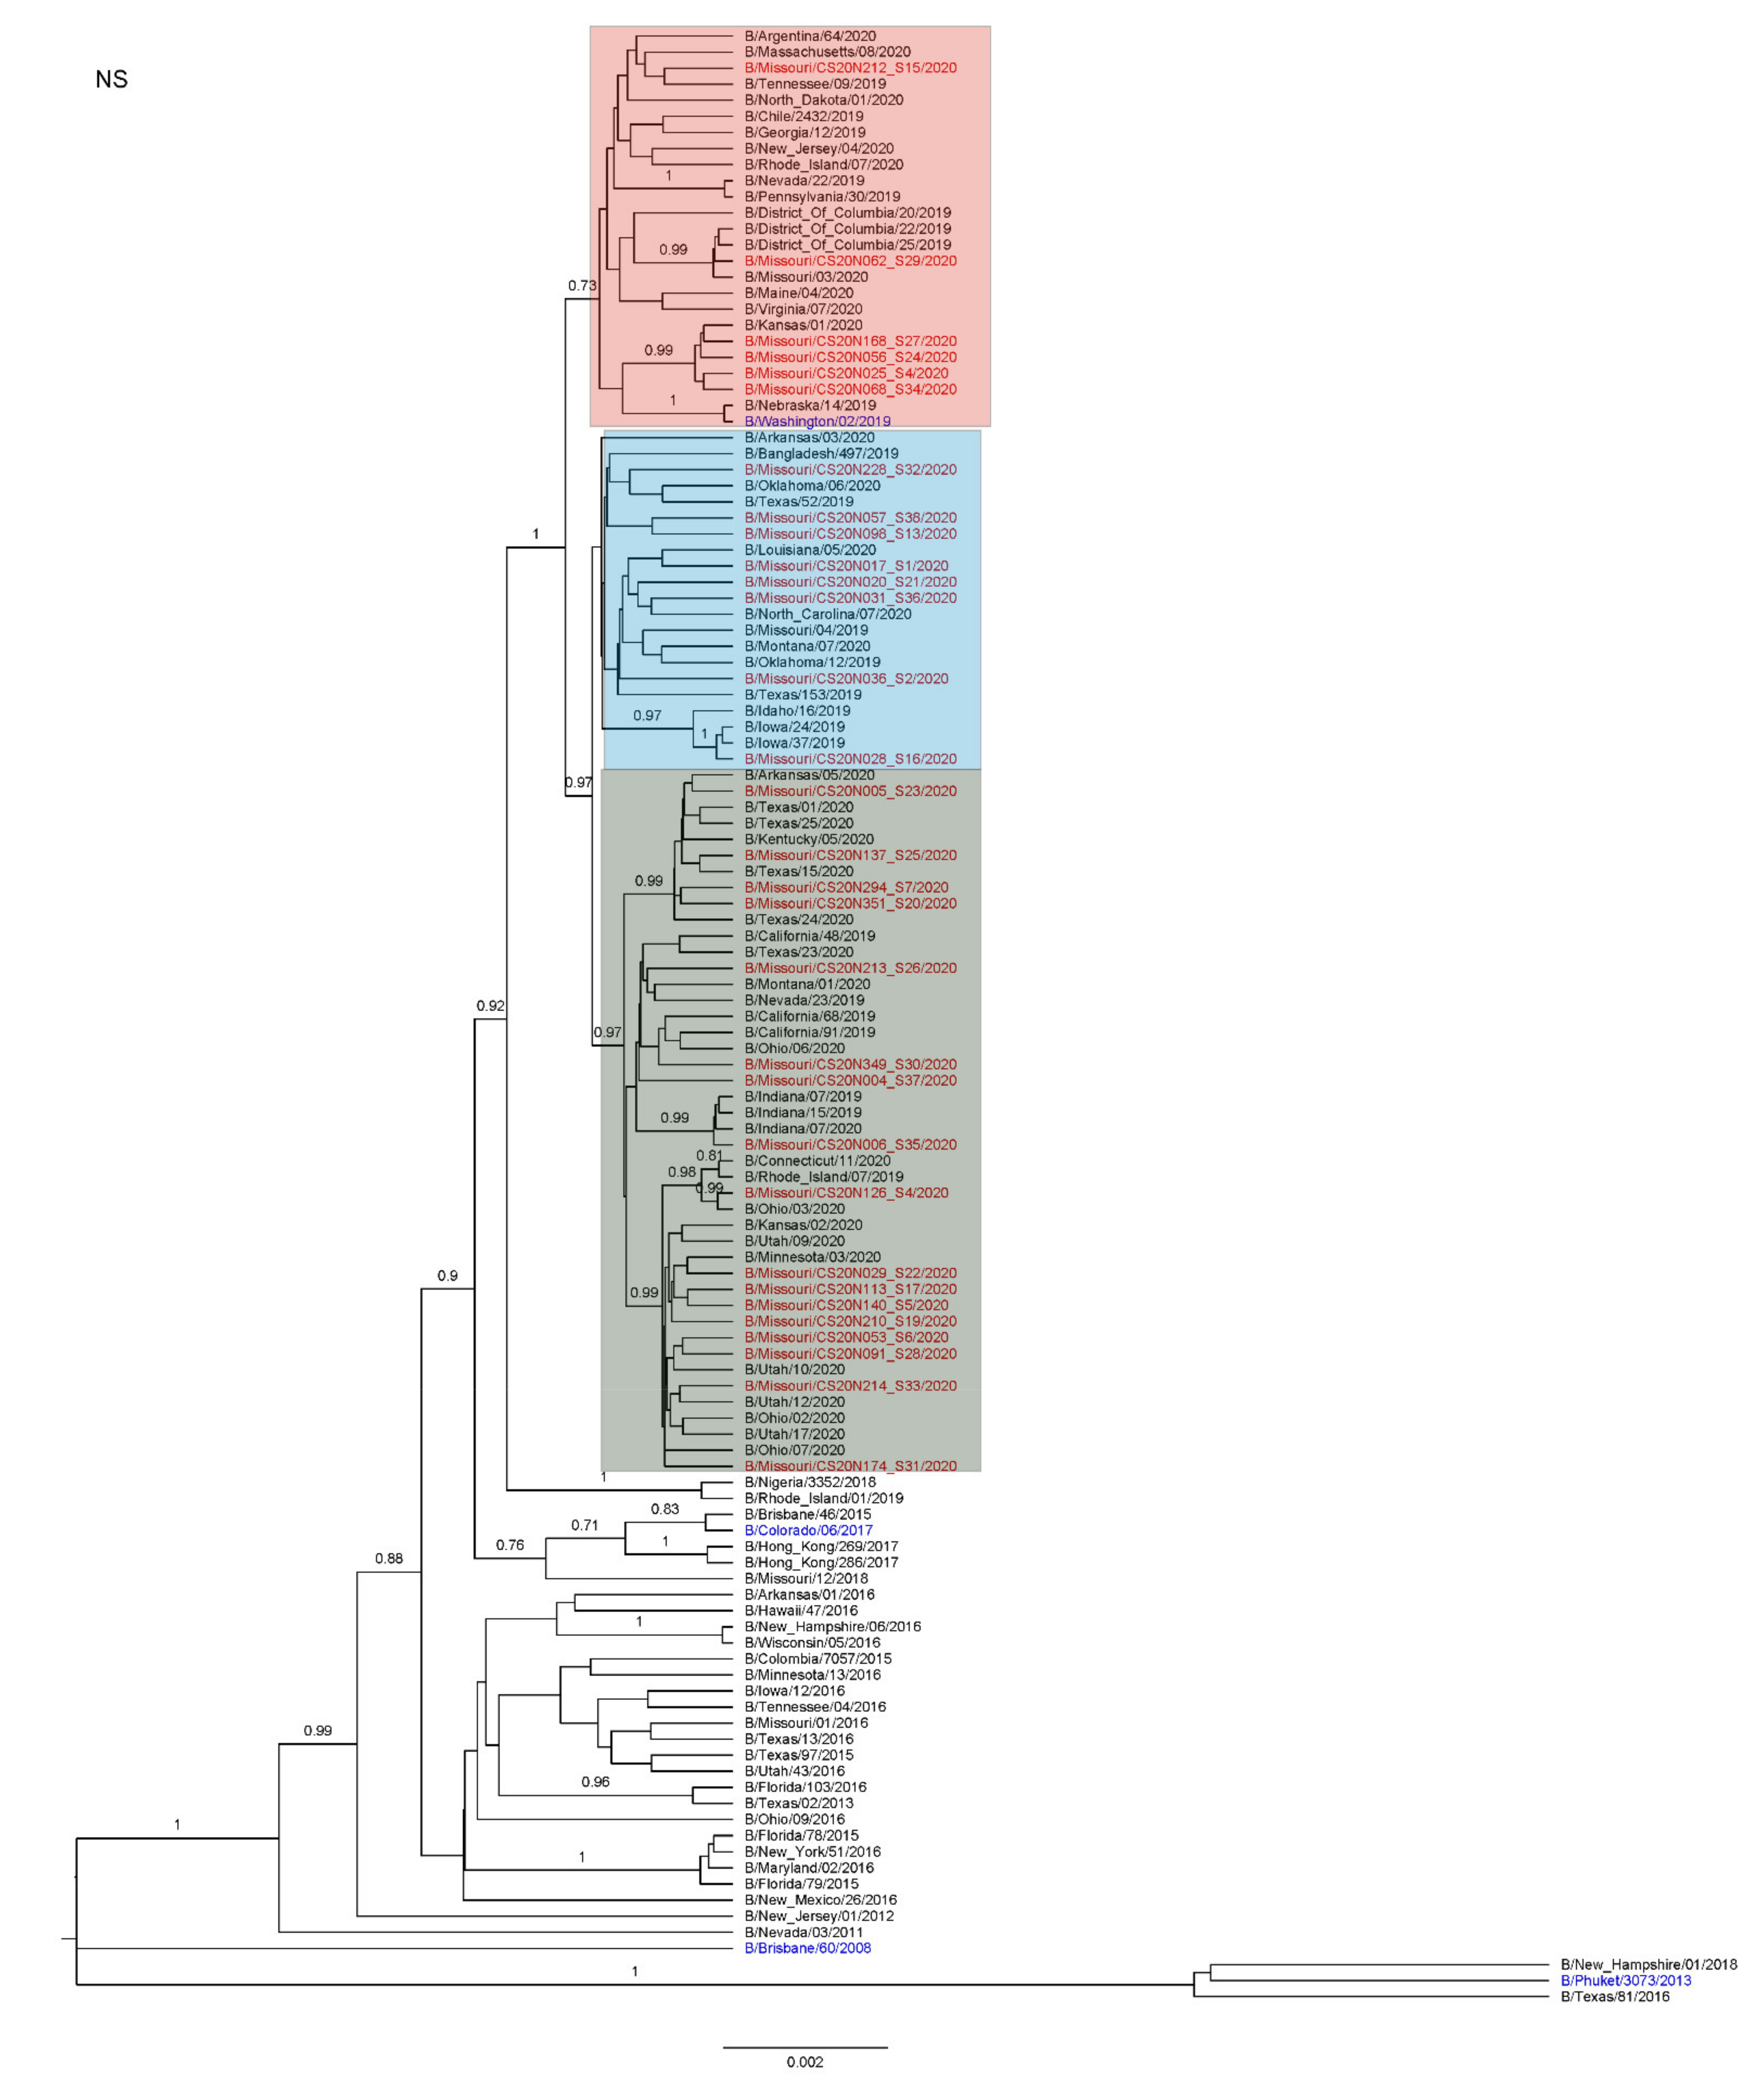
3.3. Antigenic and Genetic Diversity of Missourian IBV in the 2019–2020 Influenza Season

Phylogenetic analyses showed that the IBVs circulating during the 2019–2020 influenza season belonged to the Victoria lineage, all in the clade V1A.3-3DEL. Additionally, all samples contained three amino acid deletions (3DEL) at positions 162–164 of the HA protein sequences when compared with B/Brisbane/60/2008 (EPI_ISL_246494) as shown in Figure 3. Of note, the IBV vaccine strain used in the 2019–2020 influenza season (B/Colorado/06/2017) had two amino acid deletions (2DEL).

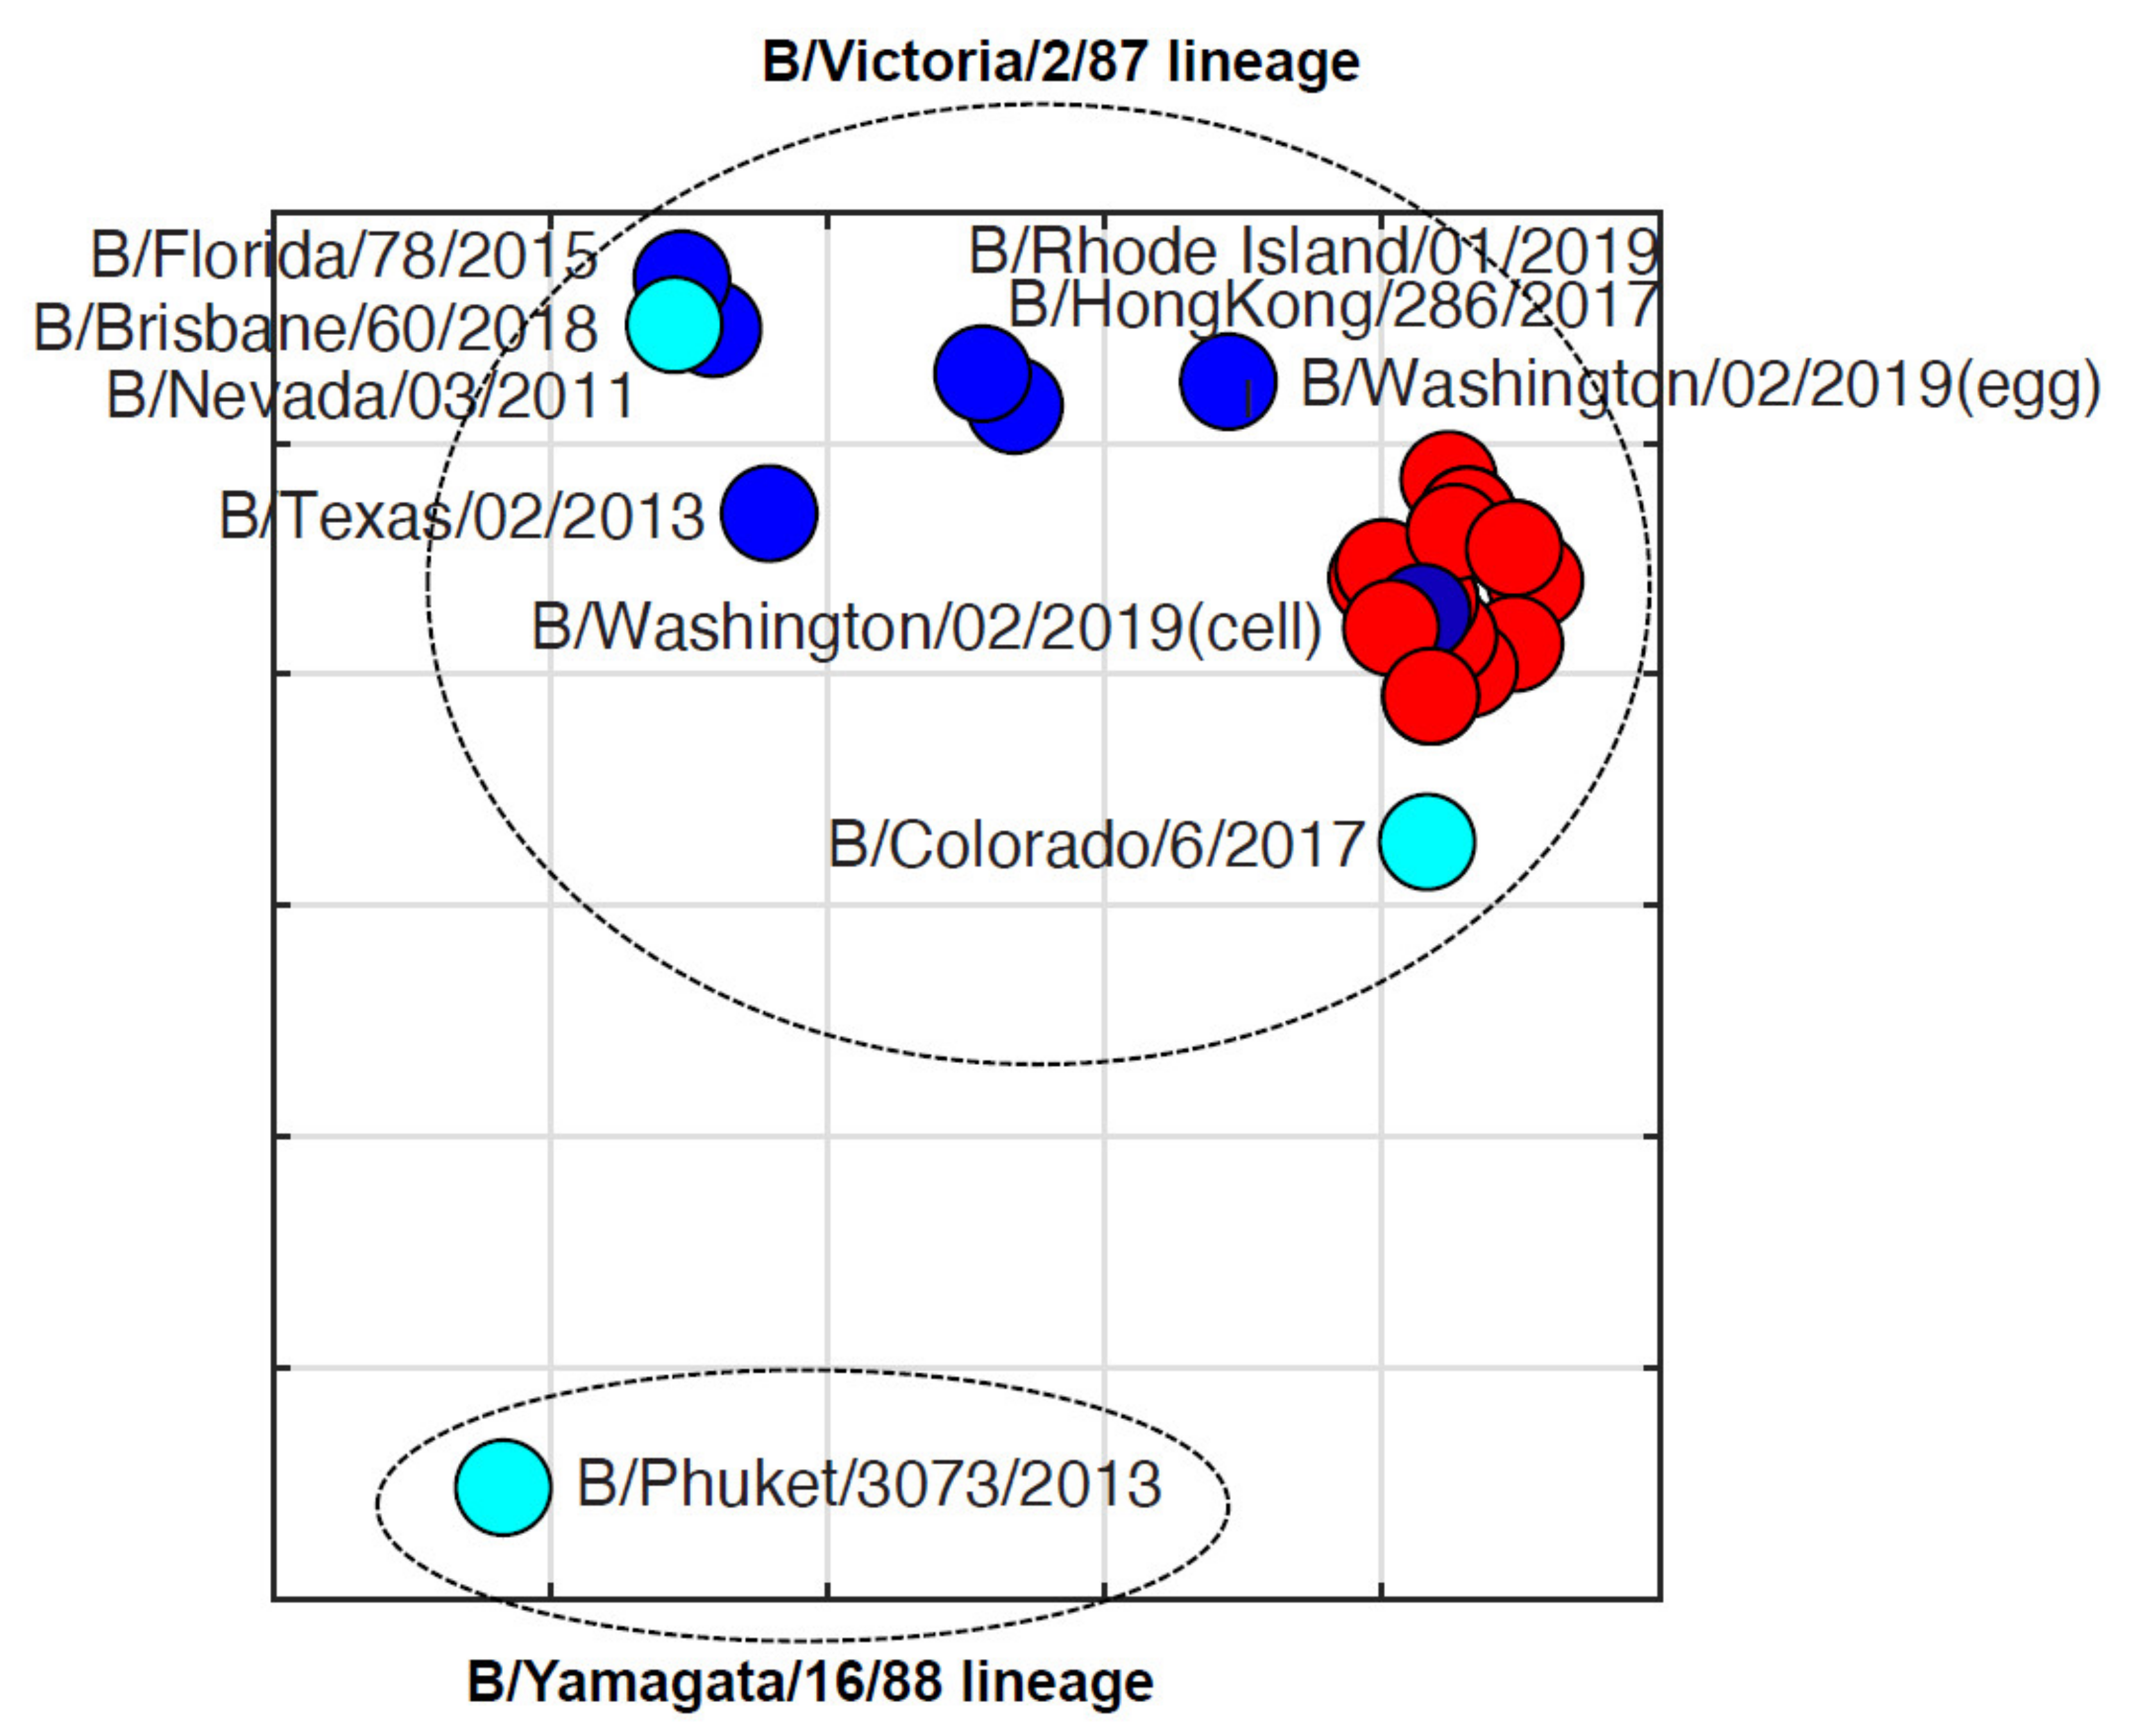
3.4. Antigenic Diversity of Missourian IBVs in the 2019–2020 Influenza Season

To test the antigenic diversity of the IBVs, hemagglutination inhibition assays and antigenic cartography were performed for 32 Missouri isolates and 11 reference strains against seven ferret sera for six representative IBVs (B/Colorado/6/2017, B/Nevada/03/2011, B/Texas/02/2013, B/Brisbane/60/2008, B/Washington/02/2019, and B/Wisconsin/1/2010). The sera for egg and cell isolates of B/Washington/02/2019 were included (Table 4). Antigenic analyses suggested all Missourian isolates reacted well to the Victoria lineage IBV-derived ferret sera but poorly with the Yamagata lineage IBV-derived ferret sera. Of all ferret sera, all Missourian isolates had the highest HI titers against B/Washington/02/2019, which also has the 3DEL, but 4- to 8-fold lower titers against B/Colorado/06/2017, which is the vaccine strain used during the 2019–2020 season and contains the 2DEL [51]. Of note, these Missouri isolates reacted better to the ferret antisera against the cell isolate than the egg isolate of B/Washington/02/2019.
Antigenic cartography showed that these Missouri isolates have an average antigenic distance of 1.60 ± 0.22 units from B/Colorado/06/2017 (Figure 4), suggesting these isolates are antigenically distinct from the vaccine used in this season. On the other hand, the average antigenic distances within Missourian isolates were 0.40 ± 0.21 units (Figure 4). Each unit represents a 2-fold change in hemagglutination inhibition titers.

4. Discussion

Influenza B viruses are endemic around the world, leading the World Health Organization (WHO) to recommend the inclusion of Yamagata and Victoria strains in the seasonal influenza vaccine [24]. While the use of clinical swab samples for vaccine development would be ideal in minimizing cell- and egg-adapted mutations, this is not yet feasible. Previous studies have identified MDCK cells to promote the most viral growth when compared with Vero cells, both of which have been used frequently in influenza studies [25]. We extended this finding by testing our sample growth on various MDCK cell lines, including hCK, CCL34, and SIAT1 and found that the hCK cell lines showed the highest performance for both IAV and IBV following the first passage, consistent with findings by Takada et al. [37]. Higher replication efficiency results in fewer required passages and likely fewer cell adaptations. This finding suggests hCK cell lines are an effective platform for virus isolation and propagation and potentially allow for fewer culture adaptations during vaccine development.
During the 2019–2020 influenza season in the US, influenza caused 400,000 hospitalizations and 22,000 deaths [52]. Notably, influenza B and predominantly the B/Victoria lineage (>99% of IBVs) emerged unusually early in the season and made up approximately half of all influenza cases compared with 10–30% in prior years [53,54,55]. Of the IBVs, 97% belonged to subclade V1A.3 as compared with the B/Victoria vaccine reference strain (B/Colorado/06/2017) recommended by the WHO for the 2019–2020 season [54]. The B/Colorado/06/2017-like strain recommended by the WHO contains 2DEL at 162–163, which confers reduced hemagglutinin inhibition cross-reactivity against viruses with 3DEL [56]. However, most of the circulating strains (V1A.3 subclade) contained three amino acid deletions at positions 162–164 of the HA protein sequence [57]. The overall VE for the 2019–2020 season was 46% [57]. Similarly, our study showed that all influenza B strains that were collected in Columbia, Missouri belonged to the Victoria lineage, contained the 3DEL, and were antigenically distinct from the vaccine strain used during this season (Figure 4). As the primary influenza epidemic occurred between February and March of 2020 in this influenza season, the sampling period was somewhat limited, and the inclusion of samples outside of the influenza peak time period may have provided additional insights to the antigenic and genetic evolution of IBVs in this season.
In addition to the antigenic mismatch between the vaccine and circulating influenza B strain due to an unusually early emergence and predominance of IBVs, we demonstrated that 13 hCK cell-adapted mutations were present in the first passage of Missouri strains during the 2019–2020 season. In our samples, no mutations were identified on the antibody binding sites of HA and NA proteins, although a single adaptation was identified at the HA2 protein. However, multiple adaptations in the RdRp were generated during the isolation and propagation of the original wild-type viruses. The effects of mutations in the RdRp have been shown to contribute towards influenza A pathogenicity [58]. However, this process is not well studied in influenza B. The mutations that were identified in the RdRp have not been previously reported, and, as future studies, we plan to explore the antigenic and pathogenic implications of cell-adapted mutations in the RdRp. Further exploration the IBV genomic sequences for the isolates in the GISAID database revealed no or low frequencies for the nonsynonymous mutation site mutations that we observed in the hCK-derived isolates (for example, NP-140 (2 of 11,110 GISAID sequences; 2/11,110), PB2-98 (9/11,121), PB1-350 (1/11,122), and HA-581 (0/11,132)).
One potential limitation for this study is that we performed analyses for the paired swab only with hCK-derived isolates but not Siat1-, CCL34-, or egg-derived isolates. In addition, the number of paired swab clinical samples (n = 31) included in this study is relatively small. Nevertheless, through analyses with those paired samples in the public database, when the entirety of the available Victoria lineage pairs from GISAID were analyzed, cell- and egg-adapted mutations were identified in the majority of protein segments (Table 3; Figure 2). Egg-adapted mutations occurred more frequently than cell-adapted mutations. Multiple reoccurrences appeared at the HA 212 and 214 positions (Figure 2), of which site 212 has been identified as a site of N-glycosylation that undergoes positive selection and frequent mutation (PDB 4FQM) [59]. Cell-adapted mutations at position 212 on HA have also been shown to decrease acid stability in H3N2 viruses in ferret models [60]. Four antigenic sites have been identified in IBVs and are located on the 120-, 150-, and 160-loops and the 190-helix [61]. The 212 and 214 positions reside on the receptor binding domain (RBD) and 190-helix of HA (Figure 2). Additionally, one sequence contained a cell-adapted mutation in the 120-loop (E143K) (Appendix A). Of interest, this observation is different from the mutations in the Missouri swab and hCK samples, which were only present in the internal genes, particularly in the RNA polymerase complex. The HA protein plays a major role in host receptor binding and membrane fusion, and mutations at the RBD and antibody binding sites may affect the antigenic characteristics of and immune responses against IBVs. Culture-adapted mutations during vaccine development at this gene may lead to antigenic variants from the circulating virus.
Analysis of the GISAID database confirms our findings that cell culture-adapted mutations occur in Victoria lineage IBVs, though infrequently. We also found that egg adaptations occurred 5.7 times more often than cell-adapted mutations, and such adapted mutations were reported to be under positive selection due to egg culture [62]. The adapted mutations in HA, particularly those in or close to receptor binding sites, may alter virus receptor binding properties to increase replication in eggs [63]. Similar to our findings, Park et al. showed that H3N2 viruses cultured in eggs had more frequent antigenic mutations in the HA protein than in cells, where they found no antigenic mutations [64]. These culture-adapted mutations have been suggested to compromise vaccine effectiveness for IAVs in humans during multiple influenza seasons [32,33,34,35,36] and remain a concern. Nevertheless, our study showed that using cell culture can help mitigate these challenges.
In summary, our study suggests that cell culture generates less frequent culture-adapted mutations than egg culture for isolating IBVs and that, of the commonly used MDCK cell lines tested, hCK is the most effective platform for IBV isolation. Additionally, culture-adapted mutations may occur in IBVs even after a single passage in hCK cells, and these mutations could generate biases on our understanding of the viral characteristics in the human population. As culture-adapted mutations may affect subsequent virus studies and vaccine development, the knowledge from this study may help optimize strategies for influenza surveillance, vaccine strain selection, and vaccine development.

Author Contributions

Conceptualization, X.-F.W.; investigation, C.Y.T., K.S., X.-F.W., T.L., J.H.; data curation, K.S., M.G., X.Z., J.A.M., S.M.; writing—original draft preparation, C.Y.T., K.S.; writing—review and editing, X.-F.W., C.Y.T., K.S., M.G., J.A.M., X.Z., T.L., J.H.; visualization, C.Y.T., X.-F.W.; supervision, X.-F.W.; project administration, X.-F.W.; funding acquisition, X.-F.W. All authors have read and agreed to the published version of the manuscript.

Funding

This research was funded by NIH, grant numbers R01AI147640 and 5T32LM012410.

Institutional Review Board Statement

The study was conducted according to the guidelines of the Declaration of Helsinki, and approved by the Institutional Review Board of the University of Missouri (protocol code 2018661 and date of approval 1 August 2020).

Informed Consent Statement

Patient consent was waived due to the de-identified nature of the aggregated descriptive data.

Data Availability Statement

The data presented in this study are openly available in the GenBank (accession numbers: MZ951177–MZ951671).

Acknowledgments

We would like to acknowledge Doek Han, Kyle Small, and Kaitlyn Waters for their assistance in sample collection. We gratefully acknowledge Yoshihiro Kawaoka for providing the hCK cells, Mikhail Matrosovich for providing the MDCK-Siat1 cells, Biodefense and Emerging Infections (BEI) Research Resources Repository for the MDCK-CCL34 cells, the International Reagent Resources (IRR) for the ferret antisera, John Steel for the antisera for B/Washington/02/2019, and Bo Shu and David Wentworth for the CDC primers panel. We further acknowledge the scientists responsible for obtaining the specimens and sharing them via the GISAID Initiative and the Influenza Research Database.

Conflicts of Interest

The authors declare no conflict of interest.

Appendix A

Full phylogenetic trees of each IBV protein segment. Missouri 2019–2020 sequences are shown in red and vaccine strains are shown in blue. Each cluster is grouped within colored boxes. The phylogenetic analyses were performed by using BEAST2 with a Hasegawa–Kishino–Yano (HKY) substitution empirical model, strict clock model, and coalescent constant population prior. Branches with a posterior probability >0.70 were labeled.
Figure A1. PB2 Tree. The phylogenetic analyses were performed by using BEAST2 with a Hasegawa–Kishino–Yano (HKY) substitution empirical model, strict clock model, and coalescent constant population prior. Branches with a posterior probability >0.70 were labeled.
Viruses 13 01896 g0a1
Figure A2. PB1 Tree. The phylogenetic analyses were performed by using BEAST2 with a Hasegawa–Kishino–Yano (HKY) substitution empirical model, strict clock model, and coalescent constant population prior. Branches with a posterior probability >0.70 were labeled.
Viruses 13 01896 g0a2
Figure A3. PA Tree. The phylogenetic analyses were performed by using BEAST2 with a Hasegawa–Kishino–Yano (HKY) substitution empirical model, strict clock model, and coalescent constant population prior. Branches with a posterior probability >0.70 were labeled.
Viruses 13 01896 g0a3
Figure A4. HA Tree. The phylogenetic analyses were performed by using BEAST2 with a Hasegawa–Kishino–Yano (HKY) substitution empirical model, strict clock model, and coalescent constant population prior. Branches with a posterior probability >0.70 were labeled.
Viruses 13 01896 g0a4
Figure A5. NP Tree. The phylogenetic analyses were performed by using BEAST2 with a Hasegawa–Kishino–Yano (HKY) substitution empirical model, strict clock model, and coalescent constant population prior. Branches with a posterior probability >0.70 were labeled.
Viruses 13 01896 g0a5
Figure A6. NA Tree. The phylogenetic analyses were performed by using BEAST2 with a Hasegawa–Kishino–Yano (HKY) substitution empirical model, strict clock model, and coalescent constant population prior. Branches with a posterior probability >0.70 were labeled.
Viruses 13 01896 g0a6
Figure A7. MP Tree. The phylogenetic analyses were performed by using BEAST2 with a Hasegawa–Kishino–Yano (HKY) substitution empirical model, strict clock model, and coalescent constant population prior. Branches with a posterior probability >0.70 were labeled.
Viruses 13 01896 g0a7
Figure A8. NS Tree. The phylogenetic analyses were performed by using BEAST2 with a Hasegawa–Kishino–Yano (HKY) substitution empirical model, strict clock model, and coalescent constant population prior. Branches with a posterior probability >0.70 were labeled.
Viruses 13 01896 g0a8

References

  1. World Health Organization. Burden of Disease, Global Influenza Programme. Available online: https://www.who.int/teams/global-influenza-programme/surveillance-and-monitoring/burden-of-disease (accessed on 16 June 2021).
  2. Medina, R.A.; Stertz, S.; Manicassamy, B.; Zimmermann, P.; Sun, X.; Albrecht, R.; Uusi-Kerttula, H.; Zagordi, O.; Belshe, R.B.; Frey, S.E.; et al. Glycosylations in the Globular Head of the Hemagglutinin Protein Modulate the Virulence and Antigenic Properties of the H1N1 Influenza Viruses. Sci. Transl. Med. 2013, 5, 187ra70. [Google Scholar] [CrossRef] [Green Version]
  3. Young, J.F.; Desselberger, U.; Palese, P. Evolution of human influenza a viruses in nature: Sequential mutations in the genomes of new H1N1 isolates. Cell 1979, 18, 73–83. [Google Scholar] [CrossRef]
  4. Centers for Disease Control and Prevention. Swine influenza A (H1N1) infection in two children—Southern California, March-April 2009. Morb. Mortal. Wkly. Rep. 2009, 58, 400–402. [Google Scholar] [PubMed]
  5. Centers for Disease Control and Prevention. Update: Novel influenza A (H1N1) virus infections—Worldwide, May 6, 2009. Morb. Mortal. Wkly. Rep. 2009, 58, 453–458. [Google Scholar] [PubMed]
  6. Wentworth, D.; McGregor, M.W.; Macklin, M.D.; Neumann, V.; Hinshaw, V.S. Transmission of Swine Influenza Virus to Humans after Exposure to Experimentally Infected Pigs. J. Infect. Dis. 1997, 175, 7–15. [Google Scholar] [CrossRef] [PubMed] [Green Version]
  7. Chang, W.K. National influenza experience in Hong Kong, 1968. Bull. World Heal. Organ. 1969, 41, 349–351. [Google Scholar] [PubMed]
  8. Francis, T., Jr. A NEW TYPE OF VIRUS FROM EPIDEMIC INFLUENZA. Science 1940, 92, 405–408. [Google Scholar] [CrossRef] [PubMed]
  9. Rota, P.A.; Wallis, T.R.; Harmon, M.W.; Rota, J.S.; Kendal, A.P.; Nerome, K. Cocirculation of two distinct evolutionary lineages of influenza type B virus since 1983. Virology 1990, 175, 59–68. [Google Scholar] [CrossRef]
  10. Kanegae, Y.; Sugita, S.; Endo, A.; Ishida, M.; Senya, S.; Osako, K.; Nerome, K.; Oya, A. Evolutionary pattern of the hemagglutinin gene of influenza B viruses isolated in Japan: Cocirculating lineages in the same epidemic season. J. Virol. 1990, 64, 2860–2865. [Google Scholar] [CrossRef] [PubMed] [Green Version]
  11. Jin, S.; Li, J.; Cai, R.; Wang, X.; Gu, Z.; Yu, H.; Fang, B.; Chen, L.; Wang, C. Age- and sex-specific excess mortality associated with influenza in Shanghai, China, 2010–2015. Int. J. Infect. Dis. 2020, 98, 382–389. [Google Scholar] [CrossRef] [PubMed]
  12. Sharma, L.; Rebaza, A.; Dela Cruz, C.S. When “B” becomes “A”: The emerging threat of influenza B virus. Eur. Respir. J. 2019, 54, 1901325. [Google Scholar] [CrossRef] [PubMed]
  13. Centers for Disease Control and Prevention. Influenza-associated pediatric deaths—United States, September 2010-August 2011 (2011). Morb. Mortal. Wkly. Rep. 2011, 60, 1233–1238. [Google Scholar] [PubMed]
  14. Tran, D.; Vaudry, W.; Moore, D.; Bettinger, J.; Halperin, S.A.; Scheifele, D.; Jadvji, T.; Lee, L.; Mersereau, T.; for the members of the Canadian Immunization Monitoring Program Active. Hospitalization for Influenza A Versus, B. Pediatrics 2016, 138, e20154643. [Google Scholar] [CrossRef] [PubMed] [Green Version]
  15. Carrat, F.; Flahault, A. Influenza vaccine: The challenge of antigenic drift. Vaccine 2007, 25, 6852–6862. [Google Scholar] [CrossRef] [PubMed]
  16. World Health Organization Regional Office for Europe. How Pandemic Influenza Emerges. Available online: https://www.euro.who.int/en/health-topics/communicable-diseases/influenza/pandemic-influenza/how-pandemic-influenza-emerges. (accessed on 20 June 2021).
  17. Vijaykrishna, D.; Holmes, E.C.; Joseph, U.; Fourment, M.; Sum, Y.C.; Halpin, R.; Lee, R.T.; Deng, Y.M.; Gunalan, V.; Lin, X.; et al. The contrasting phylodynamics of human influenza B viruses. Elife 2015, 4, e05055. [Google Scholar] [CrossRef] [PubMed]
  18. Rambaut, A.; Pybus, O.G.; Nelson, M.I.; Viboud, C.; Taubenberger, J.K.; Holmes, E.C. The genomic and epidemiological dynamics of human influenza A virus. Nature 2008, 453, 615–619. [Google Scholar] [CrossRef] [PubMed] [Green Version]
  19. Chen, R.; Holmes, E.C. The Evolutionary Dynamics of Human Influenza B Virus. J. Mol. Evol. 2008, 66, 655–663. [Google Scholar] [CrossRef] [PubMed] [Green Version]
  20. Wang, Y.-F.; Chang, C.-F.; Chi, C.-Y.; Wang, H.-C.; Wang, J.-R.; Su, I.-J. Characterization of glycan binding specificities of influenza B viruses with correlation with hemagglutinin genotypes and clinical features. J. Med. Virol. 2012, 84, 679–685. [Google Scholar] [CrossRef] [PubMed]
  21. Velkov, T. The specificity of the influenza B virus hemagglutinin receptor binding pocket: What does it bind to? J. Mol. Recognit. 2013, 26, 439–449. [Google Scholar] [CrossRef] [PubMed]
  22. Harper, S.; Fukuda, K.; Uyeki, T.M.; Cox, N.J.; Bridges, C.B. Prevention and control of influenza: Recommendations of the Advisory Committee on Immunization Practices (ACIP). Morb. Mortal. Wkly. Rep. Recomm. Rep. 2005, 54, 1–41. [Google Scholar]
  23. Ferdinands, J.M.; Gaglani, M.; Martin, E.T.; Middleton, D.; Monto, A.S.; Murthy, K.; Silveira, F.P.; Talbot, H.K.; Zimmerman, R.; Alyanak, E.; et al. Prevention of Influenza Hospitalization Among Adults in the United States, 2015-2016: Results From the US Hospitalized Adult Influenza Vaccine Effectiveness Network (HAIVEN). J. Infect. Dis. 2019, 220, 1265–1275. [Google Scholar] [CrossRef]
  24. Influenza Research Database. World Health Organization Recommendations for Composition of Influenza Vaccines. 2021. Available online: https://www.fludb.org/brc/vaccineRecommend.spg?decorator=influenza (accessed on 20 June 2021).
  25. Youil, R.; Su, Q.; Toner, T.J.; Szymkowiak, C.; Kwan, W.S.; Rubin, B.; Petrukhin, L.; Kiseleva, I.; Shaw, A.R.; DiStefano, D. Comparative study of influenza virus replication in Vero and MDCK cell lines. J. Virol. Methods 2004, 120, 23–31. [Google Scholar] [CrossRef]
  26. Gambaryan, A.; Robertson, J.; Matrosovich, M. Effects of Egg-Adaptation on the Receptor-Binding Properties of Human Influenza A and B Viruses. Virology 1999, 258, 232–239. [Google Scholar] [CrossRef] [Green Version]
  27. Gambaryan, A.; Tuzikov, A.; Piskarev, V.; Yamnikova, S.; Lvov, D.; Robertson, J.; Bovin, N.; Matrosovich, M. Specification of Receptor-Binding Phenotypes of Influenza Virus Isolates from Different Hosts Using Synthetic Sialylglycopolymers: Non-Egg-Adapted Human H1 and H3 Influenza A and Influenza B Viruses Share a Common High Binding Affinity for 6′-Sialyl(N-acetyllactosamine). Virology 1997, 232, 345–350. [Google Scholar] [CrossRef]
  28. Gambaryan, A.; Marinina, V.; Tuzikov, A.; Bovin, N.; Rudneva, I.; Sinitsyn, B.; Shilov, A.; Matrosovich, M. Effects of Host-Dependent Glycosylation of Hemagglutinin on Receptor-Binding Properties of H1N1 Human Influenza A Virus Grown in MDCK Cells and in Embryonated Eggs. Virology 1998, 247, 170–177. [Google Scholar] [CrossRef] [Green Version]
  29. Govorkova, E.; Matrosovich, M.; Tuzikov, A.; Bovin, N.; Gerdil, C.; Fanget, B.; Webster, R. Selection of Receptor-Binding Variants of Human Influenza A and B Viruses in Baby Hamster Kidney Cells. Virology 1999, 262, 31–38. [Google Scholar] [CrossRef] [PubMed] [Green Version]
  30. Azzi, A.; Bartolomei-Corsi, O.; Zakrzewska, K.; Corcoran, T.; Newman, R.; Robertson, J.S.; Yates, P.; Oxford, J.S. The haemagglutinins of influenza A (H1N1) viruses in the ‘O’ or ‘D’ phases exhibit biological and antigenic differences. Epidemiol. Infect. 1993, 111, 135–142. [Google Scholar] [CrossRef] [PubMed] [Green Version]
  31. Rajaram, S.; Boikos, C.; Gelone, D.K.; Gandhi, A. Influenza vaccines: The potential benefits of cell-culture isolation and manufacturing. Ther. Adv. Vaccines Immunother. 2020, 8, 2515135520908121. [Google Scholar] [CrossRef] [PubMed]
  32. Rolfes, M.A.; Flannery, B.; Chung, J.R.; O’Halloran, A.; Garg, S.; Belongia, E.A.; Gaglani, M.; Zimmerman, R.K.; Jackson, M.L.; Monto, A.S.; et al. Us Influenza Vaccine Effectiveness Network tIHSN, the Assessment Branch ISDCfDC, Prevention. Effects of Influenza Vaccination in the United States During the 2017–2018 Influenza Season. Clin. Infect. Dis. 2019, 69, 1845–1853. [Google Scholar] [CrossRef] [Green Version]
  33. Xu, X.; Blanton, L.; Elal, A.I.A.; Alabi, N.; Barnes, J.; Biggerstaff, M.; Brammer, L.; Budd, A.P.; Burns, E.; Cummings, C.N.; et al. Update: Influenza Activity in the United States During the 2018–2019 Season and Composition of the 2019–2020 Influenza Vaccine. Morb. Mortal. Wkly. Rep. 2019, 68, 544–551. [Google Scholar] [CrossRef]
  34. Flannery, B.; Chung, J.R.; Thaker, S.N.; Monto, A.S.; Martin, E.T.; Belongia, E.A.; McLean, H.Q.; Gaglani, M.; Murthy, K.; Zimmerman, R.K.; et al. Interim Estimates of 2016-17 Seasonal Influenza Vaccine Effectiveness—United States, February 2017. Morb. Mortal Wkly. Rep. 2017, 66, 167–171. [Google Scholar] [CrossRef]
  35. McLean, H.Q.; Thompson, M.G.; Sundaram, M.E.; Kieke, B.A.; Gaglani, M.; Murthy, K.; Piedra, P.A.; Zimmerman, R.K.; Nowalk, M.P.; Raviotta, J.M.; et al. Influenza Vaccine Effectiveness in the United States During 2012–2013: Variable Protection by Age and Virus Type. J. Infect. Dis. 2014, 211, 1529–1540. [Google Scholar] [CrossRef] [PubMed] [Green Version]
  36. Disease Burden of Influenza. Available online: https://www.cdc.gov/flu/about/burden/index.html (accessed on 20 June 2021).
  37. Takada, K.; Kawakami, C.; Fan, S.; Chiba, S.; Zhong, G.; Gu, C.; Shimizu, K.; Takasaki, S.; Sakai-Tagawa, Y.; Lopes, T.J.S.; et al. A humanized MDCK cell line for the efficient isolation and propagation of human influenza viruses. Nat. Microbiol. 2019, 4, 1268–1273. [Google Scholar] [CrossRef] [PubMed]
  38. Matrosovich, M.; Matrosovich, T.; Carr, J.; Roberts, N.A.; Klenk, H.-D. Overexpression of the α-2,6-Sialyltransferase in MDCK Cells Increases Influenza Virus Sensitivity to Neuraminidase Inhibitors. J. Virol. 2003, 77, 8418–8425. [Google Scholar] [CrossRef] [PubMed] [Green Version]
  39. Oh, D.Y.; Barr, I.G.; Mosse, J.A.; Laurie, K.L. MDCK-SIAT1 Cells Show Improved Isolation Rates for Recent Human Influenza Viruses Compared to Conventional MDCK Cells. J. Clin. Microbiol. 2008, 46, 2189–2194. [Google Scholar] [CrossRef] [PubMed] [Green Version]
  40. Lin, S.-C.; Kappes, M.A.; Chen, M.-C.; Lin, C.-C.; Wang, T.T. Distinct susceptibility and applicability of MDCK derivatives for influenza virus research. PLoS ONE 2017, 12, e0172299. [Google Scholar] [CrossRef] [Green Version]
  41. World Health Organization. Manual for the Laboratory Diagnosis and Virological Surveillance of Influenza. World Health Organization. 2011. Available online: https://apps.who.int/iris/bitstream/handle/10665/44518/9789241548090_eng.pdf (accessed on 24 June 2021).
  42. Barnett, J.L.; Yang, J.; Cai, Z.; Zhang, T.; Wan, X.-F. AntigenMap 3D: An online antigenic cartography resource. Bioinformatics 2012, 28, 1292–1293. [Google Scholar] [CrossRef] [Green Version]
  43. Cai, Z.; Zhang, T.; Wan, X.-F. A Computational Framework for Influenza Antigenic Cartography. PLoS Comput. Biol. 2010, 6, e1000949. [Google Scholar] [CrossRef]
  44. Cai, Z.; Zhang, T.; Wan, X.-F. Concepts and applications for influenza antigenic cartography. Influ. Other Respir. Viruses 2011, 5, 204–207. [Google Scholar] [PubMed]
  45. Hoffmann, E.; Mahmood, K.; Yang, C.-F.; Webster, R.G.; Greenberg, H.; Kemble, G. Rescue of influenza B virus from eight plasmids. Proc. Natl. Acad. Sci. USA 2002, 99, 11411–11416. [Google Scholar] [CrossRef] [Green Version]
  46. Langat, P.; Raghwani, J.; Dudas, G.; Bowden, T.; Edwards, S.; Gall, A.; Bedford, T.; Rambaut, A.; Daniels, R.S.; Russell, C.A.; et al. Genome-wide evolutionary dynamics of influenza B viruses on a global scale. PLoS Pathog. 2017, 13, e1006749. [Google Scholar] [CrossRef] [Green Version]
  47. Zhou, B.; Lin, X.; Wang, W.; Halpin, R.A.; Bera, J.; Stockwell, T.B.; Barr, I.G.; Wentworth, D.E. Universal Influenza B Virus Genomic Amplification Facilitates Sequencing, Diagnostics, and Reverse Genetics. J. Clin. Microbiol. 2014, 52, 1330–1337. [Google Scholar] [CrossRef] [PubMed] [Green Version]
  48. Kechin, A.; Boyarskikh, U.; Kel, A.; Filipenko, M. cutPrimers: A New Tool for Accurate Cutting of Primers from Reads of Targeted Next Generation Sequencing. J. Comput. Biol. 2017, 24, 1138–1143. [Google Scholar] [CrossRef] [PubMed]
  49. Langmead, B.; Salzberg, S. Fast gapped-read alignment with Bowtie 2. Nat. Methods 2012, 9, 357–359. [Google Scholar] [CrossRef] [PubMed] [Green Version]
  50. Hall, T.A. BioEdit: A User-Friendly Biological Sequence Alignment Editor and Analysis Program for Windows 95/98/NT. Nucleic Acids Symp. Ser. 1999, 41, 95–98. [Google Scholar]
  51. World Health Organization Regional Office for Europe. WHO Releases Recommendations for the 2019–2020 Northern Hemisphere Seasonal Influenza Vaccine. 2019. Available online: https://www.euro.who.int/en/health-topics/communicable-diseases/influenza/news/news/2019/3/who-releases-recommendations-for-the-2019–2020-northern-hemisphere-seasonal-influenza-vaccine (accessed on 16 July 2021).
  52. Centers for Disease Control and Prevention. Estimated Influenza Illnesses, Medical Visits, Hospitalizations, and Deaths in the United States—2019–2020 Influenza Season. 2021. Available online: https://www.cdc.gov/flu/about/burden/2019-2020.html (accessed on 20 June 2021).
  53. Tenforde, M.W.; Kondor, R.J.G.; Chung, J.R.; Zimmerman, R.K.; Nowalk, M.P.; Jackson, M.L.; Jackson, L.A.; Monto, A.S.; Martin, E.T.; Belongia, E.A.; et al. Effect of Antigenic Drift on Influenza Vaccine Effectiveness in the United States—2019–2020. Clin. Infect. Dis. 2020, ciaa1884. [Google Scholar] [CrossRef] [PubMed]
  54. Dawood, F.S.; Chung, J.R.; Kim, S.S.; Zimmerman, R.K.; Nowalk, M.P.; Jackson, M.L.; Jackson, L.A.; Monto, A.S.; Martin, E.T.; Belongia, E.A. Interim Estimates of 2019–2020 Seasonal Influenza Vaccine Effectiveness—United States, February 2020. Morb. Mortal Wkly. Rep. 2020, 69, 177–182. [Google Scholar] [CrossRef] [Green Version]
  55. Owusu, D.; Hand, J.; Tenforde, M.W.; Feldstein, L.R.; DaSilva, J.; Barnes, J.; Lee, G.; Tran, J.; Sokol, T.; Fry, A.M.; et al. Early Season Pediatric Influenza B/Victoria Virus Infections Associated with a Recently Emerged Virus Subclade—Louisiana, 2019. Morb. Mortal Wkly. Rep. 2020, 69, 40–43. [Google Scholar] [CrossRef]
  56. Xie, H.; Xiang, R.; Wan, H.J.; Plant, E.P.; Radvak, P.; Kosikova, M.; Li, X.; Zoueva, O.; Ye, Z.; Wan, X.F. Reduced Influenza B–Specific Postvaccination Antibody Cross-reactivity in the B/Victoria Lineage–Predominant 2019/20 Season. Clin. Infect. Dis. 2021, 72, e776–e783. [Google Scholar] [CrossRef]
  57. Hu, W.; Gruner, W.E.; DeMarcus, L.S.; Thervil, J.W.; Kwaah, B.; Fries, A.C.; Sjoberg, A.P.; Robbins, A.S. Influenza Surveillance Trends and Influenza Vaccine Effectiveness Among Department of Defense Beneficiaries During the 2019–2020 Influenza Season. MSMR 2021, 28, 2–8. [Google Scholar] [PubMed]
  58. McAuley, J.; Zhang, K.; McCullers, J.A. The Effects of Influenza A Virus PB1-F2 Protein on Polymerase Activity Are Strain Specific and Do Not Impact Pathogenesis. J. Virol. 2010, 84, 558–564. [Google Scholar] [CrossRef] [PubMed] [Green Version]
  59. Kuo, S.-M.; Chen, G.-W.; Velu, A.B.; Dash, S.; Han, Y.-J.; Tsao, K.-C.; Shih, S.-R. Circulating pattern and genomic characteristics of influenza B viruses in Taiwan from 2003 to 2014. J. Formos. Med. Assoc. 2016, 115, 510–522. [Google Scholar] [CrossRef] [PubMed] [Green Version]
  60. Le Sage, V.; Kormuth, K.A.; Nturibi, E.; Lee, J.M.; Frizzell, S.A.; Myerburg, M.M.; Bloom, J.D.; Lakdawala, S.S. Cell-Culture Adaptation of H3N2 Influenza Virus Impacts Acid Stability and Reduces Airborne Transmission in Ferret Model. Viruses 2021, 13, 719. [Google Scholar] [CrossRef] [PubMed]
  61. Wang, Q.; Cheng, F.; Lu, M.; Tian, X.; Ma, J. Crystal Structure of Unliganded Influenza B Virus Hemagglutinin. J. Virol. 2008, 82, 3011–3020. [Google Scholar] [CrossRef] [Green Version]
  62. Gatherer, D. Passage in egg culture is a major cause of apparent positive selection in influenza B hemagglutinin. J. Med. Virol. 2009, 82, 123–127. [Google Scholar] [CrossRef]
  63. Zost, S.; Parkhouse, K.; Gumina, M.; Kim, K.; Perez, S.D.; Wilson, P.C.; Treanor, J.J.; Sant, A.J.; Cobey, S.; Hensley, S.E. Contemporary H3N2 influenza viruses have a glycosylation site that alters binding of antibodies elicited by egg-adapted vaccine strains. Proc. Natl. Acad. Sci. USA 2017, 114, 12578–12583. [Google Scholar] [CrossRef] [Green Version]
  64. Park, Y.W.; Kim, Y.H.; Jung, H.U.; Jeong, O.S.; Hong, E.J.; Kim, H.; Lee, J.I. Comparison of antigenic mutation during egg and cell passage cultivation of H3N2 influenza virus. Clin. Exp. Vaccine Res. 2020, 9, 56–63. [Google Scholar] [CrossRef] [PubMed]
Figure 1. Cell-adapted mutations in the RNA polymerase complex of influenza B virus isolates (2019–2020). Mutations at the RNA polymerase complex (PB1, PB2, PA) are visualized in PyMOL using the 6QCT protein structure from the Protein Data Bank (PDB, https://www.rcsb.org/, accessed on 27 June 2021). Green represents PA, blue represents PB1, purple represents PB2.
Viruses 13 01896 g001
Figure 2. Cell- and egg-adapted mutations at the 212 and 214 positions within the receptor binding domain and antibody binding site on the HA protein visualized in PyMOL using the 4FQM protein structure from the Protein Data Bank (PDB, https://www.rcsb.org/, accessed on 27 June 2021).
Viruses 13 01896 g002
Figure 3. Phylogenetic tree of the HA segment of IBV. Missouri samples from the 2019–2020 season that were collected for this study are labeled in red. Recommended vaccine strains are labeled in blue. The phylogenetic analyses were performed by using BEAST2 with a Hasegawa–Kishino–Yano (HKY) substitution empirical model, strict clock model, and coalescent constant population prior. Branches with a posterior probability 0.70 were labeled. The nomenclature of the genetic clades is adapted from that reported by the World Health Organization [51].
Viruses 13 01896 g003
Figure 4. Antigenic cartography of hemagglutination inhibition results of influenza B virus isolates (2019–2020). Each grid represents one unit, a 2-fold change in hemagglutination inhibition titers. The vaccine component strains are labeled in cyan. Strains from the 2019–2020 season in Missouri are shown in red. Additional reference strains are blue. Antigenic cartography was constructed using AntigenMap (https://sysbio.missouri.edu/software/AntigenMap/, accessed on 19 July 2021) [42,43,44].
Viruses 13 01896 g004
Table 1. Isolation of clinical samples positive to influenza B virus in different MDCK cells.
TypeSamplesCCL34 P1CCL34 P2SIAT1 P1hCK P1
IAV (H1)10839 (42.12%)76 (70.37%)77 (71.30%)95 (87.96%)
IBV3822 (57.89%)24 (63.16%)22 (57.89%)31 (81.58%)
Total14661 (41.78%)100 (68.49%)99 (67.80%)127 (86.98%)
Table 2. Cell-adapted mutations in influenza B virus isolates (2019–2020).
SampleProteinPositionClinical Swab (Nucleotide)Isolate (Nucleotide)Amino Acid e
Swab
(Proportion Reads) a
Reads (Total) bReads
(Position) c
% Reads at
Position d
Isolate
(Proportion Reads) a
Reads
(Total) b
Reads
(Position) c
% Reads at
Position d
PositionSwabIsolate
CS20N017PB2136A (0.99)/T (0.01)1,574,718262241.67T (0.99)1,149,21617,5381.5346TS
PB22181T (0.98)/C (0.02)1,574,71870750.45C (0.99)/T (0.01)1,149,21654,7884.77727NN
PB12160G (1.00)1,574,718479193.04A (1.00)1,149,21643,5243.79720RR
CS20N025HA1741C (0.79)/T (0.16)/N (0.05)1,588,004450.00T (1.00)182,97214,1127.71581RC
CS20N036PB12016T (0.97)/A (0.03)1,940,088390.00C (0.50)/T (0.46)/A (0.04)1,468,02442,1522.87672SS
PB12020T (1.00)1,940,088410.00A (0.53)1,468,02443,9683.00674LQ
CS20N091NP419A (0.96)/N (0.03)/T(0.01)2,161,17016150.07C (0.76)/A (0.24)177,41242832.41140EA
CS20N137PB2293T (0.96)/N (0.03/A(0.01)2,078,3623360.02G (0.57)/T (0.43)216,9965140.2498VG
CS20N140PB22097T(0.55)/C(0.44)1,939,62059920.31C (0.98)/T (0.02)1,057,87476,9287.27699LL
CS20N212PB11048A (0.96)/N (0.03)/C (0.01)1,927,9902300.01G (0.62)/A (0.38)142,7241480.10350RG
PB11502T (0.94)/G (0.02)/N (0.02)/A(0.01)/C (0.01)1,927,9902380.01C (0.69)/T (0.31)142,7245800.41501VA
CS20N214PB1255A (0.77)/G (0.13)/N (0.08)/C (0.01)/T (0.01)1,779,33818110.10G (0.56)/A (0.43)/T (0.01)180,97459,50332.8885LL
CS20N294PB1335A (0.99)/C (0.01)1,495,9646500.04G (0.56)/A (0.43)1,599,89012,6620.79112EG
a Swab (Proportion Reads) and Isolate (Proportion Reads) refer to the frequency of each nucleotide (A, T, G, or C) compared with the total number of reads (all A, T, G, and C) generated at a specific genomic position. b Reads (total) refers to the total number of reads generated during whole genome sequencing for each sequence analyzed. c Reads at Position refers to the number of reads generated by whole genome sequencing at each position of the genome. d % Reads at Position was calculated by [Reads at Position/Reads (total) × 100]. e Nonsynonymous mutations are highlighted in bold in the amino acid columns.
Table 3. Cell- and egg-adapted amino acid mutations of Victoria lineage IBVs from the paired clinical isolate samples available at the GISAID.
ProteinStrainPositionOriginalCellEgg
HAB/North Carolina/17/2019/EPI1693897143EK
B/Florida/78/2015/EPI721064156GGR
B/Mozambique/413/2016/EPI854592179DY
B/Pennsylvania/19/2016/EPI807677212NNK
B/Michigan/18/2016/EPI807685212NNT
B/Indiana/08/2016/EPI807669212NND
B/Florida/94/2016/EPI872715212NNS
B/Hawaii/26/2018/EPI1315023212N D
B/Florida/79/2015/EPI745107212N Y
B/Utah/18/2018/EPI1249578212NT
B/Montana/34/2018/EPI1386557212N D
B/Iowa/14/2017/EPI1025486212TTN
B/Guatemala/35/2018/EPI1249639212NS
B/Guatemala/109/2018/EPI1312932212NS
B/Florida/97/2017/EPI1138021212N K
B/Alabama/02/2017/EPI980739212NNS
B/Lebanon/16/2020/EPI1840705212NNS
B/Pennsylvania/60/2016/EPI892343214T I
B/Hawaii/55/2017/EPI1089741214T N
B/Costa Rica/5521/2016/EPI908149214TA
B/El Salvador/697/2018/EPI1357148214T A
B/Louisiana/16/2019/EPI1574236214TTN
B/Hong Kong/269/2017/EPI1141721214TTI
B/Minnesota/39/2017/EPI1026300236IT
B/Ulaabaatar/1868/2017/EPI1089764433ND
B/Ulaabaatar/1834/2017/EPI1053102433DN
B/Ulaabaatar/1767/2017/EPI1053094433ND
B/Wisconsin/22/2018/EPI1312153528DG
NAB/North Carolina/17/2019/EPI169389619LI
B/North Carolina/16/2019/EPI166442519IL
B/Wisconsin/45/2016/EPI834520154LK
B/North Carolina/17/2019/EPI1693896284SG
B/North Carolina/16/2019/EPI1664425284GS
B/Ulaabaatar/1868/2017/EPI1089763310TS
B/Nevada/23/2019/EPI1688225321DN
B/Colombia/9962/2016/EPI908031391DE
B/Bangladesh/8018/2016/EPI880659395AD
B/North Carolina/17/2019/EPI1693896400VI
B/Arizona/83/2017/EPI1147826401MV
B/California/18/2017/EPI1009716435GR
B/Guyane/310/2020/EPI1807176450MMV
NBB/North Carolina/17/2019/EPI169389621IN
B/North Carolina/16/2019/EPI166442521NI
NEPB/Oregon/11/2020/EPI184066630SSL
B/Iowa/14/2017/EPI101159679DDN
NPB/Bangladesh/5006/2017/EPI109438433RK
B/Ulaabaatar/1868/2017/EPI1089757239AT
NS1B/North Carolina/17/2019/EPI169389162TA
B/North Carolina/16/2019/EPI166442062AT
B/Ulaabaatar/1868/2017/EPI1089758115TM
B/Ulaabaatar/1834/2017/EPI1053096115MT
B/Ulaabaatar/1767/2017/EPI1089797115TM
PAB/Bangladesh/8018/2016/EPI88065657EK
B/New Jersey/09/2017/EPI1011540393IIT
PB1B/North Carolina/17/2019/EPI1693895378LS
B/North Carolina/16/2019/EPI1664424378SL
PB2B/Florida/97/2017/EPI1138018263V I
B/Macedonia/421/2020/EPI1806732379SSC
B/Bangladesh/5006/2017/EPI1094388391AT
Blank cells under cell and egg mutation columns indicate that no sequence was available for analysis.
Table 4. Hemagglutination inhibition results of influenza B virus isolates (2019–2020) using ferret antisera.
Virus aClade bFerret Reference Sera c
B/Nevada/
03/2011
B/Texas/
02/2013
B/Brisbane/
60/2008
B/Colorado/
6/2017
B/Washington/
02/2019 (Egg)
B/Washington/
02/2019 (Cell)
B/Wisconsin/1/2010
B/Nevada/03/2011V1A1280320640201608010
B/New Jersey/01/2012V1A1280640320404040<10
B/Texas/02/2013V1A320320160404040<10
B/Florida/78/2015V1A1280128064080808020
B/Brisbane/60/2018V1A6403201280401604010
B/Colorado/06/2017V1A-2DEL4020032040160<10
B/Hong Kong/286/2017V1A.3-3DEL3201601608032016010
B/Washington/02/2019 (egg)V1A.3-3DEL320808080640640<10
B/Washington/02/2019 (cell)V1A.3-3DEL80401080320640<10
B/Rhode Island/01/2019V1A.3-3DEL3201603204032032010
B/Phuket/3073/2013Y310<10<10<10<10<101280
CS20N004V1A.3-3DEL804010160320640<10
CS20N005804010160320640<10
CS20N0068080201606401280<10
CS20N017804010160320640<10
CS20N0208040101606401280<10
CS20N025804020160640128010
CS20N028804010160320640<10
CS20N0298040201606401280<10
CS20N031804010160320640<10
CS20N036804020160640128010
CS20N0538040101606401280<10
CS20N0568040201606401280<10
CS20N05740201080320640<10
CS20N0624040101606401280<10
CS20N068402010806401280<10
CS20N091804010160320640<10
CS20N09840201080320640<10
CS20N113402010160320640<10
CS20N12640201080320640<10
CS20N137802010160320640<10
CS20N140802010160320640<10
CS20N1688040201606401280<10
CS20N174804010160320640<10
CS20N21080402016032064010
CS20N2128040201606401280<10
CS20N213804020160320640<10
CS20N214804020160320640<10
CS20N228804020160640128010
CS20N27480401016032064010
CS20N29480401080320640<10
CS20N34940201080320640<10
CS20N3518040101606401280<10
a The viruses underlined are the vaccine strains used in the 2019–2020 influenza season. Passage 2 viruses for all Missouri isolates were used in the serological assays. b The 3DEL noted in clades occurs at positions 162–164 on the HA protein. c The homologous hemagglutination inhibition titers were marked in bold.
Publisher’s Note: MDPI stays neutral with regard to jurisdictional claims in published maps and institutional affiliations.

