
Variation in Carbon Content among the Major Tree Species in Hemiboreal Forests in Latvia


Latvian State Forest Research Institute ‘Silava’, Rigas Str. 111, LV-2169 Salaspils, Latvia
*
Author to whom correspondence should be addressed.
Forests 2021, 12(9), 1292; https://doi.org/10.3390/f12091292
Submission received: 25 August 2021
/
Revised: 9 September 2021
/
Accepted: 17 September 2021
/
Published: 21 September 2021
(This article belongs to the Special Issue Carbon-Water Relationships of the Forest Ecosystem under a Changing Climate)
Abstract
:This study was designed to estimate the variation in non-volatile carbon (C) content in different above- and belowground tree parts (stem, living branches, dead branches, stumps, coarse roots and small roots) and to develop country-specific weighted mean C content values for the major tree species in hemiboreal forests in Latvia: Norway spruce (Picea abies (L.) H. Karst.), Scots pine (Pinus sylvestris L.), birch spp. (Betula spp.) and European aspen (Populus tremula L.). In total, 372 sample trees from 124 forest stands were selected and destructively sampled. As the tree samples were pre-treated by oven-drying before elemental analysis, the results of this study represent the non-volatile C fraction. Our findings indicate a significant variation in C content among the tree parts and studied species with a range of 504.6 ± 3.4 g·kg−1 (European aspen, coarse roots) to 550.6 ± 2.4 g·kg−1 (Scots pine, dead branches). The weighted mean C content values for whole trees ranged from 509.0 ± 1.6 g·kg−1 for European aspen to 533.2 ± 1.6 g·kg−1 for Scots pine. Only in Norway spruce was the whole tree C content significantly influenced by tree age and size. Our analysis revealed that the use of the Intergovernmental Panel on Climate Change (IPCC) default C content values recommended for temperate and boreal ecological zones leads to a 5.1% underestimation of C stock in living tree biomass in Latvia’s forests. Thus, the country-specific weighted mean C content values for major tree species we provide may improve the accuracy of National Greenhouse Gas Inventory estimates.
Keywords:
living biomass; greenhouse gas inventory; Norway spruce; Scots pine; birch; European aspen1. Introduction
Forest ecosystems continuously exchange carbon dioxide (CO2) with the atmosphere and are significant components of the global carbon (C) cycle [1,2,3]. In forests, living tree biomass is a key CO2 sink due to the photosynthetic assimilation of CO2 from the atmosphere [4,5]. During photosynthesis, atmospheric CO2 is converted into carbohydrates and further integrated into the organic compounds that make up a plant’s structure [4,5,6]. The durability and inertness of tree tissue maintain C in organic form over a relatively long period before it is returned to the atmosphere through respiration (oxidation of carbohydrates), decomposition or disturbance [4,5,7]. Worldwide since 2020, many countries have begun to count CO2 sequestration and storage in living tree biomass in their national climate-change mitigation efforts as part of international climate policy agreements [2,8]. Thus, precise knowledge of the variation in C content of living tree biomass by species and biome is required to accurately quantify forest C stocks, validate forest C accounting models and support forest management strategies intended to maximize CO2 sequestration [9,10,11].
In tree tissues, C is bound in organic compounds, mainly cellulose, hemicelluloses, lignin, extractable components and low molecular weight volatile compounds such as alcohols, phenols, terpenoids and aldehyde [9,10,12]. As the C content of these compounds varies considerably, the variation in total C content in tree tissues is largely determined by the proportions of these organic compounds. The proportions of organic compounds also vary widely among tree species and are affected by a particular tree’s genetics and age, the location in the tree (including tissue type and proportion of heartwood to sapwood and earlywood or latewood), environmental and growth conditions such as climate, soil characteristics, sunlight and concentration of tropospheric ozone (O3) and other factors [5,9,10,12,13,14,15,16,17]. The lignin content and ratio of lignin to cellulose are commonly considered the most important predictors of C content in tree tissues because lignin contains proportionally higher C content (up to 72% C) compared with other organic compounds [9,13,18].
An increasing number of studies conclude that the widely used assumption of 50% C content for all tree species and tissues as well as the simplified conversion factors recommended by the Intergovernmental Panel on Climate Change (IPCC) [19] may significantly over- or underestimate forest C stock in living biomass [5,9,10,13,15,18,20,21,22]. Thus, recommendations to use region-, species- and tissue-specific C fraction values aimed to reduce the uncertainty of forest C stock estimates are becoming increasingly important for calculations for National Greenhouse Gas (GHG) Inventories [9,10,11,20,23]. The importance of developing higher tier methods for calculating C turnover in the land use, land-use change and forestry (LULUCF) sector is determined by the targets set to transform the European Union (EU) economy and society to meet climate goals. According to the Revision of the Regulation on the inclusion of GHG emissions and removals in the LULUCF sector, Latvia must decrease GHG emissions in the LULUCF sector by more than 25 million tons of CO2-eq (double the annual GHG emissions excluding LULUCF in Latvia in 2019) by 2030 and ensure continuous reduction of GHG emissions to compensate for emissions in the agricultural and other sectors before 2050. Meanwhile, the ageing of forests and disturbances caused by climate change is increasing pressure on forest ecosystems and tend to turn forests into a net source of GHG emissions. These processes require urgent action to ensure the resilient increase of forest C pools and to avoid increased GHG emissions from soils. Accurate and verified tools for modelling C turnover in forests are key to implementing the climate policy, particularly in the selection and projection of the effect of measures intended to reduce GHG emissions and increase CO2 sequestration. Latvia’s GHG inventory uses static (tree species and dimensions determined) biomass expansion factors and default IPCC values to estimate C content in biomass, which leads to potential over- or underestimation of C stock changes in living biomass and other C pools.
The main aims of this study were: (1) to evaluate variation in non-volatile C content across different above- and belowground parts of major tree species in Latvia (Norway spruce, Scots pine, birch and European aspen); (2) to develop country-specific weighted mean C content values for major tree species and species-dominated forest stands.
2. Materials and Methods
2.1. Study Area
Our study was conducted in the hemiboreal forests in Latvia. The hemiboreal zone is a transitional zone between the boreal and temperate forest of the nemoral zone in Europe characterised by the coexistence of boreal coniferous species on poor soils and temperate broadleaved tree species on fertile soils [24]. In total, 124 forest stands dominated by 4 different tree species (Norway spruce (Picea abies (L.) H.Karst.), Scots pine (Pinus sylvestris L.), birch spp. (mainly silver birch (Betula pendula Roth)) and European aspen (Populus tremula L.)) were selected. The selected forest stands represent different regions and tree populations in Latvia. In this study, we analysed material chosen to study the national biomass equations in Latvia [25]. In each of the selected forest stands, 3 sample trees representing the range of the dimensions of the dominant tree species in the stand were selected. Thus, the study material comprised a total of 372 sample trees (Table 1). Damaged and rotten trees were not accepted as sample trees. The collection of study material was performed from 2012 to 2014 during the dormant period when deciduous trees were leafless and young shoots had matured.
2.2. Sampling Design and Chemical Analysis
A detailed sampling design for biomass estimation is described in Liepiņš et al. (2018) [25]. The biomass was estimated by individual tree part: stem, living branches (including needles for coniferous tree species), dead branches, stump and roots. Foliage as a separate tree part was not included in the analysis. Not all the biomass fractions were measured for all the sampled trees. In addition, there was a technical problem during sample pre-treatment, during which several samples were damaged and excluded from further analysis. The entire root system of the sampled trees was excavated manually for 145 trees. The total fresh weight of the stem and branches was measured in the field using field scales. The total weight of the stump and roots was determined in the spring or summer following tree felling.
After tree felling, the crown was divided into 3 sections of equal length, and one average-sized live branch was selected subjectively from the middle of each section. The 3 sample branches were weighed together in the field and sampled to determine the average moisture of the living crown. In addition, one average-sized dead sample branch per tree was collected from the lower part of the crown. After measuring the branches that were selected for subsequent dry weight determination, all remaining branches were cut off and weighed. The dry matter of the crown was calculated using the fresh to oven-dried weight ratio.
The stems were cross-cut into 1 or 2 m sections starting from the base of the stem and depending on the stem length (1 m sections for stems shorter than 20 m, 2 m sections for stems longer than 20 m). To calculate the dry stem biomass, sample discs were collected at the beginning of each stem section. Sample discs were also collected at the height of 1.3 m and the midpoint of the first section. The section biomass was calculated by multiplying the section mass by the section fresh to dry weight ratio calculated from the sample discs located at the ends of the stem sections; for the top section, however, only the base sample disc was used. The biomass of individual stem sections was summed to obtain the total stem biomass.
The entire root system of the sampled trees was excavated manually with hand tools to minimise the loss of the smallest roots. After root excavation and transportation to the processing location, the belowground parts were washed with a high-pressure water pump to remove all soil particles. To calculate the dry root biomass, each root system was divided into 3 sections:
- Stump—monolith (both above- and belowground portions), nondifferentiated parts of some roots;
- Coarse roots—diameter greater than or equal to 2 cm;
- Small roots—diameter less than 2 cm.
To calculate the dry weight of each belowground fraction, 1 sample disc was collected from the middle of the stump, 3 different diameter root discs were collected from the coarse roots, and 3 full-length roots less than 2 cm in diameter were collected to represent the small root biomass. The total belowground dry biomass was represented by the sum of the root fractions based on the individual fresh to oven-dry weight ratios of each part.
The dry weight of all samples was measured in the laboratory after drying at a temperature of 105 °C until a constant weight was reached.
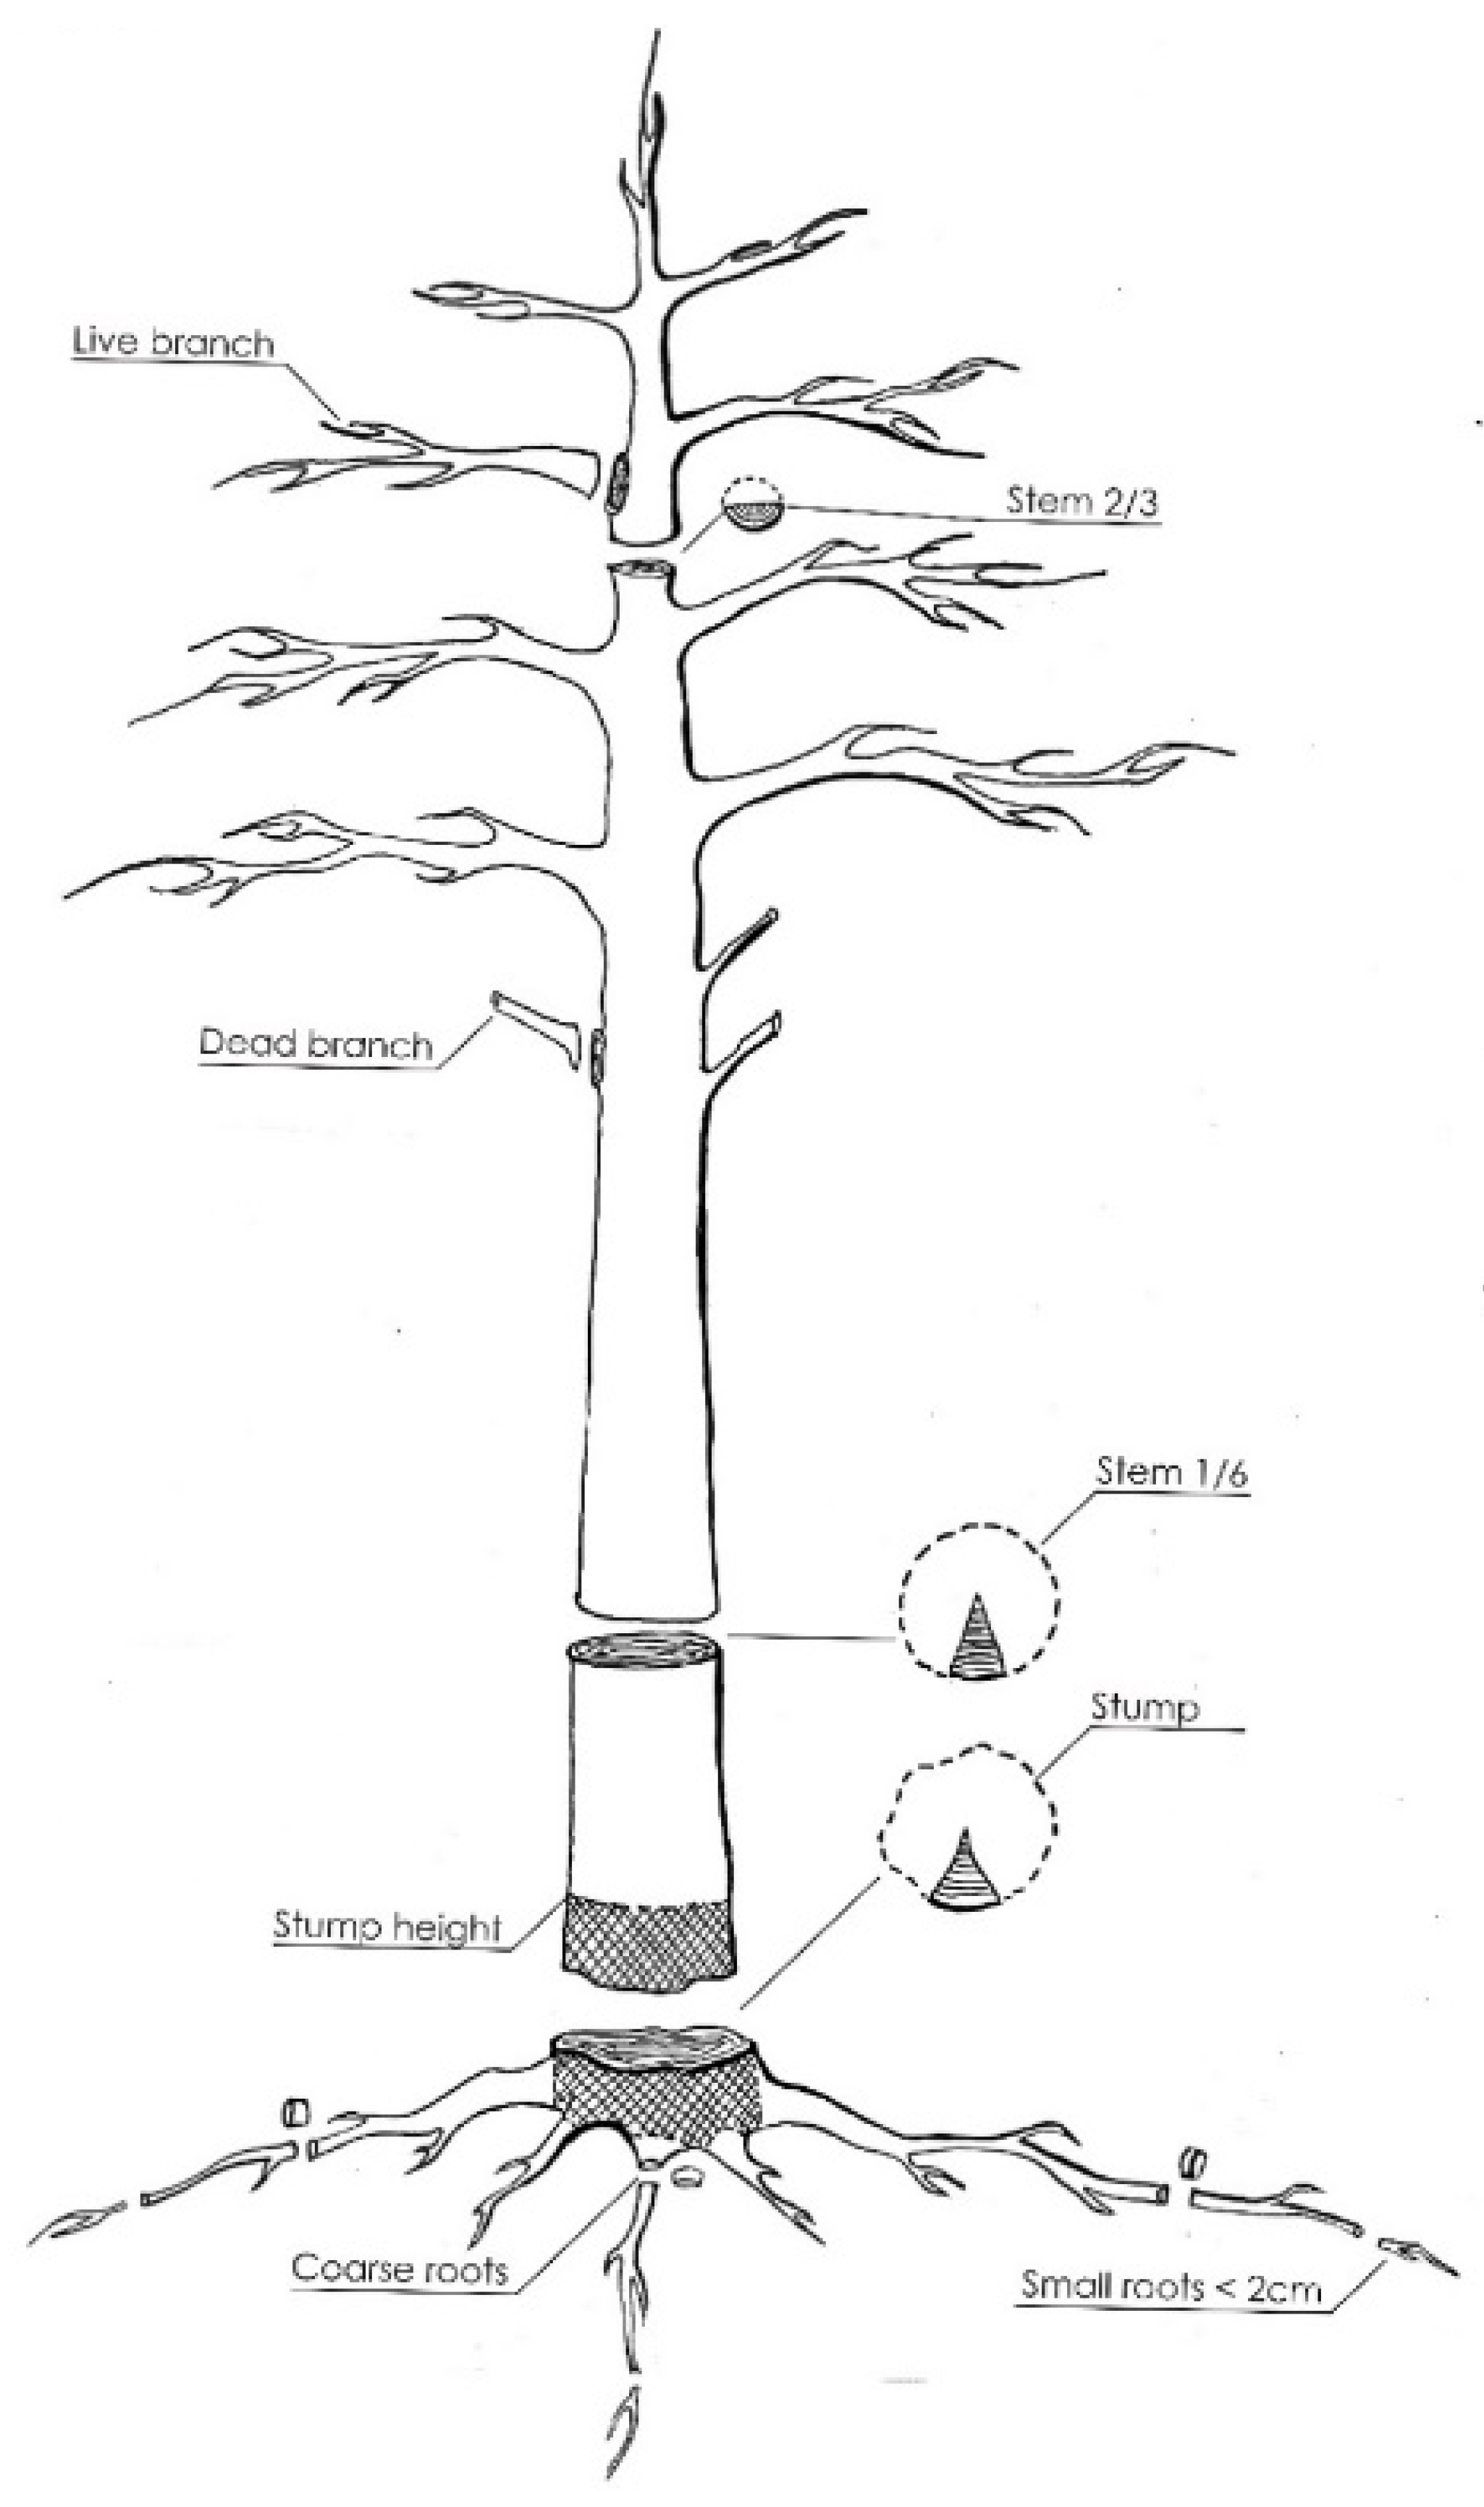
For C content analysis, 1 medium-sized live branch (including needles for coniferous tree species), 1 dead branch and the belowground samples used for dry weight determination were used. In addition, 2 sample discs were collected from the stem at 1/6 and 2/3 of the total height (Figure 1). All samples used for dry weight and C content determination contained proportional shares of heartwood, sapwood and bark.
In the laboratory, each of the individual tree part samples (oven-dried at 105 °C until a constant mass was reached) was cut into small pieces and ground into a homogenous powder using Retsch SM 100 (Retsch GmbH, Hahn, Germany). Samples were analysed for non-volatile C content using the LECO CR-12 elemental analyser (LECO Corporation, St. Joseph, MI, USA) and recorded as C (g·kg−1).
2.3. Data Analysis
The C content data were grouped according to tree species and part. Normality of data distribution was tested with Quantile-Quantile plots (QQ Plots) and Shapiro–Wilk tests, which approved that not all tested groups follow the normal distribution. Thus, non-parametric Kruskal-Wallis tests were used to evaluate differences in average C content values (including weighted mean C content values) between different tree parts or species. Correlation (Pearson’s r) and regression analyses were used to quantify associations between the C content in different tree parts and several tree parameters (age, stem height, diameter at breast height). Both Kruskal-Wallis tests and Pearson’s r were conducted with a significance level of p < 0.05. All statistical analyses were carried out with R [26].
Using the biomass and C content values of each tree part, the weighted mean C content (WMCC) for a single tree was calculated as follows [21]:
where Bi is the dry biomass of tree parts (kg tree−1), Ci is the C content in tree parts (g·kg−1) and i is the tree part.
The total C stock in living trees, including both above- and belowground tree parts in Latvian forests, was calculated using the species-specific weighted mean C content values determined within the present study (Table 2) and the National Forest Inventory (NFI) data (3rd cycle, 2014–2018) on tree biomass in forest land in Latvia. Values for tree species not included in the present study were estimated by type; the average weighted mean C content value of Scots pine and Norway spruce was used for other conifers, and the average weighted mean C content value of birch and European aspen was used for other deciduous tree species.
3. Results
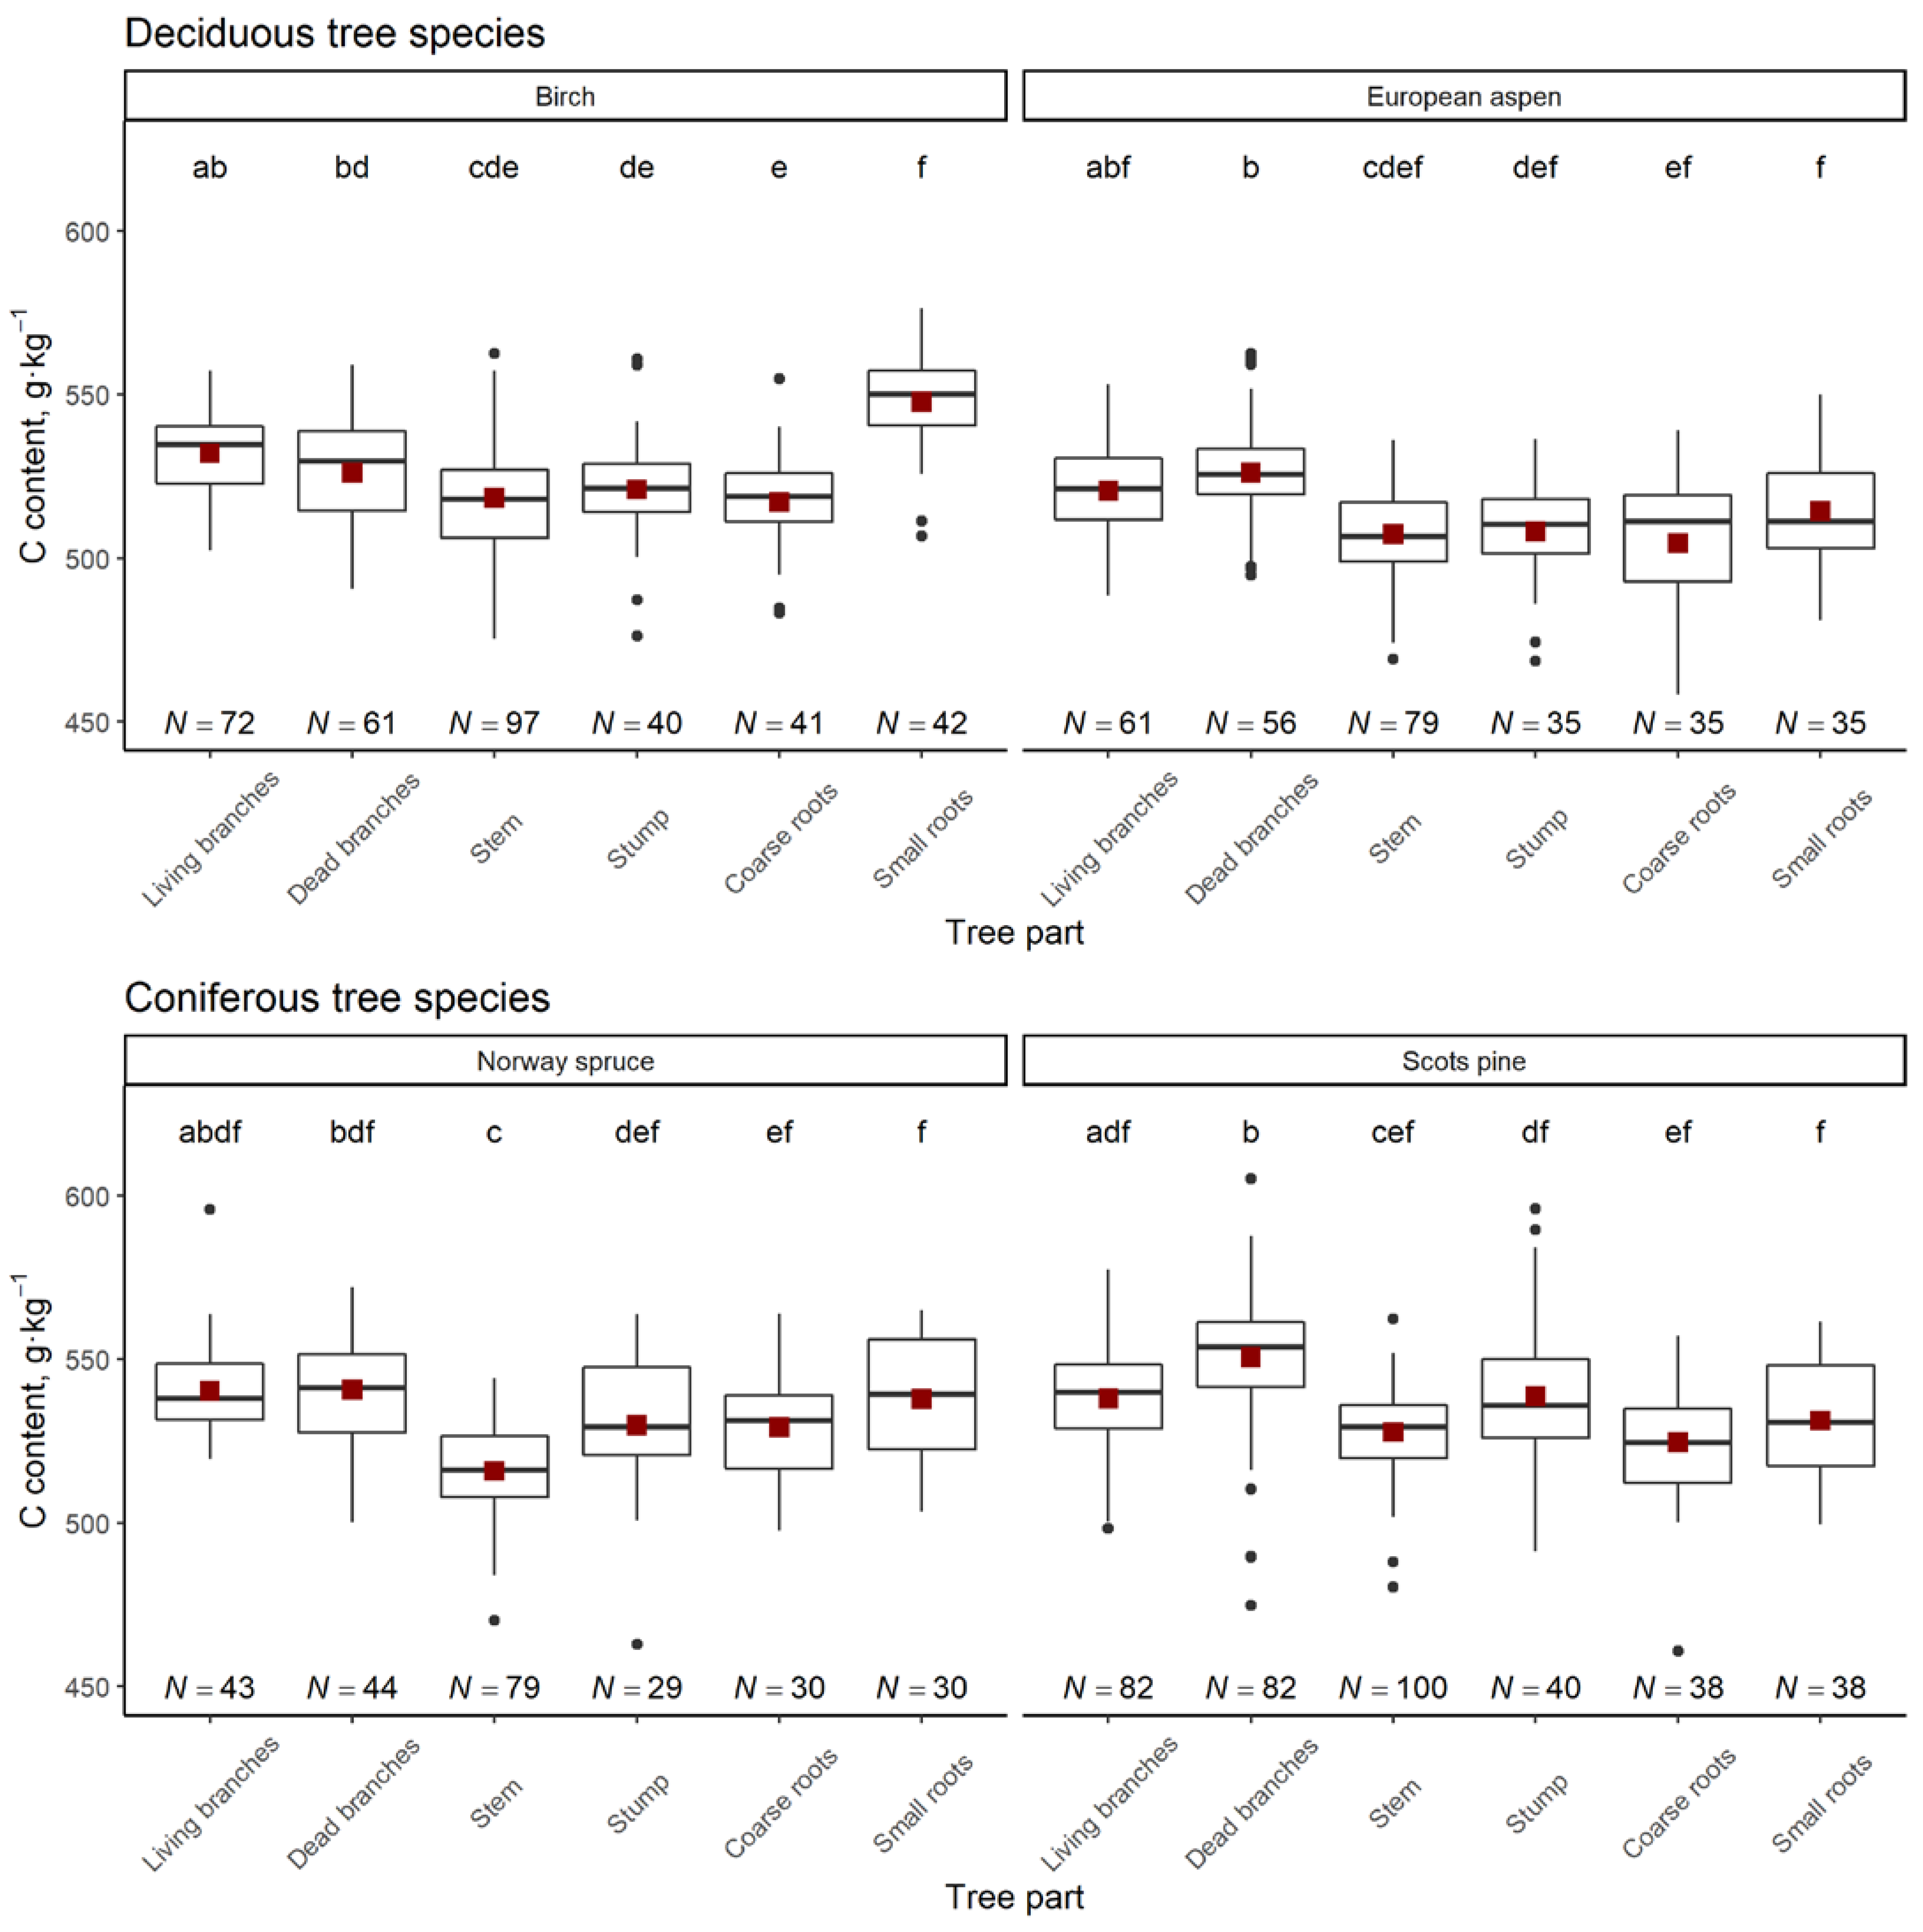
The C content in different tree parts varied significantly both within tree species (Figure 2) and across tree species (Figure 3). The mean C content in different tree parts of the studied tree species ranged from 504.6 ± 3.4 g·kg−1 (European aspen, coarse roots) to 550.6 ± 2.4 g·kg−1 (Scots pine, dead branches).
In aboveground tree parts, living and dead branches were found to have the highest mean C content for all tree species, while in belowground tree parts, small roots were found to have the highest mean C content for all tree species except for Scots pine (Figure 2). The smallest difference between the C content of dead branches and stem was 0.8% in birch, whereas the largest difference was 2.5% in Norway spruce. The mean difference between the C content of living branches and stem varied in a slightly narrower range from 1.1% (Scots pine) to 2.5% (Norway spruce). Stumps and small roots tended to have higher C content than the stem for all tree species, reaching a maximum difference of 2.2% between the mean C content values of small roots and the stem in Norway spruce.
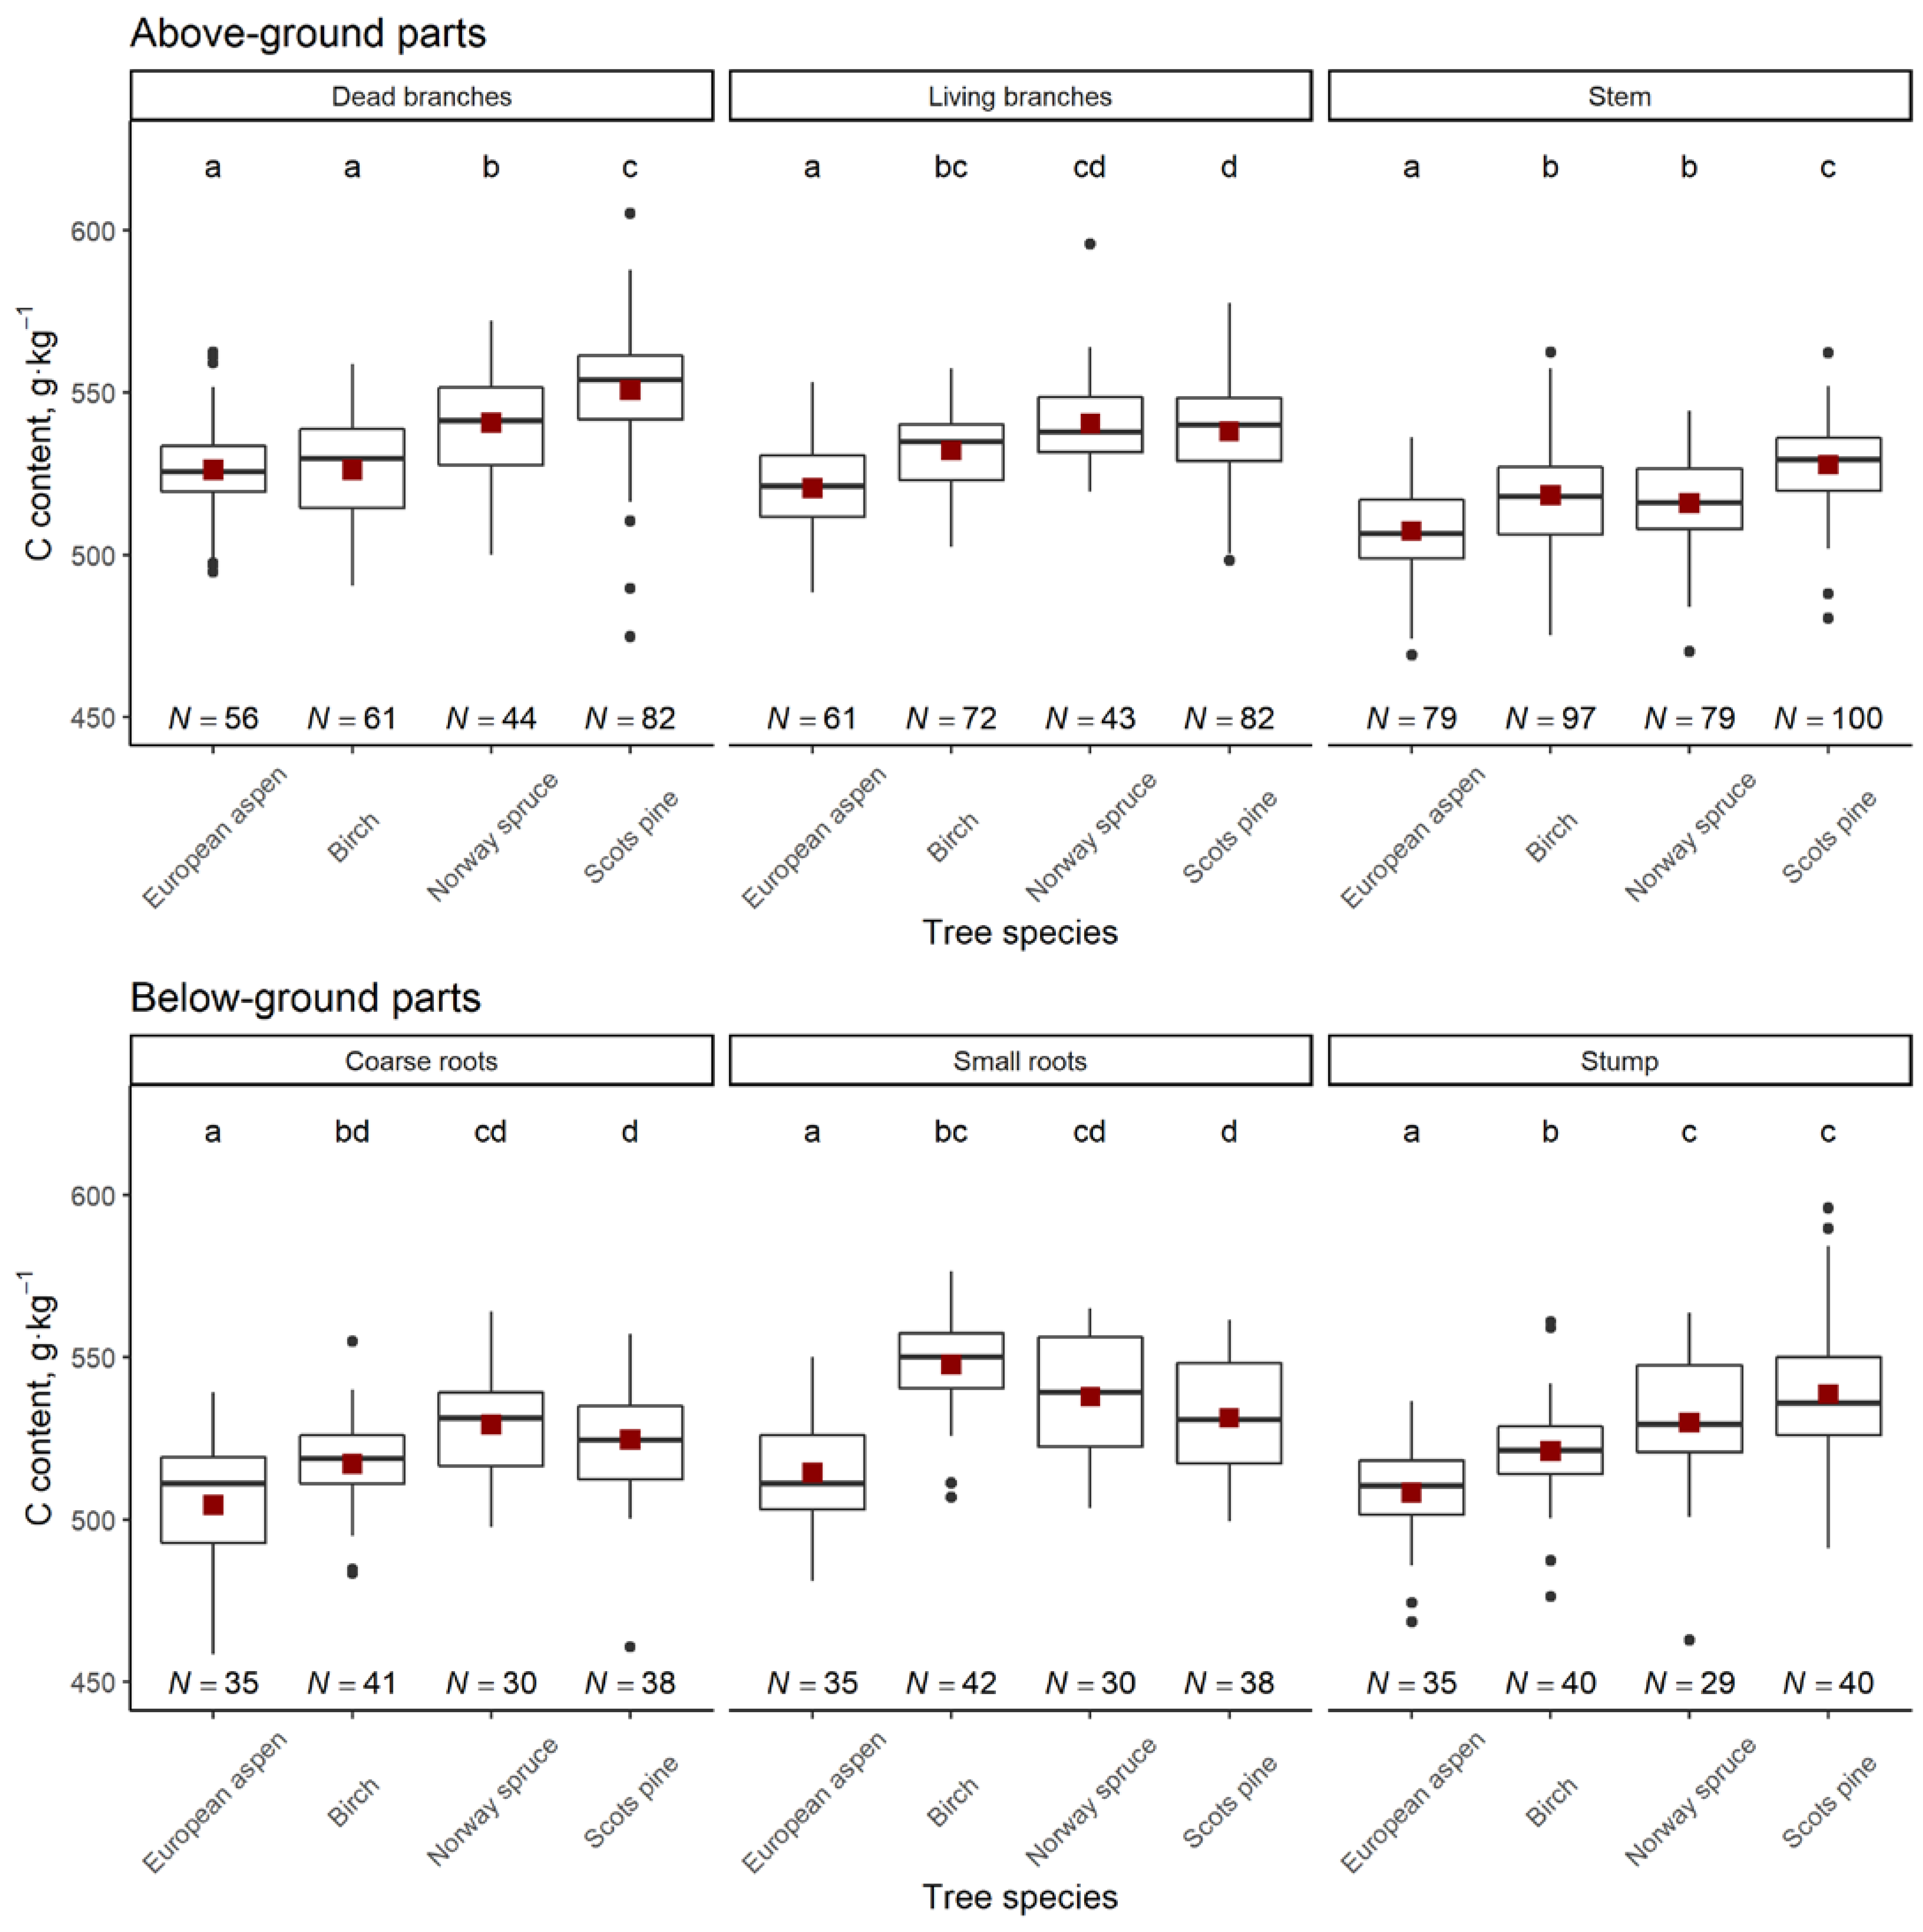
Among the studied tree species, the highest C content in dead branches, stem and stump was found for Scots pine; in living branches and coarse roots for Norway spruce and small roots for birch. European aspen showed the lowest mean C content in all tree parts (Figure 3).
Because the C content varied significantly between different tree parts (Figure 2), the weighted mean C content was calculated for each tree species (Table 2) based on biomass allocation in different tree parts. The largest weighted mean C content both in above- and belowground parts was found in Scots pine, while the lowest weighted mean C content was found in European aspen. More generally, conifers showed larger (p < 0.001) weighted mean C content compared with deciduous tree species: 527.7 ± 1.0 g·kg−1 (N = 183) in conifers to 516.0 ± 1.0 g·kg−1 (N = 189) in deciduous species for aboveground parts and 530.8 ± 1.8 g·kg−1 (N = 67) in conifers to 518.9 ± 1.8 g·kg−1 (N = 75) in deciduous specie for belowground parts.
Our estimated C content values were higher than the IPCC 2006 [19] or Martin et al. (2018) [18] values, and the greatest differences were observed when they were compared with Martin et al. (2018) [18] values for angiosperms in temperate biomes (Figure S1). The smallest difference (less than 2%) was observed for Norway spruce when compared with IPCC 2006 [19] values and for European aspen when compared with Martin et al. (2018) [18] values for boreal biomes (Figure S1).
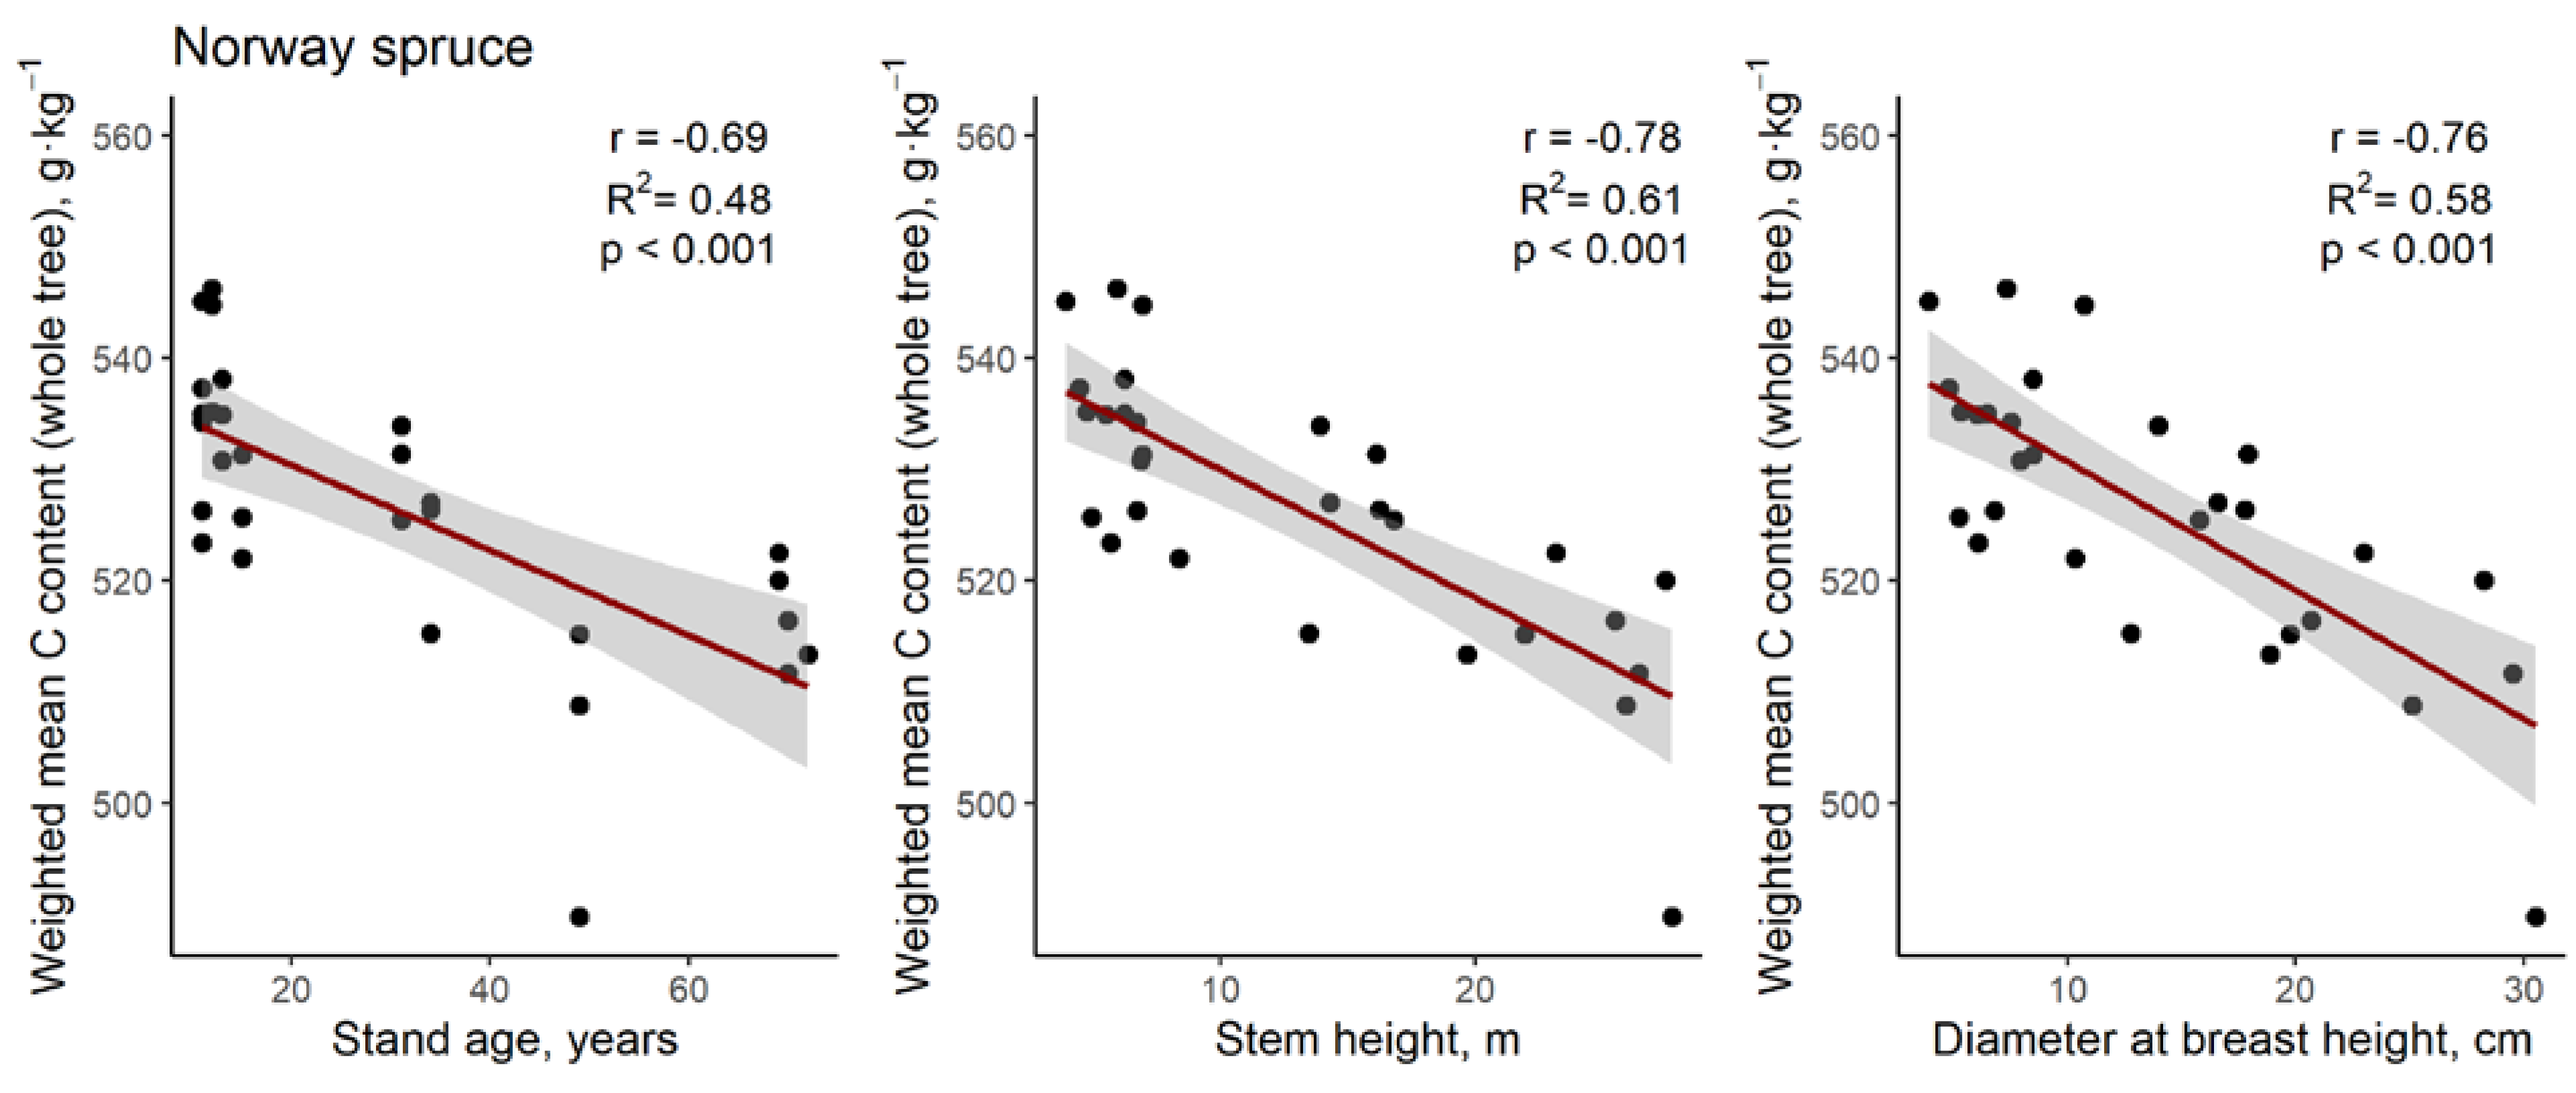
A significant correlation (r > 0.50, p < 0.05) was found only between the C content of the stem at 1/6 and 2/3 of tree height as well as between the C content in the stump and coarse roots. In addition, correlation and regression analysis was used to identify the most influential variables affecting both tree part-specific and weighted mean C content. For Norway spruce, we found a moderate negative correlation between the C content of belowground parts (stump and coarse roots) and tree age and stem height (r values from −0.53 to −0.57, p < 0.01), but moderate positive correlations were found between the C content of small roots and tree age, stem height and diameter at breast height (r values of 0.54, 0.57 and 0.59, respectively, p < 0.01). For European aspen, a moderate negative correlation was found between the C content of dead branches and stem height (r = −0.57, p < 0.001), but for birch, moderate negative correlations were found between the C content of living branches and tree age, stem height and diameter at breast height (r values of −0.58, −0.62, −0.62, respectively, p < 0.001). In analyses of weighted mean C content values for each tree species separately, only the Norway spruce weighted mean C content of the whole tree was significantly influenced by tree age and size (Figure 4).
Considering the proportional distribution of the living biomass of admixed tree species in stands dominated by different tree species, weighted mean C content values for forest stands were developed (Table 3). This confirmed that the effect of admixed tree species on average weighted means of C content was negligible—the difference in weighted mean C content values between dominant tree species and forest stands dominated by those species was 0.01% for birch, 0.2% for Norway spruce, 0.4% for Scots pine and 0.7% for European aspen, respectively.
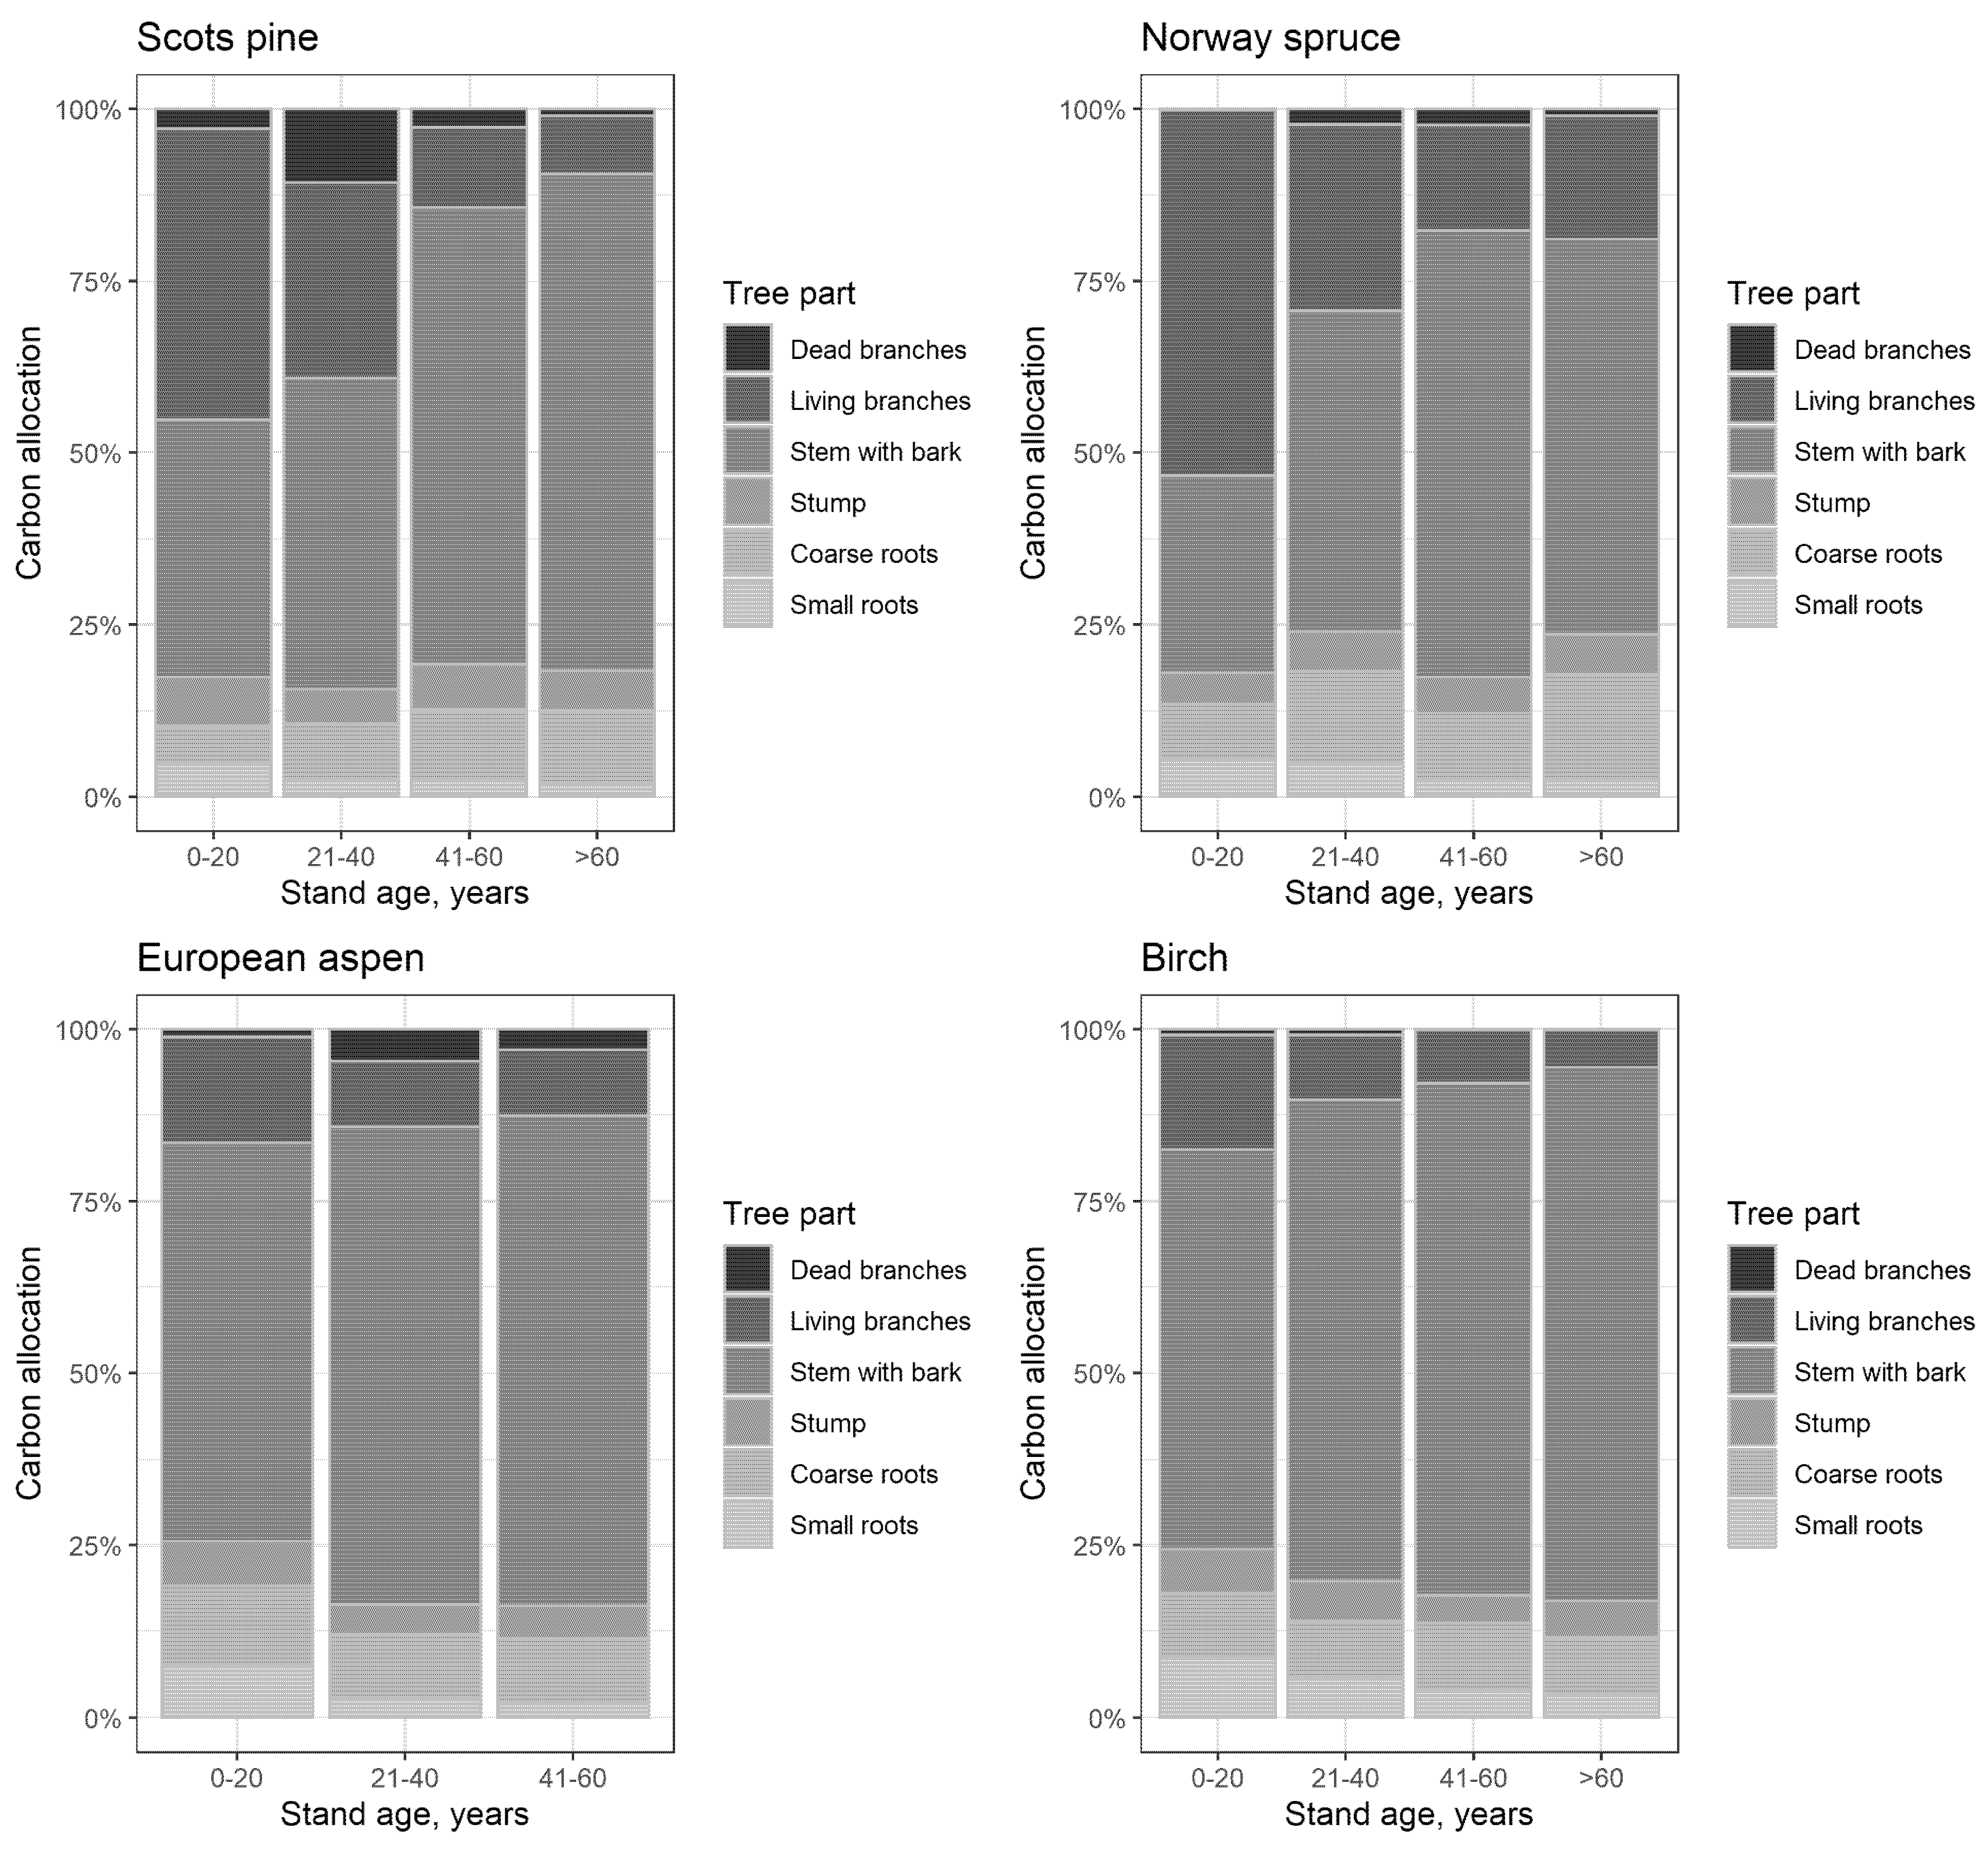
For all tree species other than coniferous tree species between 0 and 20 years old, most of the C in living trees was stored in stems followed by living branches. The percentage of C stock allocated to the stem trended higher with age for all tree species, reaching a maximum mean value of 77.5% of the total C stock in birches more than 60 years old. On the contrary, the C stock allocated to living branches trended lower with age for all tree species, with a maximum mean value of 53.2% found in Norway spruces 0 to 20 years old. The minimums mean value of 5.5% was found in birches more than 60 old. Similarly, the C stock allocated to small roots trended lower with age for all tree species; the highest mean value of 9.0% was found in birches 0 to 20 years old, and the lowest mean value of 1.9% was found in Scots pine more than 60 years old (Figure 5).
In forest land in Latvia covering 3472 thousand ha, including proportional shares of burned forest areas (0.06%), clear-cuts (1.39%), windrows (0.04%) and forested agricultural lands (10.39%), the estimated total C stock in living tree biomass was 251.6 Mt, including 198.5 Mt C in aboveground parts and 53.1 Mt C in belowground parts. The use of IPCC (2006) default C fraction values (48% for broad-leaved tree species and 51% for conifers [19]) may lead to an underestimation of the total C stock in living tree biomass in forest land in Latvia by 12.8 Mt C or 5.1%. The underestimation of C stock in living whole tree biomass using IPCC (2006) default C fraction values [19] may reach 18.8 t C ha−1 in forest stands dominated by Scots pine, 24.1 t C ha−1 in forest stands dominated by Norway spruce, 39.5 t C ha−1 in forest stands dominated by birch, and 27.1 t C ha−1 in forest stands dominated by European aspen.
4. Discussion
The total C content in tree tissues can be divided into fractions of non-volatile C and volatile C, in which the volatile C fraction consists of C compounds of low molecular weight [9,10]. As the tree samples were pre-treated by oven-drying before elemental analysis, the results of this study represent the non-volatile C fraction. We estimated that the weighted mean C content (whole tree) in the main tree species of hemiboreal forests in Latvia ranged from 50.9 ± 0.2% (European aspen) to 53.3 ± 0.2% (Scots pine), respectively. Although conifers showed statistically significantly higher weighted mean C content compared with deciduous tree species (53.0 ± 0.1% vs. 51.6 ± 0.1%), the variation in weighted mean C content within tree species exceeded the variation in weighted mean C content between species. Substantial variations in wood C content both among tree species as well as within individual trees were reported by both global level synthesis (e.g., [9,15,18]) and regional level studies (e.g., [5,21,27]). Our results were also consistent with previous findings that conifers have higher wood C content than deciduous tree species [5,9] and agree that the lignin content in the wood of conifer tree species is approximately 10% higher than that of deciduous tree species; lignin has the highest percentage of C compared with all other organic compounds in the wood [5,28].
Within recent global estimates of wood C content across the world’s trees and forests, Martin et al. (2018) calculated that mean C content in trees (divided into conifers and angiosperm trees) in boreal and temperate forests ranged from 46.5% (angiosperm, temperate forests) to 50.1% (conifer, temperate forests) [18]. Ma et al. (2018), based on global estimates, reported that the mean C content in stem wood was 47.7% in deciduous broad-leaved trees and 50.5% in conifers but 46.6% and 48.4%, respectively, in roots [15]. Furthermore, they concluded that plant C content showed significant latitudinal trends induced by climatic factors and life forms [15]. Previously, Thomas and Martin (2012) estimated that, in temperate/boreal biomes, the wood C content across species ranged from 43.4% to 55.6%, but observed that the mean C fraction in stem wood was 48.8% in angiosperm tree species and 50.8% in conifer tree species [9]. The values Martin et al. (2018) [18], Ma et al. (2018) [15] and Thomas and Martin (2012) found for mean C content in the wood of boreal and temperate forests [9], as well as the IPCC 2006 values [19] (based on Lamlom and Savidge (2003) [5]), were lower than those estimated in this study. Nevertheless, species-specific and regional scale studies show C content values that are more similar to our estimates. For instance, Laiho and Laine (1997) in Finland reported C content values in different tree parts ranging from 51.8% (stem wood without bark) to 53.8% (foliage) for Scots pine; 50.9% (stem wood without bark) to 54.0 (foliage) for Norway spruce and 49.7% (stem wood without bark) to 55.7% (bark) for birch, respectively [29]. In north-western Turkey, the weighted mean C content in aboveground parts of Scots pine was found to be 52.0% [21], but, in Belgium, Janssens et al. (1999) reported C content in different tree parts of Scots pine ranging from 48.9% (stem) to 55.4% (fine roots) [27]. In North America, the mean C content of poplars (Populus tremuloides Michx. and Populus trichocarpa Torr. & Gray) wood was found to be 48.2% [5]. Gao et al. (2016) reported that the average total C content (sum of volatile and non-volatile C) in the stem wood and bark of the major tree species in the boreal forests of Canada were 50.5% and 56.2%, respectively [10]. When interpreting results and comparing C content values obtained in different studies for selected tree species both natural aspects (e.g., geographical location, climate, soil conditions, tree age, provenance, social position in the stand) and methodological nuances such as the sampling method (for instance, stem sample with or without bark), the selected sampling point on the tree, the sampling time (as the content of mobile C compounds varies by season), the sample pre-treatment method (for instance, oven-drying, ambient-temperature desiccating or freeze-drying) and the analysis method must be considered [5,9,10,13,21,30]. Thus, any comparison of C content values must be performed cautiously.
In comparing the C content of different tree parts, living and dead branches (wood with a proportional share of bark) were found to have the highest mean C content of aboveground tree parts for all tree species, while small roots were found to have the highest mean C content of belowground tree parts for all tree species except Scots pine, which showed the highest mean C content in the stump. Similarly, Tolunay (2009) [21] and Janssens et al. (1999) [27] reported that the highest C content in the aboveground parts of Scots pine was found in the branches, which aligns with our results. Furthermore, a trend of decreasing C content in branches by diameter was found [13]. In our study, stem bark and foliage (needles and leaves) were not included as separate tree parts, but several other studies showed relatively higher C content values in these parts in particular (e.g., [10,29,31]). This may be explained by a higher proportion of C-rich organic compounds, such as extractives, lignin and suberin, in stem bark compared with other tree parts [10,13]. For instance, Martin et al. (2015) [23] and Gao et al. (2016) [10] found extremely high bark C content in boreal paper birch (Betula papyrifera) (65.0 ± 3.6% and 60.7 ± 1.4%, respectively) and stressed that much of the variation in wood C content attributable to tissue type can be associated with variable C content in the bark. Furthermore, they revealed that the difference in C content between bark and stem wood was generally higher for boreal tree species than for temperate tree species [10,23]. Our results represent wood with a proportional share of bark for all tree parts.
The tree part-specific C content values obtained in the present study tend to show negative correlations with stand age and tree size (stem height and diameter at breast height). A similar pattern was found for Scots pine by Bert and Danjon (2006) [13], Bembenek et al. (2015) [30] and Wegiel and Polowy (2020) [31]. Tree age determines the sapwood to heartwood ratio as well as the proportional distribution of juvenile and mature wood [9,13]. Juvenile wood generally has a higher proportion of earlywood [30,32] and thus a higher extractive and lignin content than mature wood to support mechanical stability and defence mechanisms [10]. Juvenile trees, therefore, have a higher C content [5,9,13]. More recent findings by Gao et al. (2016) [10] and Martin et al. (2013) [33] highlighted that the tree age- and size-associated trend of total C content was likely led by variations in the proportion of volatile C compounds. Furthermore, they speculate that the amount of volatile C was the most important predictor of the overall variation in the total C content in trees [10,33]. Most importantly, increasing evidence shows that disregarding the differences in C content among different tree parts as well as the size- and age-dependent changes in C content in tree biomass could lead to errors in estimating the C stock in living tree biomass (e.g., [31,34]).
Along with other factors, tree age strongly determines the total C stock in living tree biomass and the allocation of C stock across different tree parts [27]. The results of this study showed that the relative contribution of living branches and small roots decreased with tree age for all tree species, but the contribution of the stem trended higher with tree age, reaching 77.5% of the total C stock in birches more than 60 years old. The C stock sum of all aboveground parts ranged from 74.4% in European aspens 0 to 20 years old to 84.4% in Scots pines 21 to 40 years old, and the highest C stock of belowground parts was found in young European aspens (25.6%), with the lowest found in Scots pines 21 to 40 years old (15.6%). In general, our estimates of C stock distribution across tree parts fell within the ranges reported by previous studies (e.g., [21,27,29,35]).
Other studies have reported a much wider range of tree species- and tree part-specific C content values for different biomes [9,15,33] than the default IPCC (2006) values [19]. Thus, the use of the default IPCC (2006) C content values may over- or underestimate C stock in living tree biomass. Our study shows that using the default IPCC (2006) C content values to estimate C stock in the living biomass of forest land in Latvia may lead to an underestimation of 5.1% or 12.8 Mt C.
In forest stands dominated by Norway spruce, Scots pine, birch or European aspen, the admixture of other tree species is common in hemiboreal forests. A combination of weighted mean C content values for each tree species and NFI data (3rd cycle) showed that the average proportion of C stock in living biomass formed by admixed tree species ranged from 17% in forest stands dominated by Norway spruce to 30% in forest stands dominated by European aspen. Customised weighted mean C content values were developed for forest stands dominated by Norway spruce, Scots pine, birch or European aspen considering the admixture of other tree species (Table 3). The difference in weighted mean C content values for living tree biomass between dominant tree species and forest stands dominated by those species reached 0.7% for European aspen (509.0 ± 1.6 vs. 512.7 ± 0.1 g·kg−1). The difference for stands dominated by birch, Norway spruce and Scots pine was even more negligible (<0.4%).
5. Conclusions
The results of this study provided tree part-specific and weighted means of C content values for the main tree species in Latvia. Statistically significant C content variation was found among different tree parts as well as among tree species with a range of 504.6 ± 3.4 g·kg−1 (European aspen, coarse roots) to 550.6 ± 2.4 g·kg−1 (Scots pine, dead branches). Weighted mean C content values based on proportional biomass distribution of different tree parts for each tree species are recommended to increase the accuracy of C stock in living tree biomass estimates in the National GHG Inventory (weighted mean C content values for whole trees: 526.5 ± 2.3 g·kg−1 for Norway spruce, 533.2 ± 1.6 g·kg−1 for Scots pine, 521.4 ± 1.5 g·kg−1 for birch and 509.0 g·kg−1 for European aspen). Furthermore, the results highlight that using the default IPCC C content values [19] results in underestimation of the C stock in living tree biomass in Latvia.
Supplementary Materials
The following are available online at https://www.mdpi.com/article/10.3390/f12091292/s1, Figure S1: the difference in C content of different tree species between values as estimated in this study (weighted means) and IPCC 2006 values for temperate/boreal biomes or Martin et al. (2018) values for temperate and boreal biomes separately.
Author Contributions
Conceptualization, A.L.; methodology, A.L. and J.L.; software, A.B. (Arta Bārdule); data curation, A.B. (Aldis Butlers), J.S. and J.L.; writing—original draft preparation, A.B. (Arta Bārdule) and J.L.; writing—review and editing, A.L. and K.L.; visualization, A.B. (Arta Bārdule); supervision, A.L.; project administration, A.L. All authors have read and agreed to the published version of the manuscript.
Funding
In accordance with Contract No. 1.2.1.1/18/A/004 between the ‘Forest Sector Competence Centre of Latvia’ Ltd. and the Central Finance and Contracting Agency, within the research direction ‘Increase of forest capital value and forestry’, the project ‘Elaboration of guidelines and modelling tool for greenhouse gas (GHG) emission reduction in forests on nutrient-rich organic soils’ is conducted by the Latvian State Forest Research Institute ‘Silava’ with support from the European Regional Development Fund (ERDF).
Institutional Review Board Statement
Not applicable.
Informed Consent Statement
Not applicable.
Data Availability Statement
Not applicable.
Acknowledgments
The study was implemented within the scope of the project “Elaboration of guidelines and modelling tool for greenhouse gas (GHG) emission reduction in forests on nutrient-rich organic soils” (research project P11, grant agreement No. 1.2.1.1/18/A/004). We thank Ilze Pauliņa for drawing the tree part sampling design for C content analysis (Figure 1). J.L. contribution was supported by European Regional Development Fund, support for post-doctoral studies in Latvia “Reducing uncertainty in the calculation of forest stand biomass and carbon stock in Latvia” (No.: 1.1.1.2/VIAA/4/20/687).
Conflicts of Interest
The authors declare no conflict of interest. The funders had no role in the design of the study; in the collection, analyses, or interpretation of data; in the writing of the manuscript, or in the decision to publish the results.
References
- Pan, Y.; Birdsey, R.A.; Fang, J.; Houghton, R.; Kauppi, P.E.; Kurz, W.A.; Phillips, O.L.; Shvidenko, A.; Lewis, S.L.; Canadell, J.G.; et al. A large and persistent carbon sink in the world’s forests. Science 2011, 333, 988–993. [Google Scholar] [CrossRef] [Green Version]
- Hudiburg, T.W.; Law, B.E.; Moomaw, W.R.; Harmon, M.E.; Stenzel, J.E. Meeting GHG reduction targets requires accounting for all forest sector emissions. Environ. Res. Lett. 2019, 14, 095005. [Google Scholar] [CrossRef]
- Anderson-Teixeira, K.J.; Herrmann, V.; Banbury Morgan, R.; Bond-Lamberty, B.; Cook-Patton, S.C.; Ferson, A.E.; Muller-Landau, H.C.; Wang, M.M.H. Carbon cycling in mature and regrowth forests globally. Environ. Res. Lett. 2021, 16, 053009. [Google Scholar] [CrossRef]
- Gower, S. Patterns and mechanisms of the forest carbon cycle. Annu. Rev. Environ. Resour. 2003, 28, 169–204. [Google Scholar] [CrossRef]
- Lamlom, S.H.; Savidge, R.A. A reassessment of carbon content in wood: Variation within and between 41 North American species. Biomass Bioenergy 2003, 25, 381–388. [Google Scholar] [CrossRef]
- Taub, D.R. Effects of rising atmospheric concentrations of carbon dioxide on plants. Nat. Educ. Knowl. 2010, 3, 21. [Google Scholar]
- U.S. EPA (United States Environmental Protection Agency). EPA’s Report on the Environment (ROE). Carbon Storage in Forests. Available online: https://www.epa.gov/report-environment (accessed on 18 August 2021).
- Favero, A.; Daigneault, A.; Sohngen, B. Forests: Carbon sequestration, biomass energy, or both? Sci. Adv. 2020, 6, eaay6792. [Google Scholar] [CrossRef] [Green Version]
- Thomas, S.C.; Martin, A.R. Carbon content of tree tissues: A synthesis. Forests 2012, 3, 332–352. [Google Scholar] [CrossRef] [Green Version]
- Gao, B.; Taylor, A.R.; Chen, H.Y.H.; Wang, J. Variation in total and volatile carbon concentration among the major tree species of the boreal forest. For. Ecol. Manag. 2016, 375, 191–199. [Google Scholar] [CrossRef]
- Zhou, L.; Li, S.; Liu, B.; Wu, P.; Heal, K.V.; Ma, X. Tissue-specific carbon concentration, carbon stock, and distribution in Cunninghamia lanceolata (Lamb.) Hook plantations at various developmental stages in subtropical China. Ann. For. Sci. 2019, 76, 70. [Google Scholar] [CrossRef]
- Matthews, G. The Carbon Content of Trees; Technical Paper; Forestry Commission: Edinburgh, UK, 1993; p. 28. [Google Scholar]
- Bert, D.G.; Danjon, F. Carbon concentration variations in the roots, stem and crown of mature Pinus pinaster (Ait.). For. Ecol. Manag. 2006, 222, 279–295. [Google Scholar] [CrossRef]
- Wang, X.W.; Weng, Y.H.; Liu, G.F.; Krasowski, M.J.; Yang, C.P. Variations in carbon concentration, sequestration and partitioning among Betula platyphylla provenances. For. Ecol. Manag. 2015, 358, 344–352. [Google Scholar] [CrossRef]
- Ma, S.; He, F.; Tian, D.; Zou, D.; Yan, Z.; Yang, Y.; Zhou, T.; Huang, K.; Shen, H.; Fang, J. Variations and determinants of carbon content in plants: A global synthesis. Biogeosciences 2018, 15, 693–702. [Google Scholar] [CrossRef] [Green Version]
- Zapletal, M.; Juráò, S.; Krpeð, V.; Michna, K.; Edwards-Jonáðová, M.; Cudlín, P. Effect of ozone flux on selected structural and antioxidant characteristics of a mountain Norway spruce forest. Balt. For. 2018, 24, 261–267. [Google Scholar]
- Juráň, S.; Grace, J.; Urban, O. Temporal changes in ozone concentrations and their impact on vegetation. Atmosphere 2021, 12, 82. [Google Scholar] [CrossRef]
- Martin, A.R.; Doraisami, M.; Thomas, S.C. Global patterns in wood carbon concentration across the world’s trees and forests. Nat. Geosci. 2018, 11, 915–920. [Google Scholar] [CrossRef]
- IPCC. 2006 IPCC Guidelines for National Greenhouse Gas Inventories. In IPCC National Greenhouse Gas Inventories Programme; Eggleston, H.S., Buendia, L., Miwa, K., Ngara, T., Tanabe, K., Eds.; IGES: Kanagawa, Japan, 2006. [Google Scholar]
- Thomas, S.C.; Malczewski, G. Wood carbon content of tree species in Eastern China: Interspecific variability and the importance of the volatile fraction. J. Environ. Manag. 2007, 85, 659–662. [Google Scholar] [CrossRef] [PubMed]
- Tolunay, D. Carbon concentrations of tree components, forest floor and understory in young Pinus sylvestris stands in north-western Turkey. Scand. J. For. Res. 2009, 24, 394–402. [Google Scholar] [CrossRef]
- Ying, J.; Weng, Y.; Oswald, B.P.; Zhang, H. Variation in carbon concentrations and allocations among Larix olgensis populations growing in three field environments. Ann. For. Sci. 2019, 76, 99. [Google Scholar] [CrossRef] [Green Version]
- Martin, A.R.; Gezahegn, S.; Thomas, S.C. Variation in carbon and nitrogen concentration among major woody tissue types in temperate trees. Can. J. For. Res. 2015, 45, 744–757. [Google Scholar] [CrossRef]
- EEA. European Forest Types. Categories and Types for Sustainable Forest Management Reporting and Policy; EEA Technical Report No 9/2006; EEA: Copenhagen, Denmark, 2007; p. 114. [Google Scholar]
- Liepiņš, J.; Lazdiņš, A.; Liepiņš, K. Equations for estimating above- and belowground biomass of Norway spruce, Scots pine, birch spp. and European aspen in Latvia. Scand. J. For. Res. 2018, 33, 58–70. [Google Scholar] [CrossRef]
- The R Project for Statistical Computing. Available online: https://www.r-project.org/ (accessed on 18 August 2021).
- Janssens, I.A.; Sampson, D.A.; Cermák, J.; Meiresonne, L.; Riguzzi, F.; Overloop, S.; Ceulemans, R. Above- and belowground phytomass and carbon storage in a Belgian Scots pine stand. Ann. For. Sci. 1999, 56, 81–90. [Google Scholar] [CrossRef]
- Savidge, R.A. Biochemistry of Seasonal Cambial Growth and Wood Formation-An Overview of the Challenges. In Cell and Molecular Biology of Wood Formation; Savidge, R.A., Barnett, J.R., Napier, R., Eds.; BIOS Scientific Publishers Ltd.: Oxford, UK, 2000; p. 30. [Google Scholar]
- Laiho, R.; Laine, J. Tree stand biomass and carbon content in an age sequence of drained pine mires in southern Finland. For. Ecol. Manag. 1997, 93, 161–169. [Google Scholar] [CrossRef]
- Bembenek, M.; Giefing, D.F.; Jelonek, T.; Karaszewski, Z.; Kruszyk, R.; Tomczak, A.; Woszczyk, M.; Mederski, P.S. Carbon content in juvenile and mature wood of Scots pine (Pinus sylvestris L.). Balt. For. 2015, 21, 279–284. [Google Scholar]
- Wegiel, A.; Polowy, K. Aboveground carbon content and storage in mature Scots pine stands of different densities. Forests 2020, 11, 240. [Google Scholar] [CrossRef] [Green Version]
- Zobel, B.J.; Sprague, J.R. Juvenile Wood in Forest Trees; Springer Series in Wood Science; Springer: Berlin/Heidelberg, Germany, 1998. [Google Scholar]
- Martin, A.R.; Thomas, S.C.; Zhao, Y. Size-dependent changes in wood chemical traits: A comparison of neotropical saplings and large trees. AoB PLANTS 2013, 5, plt039. [Google Scholar] [CrossRef]
- Ma, S.; Eziz, A.; Tian, D.; Yan, Z.; Cai, Q.; Jiang, M.; Ji, C.; Fang, J. Tree size and age induced stem carbon content variations cause an uncertainty in forest carbon stock estimation. Biogeosci. Discuss. 2019. [preprint]. [Google Scholar] [CrossRef]
- Skovsgaard, J.P.; Stupak, I.; Vesterdal, L. Distribution of biomass and carbon in even-aged stands of Norway spruce (Picea abies (L.) Karst.): A case study on spacing and thinning effects in northern Denmark. Scand. J. For. Res. 2006, 21, 470–488. [Google Scholar] [CrossRef]
Figure 1.
Tree part sampling design for C content analysis. All samples contained proportional shares of heartwood, sapwood and bark. Living branches of coniferous tree species contained proportional shares of needles, deciduous trees were leafless.
Figure 1.
Tree part sampling design for C content analysis. All samples contained proportional shares of heartwood, sapwood and bark. Living branches of coniferous tree species contained proportional shares of needles, deciduous trees were leafless.

Figure 2.
C content in different tree parts for the main tree species in Latvia. In the box plots, the median is shown by the bold line, the mean is shown by the dark red square, the box corresponds to the lower and upper quartiles, the whiskers show the minimal and maximal values (within 150% of the interquartile range from the median) and the black dots represent outliers of the datasets. Different letters show statistically significant differences (p < 0.05) between different tree parts within the same tree species. The number of samples (N) for each grouping is shown.

Figure 3.
C content in different tree parts for the main tree species in Latvia. In the box plots, the median is shown by the bold line, the mean is shown by the dark red square, the box corresponds to the lower and upper quartiles, the whiskers show the minimal and maximal values (within 150% of the interquartile range from the median) and the black dots represent outliers of the datasets. Different letters show statistically significant differences (p < 0.05) between different tree species within the same tree part. The number of samples (N) for each grouping is shown.

Figure 4.
Relationships in Norway spruce between the weighted mean C content of the whole tree and tree age, stem height and diameter at breast height. Confidence interval is shown around smooth.
Figure 4.
Relationships in Norway spruce between the weighted mean C content of the whole tree and tree age, stem height and diameter at breast height. Confidence interval is shown around smooth.

Figure 5.
Carbon stock allocation in tree parts (including above- and belowground parts) of four main tree species.
Figure 5.
Carbon stock allocation in tree parts (including above- and belowground parts) of four main tree species.


Table 1.
Characteristics of sample trees.
| Parameter, Unit | Value | Tree Species | |||
|---|---|---|---|---|---|
| Norway Spruce | Scots Pine | Birch | European Aspen | ||
| Number of sample trees | total number | 81 | 102 | 105 | 84 |
| Age 1, years | average | 41 | 54 | 35 | 23 |
| range | 9–97 | 6–141 | 8–92 | 5–76 | |
| Stem height, m | average ± S.E. | 16.6 ± 1.0 | 17.3 ± 0.9 | 18.1 ± 0.8 | 16.6 ± 0.9 |
| range | 2.8–30.8 | 1.9–34.5 | 4.9–32.3 | 3.7–29.9 | |
| Diameter at breast height, cm | average ± S.E. | 17.5 ± 1.0 | 19.0 ± 0.9 | 14.7 ± 0.7 | 13.8 ± 0.9 |
| range | 2.4–36.3 | 1.5–45.3 | 2.7–37.2 | 2.8–34.1 | |
1 Average tree age in stand.
Table 2.
Weighted means of C content in the tree for four main tree species in Latvia. Weighted means were calculated based on the proportional distribution of biomass of different tree parts. Different letters show statistically significant differences (p < 0.05) between different tree species within the same tree part.
| Tree Part | Values | Weighted Mean C Content in Tree, g·kg−1 | |||
|---|---|---|---|---|---|
| Norway Spruce | Scots Pine | Birch | European Aspen | ||
| Aboveground parts | average ± S.E. | 524.4 ± 1.4 a | 530.4 ± 1.3 b | 520.6 ± 1.4 c | 510.2 ± 1.3 d |
| median | 524.2 | 531.3 | 520.4 | 509.8 | |
| range | 483.9–551.7 | 467.2–562.9 | 487.8–559.7 | 480.9–534.6 | |
| Belowground parts | average ± S.E. | 529.9 ± 2.6 a | 531.5 ± 2.4 a | 527.9 ± 1.7 a | 507.4 ± 2.1 b |
| median | 529.0 | 529.4 | 528.9 | 508.4 | |
| range | 497.2–559.3 | 486.5–567.0 | 502.9–549.6 | 482.1–531.9 | |
| Whole | average ± S.E. | 526.5 ± 2.3 a | 533.2 ± 1.6 b | 521.4 ± 1.5 c | 509.0 ± 1.6 d |
| median | 526.4 | 535.5 | 521.5 | 507.9 | |
| range | 489.8–546.2 | 502.1–554.7 | 501.3–550.5 | 490.0–527.4 | |
Table 3.
Weighted means of C content for forest stands dominated by Norway spruce, Scots pine, birch or European aspen in Latvia. Weighted means were calculated based on the proportional distribution of whole tree biomass of different species in forest stands, taking into account the proportional distribution of admixed tree species. Different letters show statistically significant differences (p < 0.05) between stands with different dominant tree species.
| Values | Weighted Mean C Content for Forest Stands, g·kg−1 | |||
|---|---|---|---|---|
| Stands Dominated by Norway Spruce | Stands Dominated by Scots Pine | Stands Dominated by Birch | Stands Dominated by European Aspen | |
| Average ± S.E. | 525.6 ± 0.1 a | 531.3 ± 0.1 b | 521.4 ± 0.1 c | 512.7 ± 0.1 d |
| Median | 526.4 | 532.1 | 521.4 | 512.0 |
| Range | 518.7–529.6 | 518.4–533.2 | 513.9–527.9 | 509.0–523.4 |
Publisher’s Note: MDPI stays neutral with regard to jurisdictional claims in published maps and institutional affiliations. |
© 2021 by the authors. Licensee MDPI, Basel, Switzerland. This article is an open access article distributed under the terms and conditions of the Creative Commons Attribution (CC BY) license (https://creativecommons.org/licenses/by/4.0/).
Share and Cite
MDPI and ACS Style
Bārdule, A.; Liepiņš, J.; Liepiņš, K.; Stola, J.; Butlers, A.; Lazdiņš, A. Variation in Carbon Content among the Major Tree Species in Hemiboreal Forests in Latvia. Forests 2021, 12, 1292. https://doi.org/10.3390/f12091292
AMA Style
Bārdule A, Liepiņš J, Liepiņš K, Stola J, Butlers A, Lazdiņš A. Variation in Carbon Content among the Major Tree Species in Hemiboreal Forests in Latvia. Forests. 2021; 12(9):1292. https://doi.org/10.3390/f12091292
Chicago/Turabian StyleBārdule, Arta, Jānis Liepiņš, Kaspars Liepiņš, Jeļena Stola, Aldis Butlers, and Andis Lazdiņš. 2021. "Variation in Carbon Content among the Major Tree Species in Hemiboreal Forests in Latvia" Forests 12, no. 9: 1292. https://doi.org/10.3390/f12091292
Note that from the first issue of 2016, this journal uses article numbers instead of page numbers. See further details here.