
Forecasting Erroneous Neural Machine Translation of Disease Symptoms: Development of Bayesian Probabilistic Classifiers for Cross-Lingual Health Translation


Abstract
:1. Introduction
2. Materials and Methods
2.1. Screening of Original English Source Texts
2.2. Multi-Dimensional Features
2.3. Structural Features
2.4. Semantic Features
2.5. Bayesian Machine Learning Classifiers
2.6. Feature Optimisation
3. Results
4. Discussion
4.1. Probabilistic Results
4.2. Diagnostic Utility
5. Conclusions
Author Contributions
Funding
Institutional Review Board Statement
Informed Consent Statement
Data Availability Statement
Conflicts of Interest
References
- Garg, S.; Williams, N.L.; Ip, A.; Dicker, A.P. Clinical integration of digital solutions in health care: An overview of the current landscape of digital technologies in cancer care. JCO Clin. Cancer Inform. 2018, 2, 1–9. [Google Scholar] [CrossRef]
- Gordon, W.J.; Landman, A.; Zhang, H.; Bates, D.W. Beyond validation: Getting health apps into clinical practice. NPJ Digit. Med. 2020, 3, 14. [Google Scholar] [CrossRef] [Green Version]
- Deville, G.; Herbigniaux, E. Natural language modeling in a machine translation prototype for healthcare applications: A sublanguage approach. In Proceedings of the Sixth International Conference on Theoretical and Methodological Issues in Machine Translation, Leuven, Belgium, 5–7 July 1995. [Google Scholar]
- Manchanda, S.; Grunin, G. Domain informed neural machine translation: Developing translation services for healthcare enterprise. In Proceedings of the 22nd Annual Conference of the European Association for Machine Translation, Lisboa, Portugal, 3–5 November 2020; pp. 255–261. [Google Scholar]
- Taylor, R.M.; Crichton, N.; Moult, B.; Gibson, F. A prospective observational study of machine translation software to overcome the challenge of including ethnic diversity in healthcare research. Nurs. Open 2015, 2, 14–23. [Google Scholar] [CrossRef] [PubMed] [Green Version]
- Haddow, B.; Birch, A.; Heafield, K. Machine translation in healthcare. In The Routledge Handbook of Translation and Health; Susam-Saraeva, S.E., Spišiaková, E., Eds.; Routledge: London, UK, 2021. [Google Scholar]
- Narayan, L. Addressing language barriers to healthcare in India. Natl. Med. J. India 2013, 26, 236–238. [Google Scholar] [PubMed]
- Mark, P.S.; Joshua, D.A.; Sehj, K.; Michael, G.; Marshall, N.; Kristin, C.; William, R.; Suresh, B. A path for translation of machine learning products into healthcare delivery. Eur. Med. J. Innov. 2020, 10, 19–172. [Google Scholar]
- Wu, Y.; Schuster, M.; Chen, Z.; Le, Q.V.; Norouzi, M.; Macherey, W.; Krikun, M.; Cao, Y.; Gao, Q.; Macherey, K.J.A.P.A. Google’s neural machine translation system: Bridging the gap between human and machine translation. arXiv 2016, arXiv:1609.08144. [Google Scholar]
- Tu, Z.; Lu, Z.; Liu, Y.; Liu, X.; Li, H. Modeling coverage for neural machine translation. In Proceedings of the 54th Annual Meeting of the Association for Computational Linguistics, Berlin, Germany, 7–12 August 2016; pp. 76–85. [Google Scholar]
- Voita, E.; Serdyukov, P.; Sennrich, R.; Titov, I. Context-aware neural machine translation learns anaphora resolution. In Proceedings of the 56th Annual Meeting of the Association for Computational Linguistics, Melbourne, Australia, 15–20 July 2018; pp. 1264–1274. [Google Scholar]
- Zhao, Y.; Zhang, J.; He, Z.; Zong, C.; Wu, H. Addressing Troublesome Words in Neural Machine Translation. In Proceedings of the Conference on Empirical Methods in Natural Language Processing, Brussels, Belgium, 31 October–4 November 2018; pp. 391–400. [Google Scholar]
- Khoong, E.C.; Steinbrook, E.; Brown, C.; Fernandez, A. Assessing the use of google translate for Spanish and Chinese translations of emergency department discharge instructions. JAMA Intern. Med. 2019, 179, 580–582. [Google Scholar] [CrossRef] [PubMed]
- Kirchhoff, K.; Turner, A.M.; Axelrod, A.; Saavedra, F. Application of statistical machine translation to public health information: A feasibility study. J. Am. Med. Inform. 2011, 18, 473–478. [Google Scholar] [CrossRef] [Green Version]
- Aymerich, J. Using machine translation for fast, inexpensive, and accurate health information assimilation and dissemination. In Proceedings of the 9th World Congress on Health Information and Libraries, Bahia, Brazil, 20–23 September 2005. [Google Scholar]
- Gravelle, H.; Jacobs, R.; Jones, A.M.; Street, A. Comparing the efficiency of national health systems: A sensitivity analysis of the WHO approach. Appl. Health Econ. Health Policy 2003, 2, 141–147. [Google Scholar] [PubMed]
- Hair, G.; Gonin, M.; Pone, S.; Cruz, O.; Nobre, F.; Brasil, P. Sensitivity and specificity of the World Health Organization dengue classification schemes for severe dengue assessment in children in Rio de Janeiro. PLoS ONE 2014, 9, e96314. [Google Scholar] [CrossRef]
- Phuong, C.; Nhan, N.; Kneen, R.; Thuy, P.; Thien, C.; Nga, N.; Thuy, T.; Solomon, T.; Stepniewska, K.; Mai, T.T.T.; et al. Clinical diagnosis and assessment of severity of confirmed dengue infections in Vietnamese children: Is the World Health Organization classification system helpful? Am. J. Trop. Med. Hyg. 2004, 70, 172–179. [Google Scholar] [CrossRef] [Green Version]
- Deen, J.L.; Harris, E.; Wills, B.; Balmaseda, A.; Hammond, S.N.; Rocha, C.; Dung, N.M.; Hung, N.T.; Hien, T.T.; Farrar, J.J. The WHO dengue classification and case definitions: Time for a reassessment. Lancet 2006, 368, 170–173. [Google Scholar] [CrossRef]
- Porter, R.S.; Kaplan, J.L. The Merck Manual of Diagnosis and Therapy, 19th ed.; Porter, R.S., Ed.; Merck Sharp & Dohme Corp.: Whitehouse Station, NJ, USA, 2011. [Google Scholar]
- Beers, M.H. The Merck Manual of Diagnosis and Therapy, 19th ed.; Merck Sharp & Dohme Corp: Kenilworth, NJ, USA, 2001. [Google Scholar]
- Rayson, P.; Archer, D.; Piao, S.; McEnery, A.M. The UCREL semantic analysis system. In Proceedings of the Beyond Named Entity Recognition Semantic Labeling for NLP Tasks workshop, Lisbon, Portugal, 26–28 May 2004; pp. 7–12. [Google Scholar]
- Piao, S.S.; Rayson, P.; Archer, D.; McEnery, T. Comparing and combining a semantic tagger and a statistical tool for MWE extraction. Comput. Speech Lang. 2005, 19, 378–397. [Google Scholar] [CrossRef]
- Misra, P.; Agarwal, N.; Kasabwala, K.; Hansberry, D.R.; Setzen, M.; Eloy, J.A. Readability analysis of healthcare-oriented education resources from the american academy of facial plastic and reconstructive surgery. Laryngoscope 2013, 123, 90–96. [Google Scholar] [CrossRef] [PubMed]
- Hanna, K.; Brennan, D.; Sambrook, P.; Armfield, J. Third molars on the internet: A guide for assessing information quality and readability. Interact. J. Med. Res. 2015, 4, e19. [Google Scholar] [CrossRef] [Green Version]
- Shedlosky-Shoemaker, R.; Sturm, A.C.; Saleem, M.; Kelly, K.M. Tools for assessing readability and quality of health-related web sites. J. Genet. Couns. 2009, 18, 49–59. [Google Scholar] [CrossRef]
- Bishop, C.M.; Tipping, M.E. Bayesian regression and classification. In Nato Science Series Sub Series III Computer And Systems Sciences; IOS Press: Amsterdam, The Netherlands, 2003; Volume 190, pp. 267–288. [Google Scholar]
- Langarizadeh, M.; Moghbeli, F. Applying naive bayesian networks to disease prediction: A systematic review. Acta Inform. Med. 2016, 24, 364. [Google Scholar] [CrossRef]
- Bowd, C.; Hao, J.; Tavares, I.M.; Medeiros, F.A.; Zangwill, L.M.; Lee, T.-W.; Sample, P.A.; Weinreb, R.N.; Goldbaum, M.H. Bayesian Machine Learning Classifiers for Combining Structural and Functional Measurements to Classify Healthy and Glaucomatous Eyes. Investig. Opthalmol. Vis. Sci. 2008, 49, 945–953. [Google Scholar] [CrossRef]
- Tipping, M.E. Sparse Bayesian Learning and the Relevance Vector Machine. J. Mach. Learn. Res. 2001, 1, 211–244. [Google Scholar]
- Tipping, M.E. The relevance vector machine. In Advances in Neural Information Processing Systems; MIT Press: Cambridge, MA, USA, 2000; pp. 652–658. [Google Scholar]
- Abbas, M.; Memon, K.A.; Jamali, A.A.; Memon, S.; Ahmed, A. Multinomial Naive Bayes classification model for sentiment analysis. IJCSNS Int. J. Comput. Sci. Netw. Secur. 2019, 19, 62–67. [Google Scholar]
- Sulieman, L.; Robinson, J.R.; Jackson, G.P. Automating the Classification of Complexity of Medical Decision-Making in Patient-Provider Messaging in a Patient Portal. J. Surg. Res. 2020, 255, 224–232. [Google Scholar] [CrossRef] [PubMed]
- Guyon, I.; Weston, J.; Barnhill, S.; Vapnik, V. Gene Selection for Cancer Classification using Support Vector Machines. Mach. Learn. 2002, 46, 389–422. [Google Scholar] [CrossRef]
- Singh, D.; Singh, B. Investigating the impact of data normalization on classification performance. Appl. Soft Comput. 2020, 97, 105524. [Google Scholar] [CrossRef]
- Ayub, M.; El-Alfy, E.-S.M. Impact of Normalization on BiLSTM Based Models for Energy Disaggregation. In 2020 International Conference on Data Analytics for Business and Industry: Way Towards a Sustainable Economy (ICDABI); IEEE: Piscataway, NJ, USA, 2020; pp. 1–6. [Google Scholar]


| Methods | Training (5-Fold CV) | Testing | ||||
|---|---|---|---|---|---|---|
| AUC Mean (SD) | AUC | Accuracy | F-Score | Sensitivity | Specificity | |
| Readability Formula Based Binary Classifiers | ||||||
| Flesch Reading Ease Scores (60) | / | 0.318 | 0.393 | 0.28 | 1 | 0 |
| Gunning Fog Index (12) | / | 0.277 | 0.321 | 0.32 | 0.36 | 0.29 |
| SMOG Index (12) | / | 0.283 | 0.321 | 0.32 | 0.36 | 0.29 |
| Machine Learning Classifiers using Full Feature Sets (number of features) | ||||||
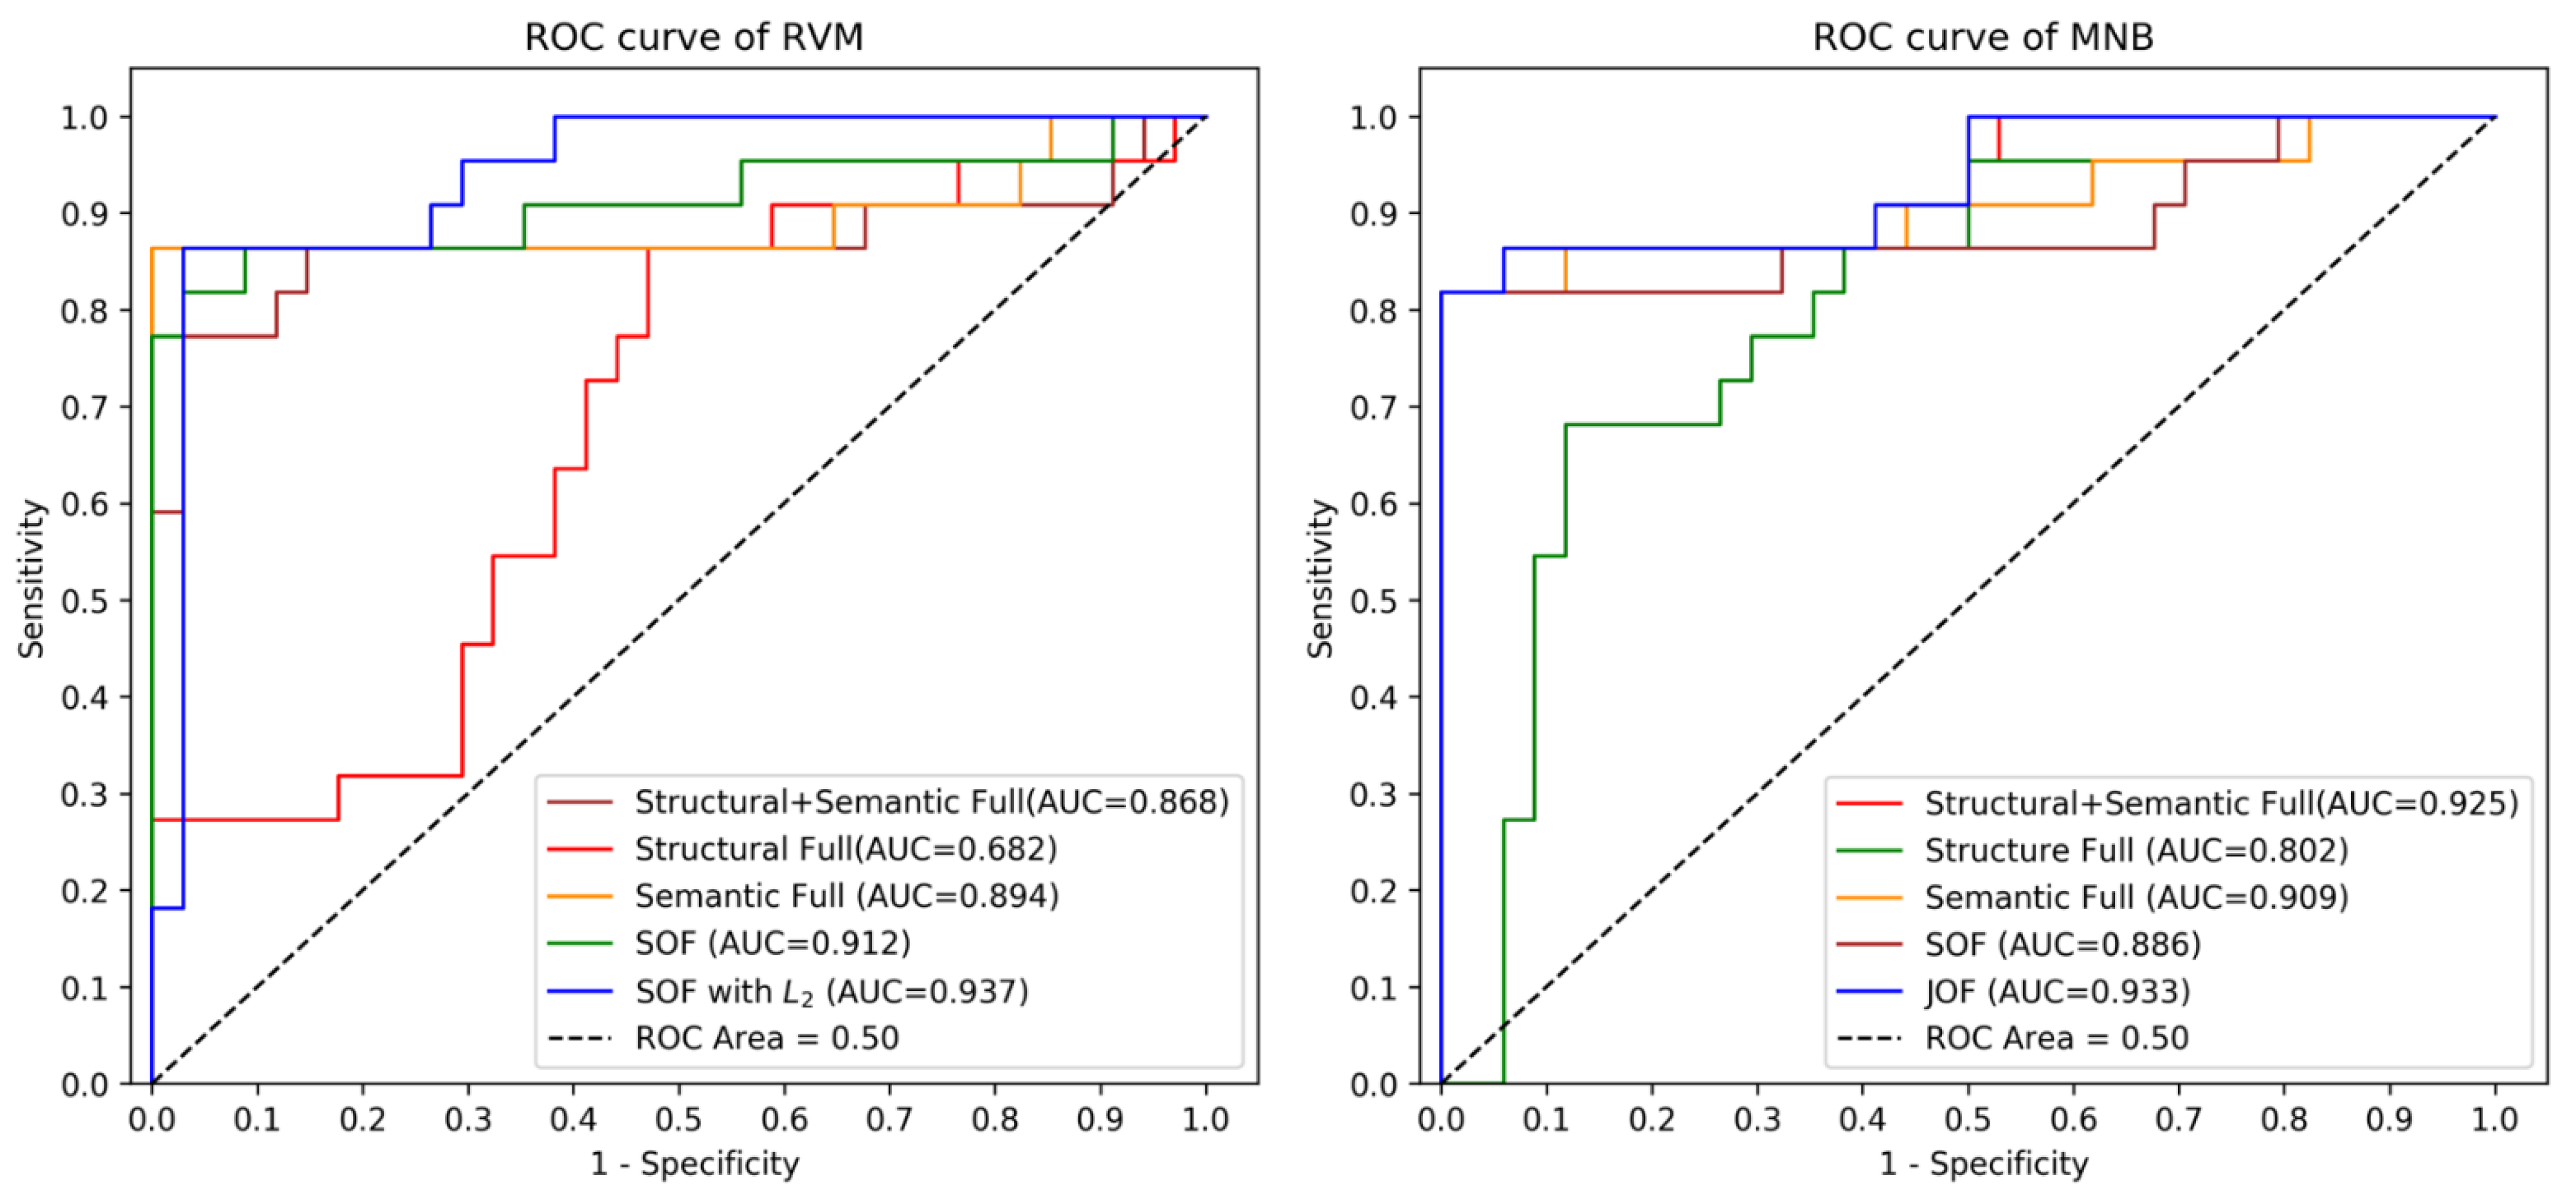
| Structural Full RVM (20) | 0.668 (0.070) | 0.682 | 0.554 | 0.51 | 0.32 | 0.71 |
| Semantic Full RVM (115) | 0.801 (0.059) | 0.894 | 0.893 | 0.89 | 0.86 | 0.91 |
| Structural + Semantics Full RVM (135) | 0.858 (0.047) | 0.868 | 0.839 | 0.83 | 0.77 | 0.88 |
| Structural Full MNB (20) | 0.6957 (0.12) | 0.802 | 0.786 | 0.77 | 0.68 | 0.85 |
| Semantic Full MNB (115) | 0.7966 (0.05) | 0.909 | 0.893 | 0.89 | 0.82 | 0.94 |
| Structural + Semantics Full MNB (135) | 0.786 (0.058) | 0.925 | 0.911 | 0.90 | 0.82 | 0.97 |
| Machine Learning Classifiers using Different Optimised Feature Sets (number of features) | ||||||
| Structural-optimised (TOF) RVM (5) | 0.605 (0.075) | 0.759 | 0.661 | 0.58 | 0.27 | 0.91 |
| Semantic-optimised (SOF) RVM (14) | 0.829 (0.042) | 0.912 | 0.893 | 0.89 | 0.82 | 0.94 |
| Jointly-optimised (JOF) RVM (57) | 0.846 (0.042) | 0.878 | 0.857 | 0.85 | 0.82 | 0.88 |
| Structural-optimised (TOF) MNB (5) | 0.456 (0.118) | 0.414 | 0.554 | 0.46 | 0.18 | 0.79 |
| Semantic-optimised (SOF) MNB (14) | 0.839 (0.061) | 0.886 | 0.893 | 0.89 | 0.82 | 0.94 |
| Jointly-optimised (JOF)MNB (57) | 0.832 (0.061) | 0.933 | 0.911 | 0.90 | 0.82 | 0.97 |
| RVM using Different, Normalized and Optimised Feature Sets (number of features) | ||||||
| Structural-optimised (TOF) RVM with Min-Max (5) | 0.693 (0.069) | 0.691 | 0.696 | 0.67 | 0.5 | 0.82 |
| Structural-optimised (TOF) RVM with L2 (5) | 0.345 (0.093) | 0.467 | 0.607 | 0.38 | 0 | 1.0 |
| Semantic-optimised (SOF) RVM with Min-Max (14) | 0.847 (0.036) | 0.868 | 0.857 | 0.84 | 0.68 | 0.97 |
| Semantic-optimised (SOF) RVM with L2 (14) | 0.845 (0.057) | 0.937 | 0.912 | 0.91 | 0.86 | 0.94 |
| Jointly-optimised (JOF) RVM with Min-Max (57) | 0.787 (0.065) | 0.860 | 0.804 | 0.80 | 0.82 | 0.79 |
| Jointly-optimised (JOF) RVM with L2 (57) | 0.842 (0.036) | 0.947 | 0.875 | 0.87 | 0.86 | 0.88 |
| RVM Classifier Pair(s) | Asymptotic 95% Confidence Interval | ||
|---|---|---|---|
| Lower | Upper | p-Value | |
| SOF with L2 vs. Structural + Semantic Full | 0.0522 | 0.0367 | 0.0367 |
| SOF with L2 vs. Structural Full | 0.1128 | 0.6004 | 0.0122 |
| SOF with L2 vs. Semantic Full | −0.0086 | 0.0534 | 0.1412 |
| SOF with L2 vs. TOF with Min-Max | 0.0685 | 0.4043 | 0.0122 |
| SOF with L2 vs. JOF | 0.0381 | 0.0715 | 0.0367 |
| SOF with L2 vs. JOF with L2 | −0.0321 | 0.0829 | 0.4633 |
| SOF with L2 vs. SOF | −0.0073 | 0.0489 | 0.5284 |
| TOF with Min-Max vs. Structural Full | −0.2146 | 0.2934 | 0.8345 |
| JOF with L2 vs. Structural + Semantic Full | −0.0219 | 0.1199 | 0.1161 |
| Techniques | NSEP English Health Materials | SEP English Health Materials | p * |
|---|---|---|---|
| Mean Probability, SD (n = 34) | Mean Probability, SD (n = 22) | ||
| Flesch Reading Ease Scores (60) | 41.088, 9.333 | 47.591, 10.680 | 0.0229 |
| Gunning Fog Index (12) | 12.774, 1.762 | 11.232, 1.965 | 0.0053 |
| SMOG Index (12) | 12.694, 1.294 | 11.582, 1.278 | 0.0067 |
| Structural Full RVM (20) | 0.344, 0.169 | 0.479, 0.216 | 0.0230 |
| Semantic Full RVM (115) | 0.202, 0.147 | 0.769, 0.312 | <0.00001 |
| Structural-optimised (TOF) RVM (5) | 0.370, 0.139 | 0.451, 0.108 | 0.0012 |
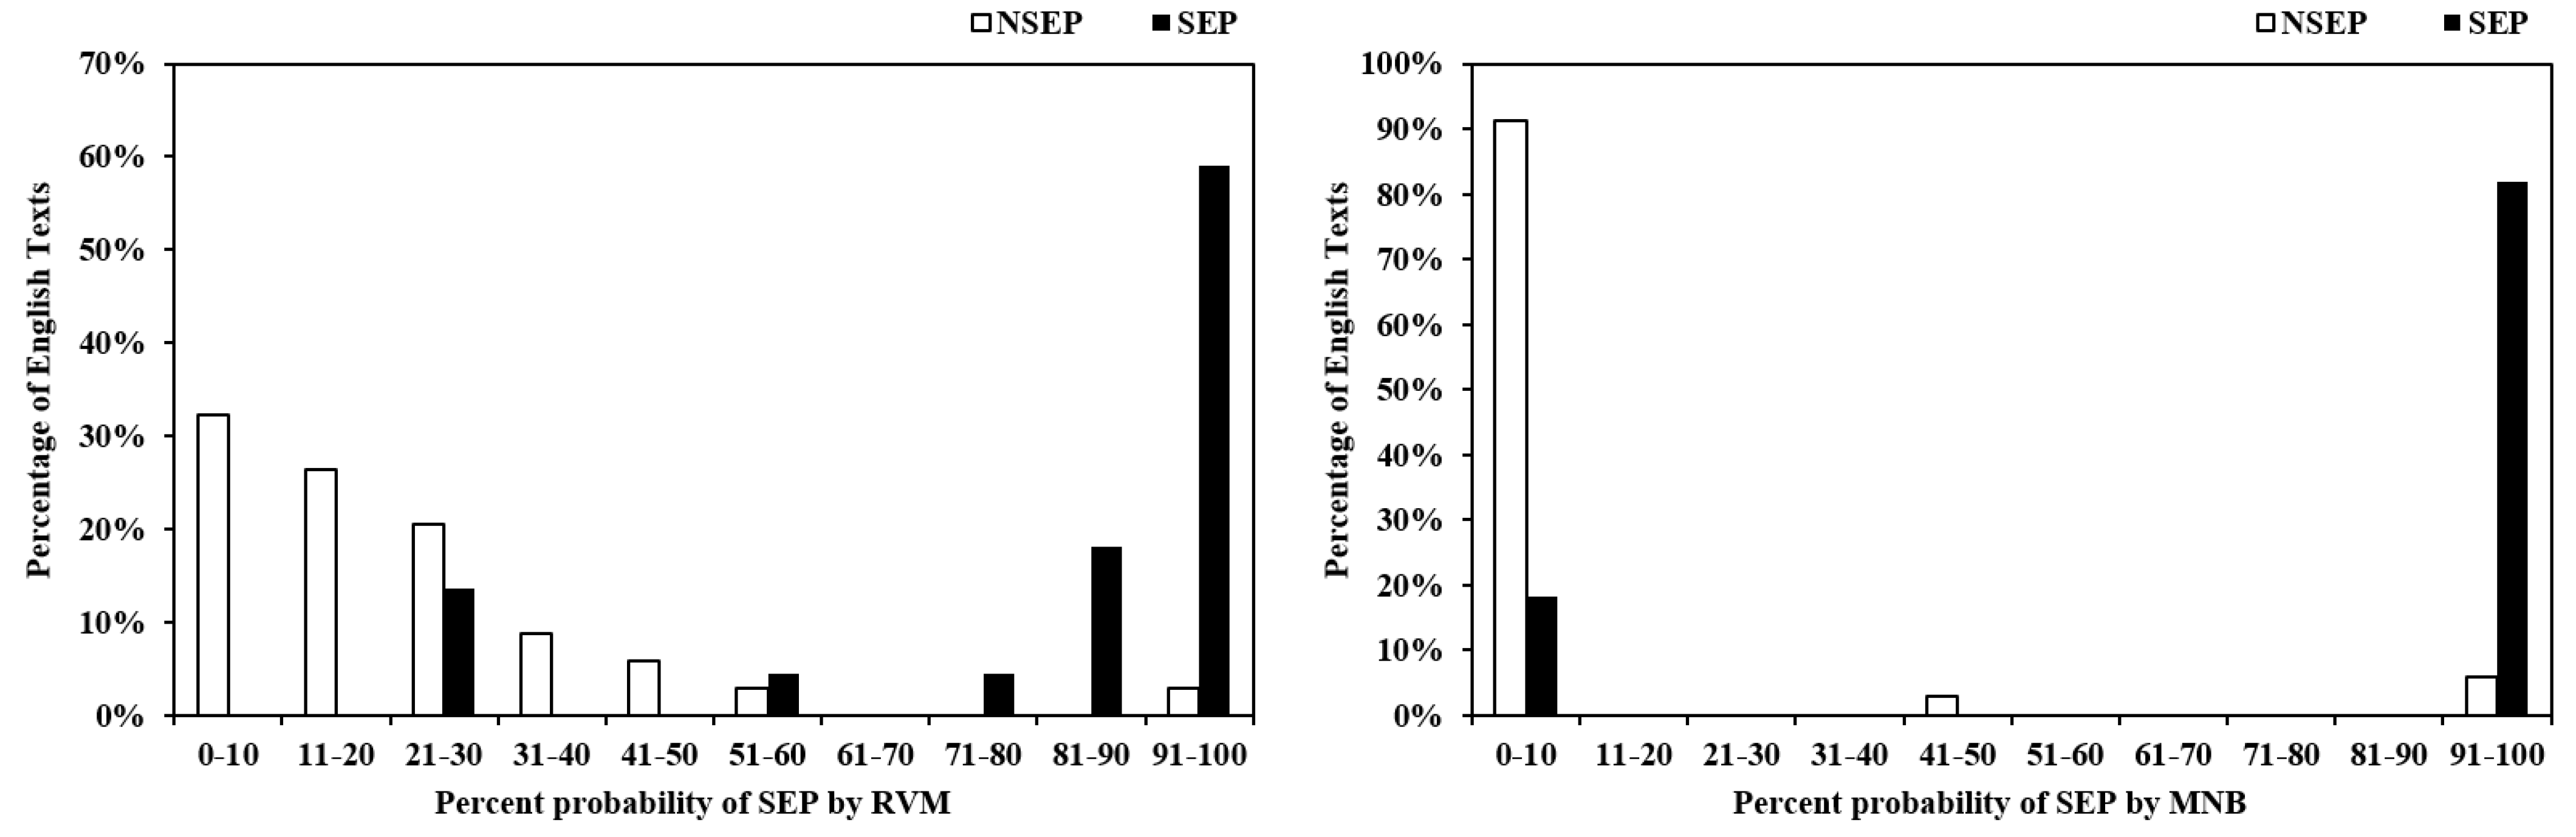
| Semantic-optimised (SOF) RVM (14) | 0.192, 0.171 | 0.780, 0.290 | <0.00001 |
| Structural Full MNB (20) | 0.167, 0.321 | 0.626, 0.431 | 0.0002 |
| Semantic Full MNB (115) | 0.066, 0.239 | 0.818, 0.394 | <0.00001 |
| Structural-optimised (TOF) MNB (5) | 0.401, 0.148 | 0.358, 0.139 | 0.2867 |
| Semantic-optimised (SOF) MNB (14) | 0.077, 0.241 | 0.818, 0.394 | <0.00001 |
| Structural + Semantics Full RVM (135) | 0.220, 0.186 | 0.759, 0.324 | <0.00001 |
| Structural + Semantics Full MNB (135) | 0.042, 0.178 | 0.817, 0.394 | <0.00001 |
| Jointly-optimised (JOF) RVM (57) | 0.201, 0.177 | 0.776, 0.323 | <0.00001 |
| Jointly-optimised (JOF) MNB (57) | 0.034, 0.147 | 0.815, 0.393 | <0.00001 |
| Structural-optimised (TOF) RVM with Min-Max (5) | 0.353, 0.211 | 0.511, 0.247 | 0.0168 |
| Structural-optimised (TOF) RVM with L2 (5) | 0.432, 0.0003 | 0.432, 0.0003 | 0.6811 |
| Semantic-optimised (SOF) RVM with Min-Max (14) | 0.241, 0.127 | 0.715, 0.336 | <0.00001 |
| Semantic-optimised (SOF) RVM with L2 (14) | 0.209, 0.180 | 0.802, 0.250 | <0.00001 |
| Jointly-optimised (JOF) RVM with Min-Max (57) | 0.243, 0.239 | 0.744, 0.339 | <0.00001 |
| Jointly-optimised (JOF) RVM with L2 (57) | 0.224, 0.193 | 0.789, 0.232 | <0.00001 |
| Thresholds | Sensitivity (95% CI) | Specificity (95% CI) | Positive Likelihood Ratio (95% CI) | Negative Likelihood Ratio (95% CI) |
|---|---|---|---|---|
| 0.23 | 0.95 (0.87, 1.04) | 0.71 (0.55, 0.86) | 3.25 (1.91, 5.51) | 0.06 (0.01, 0.44) |
| 0.25 | 0.91 (0.79, 1.03) | 0.74 (0.59, 0.88) | 3.43 (1.93, 6.11) | 0.12 (0.03, 0.47) |
| 0.40 | 0.86 (0.72, 1.01) | 0.88 (0.77, 0.99) | 7.34 (2.88, 18.71) | 0.16 (0.05, 0.45) |
| 0.50 | 0.86 (0.72, 1.01) | 0.94 (0.86, 1.02) | 14.68 (3.79, 56.90) | 0.15 (0.05, 0.43) |
| 0.60 | 0.82 (0.66, 0.98) | 0.97 (0.91, 1.00) | 27.82 (3.99, 193.76) | 0.19 (0.08, 0.46) |
| 0.80 | 0.77 (0.60, 0.95) | 0.97 (0.91,1.03) | 26.27 (3.76, 183.59) | 0.23 (0.11, 0.51) |
| 0.90 | 0.59 (0.39, 0.80) | 0.97 (0.91,1.03) | 20.09 (2.82, 142.92) | 0.42 (0.25, 0.70) |
Publisher’s Note: MDPI stays neutral with regard to jurisdictional claims in published maps and institutional affiliations. |
© 2021 by the authors. Licensee MDPI, Basel, Switzerland. This article is an open access article distributed under the terms and conditions of the Creative Commons Attribution (CC BY) license (https://creativecommons.org/licenses/by/4.0/).
Share and Cite
Ji, M.; Xie, W.; Huang, R.; Qian, X. Forecasting Erroneous Neural Machine Translation of Disease Symptoms: Development of Bayesian Probabilistic Classifiers for Cross-Lingual Health Translation. Int. J. Environ. Res. Public Health 2021, 18, 9873. https://doi.org/10.3390/ijerph18189873
Ji M, Xie W, Huang R, Qian X. Forecasting Erroneous Neural Machine Translation of Disease Symptoms: Development of Bayesian Probabilistic Classifiers for Cross-Lingual Health Translation. International Journal of Environmental Research and Public Health. 2021; 18(18):9873. https://doi.org/10.3390/ijerph18189873
Chicago/Turabian StyleJi, Meng, Wenxiu Xie, Riliu Huang, and Xiaobo Qian. 2021. "Forecasting Erroneous Neural Machine Translation of Disease Symptoms: Development of Bayesian Probabilistic Classifiers for Cross-Lingual Health Translation" International Journal of Environmental Research and Public Health 18, no. 18: 9873. https://doi.org/10.3390/ijerph18189873