
An Ecological Development Level Evaluation of the Forestry Industry in China Based on a Hybrid Ensemble Approach


1
College of Mathematics and Computer Science, Zhejiang A&F University, Hangzhou 311300, China
2
College of Economics and Management, Zhejiang A&F University, Hangzhou 311300, China
3
Research Academy for Rural Revitalization of Zhejiang Province, Zhejiang A&F University, Hangzhou 311300, China
*
Author to whom correspondence should be addressed.
Forests 2021, 12(9), 1288; https://doi.org/10.3390/f12091288
Submission received: 17 August 2021
/
Revised: 16 September 2021
/
Accepted: 16 September 2021
/
Published: 19 September 2021
(This article belongs to the Special Issue Advances in Decision Support for Forest Management and Policy Formulation)
Abstract
:The straits of ecological development in the forestry industry and the problems existing in the industrial forestry system are currently the main focus of policy-making research in China, to alleviate the contradiction between forestry economic development and the ecological environment, as well as evaluate the level and trend of the ecological development in China’s forestry industry. This paper analyzed the status of ecological development in China’s forestry industry via public data, constructed a novel evaluation index system for forestry industrial ecological development, and proposed a hybrid ensemble approach combined with principal component analysis, entropy weights, and fuzzy-DEMATEL to synthetically evaluate the ecological development level and system coordination of the forestry industry in each province of China. The experimental results show that technological innovation ability is the most significant restriction for the ecological development of China’s forestry industry. Obvious regional differences in the promotion degree of ecological development and the coordination of various elements throughout the country has also been confirmed. Findings of our research could be used for promoting the green transformation and upgrading of the forestry industry, and providing targeted practical countermeasures according to local conditions for governments at all levels.
1. Introduction
Forestry is the industry of tending, managing, protecting, and utilizing forests, and provides products and services for society. It exploits the forest ecosystem, including forest, wetland, and sand resources, to obtain ecological, economic, and social benefits. The reciprocal effect between the forestry economy and the environment is becoming increasingly more complex, which not only leads to the problems of the low development and utilization of forest resources, extensive development, and insufficient scientific and technological innovation but also causes contradictions of dislocations in forestry industry development, a weak ecological correlation between forestry industries, and the unreasonable allocation structure of ecological elements. The forestry industry is a complex system with multiple inputs and industry types. It also has certain essential characteristics (such as integrity, relevance, and hierarchy) and similar development laws within the ecosystem. Thus, the transformation to ecological development of forestry industry is an important breakthrough to realize the coordinated development of economic development and ecological environment.
The concept of industrial ecology (IE) was first proposed by Ayres in 1989 [1], together with the notions of “industrial ecology” and the “industrial ecosystem” [2]. Graedel et al. (1993) argued that industrial ecology should explore the coordinated development of enterprises and the environment in the industrial ecosystem based on the similarities between enterprise organizations and biological organizations [3]. Hawken et al. (1999) considered the industrial ecosystem as artificial and closely connected with the natural ecosystem from a system perspective, while industrial ecology is a management tool that integrates the infrastructure of the industrial system [4]. Erkman (1997) believed that the interaction between industrial systems and the biosphere studied by industrial ecology could promote the coordinated operation of industrial systems and natural systems [5]. Lowenthal (1998) pointed out that applying the principles of natural ecology in industrial research can improve people’s understanding of industrial systems [6]. Since the 1990s, developed countries have gradually formed a relatively complete industrial ecological market mechanism, and the research field has expanded from theoretical research of concepts and technology to applied research on the economy, systems, and management [7].
As for the definition of industrial ecological development, the existing research can be divided into the narrow sense and the broad sense. In the narrow sense, industrial ecology is regarded as a means by which human beings reduce the consumption of resources and energy by imitating the material and energy recycling of the natural ecosystem [8], thus bringing industrial activities into the total exchange of the ecosystem and realizing the harmonious development of the economy and nature [9]. In the broad sense, the concept of industrial ecology refers to improving the utilization efficiency of limited resources, reducing waste, eliminating environmental damage, and ultimately achieving sustainable economic and ecological development [10]. It is an advanced form of industrial development that can realize the coordination of industry and nature, the orderly evolution of ecological elements of the industrial system, and the coordinated development of the whole industrial system and society [11].
Scholars have explored the theory and practice of industrial ecological development at different scales. Macroscopically, they have focused on the ecological impact of the industrial system and ecological policy incentives, such as efficiency evaluations of the industrial ecosystem [12,13,14], and the coordinated development of regional industrial ecology [15,16]. At the mesolevel, they have studied the construction and operation of eco-industrial parks [17,18,19]. These studies approached the mutual utilization and recycling of waste in the system via the concept of the circular economy, exploring the interaction modes and mechanisms among internal enterprises. From a microscopic view, they have considered the ecological development model, management systems, production technology transformations, and cleaner production processes [20,21,22,23]. This kind of research is mainly carried out via the concepts of industrial metabolism and circular economy. The methods mainly include cost–benefit analyses, material flow analyses [24], energy analyses [19], life cycle assessments, and ecological footprint assessments.
Existing studies on industrial ecological development are usually only carried out from a specific industrial perspective and are limited to the technical and management levels. They have ignored the adjustments, and upgrades were undertaken in the industry to ease the resource and environmental crisis, which is also a way to achieve ecological development. At the same time, the traditional forestry industry is often regarded as a green industry due to its forest cultivation activities, making research on ecological development of the forestry industry has received little attention. What is more, qualitative research based on questionnaire survey showed that forestry enterprises even think that ecological environment was not the key factor affecting the long-term development of forestry industry [25]. However, the modern forestry industry is dominated by the manufacturing of forest products, and the production process will damage resources, environment, and human health. The sustainable development of forestry industry should concern the capacity of ecological environment and resource. Some scholars studied the coupling mechanism and coordination degree of forest ecosystem and forest ecological security to acquire economic benefits of the forestry industry from the meso- and macrolevels [26,27]. What is different from the traditional and existing research, which mainly focuses on maximization of economic benefits from the forestry industry, the perspective of our study contains economy, society, and ecology under the background of green transformation and upgrading of the forestry industry.
In the past few decades, magnanimous multi-criteria decision-making (MCDM) methods and models have been developed and applied to the issue of industrial development level evaluation, including analytic hierarchy process (AHP) [28,29,30], technique for order preference by similarity to an ideal solution (TOPSIS) [31,32,33]], VlseKriterijumskaOptimizacija I KompromisnoResenje (VIKOR) [34,35], complex proportional assessment (COPRAS) [36,37] (Harish and Nancy, 2019; Arabameri et al., 2019), preference ranking organization method for enrichment evaluations (PROMETHEE) [38,39], entropy theory [40,41], best–worst method (BWM) [42,43], and their combination and fuzzification method [44,45,46,47,48]. From the literature review, it can be stated that the topics of applying MCDM models to industrial development-level evaluation have been given increasing attention in recent years.
The essence of industrial ecological development is the coordinated development of ecology, economy, and society, and we need to construct amulti-dimensional index system to comprehensively evaluate the role of the three elements. Therefore, it has crucial meaning to set scientific weights for indicators of different dimensions with appropriate methods. In this paper, we proposed a hybrid ensemble approach that combined principal component analysis, entropy weights, and fuzzy-DEMATEL to evaluate the ecological development level of the forestry industry in China.
The entropy weight method is an objective method in information theory for weighting, and its core theory is that the entropy calculated by index data can fully reflect the inherent law of the data and the amount of information, and the amount of information is regarded as the sole standard for judging the weight. Therefore, the effectiveness of weights depends on the information acquired from the data. Thus, this makes this method have a strong objectivity and is able to eliminate the influence of subjective factors [49,50].
As a subjective weighting method, DEMATEL has the advantages of strong intuition, wide application, reliability, and large data capacity. Simultaneously, entropy weight method is an objective weighting method, which has high-precision, is adaptable and objective, and provides better explanation of the results. The combination of subjective and objective weighting method can not only fully reflect the decision-makers’ subjective cognition of different indicators, but also objectively deal with the known information. The integration of subjective and objective weighting method can not only fully reflect the decision-makers’ subjective cognition of different indicators, but also objectively deal with the known information. The DEMATEL technique visualizes the structure of complicated causal relationships, which can help decision-makers to more easily understand the interdependence of criteria through matrixes or diagraphs. In the DEMATEL technique, decision-makers are required to specify the relative importance and influence of each criterion, which is challenging for most government officials of forestry sector in China. Therefore, to address the vagueness, uncertainty, and information leakage, in our study, the fuzzy set theory is incorporated into the DEMATEL technique in a hybrid approach to obtain subjective weights, thus making it more suitable for high dimensional forestry decision data. To our best knowledge, it is the first time that this kind of framework has been applied to the development level evaluation for the forestry industry in China.
To alleviate the contradiction between forestry economic development and the ecological environment, as well as evaluate the level and trend of the ecological development in China’s forestry industry is becoming more and more crucial. Therefore, the motivation of this study was to evaluate the ecological development status of China’s forestry industry scientifically and reliably, promote the green transformation and upgrading of China’s forestry industry following an ecological and economic way, and provide targeted and realistic countermeasures for governments at all levels to adjust measures to local conditions.
In pursuing the above objective, the highlights of this paper are as followed. First, we constructed a comprehensive evaluation index system for industrial ecological development of forestry industry in China, which contains twenty-five indictors in four dimensions. Second, we proposed a hybrid ensemble approach with subjective and objective weighting method to estimate the ecological development level of the forestry industry in specific regions. Third, we evaluated the temporal and spatial pattern characteristics of China’s forestry ecological development level and coordination degree.
This paper is structured as follows. Section 2 outlines the materials and methods we used in this study, explaining the proposed hybrid ensemble evaluation approach in detail. In Section 3 and Section 4, by using a case study, the experimental results and discussions are elaborated. Finally, Section 5 is devoted to the conclusions and future recommendations.
2. Materials and Methods
2.1. Framework
The concept of industrial ecological development needs to be understood from the two perspectives of ecology and the economy. From the ecological point of view, the construction of an ecological model of the forestry industry must address the contradiction between the scarcity of forestry resources and stable economic growth. By establishing a sustainable industrial system, which is harmonious, resource-efficient, cyclic, and environmentally friendly, we can achieve coordinated development between the forestry enterprise and the environment. Thus, the comprehensive benefits of forestry development can be maximized on the basis of minimizing the consumption of forestry resources. Industrial ecological development must be approached at the micro- and macrolevels: (1) Enterprises must aim at minimizing damage to the ecological environment and maximizing the multilevel recycle utilization of waste by taking the principles and technologies of the circular economy as guidance to solve the problem of the low efficiency of resource utilization from the technical perspective. Enterprises must actively promote management innovation, complete process reengineering, reduce resource waste, and improve resource utilization efficiency. (2) A vertically and horizontally integrated industrial chain can optimize the allocation of resources among different enterprises and set up an efficient forestry ecological–industrial chain. Industrial chain integration should improve the competitiveness of products in the market and reduce resource consumption and pollutant emissions. From the perspective of economics, the realization of economic development in forestry should also aspire to full coordination between the internal factors of the industry, including the industrial structure, industrial organization, industrial production mode, and industrial technology.
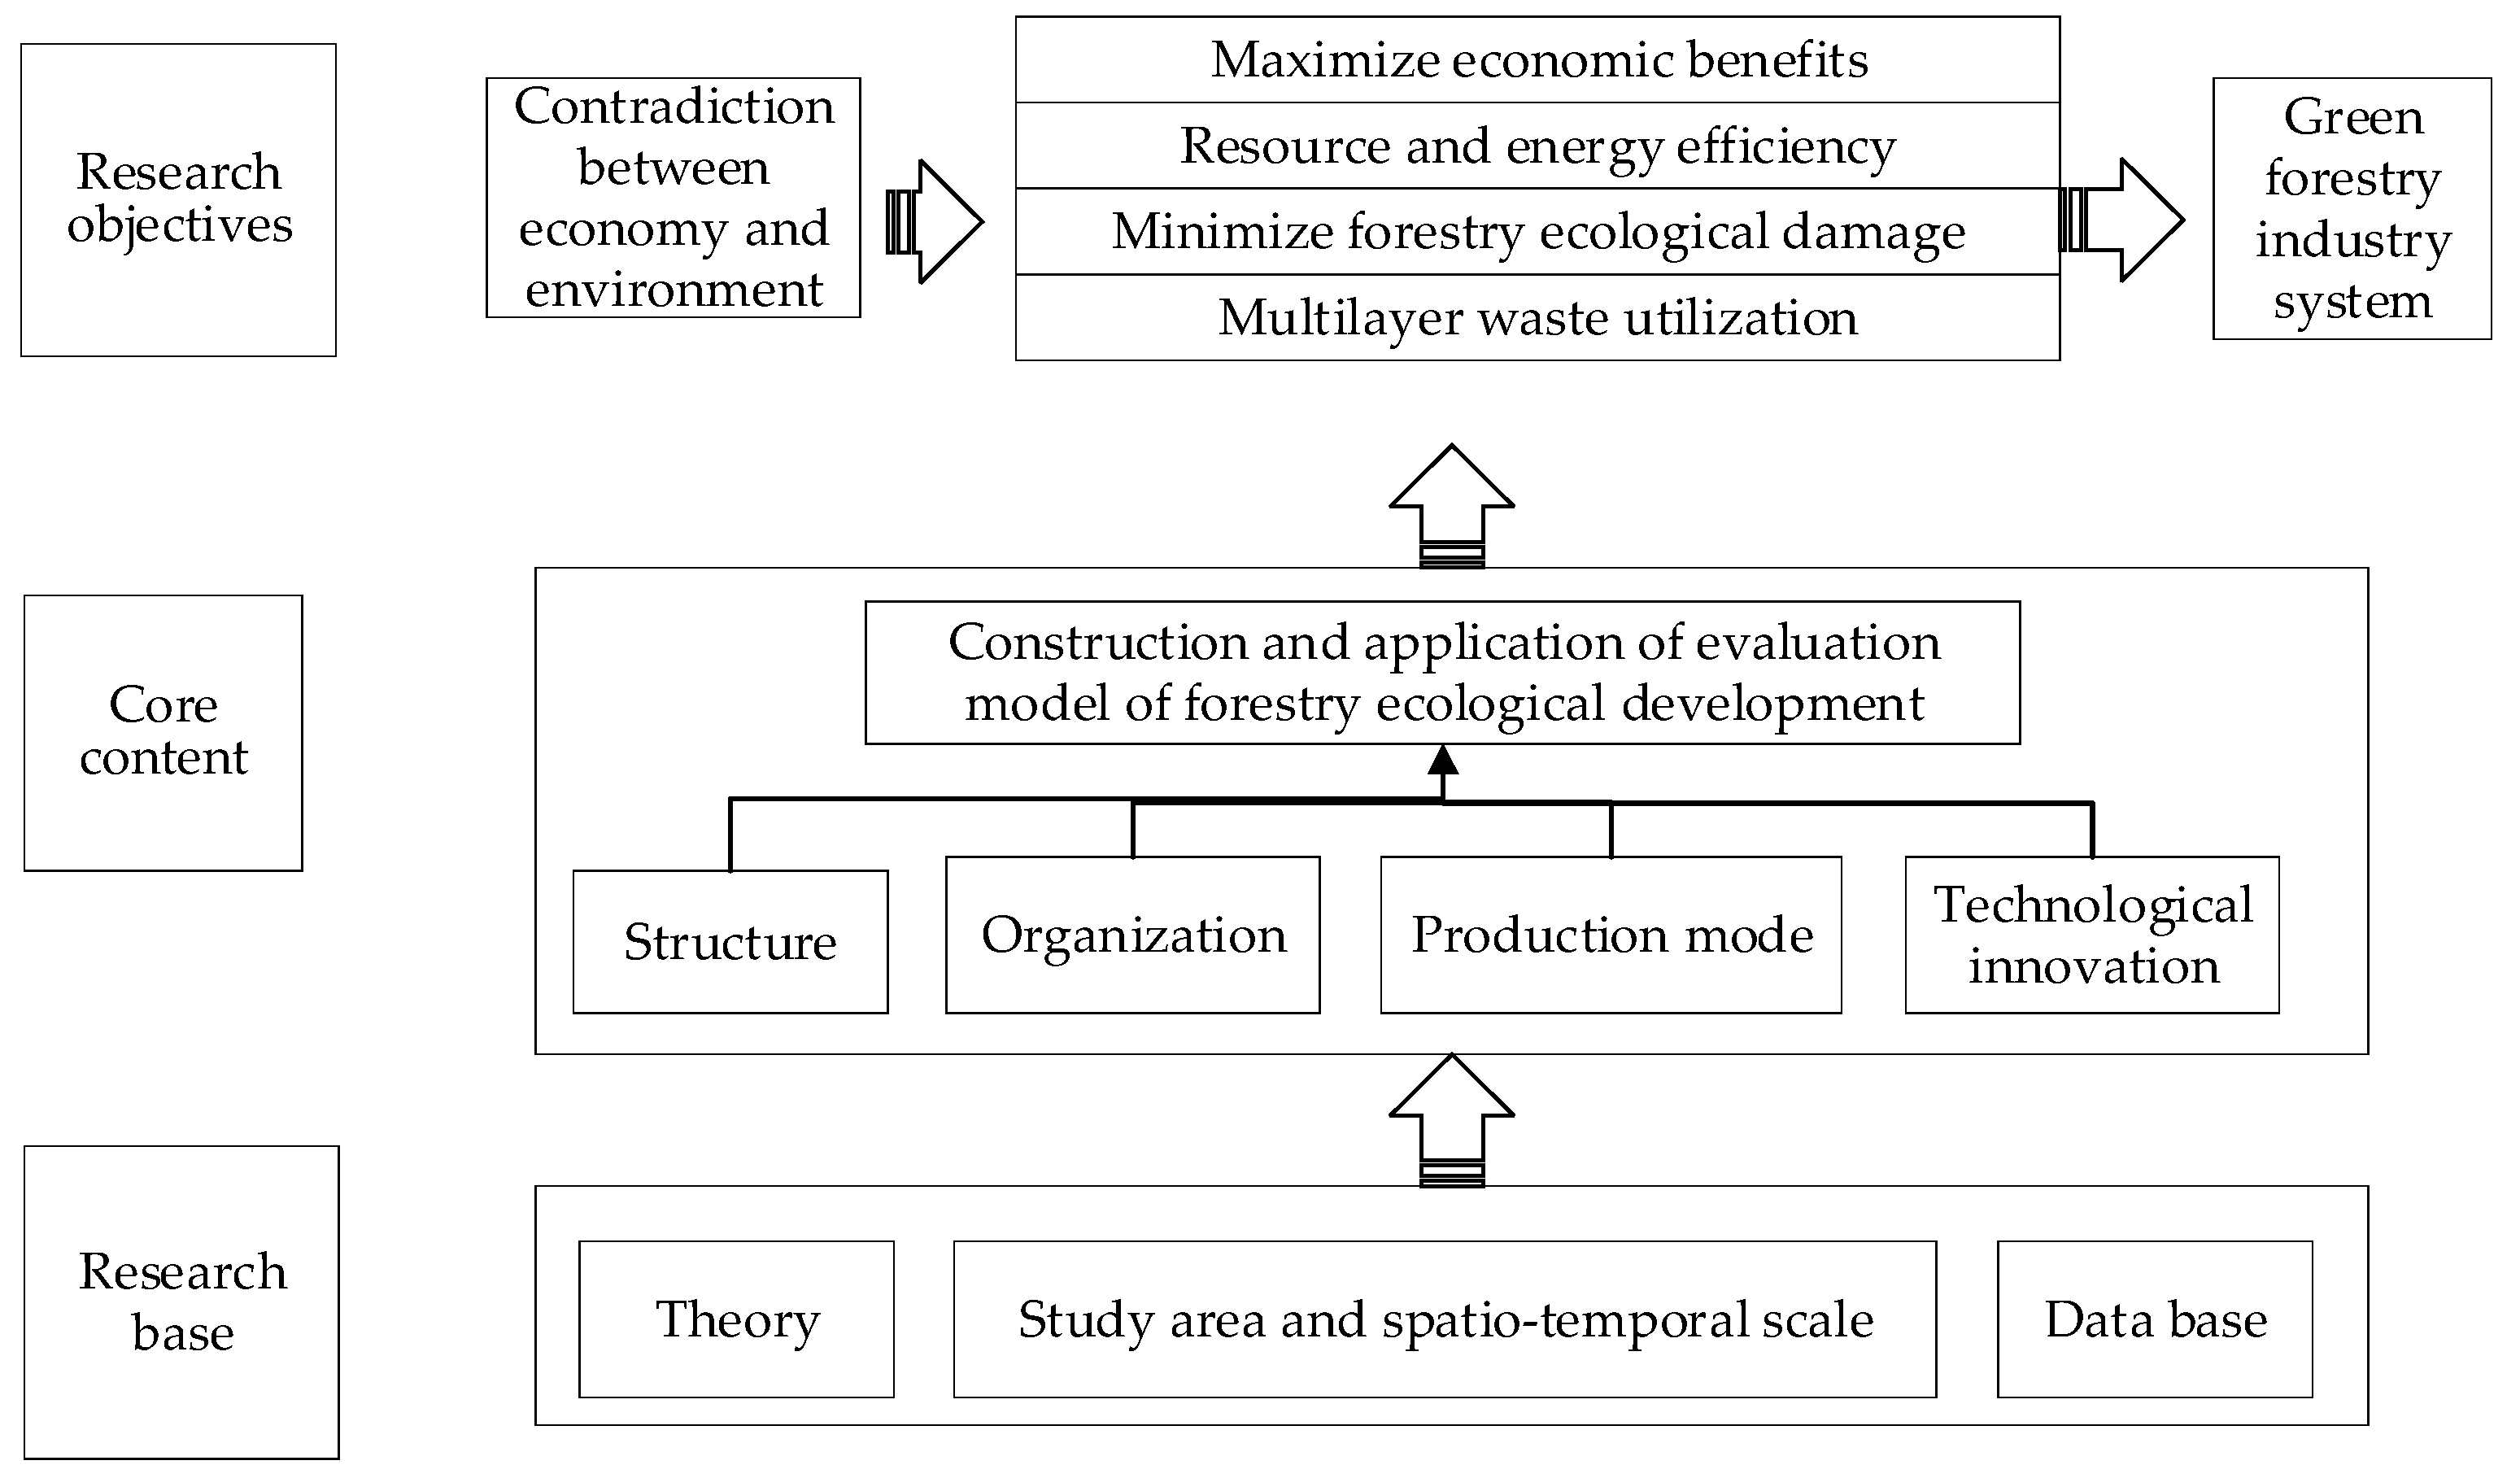
Broadly speaking, forestry ecological development refers to the operation and management of the forestry industry system according to ecological principles and economic laws that are associated with the relationship between the forestry industry and the natural environment. In this context, the ultimate goal of forestry ecological development is to establish a circular forestry economy and realize sustainable development through the cleaner production of forestry enterprises. This study focused on the narrow meaning of forestry ecological development. Specifically, it included the ecology of the forestry industrial structure, forestry industrial organization, the forestry industrial production mode, and the ecology of forestry industrial technological innovation. Forestry ecological development is a process of forming a system between the forestry industry and the environment to maximize the economic benefits of the forestry industry and ensure the high efficiency of resource and energy use, while also minimizing ecological damage and realizing the multilayer utilization of waste through the reasonable optimization of each component in the forestry industry (see Figure 1).
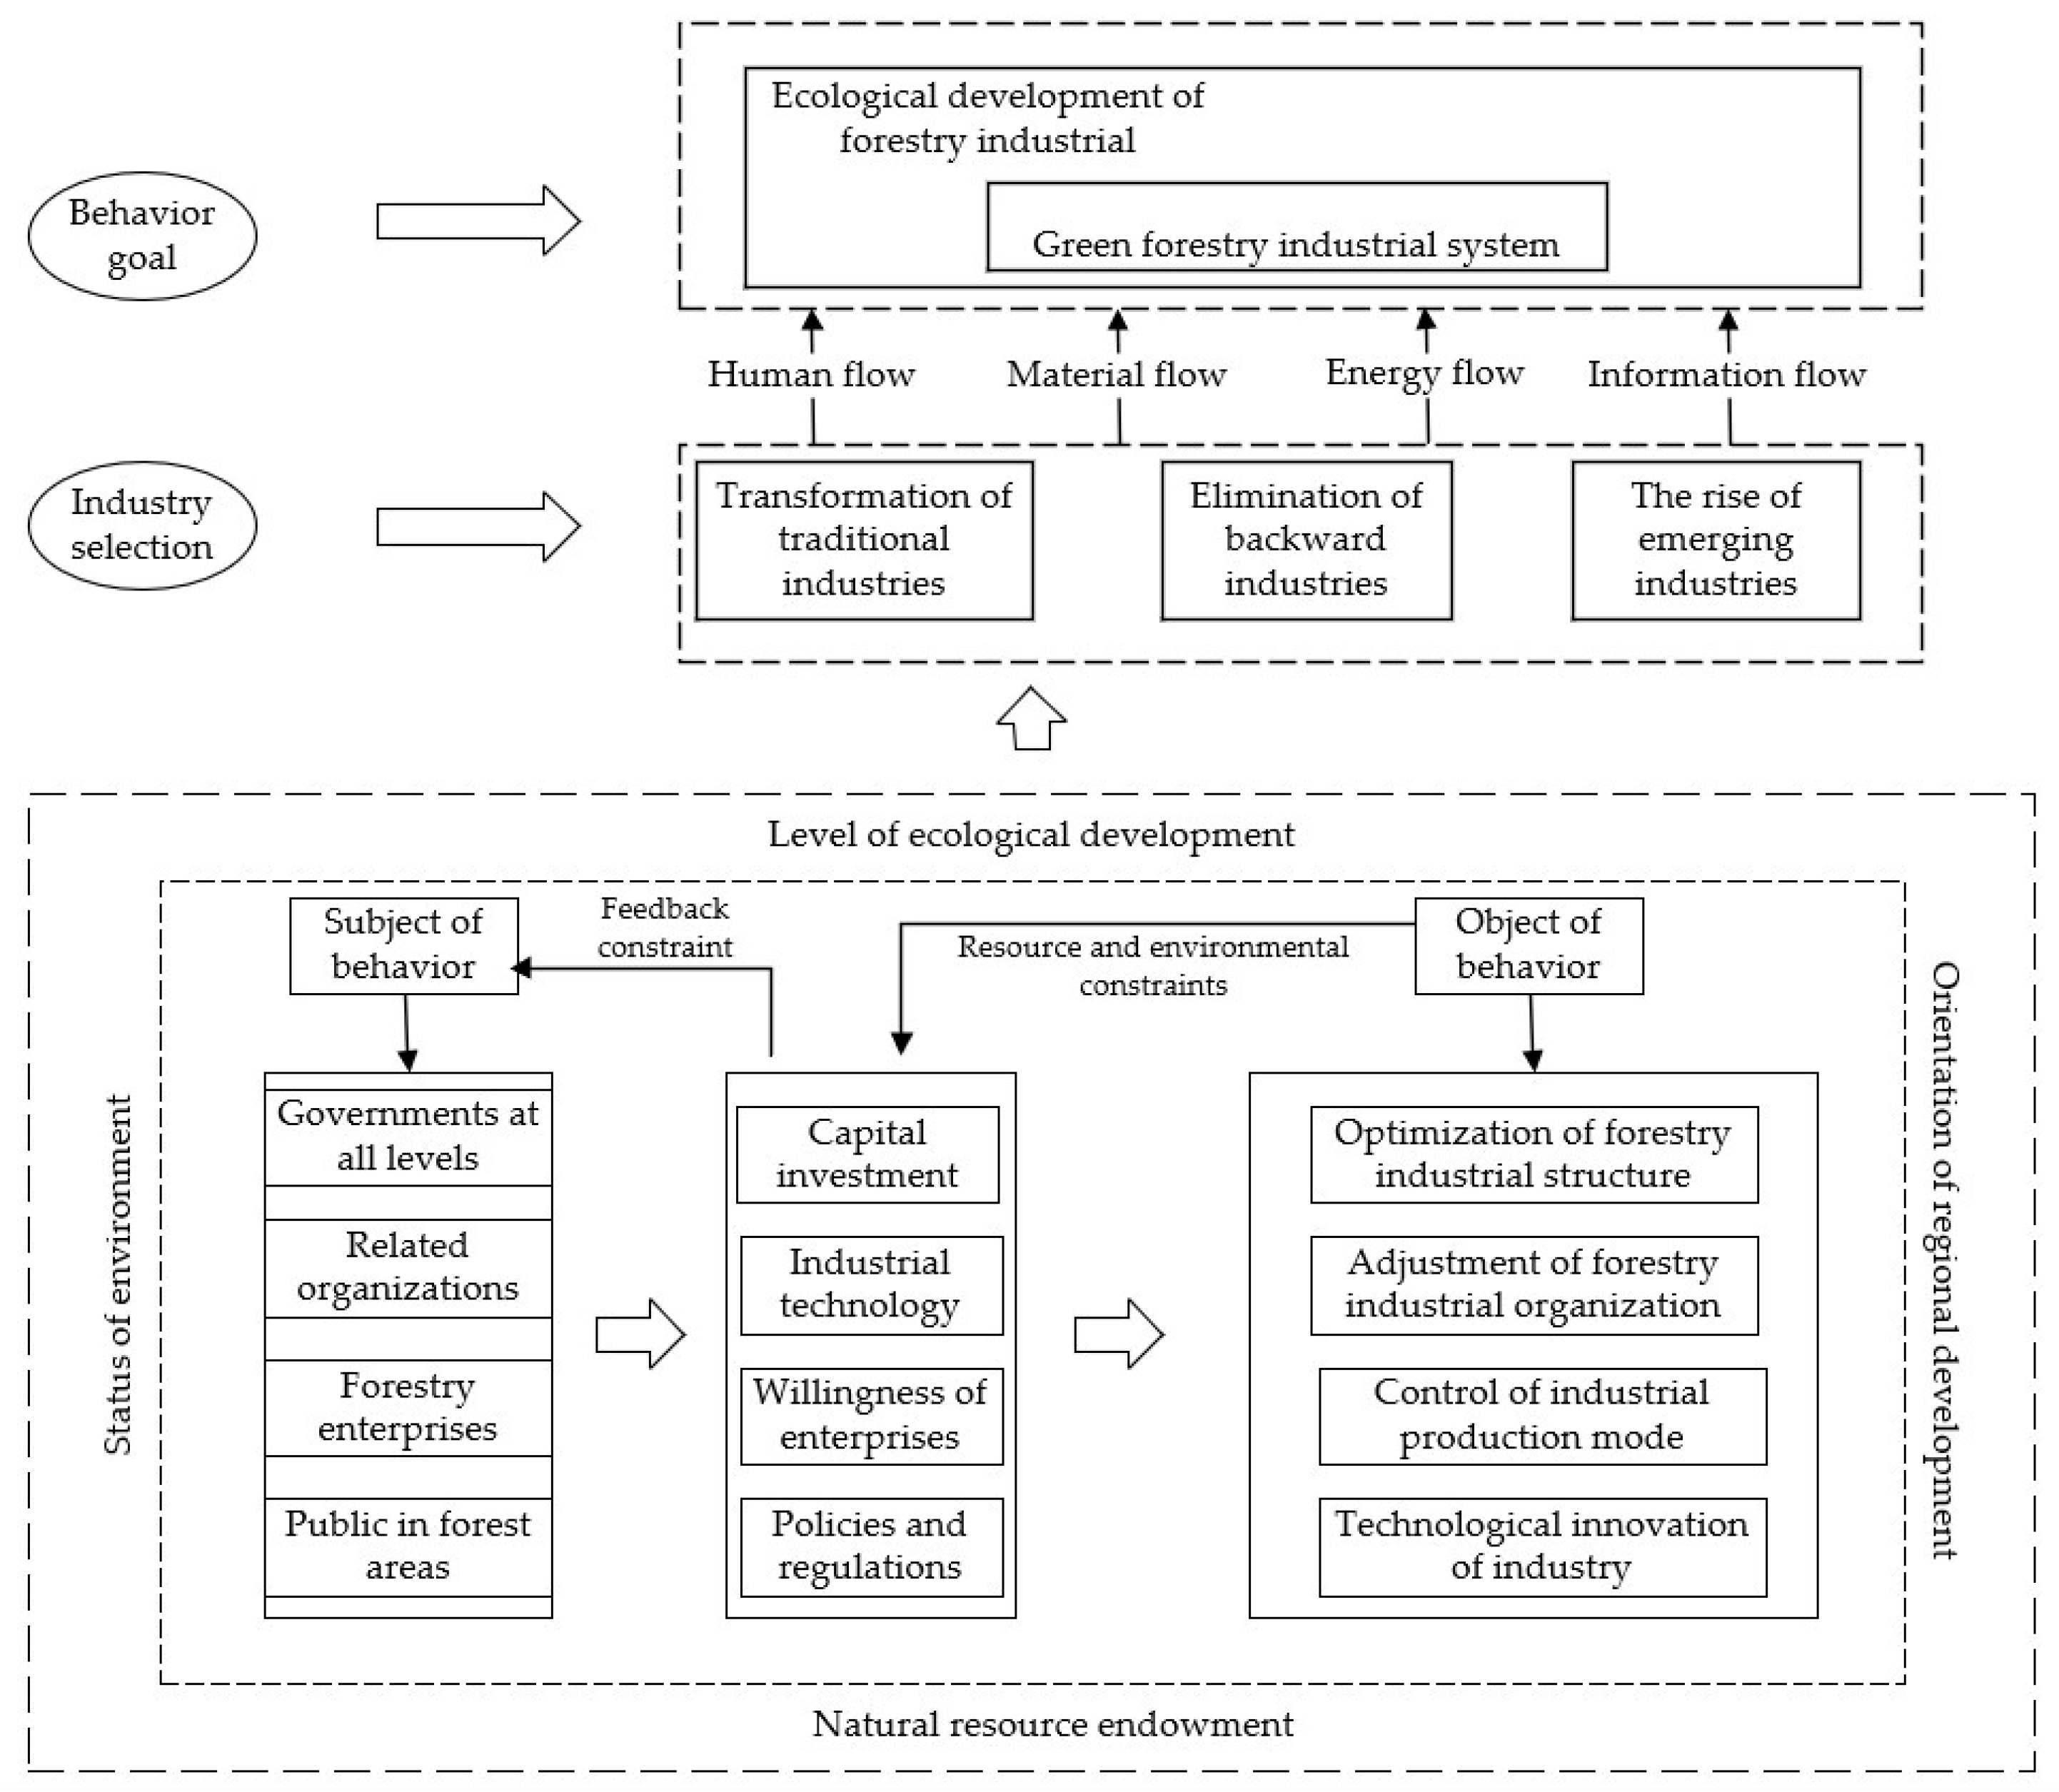
Under this framework, this study constructed a theoretical model (see Figure 2) to evaluate the ecological development level of the forestry industry according to the principles of ecology and economics. The model took the relationship between the forestry industry and the environment as the research focus and acted on the behavior object (structure, organization, production mode, and technology) through the behavior subject (government and relevant organizations, forestry enterprises, and forest public) using the ecological behavior mode (capital investment, policy implementation, participation of enterprise, and technological upgrading) to achieve the behavioral goal (green forestry industrial system).
2.2. Datasets Preparation
Due to the severe lack of relevant statistical data for Hong Kong, Macao, and Taiwan, this study used thirty provinces (including autonomous regions and municipalities directly under the Central Government) as the assessment unit. In China’s county-level forestry statistical work, the low quality and excessive mobility of staff, the deficiency of management systems in relevant departments, and the lack of supporting hardware and software facilities [51] lead to low-quality and even unusable data [52]. Based on a provincial-level ecological development evaluation, this study could not only reflect the differences in regional conditions, technical bases, production factors, and so on, but it could also avoid the problem of inaccessible data when taking the county as the study unit. The provincial focus of this study reflected the hierarchy and enhanced the feasibility of evaluation.
The period of this study was from 2009 to 2018, and the data came from the “China Forestry Statistical Yearbook,” the “China City Statistical Yearbook,” the “China Energy Statistical Yearbook,” the “China Forestry Yearbook,” and the statistical yearbooks of various cities. The forest-related indicators came from the “China Forestry Statistical Yearbook.” Indicators not included in the “China Forestry Statistical Yearbook” were supplemented by other yearbooks, and the missing data were inferred using trend line analysis.
2.3. Variables’ Descriptions
This study applied the Delphi method for expert consultations, which involved inviting eight forestry experts to form an advisory group consisting of four university professors, two experts in the field, and two senior managers of forestry enterprises. In order to objectively reflect the current state and the essence of ecological development, the expert group selected twenty-five key evaluation indicators containing four subsystems based on the current forestry development reality after several rounds of discussions, combined with assessments of forestry industrial goals, contents, and motives. The variables of the evaluation model are shown in Table 1 below.
- Ecological development level of the forestry industry’s structure
The ecological development of the industrial structure involves rationalization, upgrading, and agglomeration [53].
① The specific contribution to the GDP of different industrial levels was used to measure the trend in the development of the structure of the forestry industry. The structural improvement of the forestry industry was reflected in the ratio of the comparative labor productivity of the primary forestry industry to the sum of the comparative labor productivity of the secondary and tertiary industries. Comparative labor productivity is equal to the proportion of the output value of an industrial sector divided by the proportion of the labor force employed in said industrial sector. It reflected the proportion of the output value produced by 1% of the labor force in the industrial sector to the total national output. The calculation formula for comparative labor productivity is as follows:
In Formula (1) [54], Qij is the comparative labor productivity of the three forestry industries, lij is the number of employees in the three forestry industries, li is the total number of employees in the forestry industry, eij is the output value of the three forestry industries in each year, and ei is the total forestry output value in each year.
② The proportion of the total output value of the forest product processing industry in the total forestry output value was used to characterize improvement in industrial structure.
③ The location entropy of each forestry industry was assessed to evaluate the degree of forestry industry agglomeration. The calculation formula of location entropy is as follows:
In Formula (2), Qij is the total output value of industry j in region i, Qi is the total output value of industry i, Qkj is the total output value of industry j in the country, and Qk is the total output value of the country.
According to the proportions of the total output values of the 16 forestry sub-categories of China’s forestry industry in the total forestry output value, the planting and collecting of economic forest products; wood processing; and the manufacturing of wood, bamboo, rattan, palm, and reed products are the most advantageous industries in Chinese forestry. Therefore, these industries were used as objects to calculate the degree of agglomeration of major industries.
- 2.
- Ecological development level of the forestry industry’s organization
Understanding the ecological development of an industrial organization involves analyzing the corporate behavior and economic performance within each forest-related industry sub-category. By integrating the value and ecological chains, a value–ecological network is formed for the entire industry, where this improves the economic and ecological benefits. It was measured via the intensity of the utilization of forest land, the level of senior personnel, the degree of high-tech organization, the high-service capacity, and the agglomeration degree of factors (labor and capital). ① The intensive utilization of forest land was evaluated using the ratio of forestry industry output value per unit of forest land area [55]. ② The senior personnel level was estimated using the technical experience of forestry practitioners, which was measured via the proportion of professional and technical personnel in forestry research institutions from each region. ③ The level of high-tech organization was measured using the economic contribution rates of emerging forestry industries. Emerging forestry industries usually include the bamboo industry, the under-forest economy industry, the flower industry, the eco-tourism industry, the biomass energy industry, the camellia spice industry, and the wildlife reproduction and utilization industry. However, given the availability of data, the emerging forestry industries included here were limited to the understory economy industry, the flower industry, the ecotourism industry, the biomass energy industry, the camellia oleifera flavor industry, and the wildlife reproduction and utilization industry. In the calculation of the contribution rate, the forestry product price index was used to deflate the output value, and the factors influencing price changes were removed to obtain the output value, expressed in comparable prices. Based on year 2008, the price growth rate in subsequent years compared with 2008 is calculated, then we divide the total output value of each year after 2008 by the price growth rate to obtain the output value after adjustment. ④ The GDP contributions of the tertiary industry and the forestry technical service industry output values were used to reflect the high-service level of the forestry industry. ⑤ The number of forestry practitioners per unit of forest land area was selected to measure the degree of labor concentration, and the fixed asset investment per unit area of forest land was selected to measure the degree of capital agglomeration.
- 3.
- Ecological development level of the forestry industry’s production methods
The ecological production mode is a pattern of production that enables forestry enterprises to achieve sustainable development based on the principle of a circular economy. This pattern depends on internal relations, reproduction links, and the environment, and is characterized by low consumption, low emissions, high recycling rates, and high degrees of utilization. The comprehensive energy consumption of forestry and the water withdrawal that was associated with the forestry output value per ten thousand yuan were selected as indicators to reflect the utilization efficiency of energy resources [56]. Given the data availability, the forestry industry here included wood, bamboo, rattan, palm, and grass manufacturing and processing; furniture manufacturing; and the paper products industry. The emission rate of the “three wastes” of forestry output per 10,000 yuan was used to reflect the intensity of pollution.
- 4.
- Ecological development level of the forestry industry’s technology
The ecological development of industrial technology is a result of the production mode and is crucial for promoting the modernization, informatization, and rapidity of forestry development. Forestry technology is closely related to the long-term development of the forestry industry and the implementation of environmental policies. The utilization rate of industrial solid waste was used to measure the proportion of the total waste pollutants that enter the production cycle again. At the same time, the proportion of scientific research personnel out of all forestry employees, the number of scientific and technological achievements, the density of scientific research institutions, the per capita forestry science and technology expenditures, and other scientific and technological input indicators or input conversion indicators reflected the degree of ecological development in technological innovation.
2.4. The Hybrid Ensemble Evaluation Approach
2.4.1. Indicator Dimensions’ Reduction
The purpose of the principal component analysis (PCA) method is to reduce the dimensions of the indicators and to describe most of the information contained in the original variables through the linear combination of a small number of independent variables to avoid the dimensionality caused by a large number of and correlations between indicators. Another useful method considers entropy, which is a physical concept that is found in thermodynamics and is used to measure system uncertainty and to assign weights to evaluation indicators according to the degree of dispersion. The combination of these two methods can provide a more scientific evaluation of the indicators. The specific steps are as follows.
The first step is the normalization of the principal component factors xij. The formula for data normalization is selected according to the difference between the positive and negative values of the principal component factor.
The second step is to calculate the principal component score and the proportion of the area i to the principal component j.
The third step is to calculate the entropy E of the principal component factor j.
The fourth step is to calculate the utility value D of the principal component factor j.
The fifth step is to calculate the weight W of the principal component factor j.
2.4.2. Key Factor Identification
The DEMATEL (decision-making trial and evaluation laboratory) method is a practical and effective subjective weighting method that is used to identify influencing factors [57]. The traditional DEMATEL method generally measures the relationship between various factors based on specific values via expert scoring. However, the complex relationship between various factors is fuzzy and the evaluative information provided by experts is also semantic and fuzzy [58]. Therefore, this study utilized the concept of triangular fuzzy numbers to improve the accuracy of the analysis results of the DEMATEL method in an uncertain environment. Triangular fuzzy number is an extension of fuzzy number, which can more appropriately describe ambiguous quantities. Triangular fuzzy set describes the fuzziness of objective things in more detail from the three aspects of membership, non-membership and hesitation. Therefore, it is more flexible and practical in dealing with uncertain problems. Using this method can effectively improve the objectivity and effectiveness of research results in uncertain environment [59]. The steps were as follows:
First, we constructed a system of influencing factors, set as F1, F2, …, Fn.
Second, we defined the relationship between the factors through the expert scoring method and expressed it in the form of a matrix. Here, each expert used the language operators “no influence (N),” “very weak influence (VW),” “weak influence (W),” “strong influence (S),” and “very strong influence (VS)” to estimate the degree of influence among the factors (Table 2). Then, our original results were transformed into a triangular fuzzy number through the semantic conversion table method.
Third, we used an ambiguity resolution algorithm, namely, converting the fuzzy data into crisp scores (CFCS) [60], for solving the triangular fuzzy matrix, and finally, we determined the direct influence matrix for the factors. The specific calculation process was as follows (setting the trigonometric function value as (r, m, l)).
Step 1. Normalize the triangular fuzzy numbers:
Step 2. Standardize the right and left values separately:
Step 3. Calculate the clarity values after deblurring the score from each expert:
Step 4. Calculate the average clarity value:
Step 5. Normalize the direct influence matrix Z to get the normalized direct impact matrix X:
Step 6. Obtain the influence degrees fi, affected degrees ei, center degrees mi, and cause degrees ni of each factor using the formula to calculate the comprehensive impact matrix T:
Step 7. Establish the Cartesian coordinate system using the center degree and cause degree of the factors. We marked the position of each factor on the coordinate system, analyzing the importance of each factor and the mutually influencing relationships between the factors.
Step 8. Determine the index weights using the values calculated above:
2.4.3. Determine the Combined Weight
In the case of uncertain decision information, determining the weight of each factor must consider both the subjective information held by the decision-maker and the objective information of the indicator data. Therefore, the principal component entropy method was coupled with the DEMATEL method to determine the combined weight, as follows:
The combined weight and the standardized principal component factors were combined to obtain the comprehensive evaluation value of each factor and area:
2.5. Calculation Model of the System Coordination Degree
The coordination degree is an index that is used to quantitatively measure the coordination between systems or elements [61]. This study adopted the coordination degree model of minimizing the dispersion coefficient to further determine the coordination between the indexes that were used to evaluate the industrial ecological development level [62]. The specific derivation process is as follows.
We first assumed that the positive numbers x1, x2, …,xm were indicators of environmental characteristics, and the positive numbers y1, y2, …,yn were indicators of economic characteristics. Then, the comprehensive environmental benefit functions (or comprehensive environmental evaluation functions) and the comprehensive economic benefit function (or comprehensive economic evaluation function) were obtained.
where ai and bj are undetermined weights or policy coefficients that reflect the importance of the selected indicators in the synthetic evaluation. The value of is as follows:
where λmax is the planned value, comparison standard value, the expected value or ideal value corresponding to the index xi, and the value of can be inferred by analogy.
Second, we utilized the dispersion coefficient and the standard deviation of the development level of each subsystem in period t.
Finally, we derived the followed equation:
where Ct is the degree of coordination defined by the model, Cm is the dispersion coefficient of the m-th subsystem, and k is the adjustment coefficient:
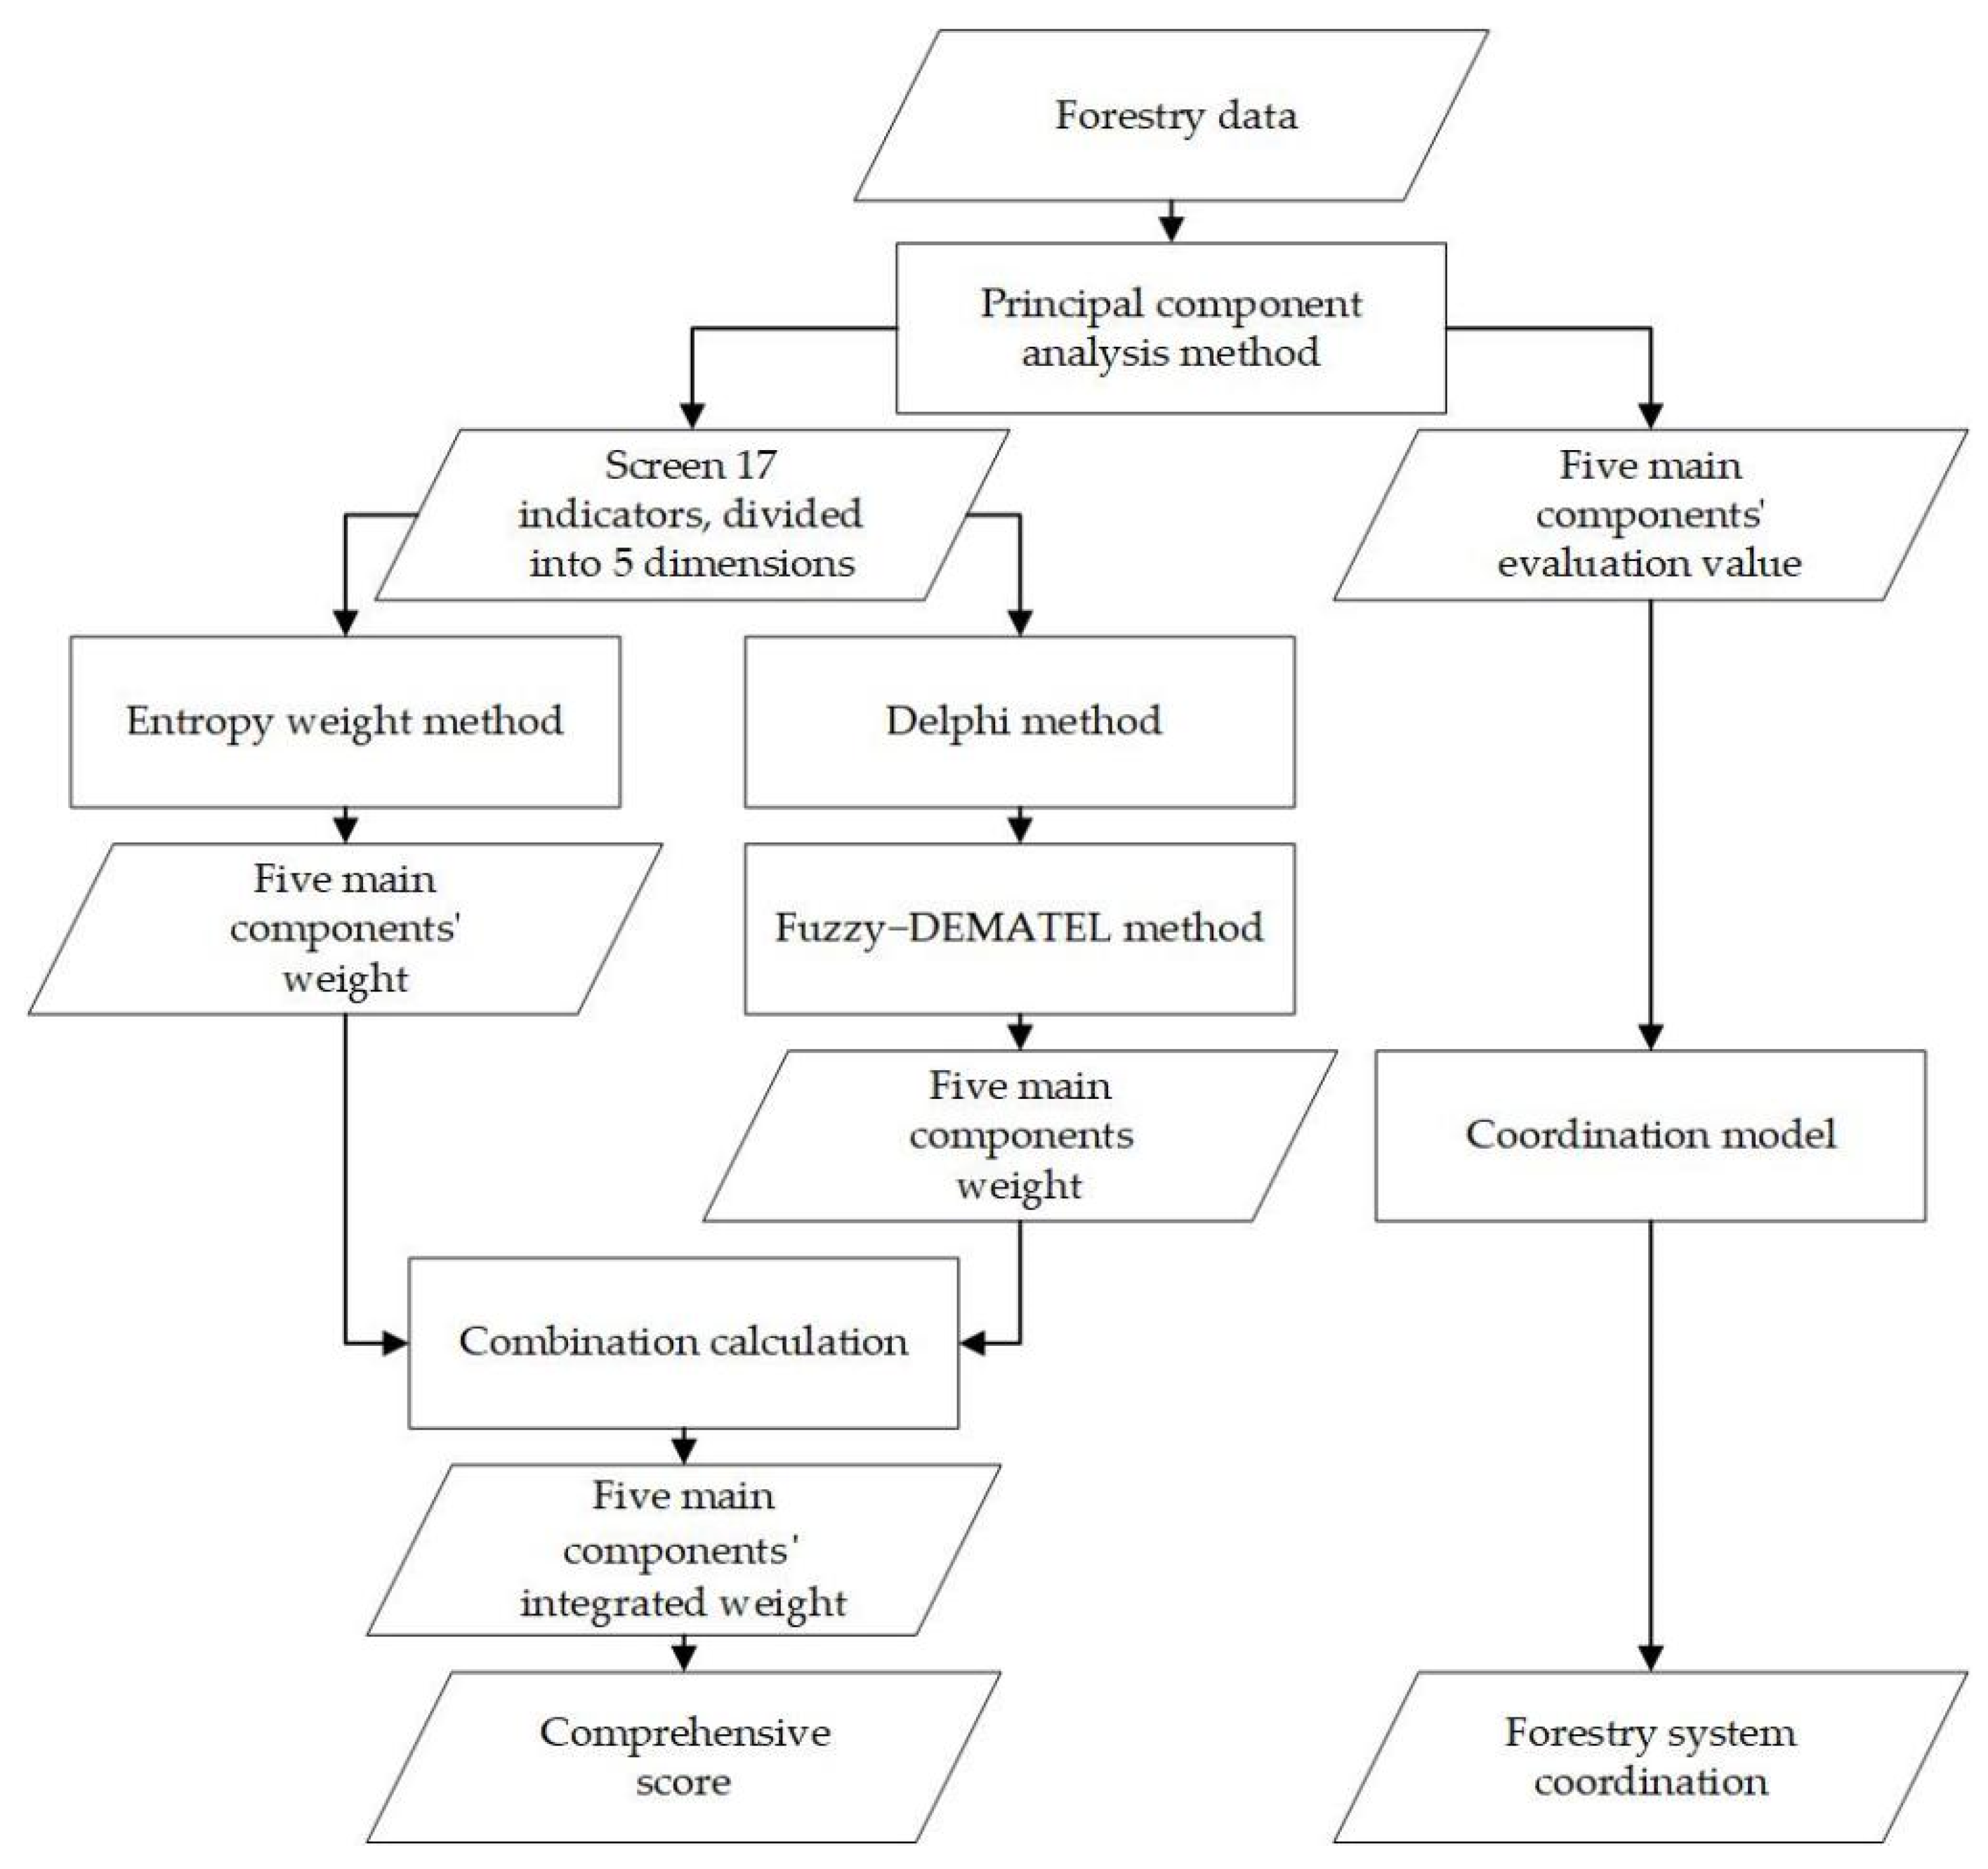
Figure 3 displays the flowchart of the proposed hybrid ensemble evaluation approach.
The implementation process of the approach proposed in this paper is as follows:
The first step was to collect and organize the forestry data of China’s provinces. Seventeen indicators are screened by the main component analysis and divided into five main components, including the primary and secondary industrial structure and agglomeration level, resource consumption and pollution emission level, intensive utilization of forest land level, technological innovation level, and tertiary industry structure and agglomeration level.
In the second step, the weight of five main components is calculated using entropy weight method. The main component score is normalized by Equations (3) and (4). The specific gravity value of each main component in the system is obtained by Equation (5). The entropy value of the primary component factor is calculated by Equation (6). The utility value of each indicator is computed by Equation (7). Thus, five main components are obtained by Equation (8).
In the third step, according to the score of the main component, Equation (32) is derived from Equations (27)–(31) through the coordination model, and the forestry system coordination of each province and city is calculated by Equation (32).
In the fourth step, we used the Delphi method to attain the score of new five indicators based on first step, and utilize the fuzzy-DEMATEL method to obtain new five main components. After using Equation (12), the triangular fuzzy number is normalized, and the direct influence matrix is obtained by Equations (13)–(18). The value of influence and the affect degree is calculated by Equations (19)–(22). Then, the weight values of each main component are calculated by Equation (23).
In the fifth step, we calculated the comprehensive score of the forestry system. Two weight values obtained from the second step and the fourth step were used to compute the integrated weight value by Equation (24). Combine the integrated weight value and the five main components score from the fourth step by Equation (25) to obtain the score of each factor, and then the comprehensive scores of forest systems in various regional are calculated by Equation (26).
3. Results
3.1. Evaluation of the Ecological Development Level of the Forestry Industry
This study employed SPSS19.0 to calculate the correlation coefficient matrix of the data. The indexes with correlation coefficients greater than 0.7 were excluded, namely, the structural improvement of the forestry industry, economic contribution rate of emerging forestry industries, technology-intensive index, proportion of professional technical service output value, degree of aggregation in the main forestry industry, industrial solid waste emissions of forestry output per thousand yuan, number of forestry scientific and technological achievements, and per capita investment in forestry science and technology.
The results of the principal component extraction are shown in Table 3. The eigenvalues of the first five components were all greater than 1, and their cumulative contribution rate was 81.236%, indicating that the overall explanation rate of these five factors was greater than 80%.
According to the proportions of these indicators and the classification results, the five main components were the primary and secondary industrial structure and agglomeration level, resource consumption and pollution emission level, level of intensive utilization of forest land, technological innovation level, and tertiary industry structure and agglomeration level.
3.2. System Coordination Degree of the Ecological Development in the Forestry Industry
The principles of the classification of the system coordination degree of ecological development in the forestry industry are shown in Table 6.
Table 7 shows that the system coordination degree of all provinces across the country varied greatly throughout 2009 to 2018. Most regions were in the worst state of coordination in 2009, and most reached a relatively coordinated state by 2012 and 2013. China began to implement the “12th Five-Year Plan” in 2011, which is when it also held the first APEC Forestry Ministerial Conference. In the same year, China promulgated the “12th Five-Year Plan for forestry development.” During the period of implementing the “12th Five-Year Plan,” the promotion of forestry reform, the development of afforestation, and the implementation of various forestry policies in China led to the rapid development of the forestry industry. The supporting capacity of forestry was significantly improved, and the ecological culture became increasingly prosperous. At the same time, with the deepening of international cooperation and exchanges, the supply and demand of the forest products market became more balanced and the overall national forestry development trend was generally of high quality. After 2014, the coordination degree of most provinces and cities in China fell again, while the provinces that had excellent coordination, such as Shanghai and Jiangsu, retained their advantages. Compared with the uncoordinated regions, Shanghai and Jiangsu had the best management systems in the country, as well as high levels of economic, scientific, and technological development.
4. Discussion
4.1. Analysis of the Level of Ecological Development in China’s Forestry Industry
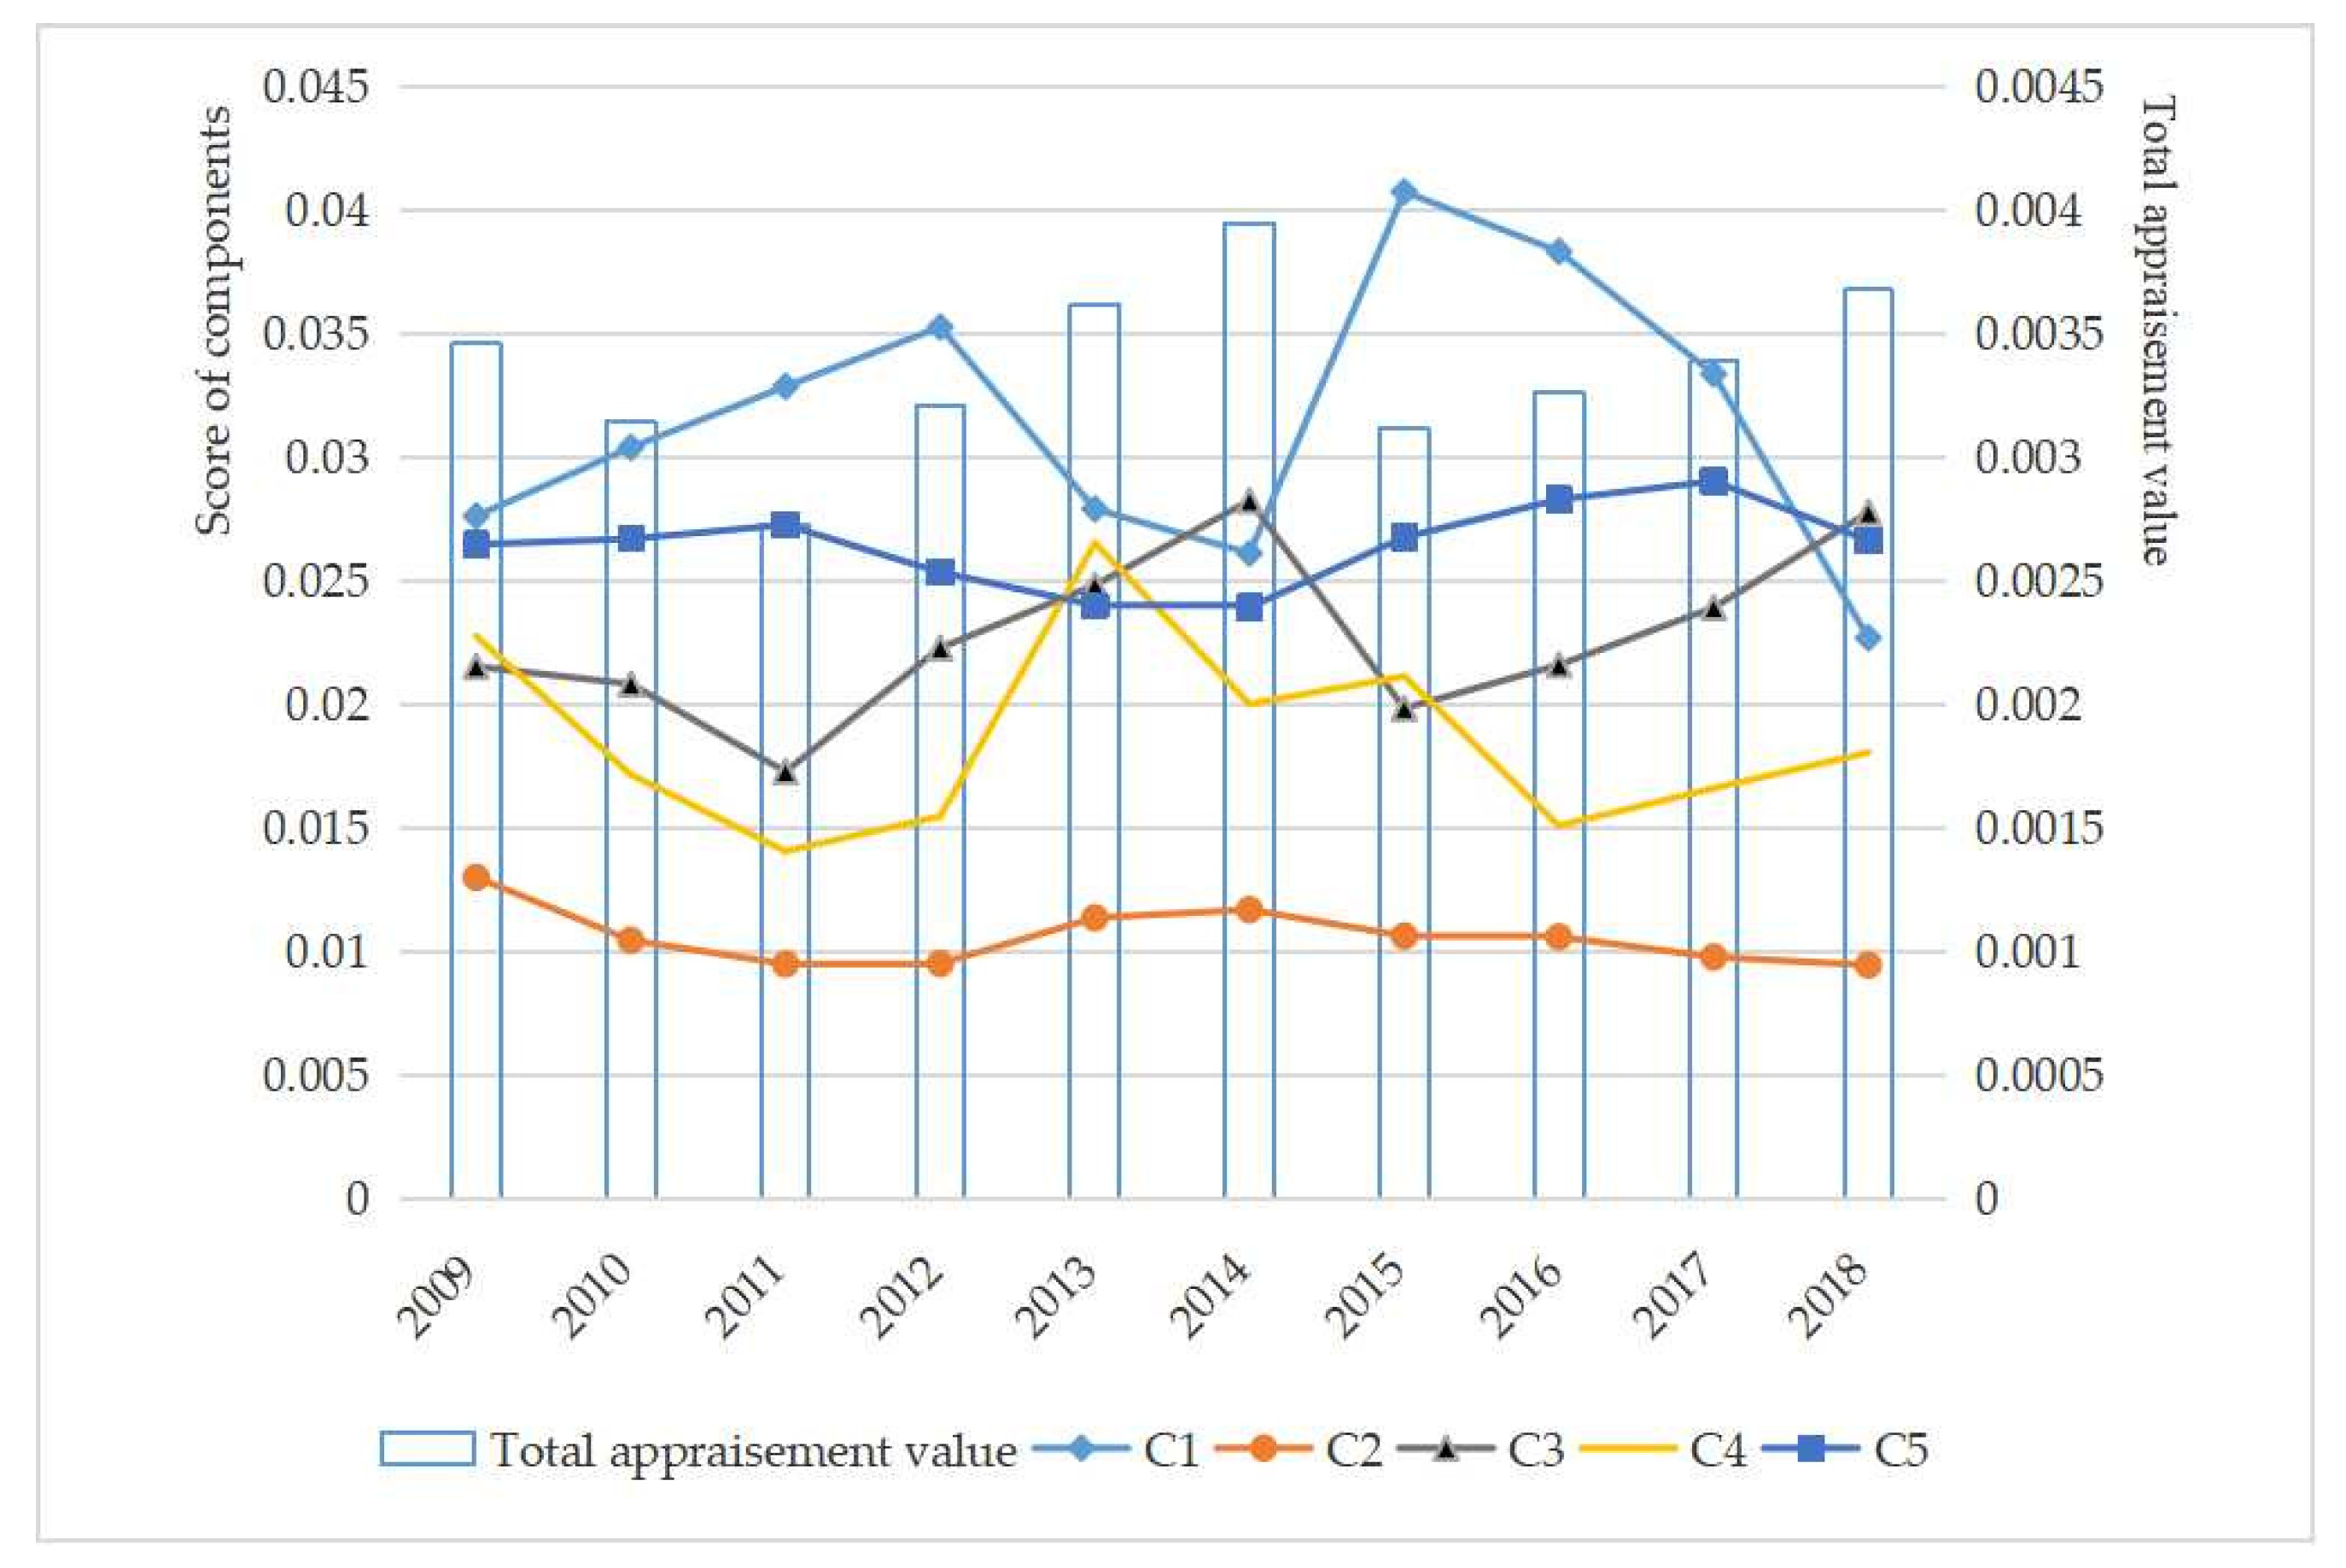
The total appraisement value of the ecological development in China’s forestry industry experienced two fluctuations during 2009–2018. For the entire period, it has a slight growth, which increased from 0.345 in 2009 to 0.367 in 2018, and shown slight fluctuations but a generally upward trend from 2009 to 2018 (see Figure 4). The two principal component indicators of industrial structure and agglomeration (C1 and C5) showed a contrary trend to the trend of appraisement value. This indicates that the current forestry industrial structure and agglomeration mode in China deviate from the goal of ecological development. The traditional operational mode of the forestry industry at the cost of environmental pollution and resource depletion has not changed. At the same time, it can be seen that the structure of forestry primary and secondary industry is more reasonable and advanced than the tertiary industry, and the agglomeration characteristics of spatial organization structure are more obvious. Therefore, the primary task of the ecological development of forestry industry is to change the mode of forestry planting and manufacturing, and promote the development of tertiary industries such as forest recreation and health care. Among the rest three principal component indicators, the level of resource consumption and pollution emission (C2) remained at a worst level during the research period and were relatively stable. It demonstrated that, as mentioned above, the association of the economic development with the environmental and resource problems had not got enough attentions in forestry industry. The level of intensive utilization of forest land (C3), and level of technological innovation (C4) were the most vital factor affecting the ecological development proceeding of the forestry industry.
In 2008, China encountered some rare disasters, including low-temperature rain, snow, and freezing, as well as the Wenchuan earthquake, which seriously damaged forest resources, the environment, and the forest infrastructure. Meanwhile, the global financial crisis introduced severe challenges to the development of China’s forestry industry. Therefore, the overall forestry ecology showed a downward trend from 2009 to 2011. Due to this critical decline, the Chinese forestry industry adopted a scientific development model that closely focused on the overall situation of the country, and particularly on forestry. The forestry industry began to recover after 2012, and progress was made in various forestry undertakings after the aforementioned problems were effectively resolved by overcoming difficulties and adjusting policies. However, China’s provinces gradually stopped the commercial logging of natural forests, which may have been a vital contributor to the decline in the ecological development level from 1 April 2014. It is noteworthy that the trend in the forestry ecological development level was generally consistent with the trend in technological innovation.
The evaluative criteria of ecological development in the forestry industry showed a fluctuating upward trend from 2009 to 2018 (see Figure 4). (1) The criteria of the forestry industry structure included two principal components, which were the “level of primary and secondary industrial structure and agglomeration” and the “level of tertiary industry structure and agglomeration.” The level of tertiary industry structure and agglomeration maintained a gentle upward trend, while the level of primary and secondary industrial structure and agglomeration showed great fluctuation. This indicates that the levels of primary and secondary industrial structure and agglomeration responded more strongly to other factors. (2) The principal component of the intensive utilization of forest land reflected the ecological developments made regarding forestry industry organization. The trend in this index was synchronized with the level of technological innovation. This was because archaic technology limited the improvement of the utilization rate of forest land, resulting in a decline in the intensification of forest land. However, with the development of science and technology, the utilization rate and production efficiency of forest land rapidly improved and the intensive utilization of forest land rose steadily [63]. (3) The ecological development of the production mode in the forestry industry was reflected by the index of energy consumption and pollution. The extraction of forestry resources damaged the natural environment, accompanied by the advancement of industrialization [64]. However, appropriate development strategies, along with advanced technology and equipment, alleviated the pressure on resources, as well as energy use and ecological pollution, which were maintained at a relatively stable state. (4) The scientific and technological development level of forestry was reflected by the ecological technology of the forestry industry. Although China always placed great importance on the development of forestry science and technology and continuously issued relevant policies, the development of said technology still fluctuated. The renewal of facilities was also limited by the industrial agglomeration level. Via a developed and strengthened industrial chain, the industry can more effectively realize specialization development, consistently improve the level of scientific research in forestry, and upgrade scientific and technological equipment.
4.2. The Ecological Development Pattern of the Forestry Industry in China
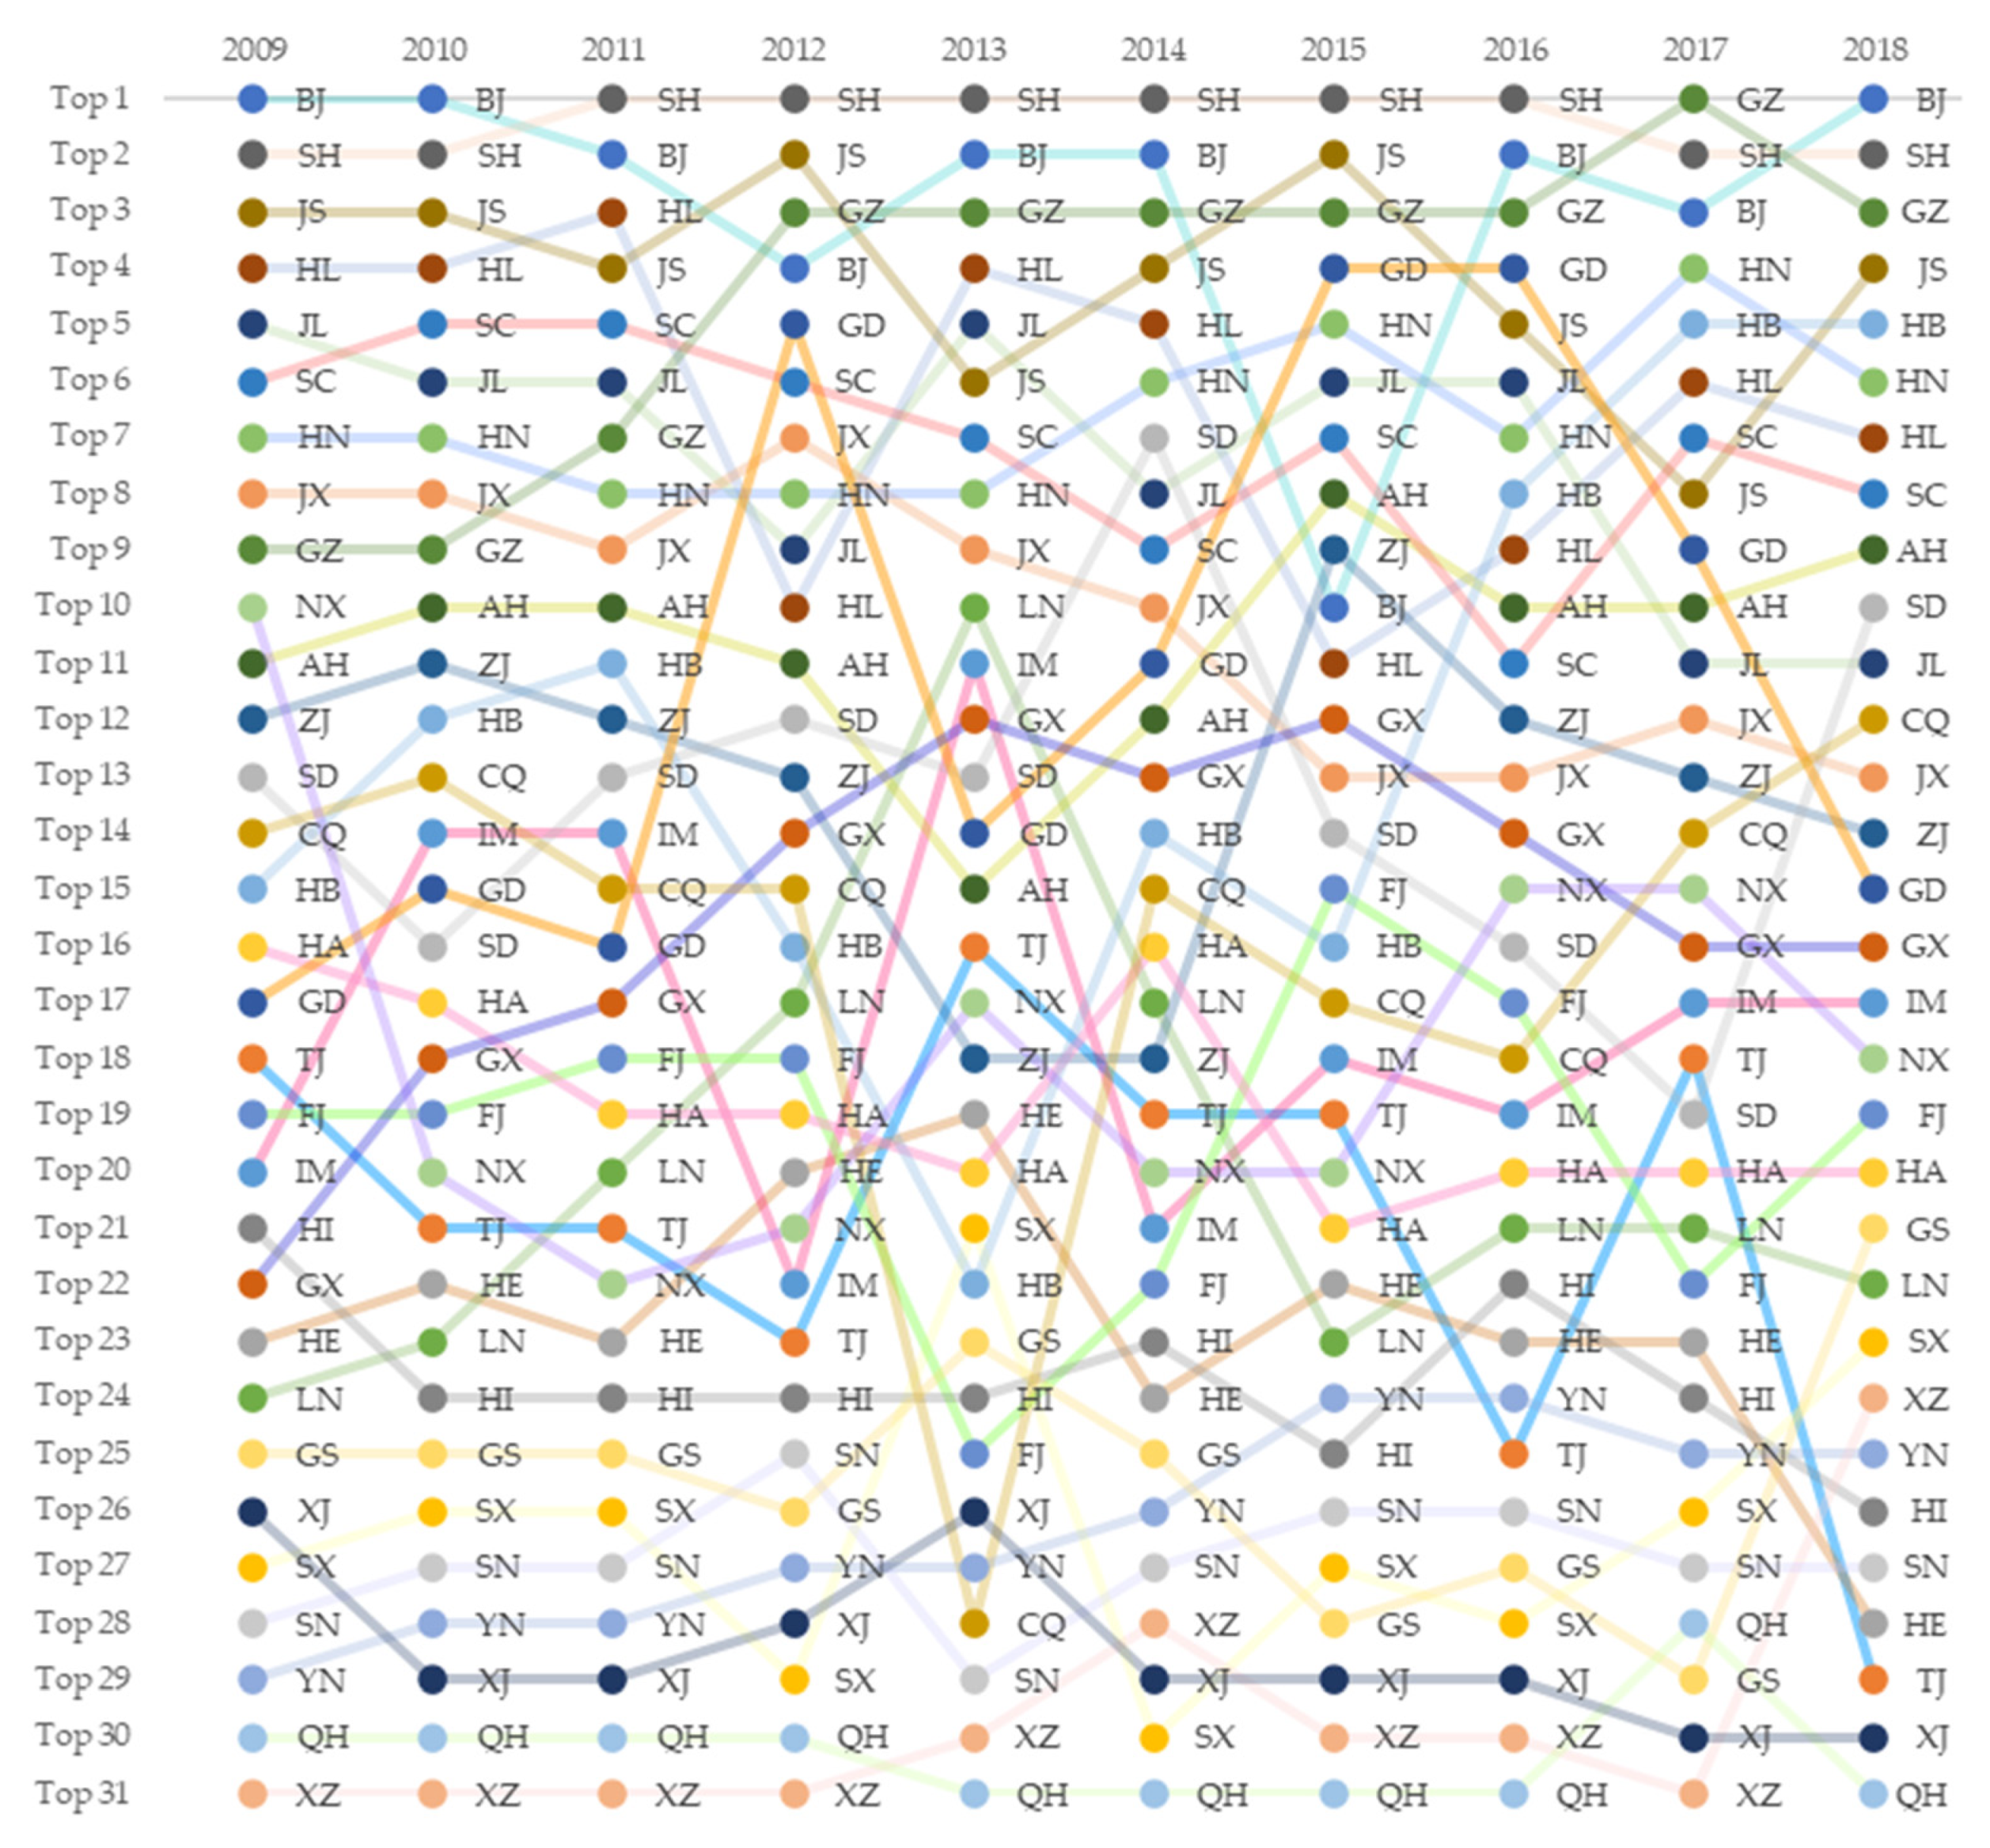
As Table 6 shows, the ecological development level of the forestry industry displayed a fluctuating upward trend, indicating that the general quality of forestry industry ecology in all the provinces in China was gradually improving, as was consistent with the overall development trend of the country. Furthermore, Figure 5 shows that the development levels of Beijing, Shanghai, Jiangsu, Hunan, and Guizhou were generally consistently higher than those of other regions. The development levels of Shanxi, Yunnan, Tibet, Shaanxi, and Xinjiang were always low ranked. Nevertheless, they changed within individual years, fluctuating within a certain range. Affected by some specific reasons, the ranking of the remaining provinces has fluctuated greatly. For example, Guangdong Province ranked in the top five in some years, while it fell behind 15 in some years. The reasons for this phenomenon in Guangdong Province can be attributed to the violent fluctuation of the capital agglomeration degree.
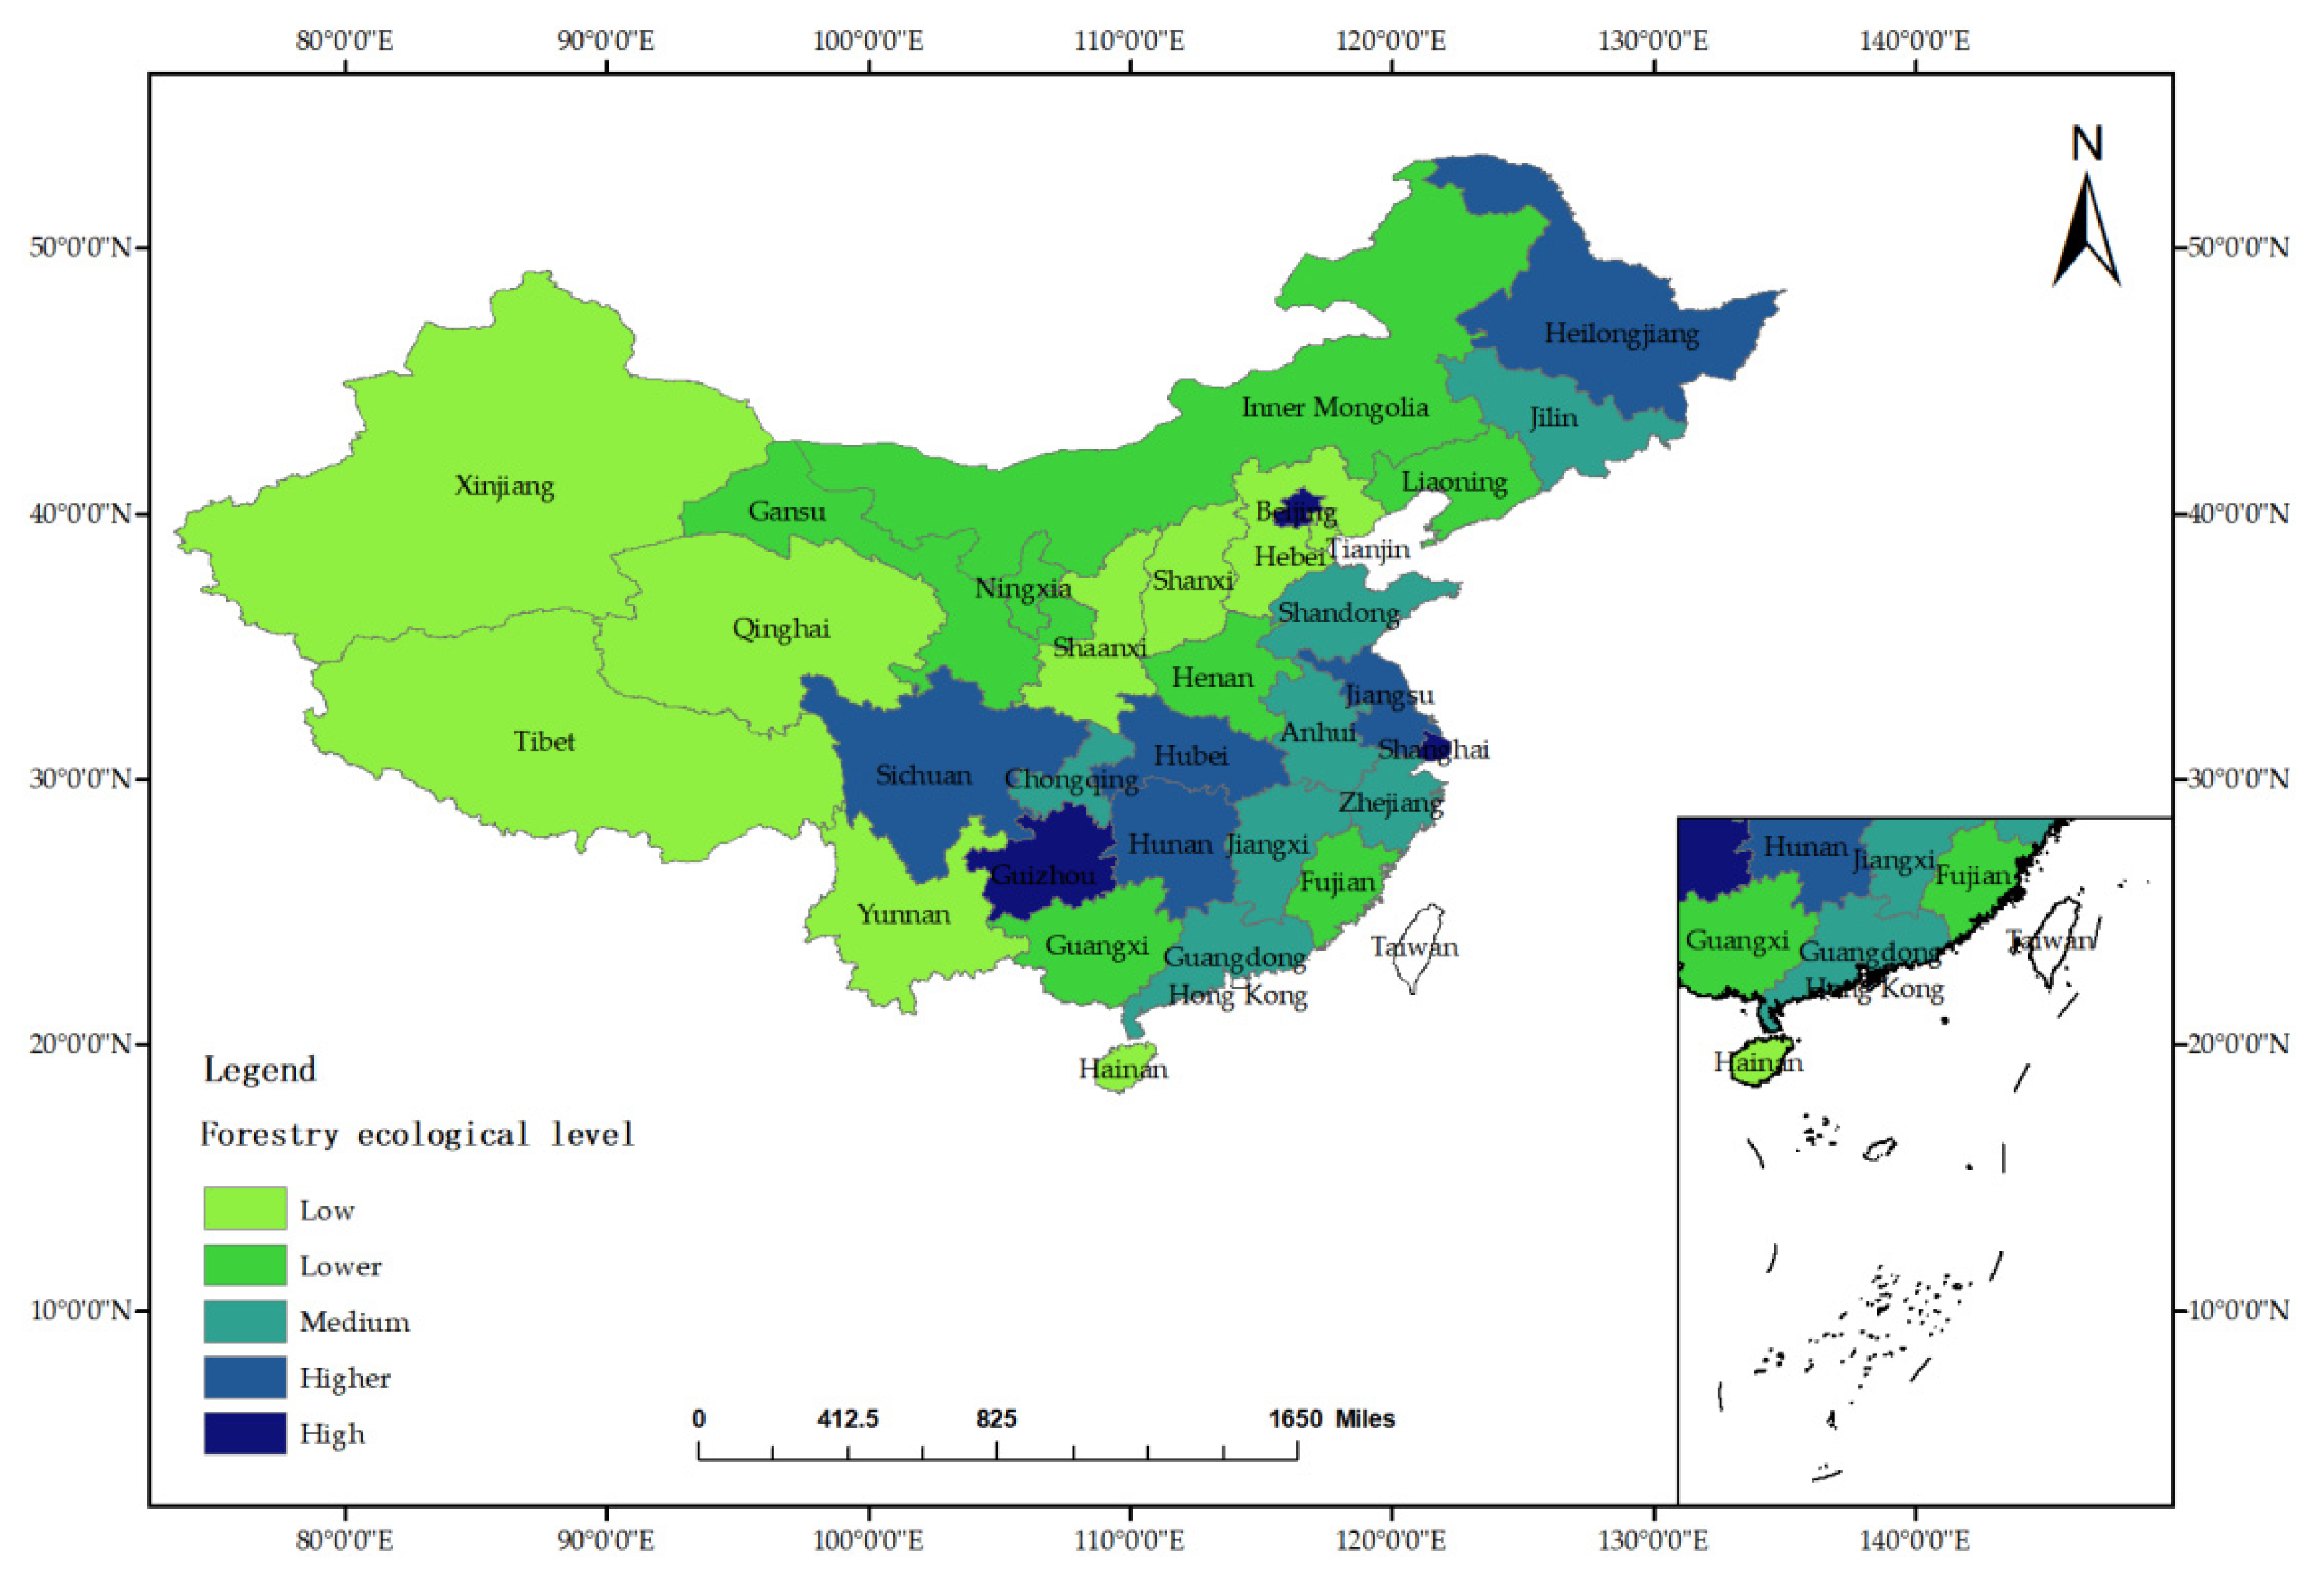
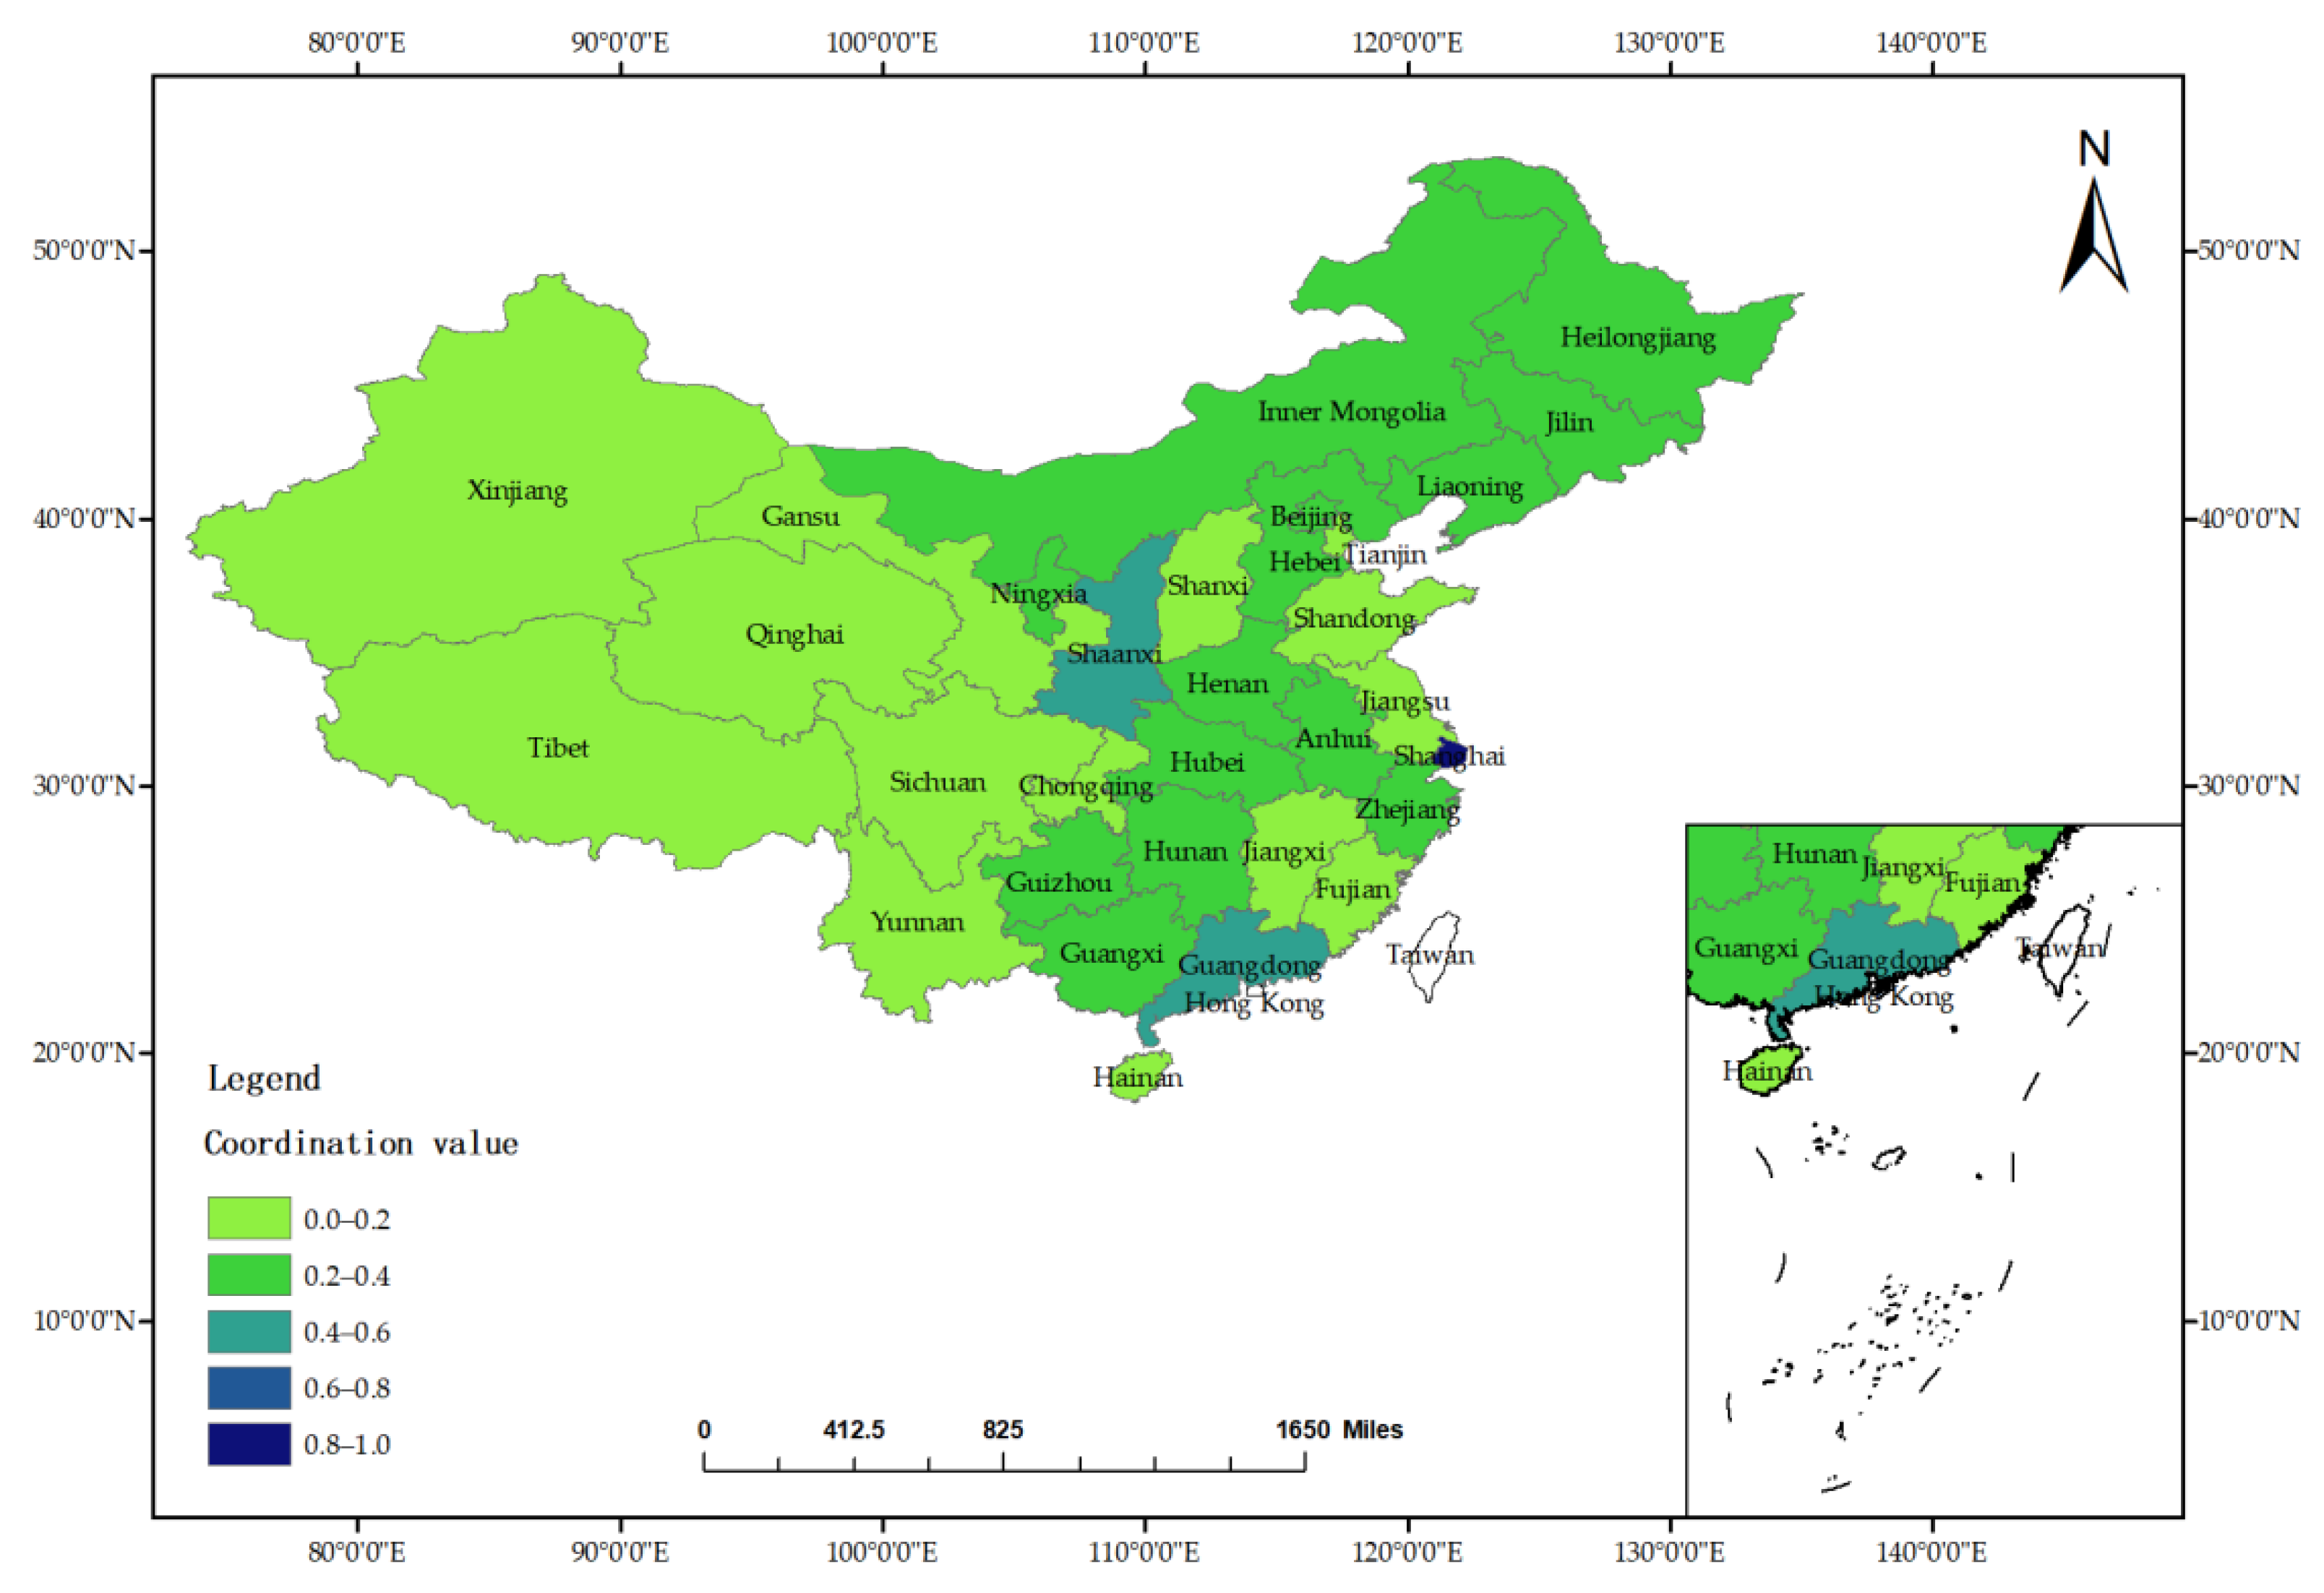
Figure 6 and Figure 7 respectively describe the ecological development level and system coordination degree of the Chinese forestry industry in 2018. Areas with a highly ecologically developed forestry industry, such as Beijing, Shanghai, Jiangsu, Hunan, and Guizhou, were typically located in the central and coastal areas, and their economic development conditions were relatively good. The ecological development level of the forestry industry in Shanxi, Yunnan, Tibet, Shaanxi, and Xinjiang consistently ranked lowest, and most of these were located in the northwestern region.
However, the degree of system coordination did not appear to be consistent with the ecological development level. The coordination degree of Jiangsu Province was very low, but its level of ecological development ranked in the top five. This illustrates that, although the absolute ecological development level in Jiangsu Province was high, there was no coordination within the system. The improvement of the ecological development level was not due to the comprehensive improvement of each criteria layer, but it was instead due to the sudden surge of a specific index. The coordination degree of Qinghai Province was very high, but the ecological level was very low, demonstrating that while the development of each system was relatively stable, the overall ecological level needed to be improved. Overall, the coordination degree and ecological level showed a low development pattern in the northwest and a high one in the central region.
Jiangsu was a severely uncoordinated area, but its forestry industry’s ecological level ranked in the top five. This means that although the absolute value of Jiangsu’s ecological level reached its highest point, the system did not achieve coordinated development. This shows that the improvement in the ecological level here was not due to the comprehensive improvement of each system level, but it was instead due to the sudden increase in a particular index. The degree of coordination in Qinghai was very high, but its level of ecological development was very low, indicating that the development of various systems was relatively stable, and the overall level of ecological development needed to be increased. The degree of coordination and the level of ecological development in the southwest were good and the development momentum was relatively strong. The degree of coordination and the level of ecological development showed a low-to-middle-high development pattern in the northwest.
5. Conclusions and Recommendations
This study proposed a hybrid ensemble approach based on PCA–entropy weighted fuzzy-DEMATEL to assess the ecological development level and system coordination degree of the forestry industry in China from 2009 to 2018. Moreover, we drew a spatial distribution map of provinces and cities in China, and further systematically analyzed the temporal and spatial differentiation in the ecological development of the forestry industry through the combination of the ecological vector data of provinces and cities with ArcGIS.
The results of this work were as follows:
- The ecological development level of China’s forestry industry was mostly related to its technical level. The low conversion rate of scientific and technological achievements was a prominent problem that restricted the ecological transformation of China’s forestry industry;
- The overall ecological development level of the forestry industry rising steadily, while the coordination among factors generally fluctuated. China’s forestry industry as a whole had not yet reached a stage of fully coordinated ecological development until 2018;
- The ecological development level of the forestry industry in each province gradually improved, and the rankings were relatively stable. The characteristics of the temporal and spatial differentiation were significant, appearing low in the northwest and middle to high in the south.
Appropriate countermeasures are expected for the ecological development of the forestry industry in China.
Firstly, the improvement of ecological high-tech level is a pivotal condition for achieving the ecological development of the forestry industry. It is essential to actively develop and applied emerging forestry technology industries, such as forestry Internet of things, forestry biomass energy, biomass materials, biopharmaceuticals, wildlife breeding and utilization, etc. In contrast, for the traditional forestry industry, they should commit to the research on circular production technology, including reuse technology, systematic technology, resource technology, cleaner production, waste treatment, recycling technology, etc.
Secondly, as a key factor in the ecological development of the forestry industry, it is urgent to accelerate the ecological scientific and technological innovation. Forest enterprises are focal organizations of industry and the nucleus to promote the ecological development of industry. Enterprises should develop progressive technologies, including advanced processing means of various forestry products, systematic management concept of the forestry industry, well-run expert consultation mechanisms, and powerful resource optimization allocation capability. It is necessary that forestry enterprises should regard the transformability of high-tech achievements as their fundamental ability for survival, and take advanced technology as the cornerstone of further development.
Thirdly, the coordinated ecological development of China’s forestry industry should be adapted to local conditions, focusing on improving areas with high levels of industrial ecological development but with low coordination, and addressing the imbalance through internal development. (1) Knowledge-based organizations were mostly concentrated in areas with high levels of economic development. The northwest region, which had no obvious location-based advantages and was relatively lacking in production factors, had a weak technical foundation and low levels of scientific and technological investment. The Chinese government should therefore increase investments in science and technology in Shanxi, Yunnan, Tibet, Shaanxi, and Xinjiang. (2) The ecological development level of the forestry industry in Hubei, Hunan, Guizhou, and Guangdong was relatively stable. Both the overall ecological level and the coordination degree of each system showed a certain maturity. All localities should maintain the current trend and develop steadily. (3) The shortage of technical talents is a common problem in all provinces of China. Insufficiency of experience in forestry ecological development created certain challenges in forestry’s technological innovation. Chinese government needs to increase capital investment, employ more professional staffs, and establish high-tech industrial institutions to ensure the improvement of forestry’s technological innovation ability.
Finally, the ecological development of the forestry industry in China needs to satisfy the nation’s ecological requirements. The specific measures including: (1) The government should start environmental policies and establish a strict access and restraint mechanism for forestry enterprises on environmental protection. Reasonable and practicable environmental policies can reduce the damage to the environment caused by forestry enterprises effectively. By standardizing the behavior of enterprises, environmental policies are conducive to the construction of high-tech forestry industry with energy conservation, low consumption and pollution reduction. (2) Governments need to build an appropriate forestry industry ecological chain to reduce waste discharge and improve resource recycling. According to the material metabolism processes of leading regional industries or pillar industries, policymakers can determine the current or potential pollutants in the forestry industry, as well as “key species” in the construction of a regional forestry industry ecosystem. By analyzing the waste production statuses of other industries, the physicochemical characteristics, quantities, scales, and treatment methods for different types of pollution, policymakers can determine the “industrial chain” between regional enterprises, and the “chain supplement” enterprises are required for the decomposition of key pollutants. (3) Governments also ought to formulate local policies are conducive to the ecological development of the forestry industry, including well-directed taxes, appropriate income distribution, continuous financial subsidies, and other effective economic policies, laws, regulations, and administrative measures.
Future work can be carried out in several directions. First, the index system can be extended and optimized, new indicators for more comprehensive and reliable evaluation could be added. Additionally, the proposed approach can be further improved, some state of art methods can be used to improve the evaluation effect. Finally, since technological innovation is the fundamental driving force of ecological development, we can study the specific innovation driving mechanism in the future.
Author Contributions
Conceptualization, D.X. and X.Z.; methodology, D.X.; software, C.L.; validation, D.X. and X.Z.; formal analysis, D.X.; investigation, C.L. and D.X.; resources, X.Z.; data curation, X.Z.; writing—original draft preparation, D.X.; writing—review and editing, X.Z. and D.X.; visualization, X.Z.; supervision, X.Z.; project administration, D.X.; funding acquisition, D.X. All authors have read and agreed to the published version of the manuscript.
Funding
This research was funded by The Ministry of Education’s Humanities and Social Science projectvia the China Ministry of Education, grant number 20YJC630173, and the National Natural Science Foundation of China, grant number 72001190.
Data Availability Statement
Data supporting the reported results can be found at http://www.stats.gov.cn, accessed on 18 August 2021.
Conflicts of Interest
The authors declare no conflict of interest.
References
- Ayres, R.U.; Norberg-Bohm, V.; Prince, J.; Stigliani, W.M.; Yanowitz, J. Industrial Metabolism, the Environment, and Application of Materials-Balance Principles for Selected Chemicals; International Institute for Applied Systems Analysis: Lazenburg, Austria, 1989. [Google Scholar]
- Frosch, R.A.; Gallopoulos, N.E. Strategies for manufacturing. Sci. Am. 1989, 261, 144–152. [Google Scholar] [CrossRef]
- Graedel, T.E.; Allenby, B.R. Implementing industrial ecology. IEEE Technol. Soc. Mag. 1993, 12, 18–26. [Google Scholar] [CrossRef]
- Hawken, P.; Lovins, A.; Lovins, L.H. Natural Capitalism: Creating the Next Industrial Revolution; Oversea Publishing House: Beijing, China, 1999. [Google Scholar]
- Erkman, S. Industrial ecology: An historical view. J. Clean. Prod. 1997, 5, 1–10. [Google Scholar] [CrossRef]
- Lowenthal, M.D.; Kastenberg, W.E. Industrial ecology and energy systems: A first step. Resour. Conserv. Recycl. 1998, 24, 51–63. [Google Scholar] [CrossRef]
- Chertow, M.R.; Graedel, T.E.; Kanaoka, K.S.; Park, J. The Hawaiian Islands: Conceptualizing an industrial ecology holarchic system. Sustainability 2020, 12, 3104. [Google Scholar] [CrossRef] [Green Version]
- Magnusson, T.; Andersson, H.; Ottosson, M. Industrial ecology and the boundaries of the manufacturing firm. J. Ind. Ecol. 2019, 23, 1211–1225. [Google Scholar] [CrossRef]
- Manderson, E.J.; Considine, T.J. An economic perspective on industrial ecology. Rev. Environ. Econ. Policy 2018, 12, 304–323. [Google Scholar] [CrossRef]
- Duchin, F.; Levine, S.H. Industrial ecology. Encycl. Ecol. 2014, 4, 352–358. [Google Scholar]
- Arnold, V.; Globa, S. Industrial ecology and sustainable development. Encycl. Sustain. High. Educ. 2019, 100–124. [Google Scholar] [CrossRef]
- Maxime, D.; Marcotte, M.; Arcand, Y. Development of eco-efficiency indicators for the Canadian food and beverage industry. J. Clean. Prod. 2006, 14, 636–648. [Google Scholar] [CrossRef]
- Zhang, B.; Bi, J.; Fan, Z.; Yuan, Z.; Ge, J. Eco-efficiency analysis of industrial system in China: A data envelopment analysis approach. Ecol. Econ. 2008, 68, 306–316. [Google Scholar] [CrossRef]
- Gao, Y.C.; Han, R.L.; Tong, L.J. Evaluation of industrial eco-efficiency in Jilin Province. China Popul. Resour. Environ. 2011, 21, 106–111. [Google Scholar]
- Anderberg, S. Industrial metabolism and the linkages between economics, ethics and the environment. Ecol. Econ. 1998, 24, 311–320. [Google Scholar] [CrossRef]
- Shi, Y.; Zhu, X.; Sun, X.; Li, Y.; Wei, T. A dynamic assessment for the coordination between economic development and the environment: A case study of Lianyungang, China. Acta Ecol. Sin. 2010, 30, 4119–4129. [Google Scholar]
- Roberts, B.H. The application of industrial ecology principles and planning guidelines for the development of eco-industrial parks: An Australian case study. J. Clean. Prod. 2004, 12, 997–1010. [Google Scholar] [CrossRef]
- Gibbs, B.; Deutz, P. Reflections on implementing industrial ecology through eco-industrial park development. J. Clean. Prod. 2007, 15, 1683–1695. [Google Scholar] [CrossRef]
- Stunnas, E.; Kliopova, I. Industrial ecology for optimal food waste management in a region. Environ. Res. Eng. Manag. 2021, 77, 7–24. [Google Scholar] [CrossRef]
- Despeisse, M.; Ball, P.D.; Evans, S. Industrial ecology at factory level: A conceptual model. J. Clean. Prod. 2012, 31, 30–39. [Google Scholar] [CrossRef] [Green Version]
- Shaolun, Z.; Rulin, F.; Yulong, R. Study on the circular economy mode of coal-fired power plant based on cleaner production. Ecol. Econ. 2008, 3, 116–120. [Google Scholar]
- Yang, J.; Bi, J.; Zhou, J.B. Eco-enterprise as model of circular economy: Case study on cement enterprise. China Popul. Resour. Environ. 2005, 15, 66–70. [Google Scholar]
- Zhang J., L.; Shang Y., Z.; Liu J., Y.; Fu, J. Improved ecological development model for lower Yellow River floodplain, China. Water Sci. Eng. 2020, 13, 275–285. [Google Scholar] [CrossRef]
- Vahidi, H.; Hoveidi, H.; Khoie, K. Challenges and opportunities of industrial ecology development in Iran. Int. J. Environ. Res. 2016, 10, 217–226. [Google Scholar]
- Senko, S.; Pyklinen, J. Exploring the views of forest industry companies on the long-term forestry development in Russia: A case study in Republic of Karelia. For. Policy Econ. 2020, 120, 102311. [Google Scholar] [CrossRef]
- Dong, P.W.; Zhuang, S.Y.; Lin, X.H.; Zhang, X.Z. Economic evaluation of forestry industry based on ecosystem coupling. Math. Comput. Model. 2013, 58, 1010–1017. [Google Scholar] [CrossRef]
- Chen, N.; Qin, F.; Zhai, Y.X.; Cao, H.P.; Zhang, R.; Cao, F.P. Evaluation of coordinated development of forestry management efficiency and forest ecological security: A spatiotemporal empirical study based on China’s provinces. J. Clean. Prod. 2020, 260, 121042. [Google Scholar] [CrossRef]
- Baffoe, G. Exploring the utility of Analytic Hierarchy Process (AHP) in ranking livelihood activities for effective and sustainable rural development interventions in developing countries. Eval. Program Plan. 2018, 72, 197–204. [Google Scholar] [CrossRef]
- Suganthi, L. Multi expert and multi criteria evaluation of sectoral investments for sustainable development: An integrated fuzzy AHP, VIKOR/DEA methodology. Sustain. Cities Soc. 2018, 43, 144–156. [Google Scholar] [CrossRef]
- Mastrocinque, E.; Ramírez, F.J.; Honrubia-Escribano, A.; Pham, D.T. An AHP-based multi-criteria model for sustainable supply chain development in the renewable energy sector. Expert Syst. Appl. 2020, 150, 113321. [Google Scholar] [CrossRef]
- Tang, J.; Zhu, H.L.; Liu, Z.; Zheng, X.X. Urban Sustainability Evaluation under the Modified TOPSIS Based on Grey Relational Analysis. Int. J. Environ. Res. Public Health 2019, 16, 256. [Google Scholar] [CrossRef] [Green Version]
- Lin, S.S.; Shen, S.L.; Zhou, A.N.; Xu, Y.S. Approach based on TOPSIS and Monte Carlo simulation methods to evaluate lake eutrophication levels. Water Res. 2020, 187, 116437. [Google Scholar] [CrossRef]
- Ylmaz, V.A.; Koca, L. Development of gluten-free corn bread enriched with anchovy flour using TOPSIS multi-criteria decision method. Int. J. Gastron. Food Sci. 2020, 22, 100281. [Google Scholar] [CrossRef]
- Mousavi, S.A.; Seiti, H.; Hafezalkotob, A.; Asian, S.; Mobarra, R. Application of risk-based fuzzy decision support systems in new product development: An R-VIKOR approach. Appl. Soft Comput. 2021, 109, 107456. [Google Scholar] [CrossRef]
- Tian, C.; Peng, J.J.; Zhang, S.; Wang, J.Q.; Goh, M. A sustainability evaluation framework for WET-PPP projects based on a picture fuzzy similarity-based VIKOR method. J. Clean. Prod. 2021, 289, 125130. [Google Scholar] [CrossRef]
- Garg, H.; Nancy. Algorithms for possibility linguistic single-valued neutrosophic decision-making based on COPRAS and aggregation operators with new information measures. Measurement 2019, 138, 278–290. [Google Scholar] [CrossRef] [Green Version]
- Arabameri, A.; Yamani, M.; Pradhan, B.; Melesse, A.; Shirani, K.; Bui, D.T. Novel ensembles of COPRAS multi-criteria decision-making with logistic regression, boosted regression tree, and random forest for spatial prediction of gully erosion susceptibility. Sci. Total Environ. 2019, 688, 903–916. [Google Scholar] [CrossRef]
- Tong, L.Z.; Pu, Z.M.; Chen, K.; Yi, J.J. Sustainable maintenance supplier performance evaluation based on an extend fuzzy PROMETHEE II approach in petrochemical industry. J. Clean. Prod. 2020, 273, 122771. [Google Scholar] [CrossRef]
- Angilella, S.; Pappalardo, M.R. Assessment of a failure prediction model in the energy sector: A multicriteria discrimination approach with Promethee based classification. Expert Syst. Appl. 2021, 184, 115513. [Google Scholar] [CrossRef]
- Saraswat, S.K.; Digalwar, A.K. Evaluation of energy alternatives for sustainable development of energy sector in India: An integrated Shannon’s entropy fuzzy multi-criteria decision approach. Renew. Energy 2021, 171, 58–74. [Google Scholar] [CrossRef]
- Sun, X.S. Green city and regional environmental economic evaluation based on entropy method and GIS. Environ. Technol. Innov. 2021, 23, 101667. [Google Scholar] [CrossRef]
- Mousavi Nasab, S.H.; Sotoudeh Anvari, A. An extension of best-worst method with D numbers: Application in evaluation of renewable energy resources. Sustain. Energy Technol. Assess. 2020, 40, 100771. [Google Scholar]
- Faizi, S.; Saabun, W.; Nawaz, S.; ur-Rehman, A.; Atróbski, J.W. Best-Worst method and Hamacher aggregation operations for intuitionistic 2-tuple linguistic sets. Expert Syst. Appl. 2021, 181, 115088. [Google Scholar] [CrossRef]
- Sałabun, W.; Wątróbski, J.; Shekhovtsov, A. Are MCDA Methods Benchmarkable? A Comparative Study of TOPSIS, VIKOR, COPRAS, and PROMETHEE II Methods. Symmetry 2020, 12, 1549. [Google Scholar] [CrossRef]
- Mousavi-Nasab, S.H.; Sotoudeh-Anvari, A. A comprehensive MCDM-based approach using TOPSIS, COPRAS and DEA as an auxiliary tool for material selection problems. Mater. Des. 2017, 121, 237–253. [Google Scholar] [CrossRef]
- Alkan, M.; Albayrak, Z.K. Ranking of renewable energy sources for regions in Turkey by fuzzy entropy based fuzzy COPRAS and fuzzy MULTIMOORA. Renew. Energy 2020, 162, 712–726. [Google Scholar] [CrossRef]
- Amiri, M.; Hashemi-Tabatabaei, M.; Ghahremanloo, M.; Keshavarz-Ghorabaee, M.; Antucheviciene, J. A novel model for multi-criteria assessment based on BWM and possibilistic chance-constrained programming. Comput. Ind. Eng. 2021, 156, 107287. [Google Scholar] [CrossRef]
- Solangi, Y.A.; Cheng, L.; Shah, S. Assessing and overcoming the renewable energy barriers for sustainable development in Pakistan: An integrated AHP and fuzzy TOPSIS approach. Renew. Energy 2021, 173, 209–222. [Google Scholar] [CrossRef]
- Kumar, R.; Singh, S.; Bilga, P.S.; Jatin, K.; Pruncu, C.I. Revealing the benefits of entropy weights method for multi-objective optimization in machining operations: A critical review. J. Mater. Res. Technol. 2021, 10, 1471–1492. [Google Scholar] [CrossRef]
- Chen, P. Effects of the entropy weight on TOPSIS. Expert Syst. Appl. 2020, 168, 114186. [Google Scholar] [CrossRef]
- Rui, M.J. Strategic thinking, target and path for the construction of the modern industrial system. China Ind. Econ. 2018, 9, 24–40. [Google Scholar]
- He, X.Y.; Shen, K.R. Modernized economic system, total factor productivity and high-quality development. Shanghai J. Econ. 2018, 6, 25–34. [Google Scholar]
- Hu, H.R.; Nie, Y.F. Industrial agglomeration, industrial structure optimization and firm productivity-empirical recserch based on national development zones. Mod. Econ. Sci. 2018, 40, 39–47. [Google Scholar]
- Gao, X.P.; Wan, Z.F. Research on forest industrial development in state-owned areas of Heilongjiang Province under the perspective of industrial gradient. For. Econ. 2017, 39, 71–76. [Google Scholar]
- Zhang, X.; Zhao, D.Y.; Guo, Q. Evaluation on woodland intensive use-a case of Wenhe Operating Zone in Yakeshi city of China. Asian Agric. Res. 2009, 1, 29–32. [Google Scholar]
- Xu, Y.J. Construction and Quantization of circular economy indicator system for forestry industry. Recycl. Resour. Circ. Econ. 2010, 3, 14–17. [Google Scholar]
- Agrawal, V.; Seth, N.; Dixit, J.K. A combined AHP—TOPSIS—DEMATEL approach for evaluating success factors of e-service quality: An experience from Indian banking industry. Electron. Commer. Res. 2020, 33–45. [Google Scholar] [CrossRef]
- Gül, S. Spherical fuzzy extension of DEMATEL (SF-DEMATEL). Int. J. Intell. Syst. 2020, 35, 67–81. [Google Scholar] [CrossRef]
- Wang, F. Preference degree of triangular fuzzy numbers and its application to multi-attribute group decision making. Expert Syst. Appl. 2021, 178, 114982. [Google Scholar] [CrossRef]
- Altuntas, S.; Selim, H.; Dereli, T. A Fuzzy DEMATEL-Based Solution Approach for Facility Layout Problem: A Case Study. Int. J. Adv. Manuf. Technol. 2014, 73, 749–771. [Google Scholar] [CrossRef]
- Zhong, B.L. Dynamic Evaluation and System Coordination Degree of the Integration of Artificial Intelligence and Real Economy. Complexity 2021, 2021, 5539793. [Google Scholar]
- Dong, W.T. The Coordination Degree of Marine Economy and Social Economy Development. J. Coast. Res. 2020, 112, 161–164. [Google Scholar] [CrossRef]
- Tan, K.; Chen, Z.; Huang, N.; Zhong, H.; Yang, C. Evaluation of intensive use of forest land based on entropy method—A case study of towns in the pearl river delta. For. Environ. Sci. 2017, 33, 98–103. [Google Scholar]
- Nie, N.; Dong, M.H. Trend analysis on the eco-environmental stress in human industrialization progression. Ecol. Econ. 2006, 7, 99–102. [Google Scholar]
Figure 1.
Conceptual framework of evaluation for forestry industry ecological development.

Figure 2.
Theoretical model of ecological development in the forestry industry.

Figure 3.
Flowchart of the proposed hybrid ensemble evaluation approach.

Figure 4.
Trends in the ecological development level in the forestry industry.

Figure 5.
Ecological development value of the forestry industry in each province.

Figure 6.
Distribution map of the ecological development appraisement value in 2018.

Figure 7.
Distribution of the coordination degree in 2018.


Table 1.
Evaluation index system of the ecological development level in the forestry industry.
| Target Layer | Criteria Layer | Index Layer | Formula |
|---|---|---|---|
| Ecological development level in forestry industry | Ecological development level of forestry industry structure | Proportion of primary forestry industrial output value | Output value of primary forestry industry/total output value |
| Proportion of secondary forestry industrial output value | Output value of secondary forestry industry/total forestry output value | ||
| Proportion of tertiary forestry industrial output value | Output value of tertiary forestry industry/total forestry output value | ||
| Structure benefits of forestry industry | Comparative labor productivity of first industry/comparative labor productivity of second and tertiary industries | ||
| Processing degree | Total output value of forest product processing industry/total forestry output value | ||
| Degree of aggregation in primary forestry industry | (The primary output value of forestry in each region/the total output value of forestry in each region)/(the primary output value of forestry in the country/the gross output value of forestry in the country) | ||
| Degree of aggregation in secondary forestry industry | (The secondary output value of forestry in each region/the total output value of forestry in each region)/(the secondary output value of forestry in the country/the gross output value of forestry in the country) | ||
| Degree of aggregation in tertiary forestry industry | (The secondary output value of forestry in each region/the total output value of forestry in each region)/(the secondary output value of forestry in the country/the gross output value of forestry in the country) | ||
| Degree of aggregation in the main forestry industry | (Output value of major forestry industries in each region/total forestry output value of various regions)/(output value of major forestry industries in the country/total forestry output value of the country) | ||
| Ecological development level of forestry industry organization | Technology-intensive index | Number of professional and technical personnel at forestry scientific research institutions/practitioners in various regions | |
| Economic contribution rate of emerging forestry industries | Increase in output value of emerging forestry industries/increase in total forestry output value in that year | ||
| Proportion of professional technical service output value | Output value of forestry professional and technical services/total output value | ||
| Intensive utilization of forest land | Total forestry industry output value/area of forest land | ||
| Degree of labor agglomeration | Number of forestry practitioners/area of forest land | ||
| Degree of capital agglomeration | Forestry fixed assets investment/area of forest land | ||
| Ecological development level of forestry industry production methods | Energy consumption of forestry output value per thousand yuan | Forestry energy consumption/forestry output value | |
| Water withdrawal of forestry output value per thousand yuan | Forestry water intake/forestry output value | ||
| Industrial wastewater discharge of forestry output value per thousand yuan | Wastewater discharge of forestry industry/forestry output value | ||
| Industrial waste gas emissions of forestry output value per thousand yuan | Forestry industry waste gas emissions/forestry output value | ||
| Industrial solid waste emissions of forestry output value per thousand yuan | Solid waste discharge from forestry industry/forestry output value | ||
| Ecological development level of forestry industry technology | Synthetic utilization rate of solid waste in forestry industry | Synthetic utilization capacity of industrial solid waste/(industrial solid waste generation capacity + synthetic utilization of storage capacity in previous years) | |
| Proportion of forestry scientific researchers | Number of professional and technical personnel/number of forestry practitioners | ||
| Number of forestry scientific and technological achievements | - | ||
| Density of scientific research institutions | Number of forestry scientific research institutions/number of forestry institutions | ||
| Per capita investment in forestry science and technology | Amount of science and technology investment/professional and technical personnel of forestry scientific research institutions |
Table 2.
The semantic transformation table.
| Language Operator | No Effect (N) | Weaker Effect (VW) | Weak Effect (W) | Intensity Effect (S) | Strong Effect (VS) |
|---|---|---|---|---|---|
| Triangulation function value | (0, 0, 0.2) | (0, 0.2, 0.4) | (0.2, 0.4, 0.6) | (0.4, 0.6, 0.8) | (0.8, 1,1) |
Table 3.
Total variance explained.
| Component | Initial Eigenvalue | Extract Squared and Load | Rotate the Square and the Load | ||||||
|---|---|---|---|---|---|---|---|---|---|
| Total | Variance (%) | Cumulative (%) | Total | Variance (%) | Cumulative (%) | Total | Variance (%) | Cumulative (%) | |
| 1 | 5.664 | 33.320 | 33.320 | 5.664 | 33.320 | 33.320 | 4.514 | 26.550 | 26.550 |
| 2 | 3.088 | 18.165 | 51.484 | 3.088 | 18.165 | 51.484 | 3.166 | 18.625 | 45.175 |
| 3 | 2.295 | 13.499 | 64.984 | 2.295 | 13.499 | 64.984 | 2.142 | 12.602 | 57.777 |
| 4 | 1.672 | 9.837 | 74.821 | 1.672 | 9.837 | 74.821 | 2.099 | 12.347 | 70.124 |
| 5 | 1.090 | 6.415 | 81.236 | 1.090 | 6.415 | 81.236 | 1.889 | 11.112 | 81.236 |
| 6 | 0.727 | 4.275 | 85.510 | - | - | - | - | - | - |
| 7 | 0.616 | 3.625 | 89.135 | - | - | - | - | - | - |
| 8 | 0.524 | 3.080 | 92.216 | - | - | - | - | - | - |
| 9 | 0.422 | 2.481 | 94.697 | - | - | - | - | - | - |
| 10 | 0.264 | 1.554 | 96.251 | - | - | - | - | - | - |
| 11 | 0.224 | 1.316 | 97.566 | - | - | - | - | - | - |
| 12 | 0.185 | 1.086 | 98.652 | - | - | - | - | - | - |
| 13 | 0.151 | 0.888 | 99.540 | - | - | - | - | - | - |
| 14 | 0.044 | 0.261 | 99.801 | - | - | - | - | - | - |
| 15 | 0.021 | 0.122 | 99.923 | - | - | - | - | - | - |
| 16 | 0.010 | 0.058 | 99.982 | - | - | - | - | - | - |
| 17 | 0.003 | 0.018 | 100.000 | - | - | - | - | - | - |
Table 4.
The weights of the main factors of forestry ecology.
| Dimension | Weight | ||
|---|---|---|---|
| Entropy Weight Method | Fuzzy-DEMATEL | Final Value | |
| Level of primary and secondary industrial structure and agglomeration (C1) | 0.0170 | 0.2090 | 0.0036 |
| Level of resource consumption and pollution emission (C2) | 0.4883 | 0.1959 | 0.0957 |
| Level of intensive utilization of forest land (C3) | 0.4766 | 0.1970 | 0.0939 |
| Level of technological innovation (C4) | 0.0091 | 0.2199 | 0.0020 |
| Level of tertiary industry structure and agglomeration (C5) | 0.0090 | 0.1782 | 0.0016 |
Table 5.
Appraisement value of ecological development level of the forestry industry in each province.
Table 5.
Appraisement value of ecological development level of the forestry industry in each province.
| Region | 2009 | r 1 | 2010 | r | 2011 | r | 2012 | r | 2013 | r | 2014 | r | 2015 | r | 2016 | r | 2017 | r | 2018 | r |
|---|---|---|---|---|---|---|---|---|---|---|---|---|---|---|---|---|---|---|---|---|
| Beijing (BJ) 2 | 0.727 | 1 | 0.687 | 1 | 0.611 | 2 | 0.469 | 4 | 0.556 | 2 | 0.607 | 2 | 0.456 | 10 | 0.521 | 2 | 0.535 | 3 | 0.647 | 1 |
| Tianjin (TJ) | 0.327 | 18 | 0.283 | 21 | 0.263 | 21 | 0.267 | 23 | 0.354 | 16 | 0.320 | 19 | 0.386 | 19 | 0.253 | 25 | 0.349 | 18 | 0.219 | 29 |
| Hebei (HE) | 0.292 | 23 | 0.276 | 22 | 0.240 | 23 | 0.290 | 20 | 0.334 | 19 | 0.276 | 24 | 0.343 | 22 | 0.295 | 23 | 0.275 | 23 | 0.226 | 28 |
| Shanxi (SX) | 0.231 | 27 | 0.221 | 26 | 0.194 | 26 | 0.230 | 29 | 0.322 | 21 | 0.246 | 30 | 0.248 | 27 | 0.235 | 28 | 0.239 | 26 | 0.246 | 23 |
| Inner Mongolia (IM) | 0.310 | 20 | 0.339 | 14 | 0.337 | 14 | 0.288 | 22 | 0.393 | 11 | 0.312 | 21 | 0.388 | 18 | 0.361 | 19 | 0.354 | 17 | 0.317 | 17 |
| Liaoning (LN) | 0.276 | 24 | 0.240 | 23 | 0.268 | 20 | 0.328 | 17 | 0.397 | 10 | 0.335 | 17 | 0.332 | 23 | 0.325 | 21 | 0.325 | 21 | 0.271 | 22 |
| Jilin (JL) | 0.494 | 5 | 0.454 | 6 | 0.441 | 6 | 0.422 | 9 | 0.483 | 5 | 0.405 | 8 | 0.468 | 6 | 0.448 | 6 | 0.422 | 11 | 0.364 | 11 |
| Heilongjiang (HL) | 0.517 | 4 | 0.500 | 4 | 0.471 | 3 | 0.419 | 10 | 0.495 | 4 | 0.423 | 5 | 0.453 | 11 | 0.437 | 9 | 0.445 | 6 | 0.404 | 7 |
| Shanghai (SH) | 0.701 | 2 | 0.660 | 2 | 0.618 | 1 | 0.688 | 1 | 0.712 | 1 | 0.647 | 1 | 0.662 | 1 | 0.670 | 1 | 0.550 | 2 | 0.563 | 2 |
| Jiangsu (JS) | 0.596 | 3 | 0.509 | 3 | 0.447 | 4 | 0.549 | 2 | 0.460 | 6 | 0.469 | 4 | 0.529 | 2 | 0.464 | 5 | 0.432 | 8 | 0.450 | 4 |
| Zhejiang (ZJ) | 0.369 | 12 | 0.368 | 11 | 0.355 | 12 | 0.358 | 13 | 0.343 | 18 | 0.326 | 18 | 0.457 | 9 | 0.422 | 12 | 0.401 | 13 | 0.342 | 14 |
| Anhui (AH) | 0.380 | 11 | 0.374 | 10 | 0.397 | 10 | 0.397 | 11 | 0.370 | 15 | 0.373 | 12 | 0.464 | 8 | 0.431 | 10 | 0.422 | 10 | 0.369 | 9 |
| Fujian (FJ) | 0.311 | 19 | 0.309 | 19 | 0.306 | 18 | 0.324 | 18 | 0.295 | 25 | 0.310 | 22 | 0.407 | 15 | 0.366 | 17 | 0.304 | 22 | 0.302 | 19 |
| Jiangxi (JX) | 0.416 | 8 | 0.449 | 8 | 0.434 | 9 | 0.440 | 7 | 0.402 | 9 | 0.383 | 10 | 0.435 | 13 | 0.418 | 13 | 0.419 | 12 | 0.359 | 13 |
| Shandong (SD) | 0.365 | 13 | 0.332 | 16 | 0.353 | 13 | 0.387 | 12 | 0.384 | 13 | 0.412 | 7 | 0.421 | 14 | 0.384 | 16 | 0.340 | 19 | 0.367 | 10 |
| Henan (HA) | 0.339 | 16 | 0.324 | 17 | 0.306 | 19 | 0.322 | 19 | 0.331 | 20 | 0.339 | 16 | 0.364 | 21 | 0.348 | 20 | 0.334 | 20 | 0.294 | 20 |
| Hubei (HB) | 0.346 | 15 | 0.363 | 12 | 0.375 | 11 | 0.347 | 16 | 0.312 | 22 | 0.354 | 14 | 0.405 | 16 | 0.443 | 8 | 0.446 | 5 | 0.419 | 5 |
| Hunan (HN) | 0.443 | 7 | 0.449 | 7 | 0.436 | 8 | 0.436 | 8 | 0.404 | 8 | 0.420 | 6 | 0.470 | 5 | 0.447 | 7 | 0.453 | 4 | 0.413 | 6 |
| Guangdong (GD) | 0.332 | 17 | 0.332 | 15 | 0.325 | 16 | 0.456 | 5 | 0.379 | 14 | 0.378 | 11 | 0.507 | 4 | 0.467 | 4 | 0.427 | 9 | 0.336 | 15 |
| Guangxi (GX) | 0.300 | 22 | 0.310 | 18 | 0.322 | 17 | 0.348 | 14 | 0.385 | 12 | 0.365 | 13 | 0.438 | 12 | 0.401 | 14 | 0.365 | 16 | 0.320 | 16 |
| Hainan (HI) | 0.303 | 21 | 0.230 | 24 | 0.220 | 24 | 0.258 | 24 | 0.299 | 24 | 0.284 | 23 | 0.279 | 25 | 0.300 | 22 | 0.269 | 24 | 0.231 | 26 |
| Chongqing (CQ) | 0.358 | 14 | 0.359 | 13 | 0.334 | 15 | 0.347 | 15 | 0.272 | 28 | 0.343 | 15 | 0.393 | 17 | 0.361 | 18 | 0.390 | 14 | 0.360 | 12 |
| Sichuan (SC) | 0.456 | 6 | 0.469 | 5 | 0.447 | 5 | 0.448 | 6 | 0.419 | 7 | 0.402 | 9 | 0.466 | 7 | 0.425 | 11 | 0.435 | 7 | 0.392 | 8 |
| Guizhou (GZ) | 0.413 | 9 | 0.403 | 9 | 0.438 | 7 | 0.484 | 3 | 0.503 | 3 | 0.489 | 3 | 0.515 | 3 | 0.484 | 3 | 0.601 | 1 | 0.559 | 3 |
| Yunnan (YN) | 0.208 | 29 | 0.202 | 28 | 0.185 | 28 | 0.236 | 27 | 0.276 | 27 | 0.267 | 26 | 0.303 | 24 | 0.267 | 24 | 0.252 | 25 | 0.234 | 25 |
| Tibet (XZ) | 0.097 | 31 | 0.099 | 30 | 0.079 | 31 | 0.089 | 31 | 0.209 | 30 | 0.254 | 28 | 0.134 | 30 | 0.192 | 30 | 0.197 | 31 | 0.241 | 24 |
| Shaanxi (SN) | 0.213 | 28 | 0.221 | 27 | 0.189 | 27 | 0.248 | 25 | 0.265 | 29 | 0.259 | 27 | 0.257 | 26 | 0.249 | 26 | 0.239 | 27 | 0.229 | 27 |
| Gansu (GS) | 0.254 | 25 | 0.224 | 25 | 0.197 | 25 | 0.246 | 26 | 0.306 | 23 | 0.271 | 25 | 0.245 | 28 | 0.238 | 27 | 0.228 | 29 | 0.283 | 21 |
| Qinghai (QH) | 0.129 | 30 | 0.099 | 30 | 0.089 | 30 | 0.156 | 30 | 0.179 | 31 | 0.177 | 31 | 0.102 | 31 | 0.144 | 31 | 0.231 | 28 | 0.198 | 31 |
| Ningxia (NX) | 0.388 | 10 | 0.302 | 20 | 0.256 | 22 | 0.289 | 21 | 0.350 | 17 | 0.313 | 20 | 0.372 | 20 | 0.389 | 15 | 0.382 | 15 | 0.304 | 18 |
| Xinjiang (XJ) | 0.253 | 26 | 0.177 | 29 | 0.172 | 29 | 0.232 | 28 | 0.280 | 26 | 0.249 | 29 | 0.222 | 29 | 0.212 | 29 | 0.217 | 30 | 0.212 | 30 |
1 (‘r’ stands for the ranking of regions in the year). 2 (The abbreviations of regions were written in brackets).
Table 6.
Classification of system coordination in regional forestry.
| Coordination Index Interval | [0, 0.2] | [0.2, 0.4] | [0.4, 0.6] | [0.6, 0.8] | [0.8, 1.0] |
|---|---|---|---|---|---|
| Coordination level | Seriously inconsistent | Uncoordinated | Basic coordination | Moderate coordination | Coordination |
| scale value | 0 | 1 | 2 | 3 | 4 |
Table 7.
System coordination degrees of the provinces.
| Region | 2009 | r 1 | 2010 | r | 2011 | r | 2012 | r | 2013 | r | 2014 | r | 2015 | r | 2016 | r | 2017 | r | 2018 | r |
|---|---|---|---|---|---|---|---|---|---|---|---|---|---|---|---|---|---|---|---|---|
| BJ2 | 0.709 | 2 | 0.781 | 2 | 0.644 | 2 | 0.956 | 3 | 0.493 | 26 | 0.432 | 6 | 0.399 | 25 | 0.532 | 19 | 0.427 | 7 | 0.314 | 8 |
| TJ | 0.644 | 4 | 0.457 | 5 | 0.597 | 3 | 0.506 | 29 | 0.372 | 28 | 1.000 | 1 | 1.000 | 1 | 1.000 | 1 | 0.001 | 30 | 0.049 | 28 |
| HE | 0.358 | 17 | 0.173 | 23 | 0.218 | 19 | 0.723 | 24 | 0.837 | 7 | 0.192 | 23 | 0.413 | 23 | 0.618 | 9 | 0.366 | 11 | 0.228 | 16 |
| SX | 0.337 | 21 | 0.191 | 20 | 0.181 | 22 | 0.892 | 8 | 0.899 | 5 | 0.442 | 5 | 0.604 | 4 | 0.764 | 4 | 0.068 | 28 | 0.143 | 22 |
| IM | 0.356 | 18 | 0.294 | 13 | 0.152 | 23 | 0.715 | 26 | 0.779 | 13 | 0.356 | 8 | 0.495 | 7 | 0.635 | 7 | 0.307 | 16 | 0.260 | 12 |
| LN | 0.371 | 15 | 0.263 | 18 | 0.248 | 17 | 0.789 | 13 | 0.816 | 9 | 0.278 | 11 | 0.420 | 21 | 0.512 | 21 | 0.369 | 10 | 0.241 | 14 |
| JL | 0.271 | 25 | 0.034 | 28 | 0.048 | 28 | 0.795 | 11 | 0.751 | 16 | 0.280 | 10 | 0.448 | 12 | 0.576 | 14 | 0.354 | 12 | 0.344 | 4 |
| HL | 0.251 | 29 | 0.008 | 30 | 0.027 | 30 | 0.764 | 17 | 0.748 | 17 | 0.219 | 17 | 0.446 | 14 | 0.545 | 17 | 0.304 | 17 | 0.261 | 11 |
| SH | 1.000 | 1 | 1.000 | 1 | 1.000 | 1 | 0.295 | 30 | 0.194 | 30 | 0.737 | 2 | 0.779 | 3 | 0.218 | 30 | 0.980 | 2 | 1.000 | 1 |
| JS | 0.578 | 5 | 0.464 | 4 | 0.516 | 5 | 0.662 | 27 | 0.657 | 23 | 0.089 | 28 | 0.388 | 26 | 0.419 | 26 | 0.157 | 27 | 0.109 | 24 |
| ZJ | 0.261 | 27 | 0.135 | 25 | 0.057 | 27 | 0.790 | 12 | 0.810 | 10 | 0.185 | 24 | 0.475 | 9 | 0.624 | 8 | 0.246 | 22 | 0.334 | 6 |
| AH | 0.262 | 26 | 0.103 | 26 | 0.383 | 11 | 0.738 | 20 | 0.783 | 11 | 0.216 | 18 | 0.443 | 16 | 0.507 | 23 | 0.257 | 21 | 0.339 | 5 |
| FJ | 0.212 | 31 | 0.000 | 31 | 0.000 | 31 | 0.810 | 10 | 0.832 | 8 | 0.335 | 9 | 0.435 | 19 | 0.640 | 6 | 0.421 | 8 | 0.123 | 23 |
| JX | 0.369 | 16 | 0.271 | 17 | 0.285 | 16 | 0.752 | 19 | 0.719 | 20 | 0.202 | 21 | 0.438 | 18 | 0.495 | 24 | 0.220 | 25 | 0.091 | 26 |
| SD | 0.356 | 18 | 0.307 | 12 | 0.389 | 10 | 0.779 | 14 | 0.756 | 15 | 0.222 | 15 | 0.431 | 20 | 0.458 | 25 | 0.210 | 26 | 0.075 | 27 |
| HA | 0.346 | 20 | 0.190 | 21 | 0.197 | 21 | 0.771 | 15 | 0.850 | 6 | 0.238 | 12 | 0.484 | 8 | 0.578 | 13 | 0.343 | 14 | 0.225 | 17 |
| HB | 0.311 | 23 | 0.289 | 14 | 0.330 | 12 | 0.762 | 18 | 0.702 | 21 | 0.229 | 13 | 0.412 | 24 | 0.513 | 20 | 0.280 | 19 | 0.323 | 7 |
| HN | 0.432 | 10 | 0.365 | 9 | 0.397 | 8 | 0.727 | 22 | 0.730 | 19 | 0.207 | 20 | 0.445 | 15 | 0.510 | 22 | 0.269 | 20 | 0.307 | 9 |
| GD | 0.502 | 7 | 0.390 | 6 | 0.031 | 29 | 0.905 | 7 | 0.916 | 4 | 0.417 | 7 | 0.547 | 5 | 0.730 | 5 | 0.470 | 6 | 0.400 | 3 |
| GX | 0.389 | 12 | 0.088 | 27 | 0.120 | 24 | 0.767 | 16 | 0.778 | 14 | 0.225 | 14 | 0.462 | 11 | 0.549 | 16 | 0.311 | 15 | 0.249 | 13 |
| HI | 0.294 | 24 | 0.318 | 11 | 0.311 | 14 | 0.624 | 28 | 0.597 | 24 | 0.114 | 27 | 0.290 | 29 | 0.595 | 10 | 0.222 | 24 | 0.158 | 20 |
| CQ | 0.332 | 22 | 0.238 | 19 | 0.200 | 20 | 0.811 | 9 | 1.000 | 1 | 0.202 | 21 | 0.468 | 10 | 0.588 | 11 | 0.344 | 13 | 0.185 | 18 |
| SC | 0.424 | 11 | 0.389 | 7 | 0.403 | 6 | 0.727 | 22 | 0.745 | 18 | 0.222 | 15 | 0.443 | 16 | 0.538 | 18 | 0.281 | 18 | 0.164 | 19 |
| GZ | 0.373 | 14 | 0.274 | 16 | 0.289 | 15 | 0.735 | 21 | 0.782 | 12 | 0.126 | 25 | 0.448 | 12 | 0.570 | 15 | 0.394 | 9 | 0.295 | 10 |
| YN | 0.531 | 6 | 0.345 | 10 | 0.395 | 9 | 0.962 | 2 | 0.452 | 27 | 0.056 | 29 | 0.321 | 27 | 0.317 | 28 | 0.066 | 29 | 0.154 | 21 |
| XZ | 0.673 | 3 | 0.507 | 3 | 0.531 | 4 | 0.000 | 31 | 0.000 | 31 | 0.015 | 30 | 0.000 | 31 | 0.000 | 31 | 0.742 | 3 | 0.019 | 31 |
| SN | 0.443 | 9 | 0.283 | 15 | 0.322 | 13 | 0.939 | 4 | 0.510 | 25 | 0.523 | 4 | 0.532 | 6 | 0.792 | 3 | 0.628 | 4 | 0.580 | 2 |
| GS | 0.380 | 13 | 0.147 | 24 | 0.111 | 25 | 0.917 | 6 | 0.988 | 2 | 0.119 | 26 | 0.316 | 28 | 0.348 | 27 | 0.602 | 5 | 0.024 | 29 |
| QH | 0.250 | 30 | 0.009 | 29 | 0.106 | 26 | 0.936 | 5 | 0.983 | 3 | 0.693 | 3 | 0.783 | 2 | 0.959 | 2 | 1.000 | 1 | 0.093 | 25 |
| NX | 0.259 | 28 | 0.182 | 22 | 0.237 | 18 | 0.716 | 25 | 0.693 | 22 | 0.208 | 19 | 0.418 | 22 | 0.585 | 12 | 0.235 | 23 | 0.239 | 15 |
| XJ | 0.464 | 8 | 0.377 | 8 | 0.399 | 7 | 1.000 | 1 | 0.369 | 29 | 0.015 | 30 | 0.205 | 30 | 0.283 | 29 | 0.000 | 31 | 0.024 | 0 |
1 (‘r’ stands for the ranking of regions in the year). 2 (The abbreviations of regions were written in brackets).
Table 8.
Spatial and temporal differentiation of the level of ecological development in the forestry industry.
Table 8.
Spatial and temporal differentiation of the level of ecological development in the forestry industry.
| Region | 2009 | 2010 | 2011 | 2012 | 2013 | 2014 | 2015 | 2016 | 2017 | 2018 |
|---|---|---|---|---|---|---|---|---|---|---|
| BJ | 3 | 3 | 3 | 4 | 2 | 2 | 1 | 2 | 2 | 1 |
| TJ | 3 | 2 | 2 | 2 | 1 | 4 | 4 | 4 | 0 | 0 |
| HE | 1 | 0 | 1 | 3 | 4 | 0 | 2 | 3 | 1 | 1 |
| SX | 1 | 0 | 0 | 4 | 4 | 2 | 3 | 3 | 0 | 0 |
| IM | 1 | 1 | 0 | 3 | 3 | 1 | 2 | 3 | 1 | 1 |
| LN | 1 | 1 | 1 | 3 | 4 | 1 | 2 | 2 | 1 | 1 |
| JL | 1 | 0 | 0 | 3 | 3 | 1 | 2 | 2 | 1 | 1 |
| HL | 1 | 0 | 0 | 3 | 3 | 1 | 2 | 2 | 1 | 1 |
| SH | 4 | 4 | 4 | 1 | 0 | 3 | 3 | 1 | 4 | 4 |
| JS | 2 | 2 | 2 | 3 | 3 | 0 | 1 | 2 | 0 | 0 |
| ZJ | 1 | 0 | 0 | 3 | 4 | 0 | 2 | 3 | 1 | 1 |
| AH | 1 | 0 | 1 | 3 | 3 | 1 | 2 | 2 | 1 | 1 |
| FJ | 1 | 0 | 0 | 4 | 4 | 1 | 2 | 3 | 2 | 0 |
| JX | 1 | 1 | 1 | 3 | 3 | 1 | 2 | 2 | 1 | 0 |
| SD | 1 | 1 | 1 | 3 | 3 | 1 | 2 | 2 | 1 | 0 |
| HA | 1 | 0 | 0 | 3 | 4 | 1 | 2 | 2 | 1 | 1 |
| HB | 1 | 1 | 1 | 3 | 3 | 1 | 2 | 2 | 1 | 1 |
| HN | 2 | 1 | 1 | 3 | 3 | 1 | 2 | 2 | 1 | 1 |
| GD | 2 | 1 | 0 | 4 | 4 | 2 | 2 | 3 | 2 | 2 |
| GX | 1 | 0 | 0 | 3 | 3 | 1 | 2 | 2 | 1 | 1 |
| HI | 1 | 1 | 1 | 3 | 2 | 0 | 1 | 2 | 1 | 0 |
| CQ | 1 | 1 | 1 | 4 | 4 | 1 | 2 | 2 | 1 | 0 |
| SC | 2 | 1 | 2 | 3 | 3 | 1 | 2 | 2 | 1 | 0 |
| GZ | 1 | 1 | 1 | 3 | 3 | 0 | 2 | 2 | 1 | 1 |
| YN | 2 | 1 | 1 | 4 | 2 | 0 | 1 | 1 | 0 | 0 |
| XZ | 3 | 2 | 2 | 0 | 0 | 0 | 0 | 0 | 3 | 0 |
| SN | 2 | 1 | 1 | 4 | 2 | 2 | 2 | 3 | 3 | 2 |
| GS | 1 | 0 | 0 | 4 | 4 | 0 | 1 | 1 | 3 | 0 |
| QH | 1 | 0 | 0 | 4 | 4 | 3 | 3 | 4 | 4 | 0 |
| NX | 1 | 0 | 1 | 3 | 3 | 1 | 2 | 2 | 1 | 1 |
| XJ | 2 | 1 | 1 | 4 | 1 | 0 | 1 | 1 | 0 | 0 |
Publisher’s Note: MDPI stays neutral with regard to jurisdictional claims in published maps and institutional affiliations. |
© 2021 by the authors. Licensee MDPI, Basel, Switzerland. This article is an open access article distributed under the terms and conditions of the Creative Commons Attribution (CC BY) license (https://creativecommons.org/licenses/by/4.0/).
Share and Cite
MDPI and ACS Style
Xu, D.; Lu, C.; Zhang, X. An Ecological Development Level Evaluation of the Forestry Industry in China Based on a Hybrid Ensemble Approach. Forests 2021, 12, 1288. https://doi.org/10.3390/f12091288
AMA Style
Xu D, Lu C, Zhang X. An Ecological Development Level Evaluation of the Forestry Industry in China Based on a Hybrid Ensemble Approach. Forests. 2021; 12(9):1288. https://doi.org/10.3390/f12091288
Chicago/Turabian StyleXu, Dayu, Chunping Lu, and Xuyao Zhang. 2021. "An Ecological Development Level Evaluation of the Forestry Industry in China Based on a Hybrid Ensemble Approach" Forests 12, no. 9: 1288. https://doi.org/10.3390/f12091288
Note that from the first issue of 2016, this journal uses article numbers instead of page numbers. See further details here.