
Analysis of Aerosol Optical Depth from Sun Photometer at Shouxian, China


1
School of Artificial Intelligence, Anhui University, Hefei 230601, China
2
School of Electrical Engineering and Automation, Anhui University, Hefei 230601, China
3
China Meteorological Administration, Beijing 100081, China
4
Key Laboratory of General Optical Calibration and Characterization Technology, Anhui Institute of Optics and Fine Mechanics, Chinese Academy of Sciences, Hefei 230031, China
*
Author to whom correspondence should be addressed.
Atmosphere 2021, 12(9), 1226; https://doi.org/10.3390/atmos12091226
Submission received: 28 August 2021
/
Revised: 13 September 2021
/
Accepted: 16 September 2021
/
Published: 18 September 2021
(This article belongs to the Special Issue Atmospheric Aerosol Optical Properties)
Abstract
:We use two cloud screening methods—the clustering method and the multiplet method—to process the measurements of a sun photometer from March 2020 to April 2021 in Shouxian. The aerosol optical depth (AOD) and Angström parameters α and β are retrieved; variation characteristics and single scattering albedo are studied. The results show that: (1) The fitting coefficient of AOD retrieved by the two methods is 0.921, and the changing trend is consistent. The clustering method has fewer effective data points and days, reducing the overall average of AOD by 0.0542 (500 nm). (2) Diurnal variation of AOD can be divided into flat type, convex type, and concave type. Concave type and convex type occurred the most frequently, whereas flat type the least. (3) During observation, the overall average of AOD is 0.48, which is relatively high. Among them, AOD had a winter maximum (0.70), autumn and spring next (0.54 and 0.40), and a summer minimum (0.26). The variation trend of AOD and β is highly consistent, and the monthly mean of α is between 0.69 and 1.61, concerning mainly continental and urban aerosols. (4) Compared with others, the single scattering albedo in Shouxian is higher, reflecting strong scattering and weak aerosol absorption.
1. Introduction
Aerosol is a system composed of atmosphere and suspended solid and liquid particles, which plays a significant role in climate change, ecological environment, human health, and other aspects [1]. Aerosol can reduce the solar radiation reaching the surface through absorption and scattering, directly affecting the global radiation balance and indirectly impacting the climate system through interaction with clouds [2,3,4]. Aerosol particles also affect atmospheric chemical processes, which is one of the largest sources of uncertainty in climate simulation [5]. Poor air quality caused by high concentrations of aerosol particles is one of the major health risks worldwide. Smaller aerosol particles can enter human lungs and be harmful to the respiratory system. Trace elements such as arsenic, nickel, and lead can cause cancers through inhalation and skin absorption. Dust in the air is detrimental to human health and has a direct relationship with mortality [6,7,8,9]. Coal smog, photochemical smog, dust, and sandstorm in aerosols will significantly reduce atmospheric visibility, interfere with line of sight, hinder social and economic activities such as transportation and industrial production, and cause considerable losses to the national economy [10,11]. Sulfate and nitrate in aerosol can reach the ground through acid deposition, causing acidification of soil and water. After acidification, the aluminum-containing hydroxides in the earth will form aluminum compounds that plants can absorb, resulting in aluminum poisoning and even the death of crops and vegetation [12,13].
Aerosol optical depth (AOD) is a fundamental optical property parameter that is used to describe aerosol optical properties, and is the most important one with the highest observation accuracy and the most observation methods at present [14,15]. AOD is defined as the extinction of solar radiation caused by aerosol and integrated into the whole atmospheric column, reflecting aerosol content to a certain extent. The main methods of AOD measurement are satellite and ground-based remote sensing. Compared to satellite measurement, the ground-based sort is simple and relatively accurate [16,17]. Ground-based remote sensing is preferred when it is necessary to accurately study the effects of aerosol climate radiation in a specified area.
In recent years, scholars at home and abroad have paid extensive attention to the changing characteristics of AOD. Prasad et al. used a Microtops II sun photometer to study the variation of AOD in Bhaktapur, Nepal [18]. Ningombam et al. studied the trend of long-term variation of AOD at 53 sites worldwide from 1995 to 2018, including 49 sites from AERONET and four sites from SKYNET [19]. Jin et al. used an improved retrieval method to retrieve AOD at 500 nm of MODIS data [20]. He et al. used the AOD datasets of several sites from AERONET from 2006 to 2018 to study the spatial and temporal variation characteristics of aerosol types at some representative sites in China [21]. Liu et al. analyzed the variation characteristics of AOD and wavelength exponent in Xi’an by using the measurement of sun photometer from 2015 to 2018 [22].
With the rapid development of the economy, the Yangtze River Delta is becoming more and more densely populated and rich in industrial and agricultural activities, and the AOD is at a relatively high level in China [23,24]. As one of the aerosol monitoring sites in the Yangtze River Delta, Shouxian is a representative area with a high concentration of aerosol particles in China and an important site for aerosol research [25]. Fan et al. analyzed the aerosol optical properties in Shouxian using the mobile equipment of the atmospheric radiation measurement project from May to December 2008 [26]. Qi et al. studied the effects of clouds and aerosols on the surface radiation budget from October to December 2008 in Shouxian, and aerosol produced a longwave warming effect, a strong short wave cooling impact, and a net cooling effect on the surface radiation budget [27]. Tang et al. analyzed the aerosol–cloud interaction in Shouxian using mobile devices from May to December 2008 [28]. Huo et al. analyzed the variation characteristics of aerosol optical properties and the variation of aerosol optical parameters in the process of heavy pollution in Shouxian by using the data from September 2014 to August 2015 [29]. Fan et al. observed and analyzed the atmospheric optical characteristics in Shouxian in winter, and they obtained the AOD, scattering coefficient, absorption coefficient, and diurnal variation of single scattering albedo, using a sun photometer, turbidimeter, particulate monitoring instrument of Shouxian National Climatological Observatory [30].
Due to the lack of AERONET observation data in Shouxian, there are few studies on the optical properties of aerosols in this area. Therefore, in this paper, the aerosol optical depth and Angström parameters in Shouxian are calculated from PSR sun photometer data, and the variation characteristics of aerosol optical parameters are analyzed.
2. Site and Data
2.1. Site Introduction
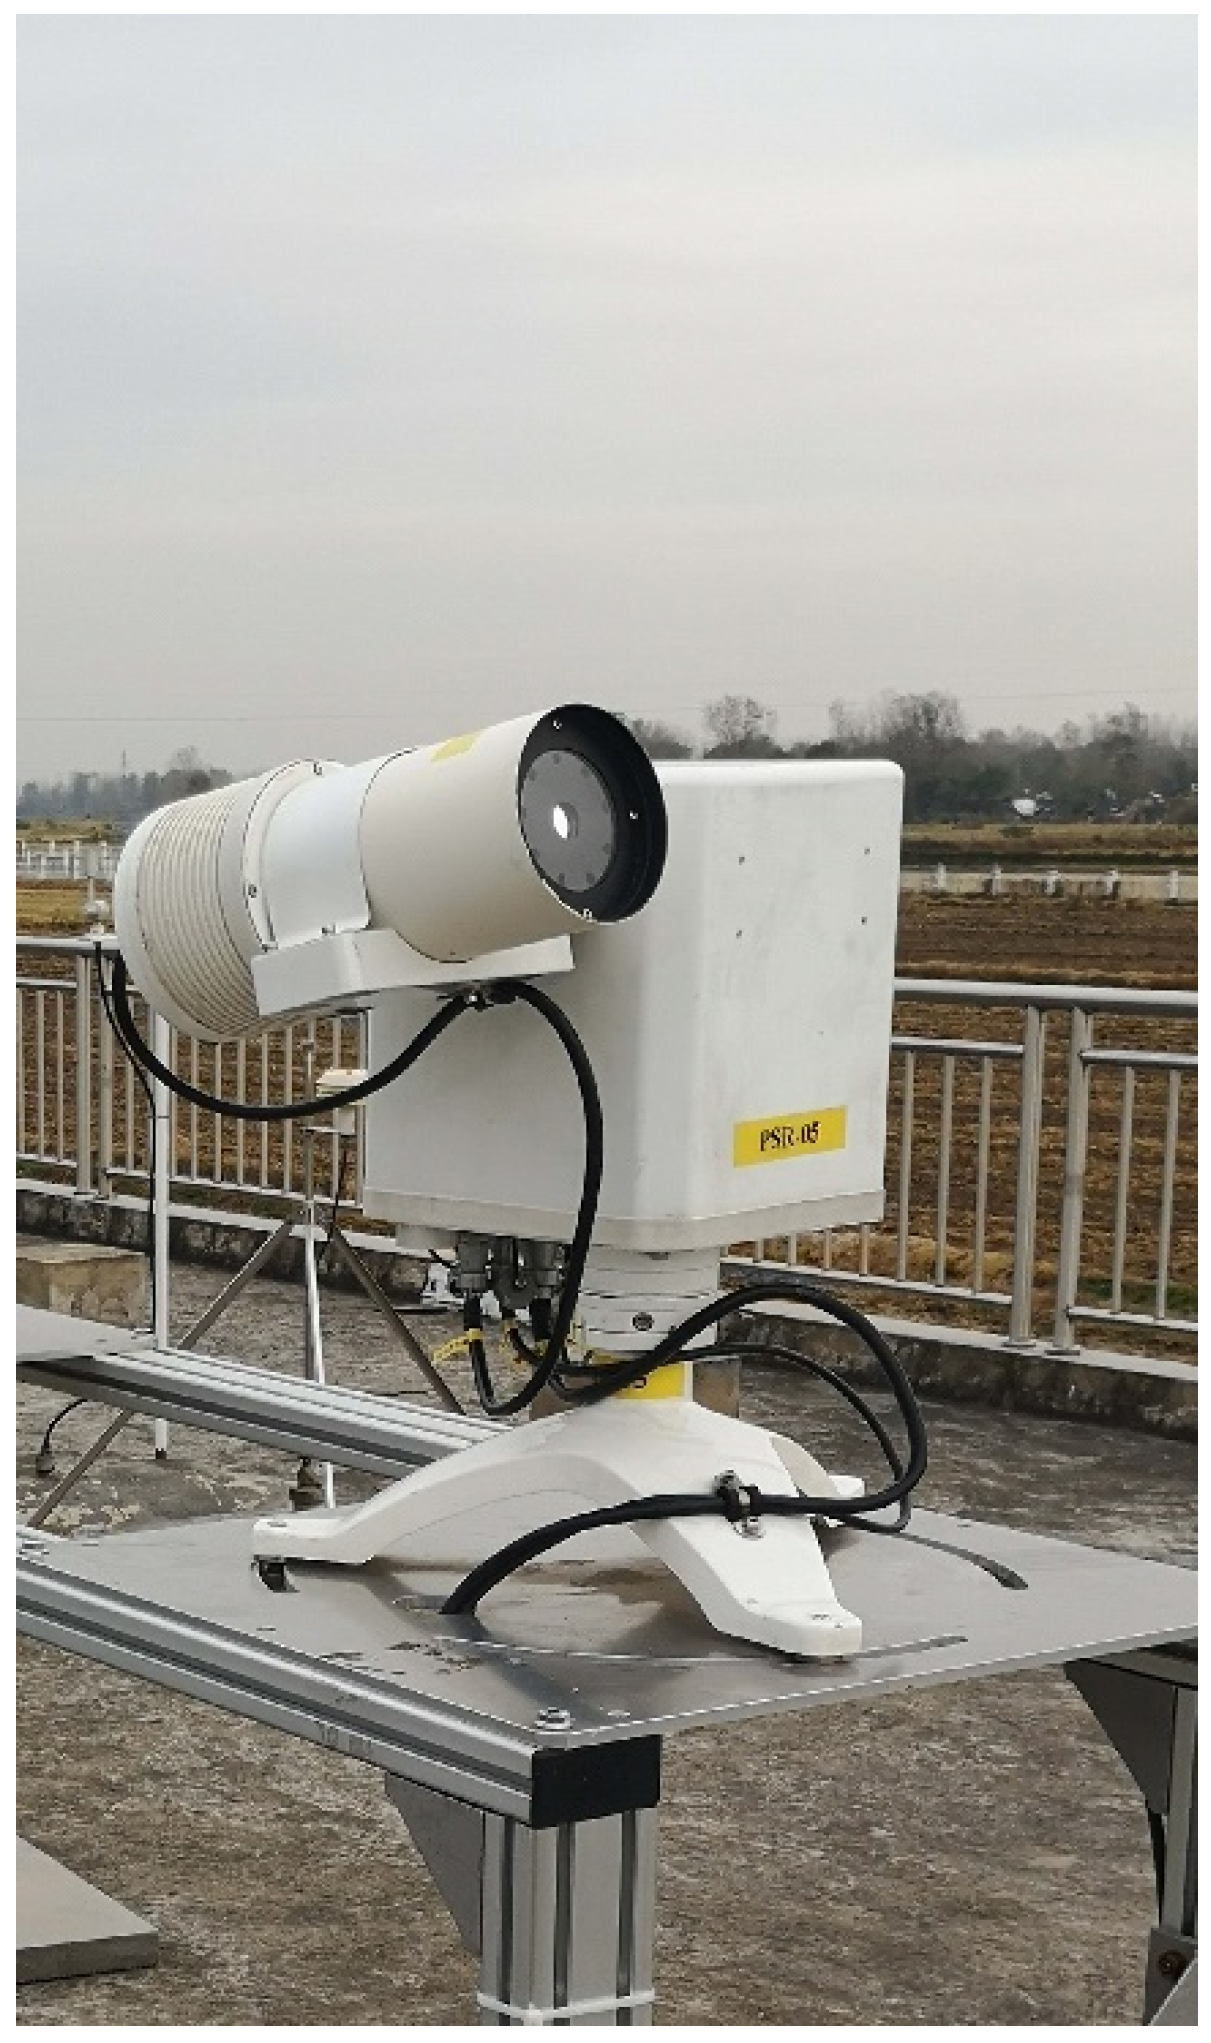
Shouxian is located in the North–South climate transition zone of China—the southern bank of the middle reaches of the Huaihe River. It has a wide variety of weather systems and a large area of farmland underlying the surface, a typical area of the Huang-Huai agricultural ecological region in China. This area is also an ideal observation and experimental site for the interaction between earth and the atmosphere under the influence of human activities. The Shouxian National Climatological Observatory (32.56N, 116.78E) is located 9 km south of the urban center, where the sun photometer used in the experiment shown in Figure 1 is deployed.
2.2. Instrument Introduction
We used the measurements from a PSR sun photometer from 1 January 2020 to 28 February 2021. This sun photometer is fully automatic and manufactured by Anhui Zhongke Purida photoelectric Co., Ltd., Hefei, China. The instrument parameters are shown in Table 1.
2.3. Other Data
OMI, an ozone detector aboard the National Aeronautics and Space Administration’s Aura satellite launched in 2004, used to measure daily global radiation at wavelengths of 270 to 500 nm. The data of aerosol single scattering albedo used in this paper are derived from the Level-3 daily global gridded product OMAERUVd (1 degree lat/lon grids); we used values at 500 nm [31].
The air quality data comes from the China National Environmental Monitoring Centre (https://air.cnemc.cn:18007 (accessed on 16 September 2021)), including air quality index, the concentrations of PM2.5, SO2, NO2, O3, and CO near the ground [32].
3. Data Processing and Method
3.1. Data Screening
Ideally, the direct solar radiation will reach the maximum in the morning, maximum at noon, and then decrease to the minimum at sunset. The whole curve is a symmetrical semicircle arc. Datasets with a significant deviation from the expected value of the maximum midday voltage signal are not considered. There are many discontinuities; in the remaining dataset, there are many curves that are discontinuous, continuous but have a ladder shape, or unevenly distributed, which are all caused by unstable weather or clouds blocking the sun, and none of such datasets are used.
3.2. Retrieval Method
Aerosol can change the nature and intensity of solar radiation on the surface through scattering and absorption. The characteristics of aerosol particles can be retrieved by measuring the variation of solar radiation, which is the basic principle of retrieving aerosol optical depth from remote sensing.
According to the Beer–Lambert–Bouguer law, the direct solar radiation E (W/m2) at a specific wavelength measured on the surface satisfies the formula as follows:
where E0(λ) is the solar irradiance at the wavelength of λ, at a distance of one astronomical unit (AU) outside the atmosphere; R is the earth–sun distance correction factor corresponding to the measurement time; m(θ) denotes the relative air mass; τ(λ) is the total vertical optical depth of the atmosphere; Tg is the transmittance of the absorbed gas.
In addition to the absorption of solar radiation by the water vapor absorption band at 936 nm, the absorption of direct solar radiation by the absorbing gas at other bands can be ignored, i.e., Tg = 1. The output voltage V(λ) of the instrument is directly proportional to the detected solar radiation E(λ), and the calibration constant V0(λ) is directly proportional to E0(λ) with the same proportion. The τ(λ) can be derived from (1),
The distance between the sun and the earth is precisely known for any day and can be calculated by using (3) [33],
where D = 2πN/365, N stands for the day of the year, such as 1 January, and the value of N is 1.
Using (4), we calculated the air mass [34],
where θ is the zenith angle of the sun, which the spherical trigonometric formula can accurately calculate:
where δ is the declination, t0 is the Beijing time, φ is the latitude of the observation point, and ξ is the longitude.
We can obtain the more accurate declination angle of the sun by using (6) [35],
and ω is a coefficient, ω = 2π/365.2422; t is the equivalent daily ordinal number, t = N-1-n0, we can calculate n0 using (7):
where n is the year.
The total optical depth τ of the atmosphere in the channel neglecting gas absorption consists of molecular scattering and aerosol scattering,
When the actual surface pressure is P, the Rayleigh scattering optical depth of the whole layer can be obtained by the empirical formula:
Aerosol optical depth τa can be expressed by subtracting the Rayleigh scattering optical depth from the total optical depth,
The atmospheric aerosol optical depth τa (λ) can be expressed by wavelength index α and atmospheric turbidity coefficient β as:
Angström parameters α and β are estimated by least square regression in the 440–870 nm range [36]. The wavelength index reflects the particle size characteristics, usually between 0 and 2. A small value indicates that the aerosol is mainly composed of large size particles. The larger the value, the larger the proportion of small and medium-sized aerosol particles. The atmospheric turbidity coefficient β refers to the optical depth of atmospheric aerosol at a wavelength of 1 μm, and the basic range is 0 to 0.5. β ≤ 0.1 indicates that the atmospheric aerosol concentration is very low and the air is clean, while β ≥ 0.2 demonstrates that the atmosphere is turbid and the air quality is inferior.
3.3. Cloud Screening Methods
Before retrieval with measurement, cloud screening is needed. Cloud screening methods are mainly based on the multiplet method used for AERONET, which was proposed by Smirnov et al. [37]. Moreover, the clustering method using a k-nearest-neighbor method was proposed by Schenzinger et al. [38].
3.3.1. The Multiplet Method
- (1)
- Data quality checks
If AOD is lower than - 0.01 at any wavelength, we will reject all measured data at that time. The data with an air mass of more than five are not considered when calculating the diurnal average of AOD.
- (2)
- Triplet stability criterion
The variation of AOD within three successive measurements is less than 0.02 or 0.03τa (choose the higher). If the condition is satisfied, the average of the retrieval results of the three measurements is used as τa. When the needs are not met, we ignore that data.
- (3)
- Diurnal stability check
If the standard deviation of the averaged AOD at 500 nm (or 440 nm) is less than 0.015 throughout the day, stop screening and accept all remaining data. If not, go to the next step.
- (4)
- Smoothness criteria
The smoothing criterion limits the root mean square (RMS) of the second derivative of AOD with time, which is very sensitive to the local oscillation of optical depth caused by clouds. The norm of the second derivative of the optical depth concerning time should not exceed a certain threshold as follows:
If D > 16, find the item that contributes the most to D and eliminate the related data. Then, the diurnal stability check is to be applied again (step 3). When the number of measurements in a day is reduced to only 1 or 2, we reject that day’s data. When D ≤ 16, we accept it and proceed to the following criteria.
- (5)
- Three standard deviation criteria
Check whether AOD at 500 nm is within τa ± 3σ and whether the Angstrom parameter α (estimated by least square regression in the 440–870 nm range) is within α ± 3σ the whole day. Data that do not meet the criteria are excluded.
3.3.2. The Clustering Method
- (1)
- Data quality checks
Remove the data with negative values in the measurements. After initial filtering, AOD is calculated according to the measurements, and the non-physical value (negative or infinite) of AOD at any wavelength is discarded.
- (2)
- Triplet stability criterion
The AOD shall not vary more than the set value in three successive measurements. If AOD is lower than 0.2, the threshold is set to 0.02; otherwise, 0.03 is used.
- (3)
- K-nearest-neighbor algorithm
Linear and quadratic fitting of λ and τa(λ) in the range of 440–870 nm for each time step is performed to obtain Angstrom parameters,
where αi is the spectral slope of the linear fit, and γq is the spectral curvature of the quadratic fit.
Four-dimensional space is established using τa (500 nm), the first derivative of AOD ∆τ/∆t relative to time, and γ/10 and α/10 calculated from the above equation. If the average Euclidean distance (known as D20) between P0 and its 20 nearest neighbors exceeds 0.019, the point is considered cloud contaminated. The unit of ∆τ/∆t is in 5 min. If there are fewer than 20 valid measurements, the nearest neighbors k is reduced according to the minimum of points in the real-time analysis. Then the calculated distance is multiplied by 20/k.
3.4. Comparison Method
The linear relationship between AOD retrieved by the multiplet method and retrieved by the clustering method is obtained by linear regression analysis. The relative deviation between the retrieval results of different methods is calculated using (13),
where RD is the relative deviation, τac is the AOD retrieved by the clustering method, and τam is AOD retrieved by the multiplet method.
4. Results and Discussion
Measurements have a higher probability of cloud contamination during the period of low solar elevation angle. To not excessively use the data with higher frequency to weight the diurnal mean, the data for m > 5 are not considered in the calculation. The datasets with valid points less than 70 or uneven distribution are also ignored.
The AOD at 500 nm is numerically equivalent to the average of the all-band AOD, and it can be used as a representative of the AOD of the whole wavelengths [39]. The values of AOD used below are all at 500 nm.
4.1. Analysis of Retrieval Results of Different Cloud Screening Methods
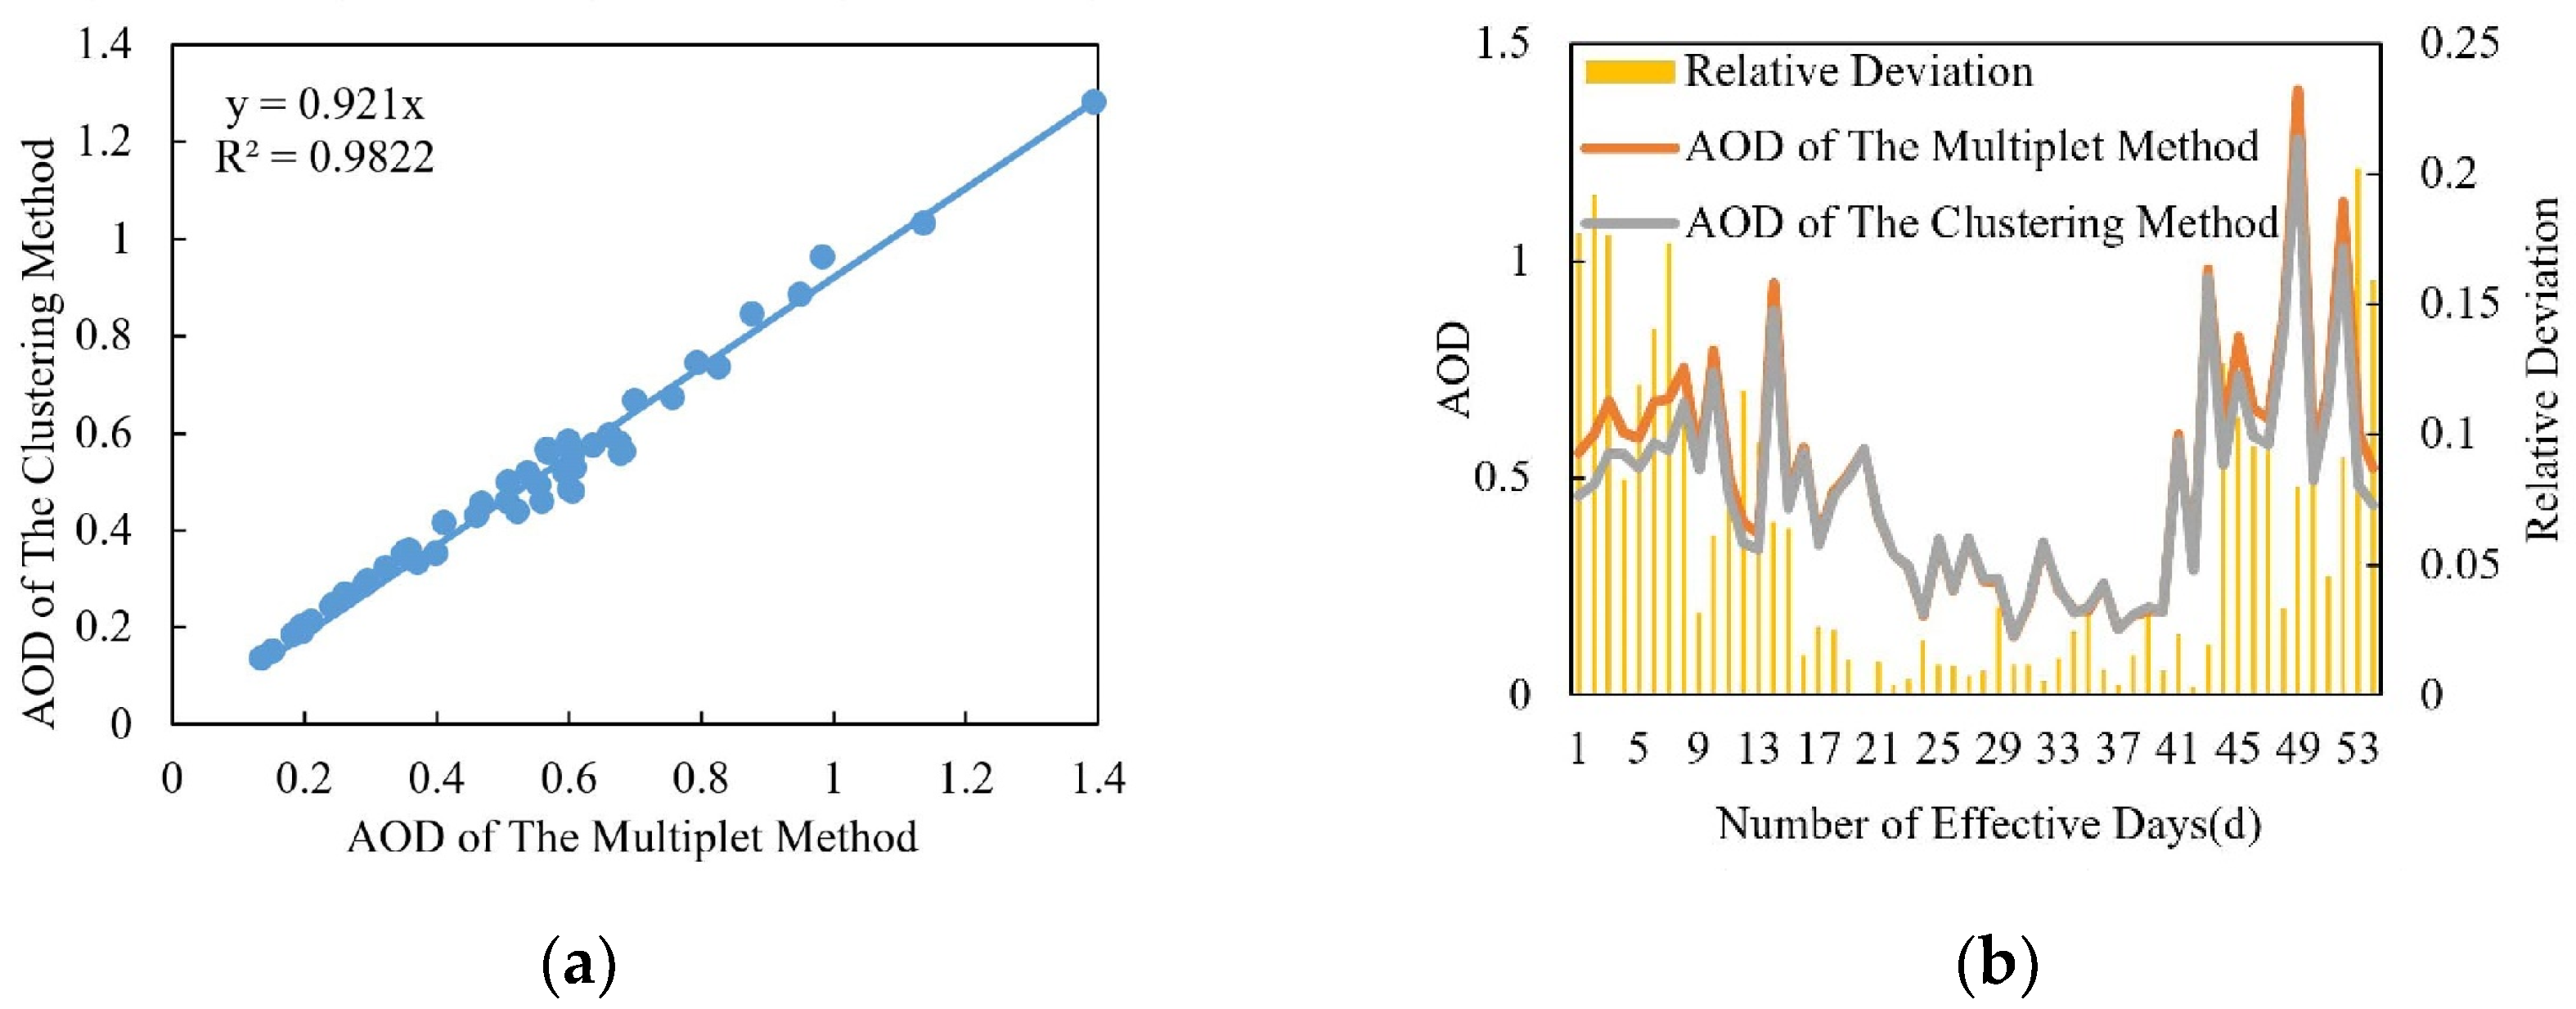
The retrieval results of the multiplet method and the clustering method are illustrated in Figure 2. In Figure 2a, the abscissa of the point represents the AOD retrieved by the multiplet method, and the corresponding ordinate represents the AOD retrieved by the clustering method at the same time. The closer the retrieval results of the two methods, the closer the fitting coefficient is to 1. As shown, the fitting coefficient is 0.921, which indicates that the retrieval results of the two methods are very close, and the AOD of the clustering method is generally smaller than that of the multiplet method. The reason is that the clustering method has a beneficial effect in flagging thin clouds, which cannot be identified by the multiplet method to a certain extent, thus reducing the daily mean of AOD. The overall average value of AOD decreases by 0.0542 by the clustering method during the measurement period.
As shown in Figure 2b, the retrieval results of the two methods are closer when AOD is small, the relative deviation is significant in autumn and winter when the AOD value is considerable, and the effective days of the clustering method are fewer than those of the multiplet method. The reason is that the clustering method has a better effect in flagging thin clouds, and the probability of cloud contamination in spring and summer with a smaller AOD is low. In autumn and winter, the occurrence frequency of thin clouds is higher, which results in higher AOD of the multiplet method. The air pollution in autumn and winter is serious, so the clustering method flags thin clouds and may mistake some effective data points as cloud points, with fewer effective data points than the multiplet method. Datasets with few or uneven distribution of effective data points are ignored, resulting in fewer available observation days for the clustering method.
The clustering method is proposed for the precision filter radiometer (PFR), developed by the Physikalisch-Meteorologisches Observatorium Davos/World Radiation Center (PMOD/WRC) for the GAW network [40]. The measuring frequency of PSR is different from that of PFR. There is a lack of sufficient research to determine the number of nearest neighbors most suitable for PSR. It is unclear whether the probability of mistaking effective points by the clustering method with higher AOD is within the acceptable range. Therefore, the retrieval results of the multiplet method are used in the subsequent analysis.
4.2. Analysis of Diurnal Variation of AOD
As shown in Figure 3, diurnal variation of AOD in Shouxian during the observation period can be divided into three types: Flat type, convex type, and concave type. The occurrence frequency of flat type is the lowest, whereas the convex and concave types are the most frequent. Under these three types, AOD and the amplitude of its diurnal variation decrease gradually with the increase of wavelength, and the variation trend of AOD in each band is consistent.
Figure 3a shows a convex type, and AOD increased gradually from morning to noon, reached the maximum at noon, and decreased gradually in the afternoon, concentrated in April to September. Continuous heating of the solar radiation to the land and the long-wave radiation of the ground made the atmosphere near the surface warm and made the atmospheric structure unstable. After a while, local turbulence was formed. Moreover, the increase of human activities made the dust from the ground easily enter the air. Due to the intense solar radiation, the photochemical reaction was also active, which increased the generation of secondary aerosol. This led to a rapid rise of AOD, reaching the maximum in the day. After that, with the decrease of near-surface temperature, the turbulence weakened, the particles settled to the ground, and AOD decreased somewhat. Figure 3b shows a concave type; AOD decreased gradually from morning to noon, then increased after reaching the minimum at noon, mainly appearing from October to next March. The main reasons were that high humidity in the morning and evening makes it easy for fog to form, and the air quality is poor during this period, which leads to higher AOD. The solar radiation is more robust at noon, and the rising temperature reduces the relative humidity. Meanwhile, the stable atmospheric boundary layer is destroyed by the rising temperature, and the convective boundary layer is formed. The diffusion capacity of pollutants is enhanced, and AOD decreases continuously, thus making AOD reach the minimum in the day. Later, with the gradual decrease of the temperature near the ground, the relative humidity increases, and fog forms in the evening. Figure 3c shows a flat type, and AOD is relatively stable the whole day. This situation mainly occurs when the weather is relatively stable and there are occasional occurrences in April and September.
4.3. Variation Characteristics of AOD, α, and β
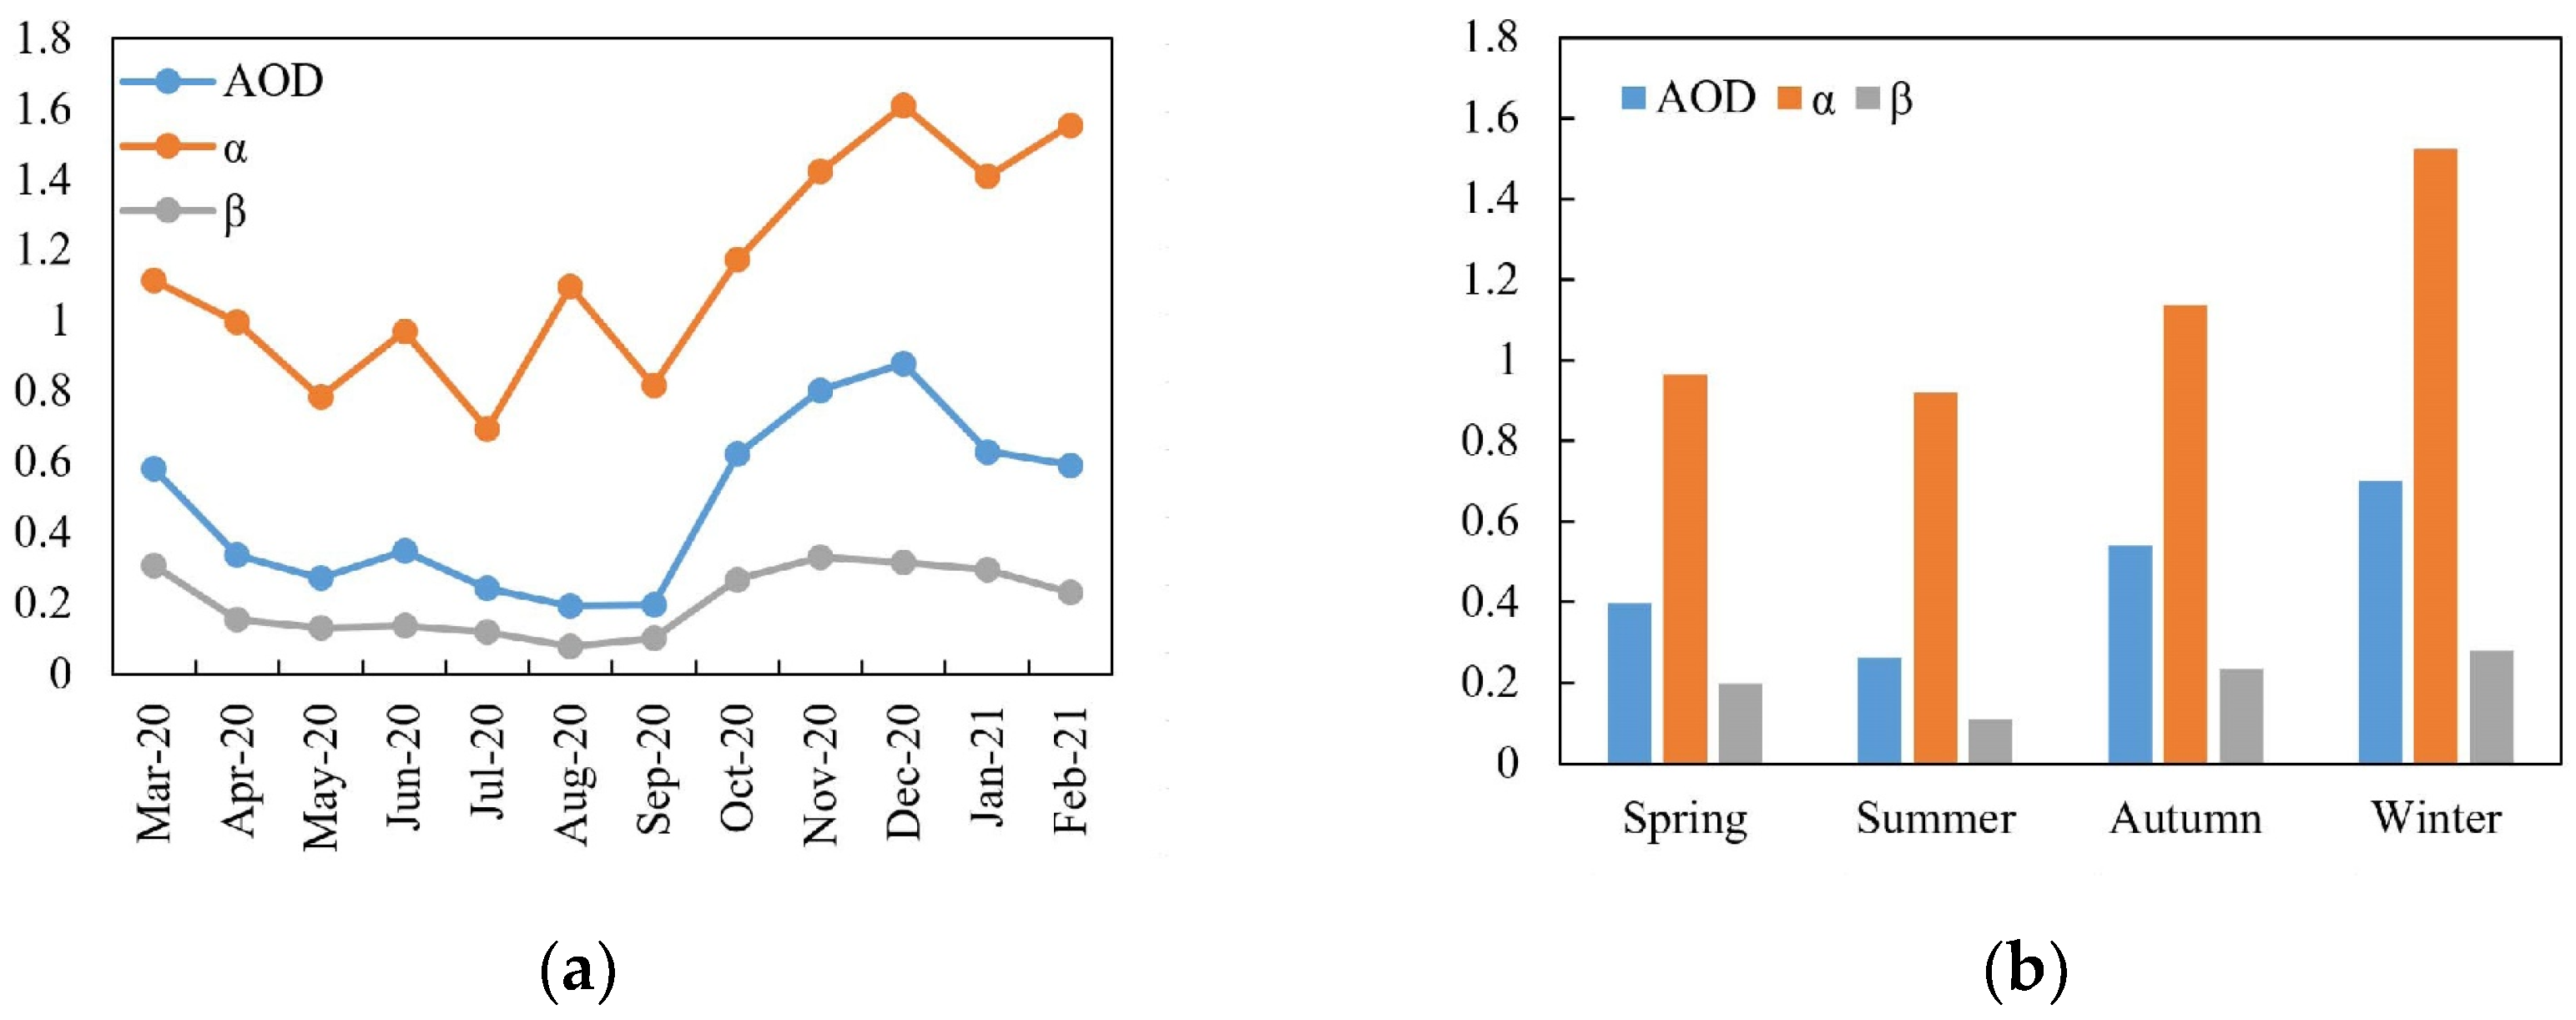
Figure 4 shows the variation trend of AOD, α, and β parameters in Shouxian from March 2020 to February 2021. AOD changes significantly during the study period, with the monthly mean ranging from 0.20 to 0.88, with the overall mean being 0.48 ± 0.24, which is at a relatively high level. AOD decreased from March to August 2020 in general, slightly increased in June compared with May, and reached the lowest point in the study period in August. AOD increased from August to December 2020, but an increase was not evident from August to September. From December 2020 to February 2021, AOD showed a downward trend and a peaked in December. According to meteorological standards, March to May is defined as spring, June to August as summer, September to November as autumn, and December to February as winter. During the observation, the maximum seasonal mean of AOD was 0.76 in the winter, followed by 0.54 in the autumn, 0.40 in the spring, and 0.26 in the summer. The maximum turbidity coefficient β appeared in November (0.33) and the minimum value in August (0.08) during the observation period. The variation trend of AOD and β was highly consistent. This shows that the AOD of atmospheric aerosol increased when the aerosol mass concentration increased at a certain time. During the study, the monthly mean value of α was between 0.69 and 1.61, involving mainly continental and urban aerosols. From the perspective of monthly change, it was close to the continental type from March to October 2020, and the fluctuation change was relative to the urban type from March to October 2020. In terms of seasonal variation, it was close to urban aerosol in winter, which was 1.5248, and continental aerosol in spring, summer, and autumn, which were 0.9652, 0.9203, and 1.1382, respectively.
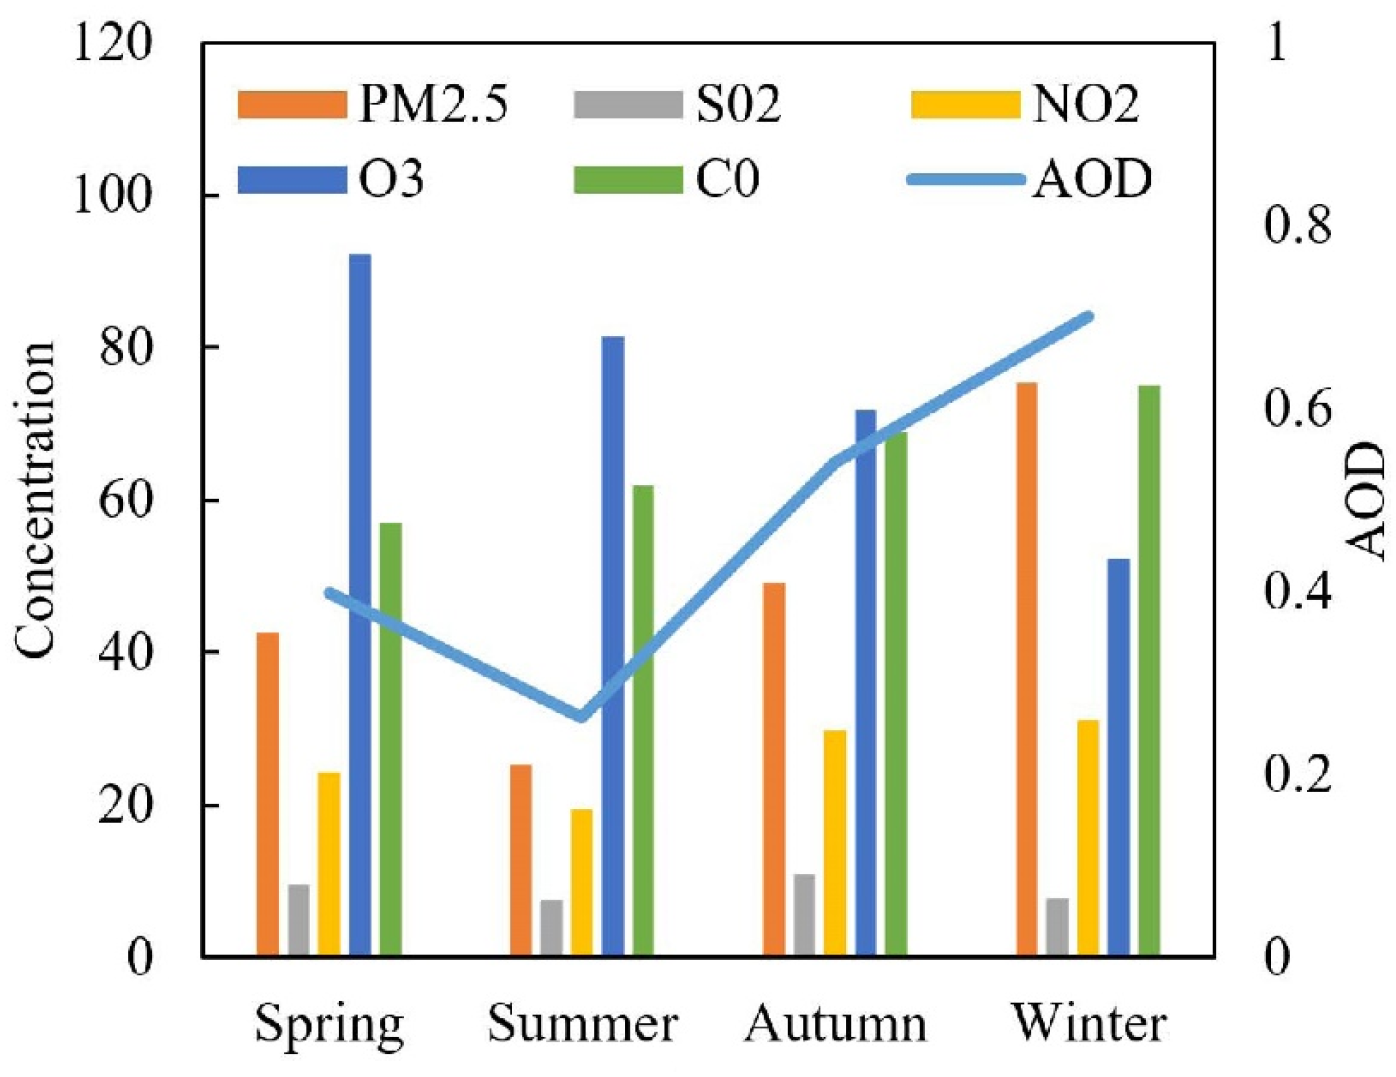
Studies have shown that the seasonal distribution of persistent regional haze processes in the Jianghuai region where Shouxian is located occurred most in winter, followed by autumn. Haze processes with long duration mainly appeared in December and January [41]. According to the air quality data released by the China meteorological administration, during the study period, the air quality index (AQI) in summer was at the lowest level of the year, and the AQI in winter was at the highest, which was about twice that in summer. In Figure 5, we show the seasonal variation trend of PM2.5, near-surface atmospheric trace gas concentration, and AOD. Table 2 show the partial correlation coefficient between AOD and PM2.5, gas concentrations such as SO2, NO2, O3, and CO. During the study, we can see that the partial correlation coefficient between PM2.5 and AOD is 0.7902, showing a significant correlation. PM2.5 is one of the main factors causing the change of AOD. AOD and O3 concentration show a negative correlation trend. Heavy aerosol pollution can inhibit the generation of surface ozone, which is consistent with the research of Deng et al. [42], Bian et al. [43], and Cai et al. [44]. The correlation between SO2, O3, CO, and AOD is weak. The pollution was light in the summer of 2020 in Shouxian. Shouxian is located in the East Asian monsoon region, with frequent precipitation and apparent wet deposition of particles, so the AOD and β in summer are low. With the increase of humidity in autumn and winter during the observation, the moisture absorption of aerosol particles increases. At the same time, the decline of solar radiation leads to the decrease of boundary layer height and the weakening of the vertical diffusion conditions of the atmosphere, which increases the concentration of near-surface particles. Biomass burning is the primary source of light-absorbing organic carbon and black carbon aerosols in the atmosphere [45]. It is also one of the reasons for the rise in PM2.5 mass concentration [46]. According to the daily estimates of biomass burning emissions released by the Global Fire Assimilation System (GFAS), the biomass burning in the Shouxian area mainly occurred in winter during the study period; this is one of the reasons why the mean AOD in the winter was at a high level [47]. Biomass burning increases atmospheric turbidity and makes β have a high value. The small particle size aerosol emitted by biomass burning and the heating in winter makes the value of wavelength index α higher, greatly affected by man-made emissions, consistent with the severe pollution in the winter. The α value in the spring and summer of 2020 was relatively low, indicating larger particle size particles in the spring and the summer than in the other two seasons.
4.4. Single Scattering Albedo
Table 3 shows the aerosol single scattering albedo (SSA) in different studies. It can be seen from the table that the SSA during the observation is very close to the observation results of Huo in Shouxian and the international atmospheric radiometry program (ARM) in Shouxian in 2008. The results show that the ratio between aerosol absorption extinction and scattering extinction in Shouxian has changed little since 2008. Compared with the other four areas, the single scattering albedo in the Shouxian is more extensive, reflecting the strong scattering and weak aerosol absorption in Shouxian. Shouxian is located in the Huaihe River Basin, with less dust weather, and the particles are mainly local emissions and secondary generated fine-grained aerosols. At the same time, because farmland’s underlying surface dominates the area, the contribution of traffic sources with high absorption characteristics is low.
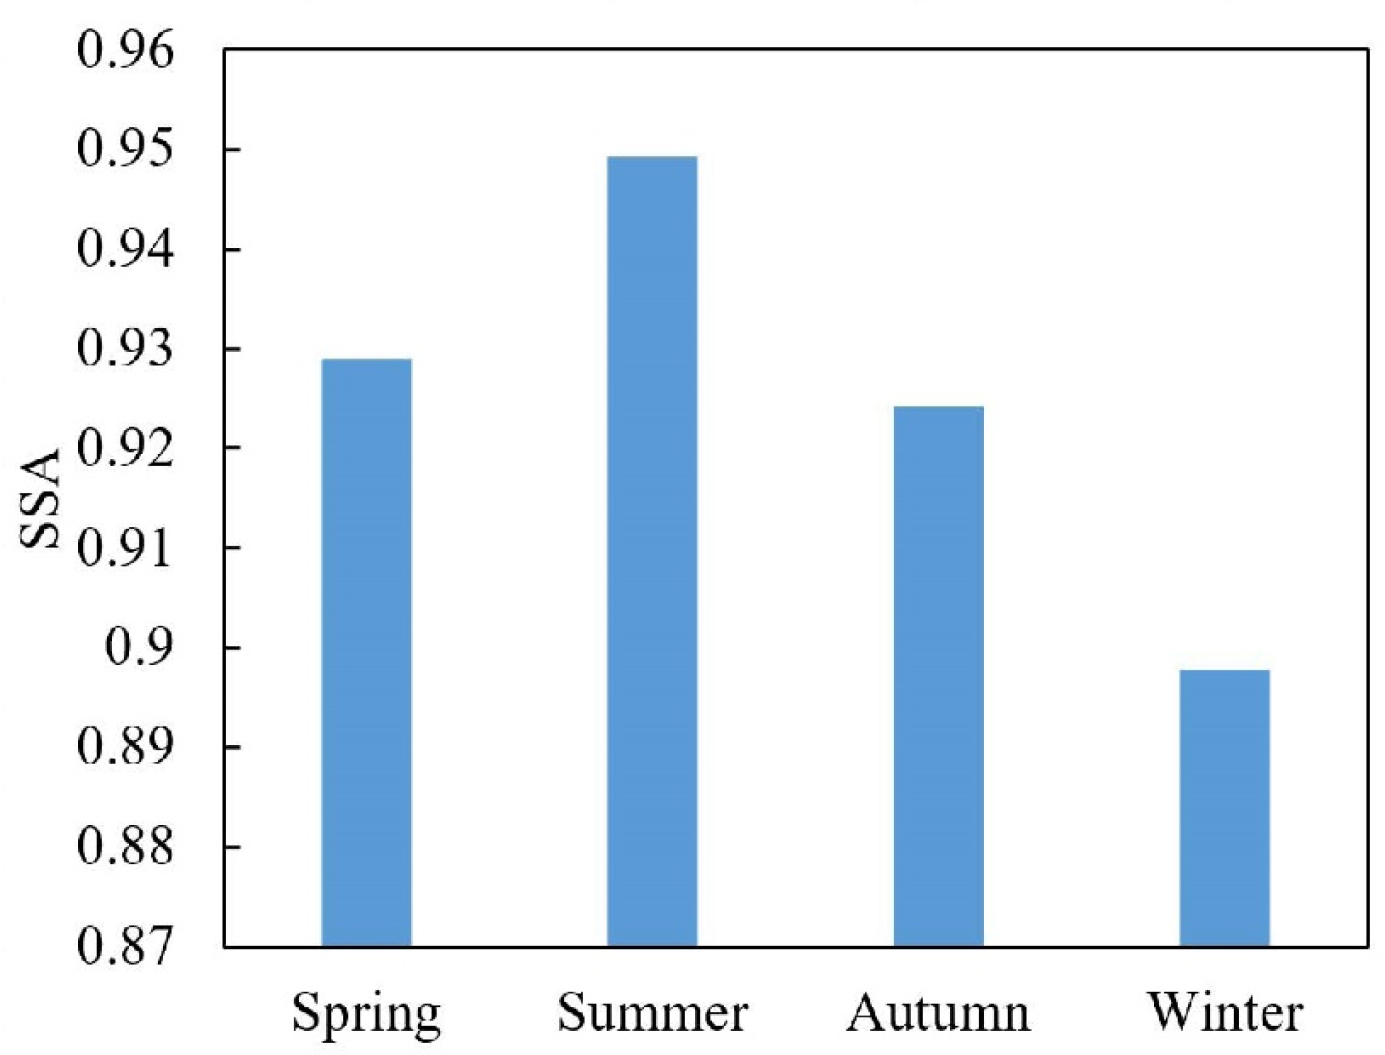
The single scattering albedo depends on the relative size of aerosol scattering properties and absorption properties. During the study, there is more rainfall in summer, and the scattering effect is enhanced by the hygroscopic growth, making the single scattering albedo slightly higher. In winter, biomass burning emits absorbing aerosol such as organic carbon and black carbon aerosols, resulting in the decrease of SSA [52]. The temperature is low, heating combustion volume increases, there is low combustion efficiency, and motor vehicles exhaust emissions increases. The winter atmosphere is stable, boundary layer height is low, and black carbon aerosol vertical diffusion space is reduced. The various adverse conditions superimposed together lead to increased black carbon content with strong absorption capacity and single scattering albedo slightly lower; the aerosol in Shouxian showed strong absorption characteristics. Therefore, as shown in Figure 6, the single scattering albedo in Shouxian is higher in summer and lower in autumn.
5. Conclusions
In this paper, two cloud screening methods were used to process and retrieve the measured data of PSR from March 2020 to February 2021 in Shouxian. We used the obtained data to analyze the AOD and Angström parameters α and β, and the conclusions are as follows:
- The variation trend of the retrieval results of the clustering method and the multiplet method is consistent, while the fitting coefficient is 0.921. The clustering method can flag thin clouds better, and some effective data points may be mistaken, with less effective points and the number of days than the multiplet method at the same time.
- The diurnal variation of AOD in Shouxian can be divided into three types: Flat type, convex type, and concave type. The flat type has the lowest frequency and occasionally appears in April and September. In contrast, the convex type mainly appears from April to September, and the concave type mainly occurs from October to next March—the main variation types.
- During the observation, the overall average value of AOD in Shouxian was 0.48, which is at a higher level. Owing to the influence of climate, precipitation, and other factors, August had the lowest monthly average value, and the highest was in December. The average AOD was the highest in winter of the study, and in summer was the smallest. The variation trend of AOD and β was highly consistent, and the monthly mean value of α was between 0.69 and 1.61, involving mainly continental and urban aerosols.
- Compared with other regions, the single scattering albedo in the Shouxian was high, reflecting the strong scattering and weak aerosol absorption in Shouxian. Biomass combustion emitted organic carbon and black carbon aerosols, resulting in lower SSA in winter during the observation.
In the experiment, it was found that the clustering method is effective in flagging thin clouds, but at the same time, effective points may be wrongly marked. It is not clear whether the probability of mistaking is within the acceptable range. The clustering method is proposed for PFR, but for the PSR we used the number of the most suitable neighbor points has not been verified by a large number of experiments, which need to be carried out in further studies.
Author Contributions
Conceptualization, formal analysis, investigation, L.X., H.L. and C.Q.; data curation, data acquisition, Y.Z., S.L. and X.L.; writing—original draft preparation, H.L.; writing—review and editing, L.X.; visualization, H.L.; supervision, C.Q.; project administration, L.X. All authors have read and agreed to the published version of the manuscript.
Funding
This work was supported in part by the National Key R&D Plan of China under Grant 2018YFB0504604.
Institutional Review Board Statement
Not applicable.
Informed Consent Statement
Not applicable.
Data Availability Statement
The data presented in this study are available on request from the corresponding author.
Conflicts of Interest
The authors declare no conflict of interest.
References
- Mou, F.S.; Li, A.; Xie, P.H.; Wang, Y.; Xu, J.; Chen, H.; Zhang, J.; Wu, F.C. Retrieval of aerosol optical properties at Hefei by sun-photometer CE318 data. Infrared Laser Eng. 2016, 45, 168–173. [Google Scholar] [CrossRef]
- Jerez, S.; Palacios-Peña, L.; Gutiérrez, C.; Jiménez-Guerrero, P.; López-Romero, J.M.; Sarabia, E.P.; Montávez, J.P. Sensitivity of surface solar radiation to aerosol–radiation and aerosol–cloud interactions over Europe in WRFv3.6.1 climatic runs with fully interactive aerosols. Geosci. Model Dev. 2021, 14, 1533–1551. [Google Scholar] [CrossRef]
- Sun, Y.; Tang, B.H. Estimation of Net Surface Shortwave Radiation From Remotely Sensed Data Under Dust Aerosol Conditions. IEEE Access 2021, 9, 52718–52727. [Google Scholar] [CrossRef]
- Boucher, O.; Randall, D.; Artaxo, P.; Bretherton, C.; Feingold, G.; Forster, P.; Kerminen, V.M.; Kondo, Y.; Liao, H.; Lohmann, U.; et al. Clouds and Aerosols. In Climate Change 2013: The Physical Sci-ence Basis: Working Group I Contribution to the Fifth Assessment Report of the Intergovernmental Panel on Climate Change; Stocker, T.F., Qin, D., Plattner, G.-K., Tignor, M., Allen, S.K., Boschung, J., Nauels, A., Xia, Y., Bex, V., Midgley, P.M., Eds.; Cambridge University Press: Cambridge, UK; New York, NY, USA, 2013. [Google Scholar]
- Tu, Q.G.; Hao, Z.Z.; Yan, Y.W.; Tao, B.Y.; Chung, C.; Kim, S. Aerosol Optical Properties around the East China Seas Based on AERONET Measurements. Atmosphere 2021, 12, 642. [Google Scholar] [CrossRef]
- Su, H.; Cheng, Y.F.; Poschl, U. New Multiphase Chemical Processes Influencing Atmospheric Aerosols, Air Quality, and Climate in the Anthropocene. Acc. Chem. Res. 2020, 53, 2034–2043. [Google Scholar] [CrossRef]
- Yang, S.H.; Jeong, J.I.; Park, R.J.; Kim, M.J. Impact of Meteorological Changes on Particulate Matter and Aerosol Optical Depth in Seoul during the Months of June over Recent Decades. Atmosphere 2020, 11, 1282. [Google Scholar] [CrossRef]
- Bodor, K.; Bodor, Z.; Szép, R. Spatial distribution of trace elements (As, Cd, Ni, Pb) from PM10 aerosols and human health impact assessment in an Eastern European country, Romania. Environ. Monit. Assess. 2021, 193, 176. [Google Scholar] [CrossRef]
- Eltahan, M.; Alahmadi, S. Numerical Dust Storm Simulation Using Modified Geographical Domain and Data Assimilation: 3DVAR and 4DVAR (WRF-Chem/WRFDA). IEEE Access 2019, 7, 128980–128989. [Google Scholar] [CrossRef]
- Xie, X.H. Researches on Aerosol Optical Properties of Kunming Using CE318 Sunphotometer and MODIS Measurements. Master’s Thesis, Yunnan University, Kunming, China, 2015. [Google Scholar]
- Zhang, Z.J. Study on Characteristics of Aerosol Optical Property and Spatio-Temporal Distribution Based on Multi-Source Datasets. Ph.D. Thesis, Lanzhou University, Lanzhou, China, 2019. [Google Scholar]
- Duan, L.; Yu, Q.; Zhang, Q.; Wang, Z.F.; Pan, Y.P.; Larssen, T.; Tang, J.; Mulder, J. Acid deposition in Asia: Emissions, deposition, and ecosystem effects. Atmos. Environ. 2016, 146, 55–69. [Google Scholar] [CrossRef] [Green Version]
- Zhao, J.F.; Jiang, Y.Q.; Zhan, X.; Kong, X.N. Advances in Research of Impacts of Aerosol Pollution on Crop in China. Adv. Meteorol. Sci. Technol. 2018, 8, 6–10. [Google Scholar] [CrossRef]
- Xue, Y.; He, X.W.; de Leeuw, G.; Mei, L.L.; Che, Y.H.; Rippin, W.; Guang, J.; Hu, Y.C. Long-time series aerosol optical depth retrieval from AVHRR data over land in North China and Central Europe. Remote Sens. Environ. 2017, 198, 471–489. [Google Scholar] [CrossRef]
- Fan, X.H.; Chen, H.B.; Xia, X.A. Progress in observation studies of atmospheric aerosol radiative properties in China. Chin. J. Atmos. Sci. 2013, 37, 477–498. [Google Scholar] [CrossRef]
- Wu, Y.F.; Zhu, J.; Che, H.Z.; Xia, X.G.; Zhang, R.J. Column-integrated aerosol optical properties and direct radiative forcing based on sun photometer measurements at a semi-arid rural site in Northeast China. Atmos. Res. 2015, 157, 56–65. [Google Scholar] [CrossRef]
- Lin, H.F.; Xin, J.Y.; Zhang, W.Y.; Wang, Y.S.; Liu, Z.R.; Chen, C.L. Comparison of atmospheric particulate matter and aerosol optical depth in Beijing City. Environ. Sci. 2013, 34, 826–834. [Google Scholar] [CrossRef]
- Niranjan, P.S. Variations of Aerosol Optical Depth in Bhaktapur, Nepal. J. Inst. Eng. 2018, 13, 133–138. [Google Scholar] [CrossRef] [Green Version]
- Ningombam, S.S.; Larson, E.J.L.; Dumka, U.C.; Estelles, V.; Campanelli, M.; Steve, C. Long-term (1995–2018) aerosol optical depth derived using ground based AERONET and SKYNET measurements from aerosol aged-background sites. Atmos. Pollut. Res. 2019, 10, 608–620. [Google Scholar] [CrossRef]
- Jin, S.K.; Ma, Y.Y.; Zhang, M.; Gong, W.; Dubovik, O.; Liu, B.M.; Shi, Y.F.; Yang, C.L. Retrieval of 500 m Aerosol Optical Depths from MODIS Measurements over Urban Surfaces under Heavy Aerosol Loading Conditions in Winter. Remote Sens. 2019, 11, 2218. [Google Scholar] [CrossRef] [Green Version]
- He, X.W.; Zhou, R.; Yao, Y.; Shen, Z.X.; Zhu, J. The spatiotemporal variations of aerosol types in representative sites of China basing on the Aerosol Robotic Network (AERONET). China Environ. Sci. 2020, 40, 485–496. [Google Scholar] [CrossRef]
- Liu, J.J.; Wang, G.Y.; Xu, Z.X.; Liu, Y.; Wang, J.; Yan, Q.; Hua, D.X. Study on calibration method of sky radiometer and aerosol optical properties in Xi’an region. Infrared Laser Eng. 2020, 49, 257–263. [Google Scholar] [CrossRef]
- Pang, S.T. Optical Characteristics of Aerosol in China Based on MERRA-2 Reanalysis and AERONET Ground-Based Remote sensing. Master’s Thesis, Lanzhou University, Lanzhou, China, 2020. [Google Scholar]
- Wang, H.T.; Wang, Y.; Yuan, Q.Q. Validation and Spatiotemporal Analysis of MODIS Multi-angle Atmospheric Calibration Aerosol Products in China from 2008 to 2016. Remote Sens. Technol. Appl. 2021, 36, 217–228. [Google Scholar] [CrossRef]
- Lu, Z.R. Study of Aerosol Optical Properties in Shouxian, Anhui Based on ARM Mobile Facility. Master’s Thesis, Nanjing University of Information Science and Technology, Nanjing, China, 2014. [Google Scholar]
- Fan, X.H.; Chen, H.B.; Xia, X.G.; Li, Z.Q.; Cribb, M. Aerosol optical properties from the Atmospheric Radiation Measurement Mobile Facility at Shouxian, China. J. Geophys. Res.-Atmos. 2010, 115, 13. [Google Scholar] [CrossRef] [Green Version]
- Qiu, Y.J.; Dong, X.Q.; Xi, B.K.; Wang, Z.H. Effects of Clouds and Aerosols on Surface Radiation Budget Inferred from DOE AMF at Shouxian, China. Atmos. Ocean. Sci. Lett. 2013, 6, 39–43. [Google Scholar] [CrossRef] [Green Version]
- Tang, J.P.; Wang, P.C.; Duan, M.Z.; Chen, H.B.; Xia, X.A.; Liao, H. An Evidence of Aerosol Indirect Effect on Stratus Clouds from the Integrated Ground-Based Measurements at the ARM Shouxian Site. Atmos. Ocean. Sci. Lett. 2011, 4, 65–69. [Google Scholar] [CrossRef]
- Huo, Y.F.; Huang, Y.; Deng, X.L.; Zhai, J.; Yang, G.Y.; Yu, C.X. Study on Aerosol Optical Properties in Shouxian Region. Environ. Sci. Technol. 2017, 40, 50–57. [Google Scholar] [CrossRef]
- Fan, W.; Chen, K.; Ling, X.F.; Xun, S.P.; Yu, C.X. Atmospheric Optical Characteristics of National Climate Observation in Shouxian County in Winter. Laser Optoelectron. Prog. 2019, 56, 9–18. [Google Scholar] [CrossRef]
- Torres, O.O. Omi/Aura Near Uv Aerosol Optical Depth and Single Scattering Albedo L3 1 Day 1.0 Degree X 1.0 Degree V3. NASA Goddard Space Flight Center, Goddard Earth Sciences Data and Information Services Center (GES DISC). 2008. Available online: https://disc.gsfc.nasa.gov/datasets/OMAERUV_003/summary (accessed on 21 August 2021).
- China National Environmental Monitoring Centre. Available online: http://www.cnemc.cn/ (accessed on 28 February 2021).
- Duffie, J.A.; Beckman, W.A. Solar Radiation. In Solar Engineering of Thermal Processes, 4th ed.; Duffie, J.A., Beckman, W.A., Eds.; John Wiley & Sons, Inc.: Hoboken, NJ, USA, 2013. [Google Scholar] [CrossRef]
- Kasten, F. A new table and approximation formula for the relative optial air mass. Arch. Für Meteorol. Geophys. Und Bioklimatol. Ser. B 1965, 14, 206–223. [Google Scholar] [CrossRef]
- Bourges, B. Improvement in solar declination computation. Sol. Energy 1985, 35, 367–369. [Google Scholar] [CrossRef] [Green Version]
- Angström, A. On the Atmospheric Transmission of Sun Radiation and on Dust in the Air. Geogr. Ann. 1929, 11, 156–166. [Google Scholar]
- Smirnov, A.; Holben, B.N.; Eck, T.F.; Dubovik, O.; Slutsker, I. Cloud-Screening and Quality Control Algorithms for the AERONET Database. Remote Sens. Environ. 2000, 73, 337–349. [Google Scholar] [CrossRef]
- Schenzinger, V.; Kreuter, A. Reducing cloud contamination in aerosol optical depth (AOD) measurements. Atmos. Meas. Tech. 2021, 14, 2787–2798. [Google Scholar] [CrossRef]
- Shen, Y.B.; Shen, Z.B.; Wang, W.F. Atmospheric Aerosol Optical Thickness and Dusty Weather in Northern China in Spring of 2001. Plateau Meteorol. 2003, 22, 185–190. [Google Scholar] [CrossRef]
- Wehrli, C. GAWPFR: A Network of Aerosol Optical Depth Observatioins with Precision Filter Radiometers. In WMO/GAW Experts Workshop on a Global Surface-Based Network for Long Term Observations of Column Aerosol Optical Properties; Balten-sperger, U., Barrie, L., Wehrli, C., Eds.; World Meteorological Organization (WMO): Geneva, Switzerland, 2005; pp. 36–39. [Google Scholar]
- Shi, C.E.; Zhang, H.; Yang, Y.J.; Zhang, H.Q. The trend of persistent regional haze in Anhui Province and corresponding characteristics of aerosol pollution. China Environ. Sci. 2018, 38, 1231–1242. [Google Scholar] [CrossRef]
- Deng, X.J.; Zhou, D.; Wu, X.X.; Tie, H.B.; Tan, F.; Li, X.Y.B.; Deng, T.; Jiang, D.H. Effect of atmospheric aerosol on surface ozone variation over the Pearl River Delta region. Sci. China Earth Sci. 2011, 54, 744–752. [Google Scholar] [CrossRef]
- Bian, H.; Han, S.Q.; Tie, X.X.; Sun, M.L.; Liu, A.X. Evidence of impact of aerosols on surface ozone concentration in Tianjin, China. Atmos. Environ. 2007, 41, 4672–4681. [Google Scholar] [CrossRef]
- Cai, Y.F.; Wang, T.J.; Xie, M.; Han, Y. Impacts of atmospheric particles on surface ozone in Nanjing. Environ. Res. 2013, 18, 251–260. [Google Scholar]
- Sun, T.Z.; Che, H.Z.; Qi, B.; Wang, Y.Q.; Dong, Y.S.; Xia, X.G.; Wang, H.; Gui, K.; Zheng, Y.; Zhao, H.J.; et al. Zhang. Aerosol optical characteristics and their vertical distributions under enhanced haze pollution events: Effect of the regional transport of different aerosol types over eastern China. Atmos. Chem. Phys. 2018, 18, 2949–2971. [Google Scholar] [CrossRef] [Green Version]
- Pani, S.K.; Lin, N.H.; Chantara, S.; Wang, S.H.; Khamkaew, C.; Prapamontol, T.; Janjai, S. Radiative response of biomass-burning aerosols over an urban atmosphere in northern peninsular Southeast Asia. Sci. Total Env. 2018, 633, 892–911. [Google Scholar] [CrossRef] [PubMed]
- Nguyen, T.T.N.; Pham, H.V.; Lasko, K.; Bui, M.T.; Laffly, D.; Jourdan, A.; Bui, H.Q. Spatiotemporal analysis of ground and satellite-based aerosol for air quality assessment in the Southeast Asia region. Environ. Pollut. 2019, 255, 113106. [Google Scholar] [CrossRef]
- Liu, Q. Study on the Impacts of Aerosols on Surface Ozone in Shanghai. Master’s Thesis, Donghua University, Shanghai, China, 2012. [Google Scholar]
- Yang, H.L.; Li, L.; Yang, S.; Lu, C.; Chen, X.D.; Liu, A.M. The Measurement of Aerosol Optical Properties Over Shenzhen. Acta Photonica Sin. 2012, 41, 1427–1434. [Google Scholar] [CrossRef]
- Zhao, Y.Y. Research on Aerosol Scattering and Absorption Characteristics in Xuzhou. Master’s Thesis, China University of Mining and Technology, Xuzhou, China, 2019. [Google Scholar]
- Chang, L.; Li, J.; Chu, Y.Q.; Dong, Y.M.; Tan, W.S.; Xu, X.J.; Ren, J.J.; Tian, X.Q.; Li, C.; Liu, Z. Variability of surface aerosol properties at an urban site in Beijing based on two years of in-situ measurements. Atmos. Res. 2021, 256, 105562. [Google Scholar] [CrossRef]
- Liu, C.; Yang, L.K.; Che, H.Z.; Xia, X.G.; Zhao, H.J.; Wang, H.; Gui, K.; Zheng, Y.; Sun, T.Z.; Li, X.P.; et al. Aerosol Optical Properties over an Urban Site in Central China Determined Using Ground-based Sun Photometer Measurements. Aerosol Air Qual. Res. 2019, 19, 620–638. [Google Scholar] [CrossRef]
Figure 1.
The PSR deployed in Shouxian.

Figure 2.
Comparative analysis of retrieval results of the multiplet method and the clustering method. (a) Fitting of retrieval results. (b) Trend and relative deviation of retrieval results.
Figure 2.
Comparative analysis of retrieval results of the multiplet method and the clustering method. (a) Fitting of retrieval results. (b) Trend and relative deviation of retrieval results.

Figure 3.
Diurnal variation of AOD in Shouxian. (a) Convex type. (b) Concave type. (c) Flat type.

Figure 4.
Analysis of variation of AOD, α, and β parameters in Shouxian from March 2020 to February 2021. (a) Monthly variation. (b) Seasonal variation.
Figure 4.
Analysis of variation of AOD, α, and β parameters in Shouxian from March 2020 to February 2021. (a) Monthly variation. (b) Seasonal variation.

Figure 5.
Seasonal variation trend of PM2.5, near-surface atmospheric trace gas concentration, and AOD during the study. AOD is dimensionless and plotted on the sub coordinate axis, the unit of CO concentration is (mg/m3)*100, and the others are μg/m3.
Figure 5.
Seasonal variation trend of PM2.5, near-surface atmospheric trace gas concentration, and AOD during the study. AOD is dimensionless and plotted on the sub coordinate axis, the unit of CO concentration is (mg/m3)*100, and the others are μg/m3.

Figure 6.
Seasonal distribution of single scattering albedo during the study period.


Table 1.
Technical parameters of the PSR sun photometer.
| Index Items | Technical Indicators |
|---|---|
| Number of bands | 9 |
| Central wavelength | 340 nm, 380 nm, 440 nm, 500 nm, 670 nm, 870 nm, 940 nm, 1020 nm, 1640 nm (replaceable) |
| Bandwidth | 2–340 nm, 4–380 nm, 10–440 nm, 500 nm, 670 nm, 870 nm, 940 nm, 1020 nm, 1640 nm |
| Field of view | ≤1.3° |
| Sun tracking accuracy | 0.1° |
| Temperature control range and accuracy | 25 ± 0.1 °C |
| Rotation angle of sun tracker | horizontal 0 ~ 360°, vertical 0 ~ 180° |
| Operating temperature range | −30 °C~ +60 °C |
| Relative humidity | 0~100% RH |
| Communication mode | serial port/CAN bus/BeiDou Satellite/4G (optional) |
| Power supply mode | lightning protection/220 V AC/lithium battery/solar battery (optional) |
| Environmental perception | temperature, humidity, rain, air pressure |
Table 2.
The partial correlation coefficient between AOD and PM2.5, SO2, NO2, O3, and CO.
| AOD and PM2.5 | AOD and SO2 | AOD and NO2 | AOD and O3 | AOD and CO | |
|---|---|---|---|---|---|
| Partial correlation coefficient | 0.7902 | −0.0524 | −0.2363 | −0.5323 | −0.0356 |
Table 3.
Comparison of aerosol single scattering albedo in different studies.
| Location | Observation Time | λ (nm) | SSA | Citation |
|---|---|---|---|---|
| Shouxian | 2020/03–2021/02 | σsp = 500,σap = 500 | 0.93 ± 0.02 | This study |
| Shouxian | 2014/09–2015/08 | σsp = 525,σap = 520 | 0.92 ± 0.02 | [29] |
| Shouxian | 2008/05–2008/12 | σsp = 550,σap = 550 | 0.92 ± 0.03 | [26] |
| Pudong, Shanghai | 2008–2010 | σsp = 525,σap = 532 | 0.82 ± 0.01 | [48] |
| Shenzhen | 2010/12–2011/08 | σsp = 525,σap = 532 | 0.81 ± 0.08 | [49] |
| Xuzhou | 2014–2017 | σsp = 525,σap = 532 | 0.93 ± 0.05 | [50] |
| Beijing | 2017/09–2019/08 | σsp = 525,σap = 525 | 0.88 ± 0.07 | [51] |
Publisher’s Note: MDPI stays neutral with regard to jurisdictional claims in published maps and institutional affiliations. |
© 2021 by the authors. Licensee MDPI, Basel, Switzerland. This article is an open access article distributed under the terms and conditions of the Creative Commons Attribution (CC BY) license (https://creativecommons.org/licenses/by/4.0/).
Share and Cite
MDPI and ACS Style
Xun, L.; Lu, H.; Qian, C.; Zhang, Y.; Lyu, S.; Li, X. Analysis of Aerosol Optical Depth from Sun Photometer at Shouxian, China. Atmosphere 2021, 12, 1226. https://doi.org/10.3390/atmos12091226
AMA Style
Xun L, Lu H, Qian C, Zhang Y, Lyu S, Li X. Analysis of Aerosol Optical Depth from Sun Photometer at Shouxian, China. Atmosphere. 2021; 12(9):1226. https://doi.org/10.3390/atmos12091226
Chicago/Turabian StyleXun, Lina, Hui Lu, Congcong Qian, Yong Zhang, Shanshan Lyu, and Xin Li. 2021. "Analysis of Aerosol Optical Depth from Sun Photometer at Shouxian, China" Atmosphere 12, no. 9: 1226. https://doi.org/10.3390/atmos12091226
Note that from the first issue of 2016, this journal uses article numbers instead of page numbers. See further details here.