Article

Tropospheric Delay in the Neapolitan and Vesuvius Areas (Italy) by Means of a Dense GPS Array: A Contribution for Weather Forecasting and Climate Monitoring

1
Dipartimento di Scienze della Terra, dell’Ambiente e delle Risorse (DiSTAR), University “Federico II” of Naples, 80138 Napoli, Italy
2
Research Group “Geodesia”, Universidad Complutense de Madrid, 28040 Madrid, Spain
3
Istituto Nazionale di Geofisica e Vulcanologia, Osservatorio Vesuviano, via Diocleziano 328, 80124 Napoli, Italy
4
Department of Physics “E.R. Caianiello”, University of Salerno, via Giovanni Paolo II 132, 84084 Salerno, Italy
*
Author to whom correspondence should be addressed.
Atmosphere 2021, 12(9), 1225; https://doi.org/10.3390/atmos12091225
Submission received: 1 August 2021 / Revised: 15 September 2021 / Accepted: 16 September 2021 / Published: 18 September 2021

Abstract

:
Studying the spatiotemporal distribution and motion of water vapour (WV), the most variable greenhouse gas in the troposphere, is pivotal, not only for meteorology and climatology, but for geodesy, too. In fact, WV variability degrades, in an unpredictable way, almost all geodetic observation based on the propagation of electromagnetic signal through the atmosphere. We use data collected on a dense GPS network, designed for the purposes of monitoring the active Neapolitan (Italy) volcanoes, to retrieve the tropospheric delay parameters and precipitable water vapour (PWV). This study has two main targets: (a) the analysis of long datasets (11 years) to extract trends of climatological meaning for the region; (b) studying the main features of the time evolution of the PWV during heavy raining events to gain knowledge on the preparatory stages of highly impacting thunderstorms. For the latter target, both differential and precise point positioning (PPP) techniques are used, and the results are compared and critically discussed. An increasing trend, amounting to about 2 mm/decades, has been recognized in the PWV time series, which is in agreement with the results achieved in previous studies for the Mediterranean area. A clear topographic effect is detected for the Vesuvius volcano sector of the network and a linear relationship between PWV and altitude is quantitatively assessed. This signature must be taken into account in any modelling for the atmospheric correction of geodetic and remote-sensing data (e.g., InSAR). Characteristic temporal evolutions were recognized in the PWV in the targeted thunderstorms (which occurred in 2019 and 2020), i.e., a sharp increase a few hours before the main rain event, followed by a rapid decrease when the thunderstorm vanished. Accounting for such a peculiar trend in the PWV could be useful for setting up possible early warning systems for those areas prone to flash flooding, thus potentially providing a tool for disaster risk reduction.

Graphical Abstract

1. Introduction

Climate change presents a threat to human societies. Understanding and prediction of the Earth’s water distribution and its time evolution is essential for life and for a sustainable development of the Earth system. The study and simulation of the water and energy cycles are pivotal to address two present-day scientific questions that are urgent for the environment and society:
  • Are extreme weather events predictable, and how can our forecasting skills be improved?
  • To what extent is today’s regional and global water and energy cycles’ change due to natural variability versus anthropogenic influences?
Over the last decade, the successful launch of several satellite missions [1,2,3,4], directly or indirectly devoted to studying global climate change, such as CHAllenging Minisatellite Payload for geophysical research and application (CHAMP), Gravity Recovery and Climate Experiment (GRACE) and its follow-on projects (GRACE-FO), Constellation observing system for meteorology, Ionosphere and climate (FORMOSAT-3/COSMIC), and Gravity field and steady-state Ocean Circulation Explorer (GOCE), has driven significant advances in the remote sensing of both atmospheric and terrestrial water storage (TWS). TWS and tropospheric water are key variables of the Earth’s climate, impacting both surface water and atmospheric energy budgets. These satellite observations are providing a breakthrough for studying the global water cycle under current and future climate conditions [5].
Water vapour (WV) is a key component in the atmosphere’s thermodynamics, and it is the most variable greenhouse gas in the troposphere as well, so understanding its spatiotemporal distribution is of paramount relevance in meteorological and climatological studies. Due to its high temporal and spatial variations, the WV content in the atmosphere has to be regularly and accurately determined for meteorological and climatological purposes. Since the pioneering paper by Bevis et al. [6] GPS has been applyied in meteorology, mainly for precipitable water vapour (PWV) retrieval, such that the atmospheric effect is being transformed from a noise source, degrading the accuracy of the geodetic observations, into a valuable meteorological probe. The global navigation satellite system (GNSS) has widely demonstrated its potential to probe the Earth’s atmosphere (troposphere and ionosphere), ocean and soil moisture, as well as its cryosphere. Refracted, reflected and scattered GNSS signals have been successfully used to remotely sense the water content on the Earth’s surface and atmosphere with an accuracy comparable to other techniques (e.g., radio soundings, microwave radiometers), with, even, good time resolution and under all meteorological conditions [7,8]. Today’s extensive use of permanent GPS stations, operating for geodetic purposes, offers a tool for a dense and reliable remote sensing of atmospheric water vapor. A number of major worldwide space projects have established GPS meteorology as an operational atmospheric sounding technique (see for instance [3] for the European area).
GNSS data, collected at terrestrial and space-borne stations, have been widely applied for atmospheric sounding, including the detection of tropospheric PWV, ionospheric total electron content (TEC) and atmospheric profile information (e.g., pressure, temperature, humidity, tropopause and ionospheric electron density). These observations have facilitated greater advances in meteorology, climatology, numerical weather models, atmospheric science and space weather. GPS radio occultation (RO) from low Earth-orbiting satellites has widely improved the resolution of atmospheric profiles in making high vertical resolution and global atmospheric measurements [1].
Severe meteorological events, such as a hurricanes, emphasize the need to monitor and track weather using additional observational tools to mitigate these risks. Traditionally, water vapour data has been acquired primarily through the use of water vapour radiometers (WVR) and radiosondes. These techniques of acquiring water vapour data enabled major progress in understanding the processes happening in the atmosphere, while suffering from drawbacks, such as their low spatiotemporal resolution and high operating costs [9].
It is acknowledged that our climate and its extremes are changing [10]. Reliable forecasts of extreme weather and climate events, on short and long time scales, are critical in reducing the potential risks and related damages thereof [11]. Forecasting and monitoring the arrival times and path of extreme thunderstorms, as well as of tropical cyclones, are indispensable tools for issuing early warnings to the public and governments. A so-called Cévenol episode that occurred in the Gard region (Southern France) was studied by means of GPS data by [12]. GPS-derived PWV time series enabled the monitoring of the complete evolution of the convective system associated with the rainfall from the water vapour-accumulation stage through the stagnation of the convective cell, up to the final breakup of the system. The authors of Refs. [13,14] studied a double thunderstorm cluster that developed above the Campania region on 12 October 2012. The storm broke in a heavy rainfall event, which severely damaged Napoli city (with a population of about one million inhabitants) and neighbouring areas. From the analysis of a subset of permanent GPS stations belonging to the NeVoCGPS (Neapolitan Volcanoes Continuous GPS) network, they found clear evidence of an increase in PWV a few hours before the storm. GPS observations in the vicinity of the heavy rainfall area were all consistent with the water vapour depicted in the infrared channel of the Meteo satellites (MSG) in the Euro–Atlantic area. Ejigu et al. [15] studied the characteristics of hurricane Florence, which struck the Eeast coast of the USA in 2018, using a dense ground network of permanent GPS stations. They detected a rise in GPS-derived PWV occurring several hours before Florence’s manifestation.
In this study, data acquired on the dense GNSS NeVoCGPS network, as well as on a meteorological station co-located with one of the network sites were employed. The analysis of the longest time series (11 years) allows the estimation of climatological trends of increasing moisture content in the air, which has resulted in increased rainfall, e greenhouse effect and associated climatic feedback. Moreover, analyses carried out with different methods (differential and PPP) of data collected on two episodes of heavy rain are discussed, as well. GNSS-meteorology is, potentially, effective tool for understanding, modeling and predicting weather and climate extremes, and can contribute toward the implementation of more effective action for disaster risk reduction.
The main goals of this study are: (1) to estimate the long-term temporal variation of water vapor content from the analysis of the NeVoCGPS data, and (2) to investigate, by means of different techniques of GNSS data analysis, the time evolution of PWV during three extreme weather events in the Neapolitan area.

2. Climate Setting of the Study Area
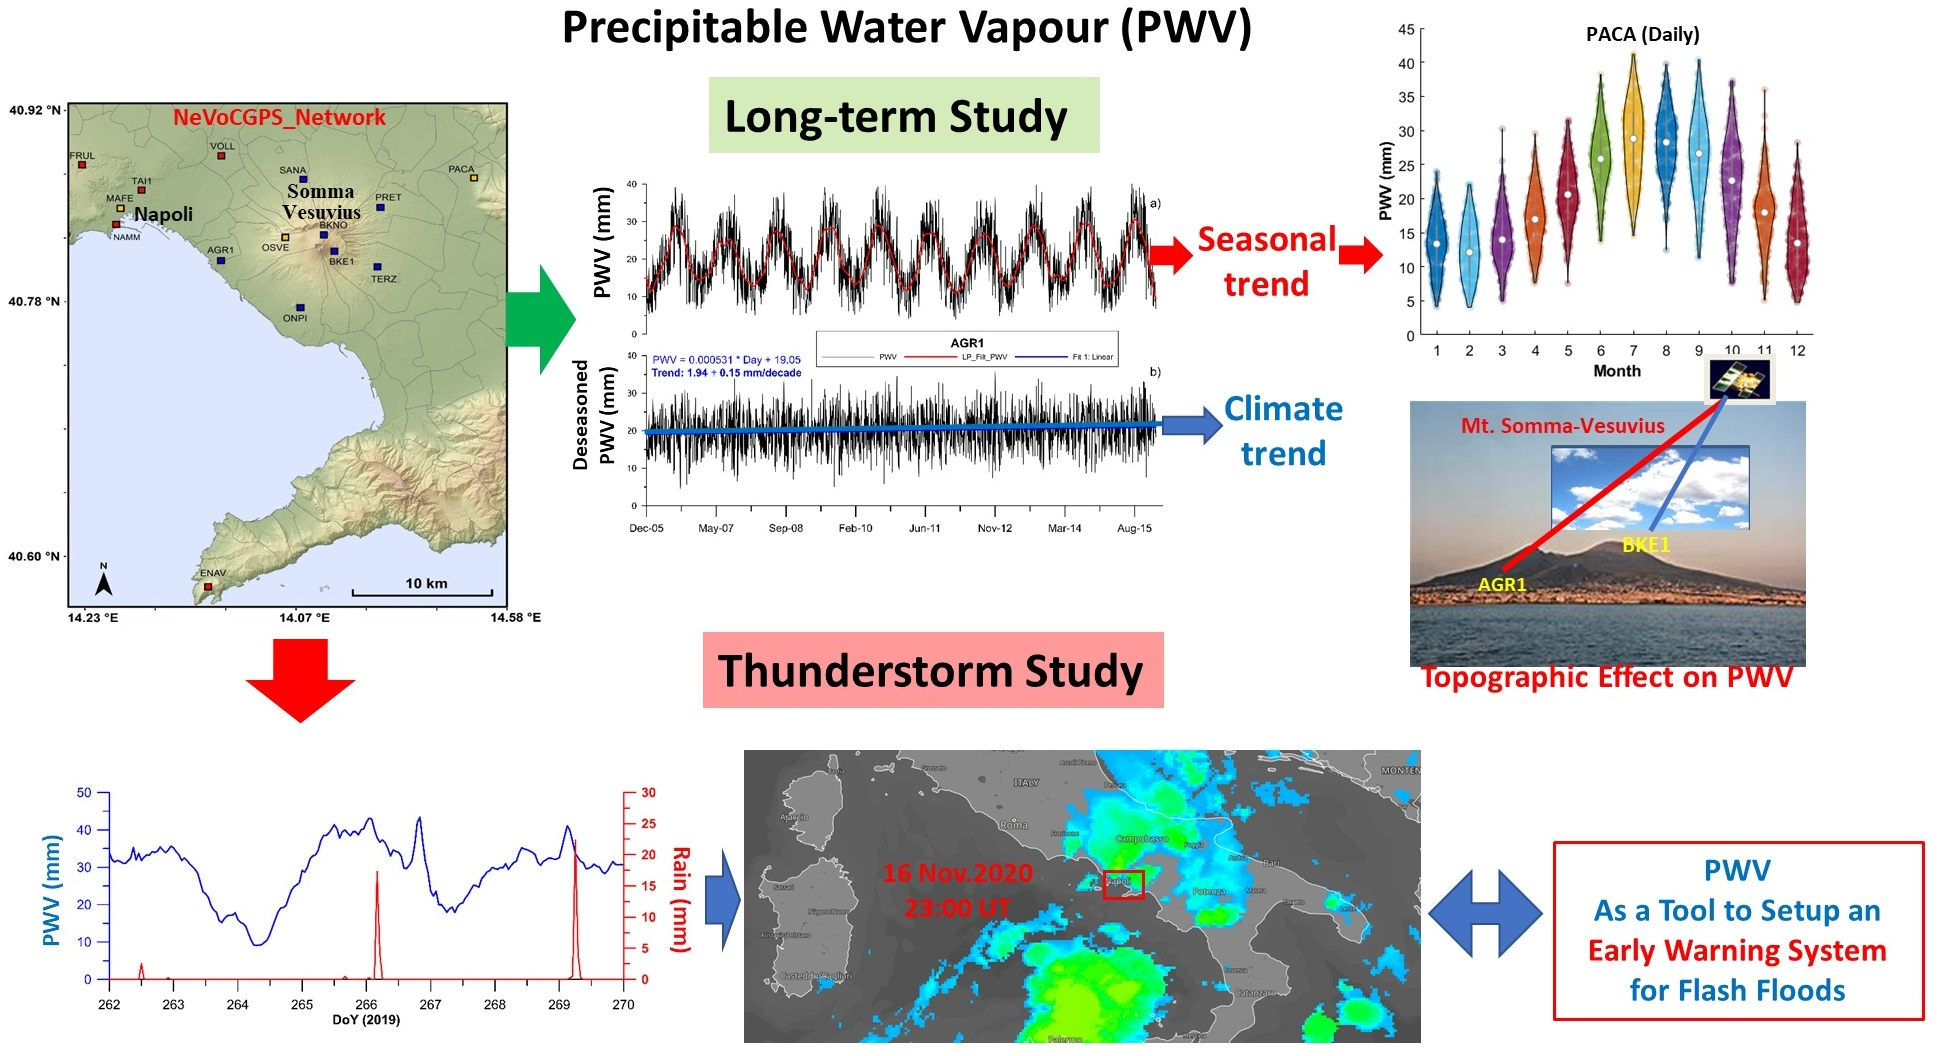
In the study area and Campania region the climate is typically Mediterranean along the coast with warm, sunny and muggy summers and mild, rainy winters; whereas, the inner zones are more continental, with lower temperatures in winter and warm summers. Snow is possible at higher elevations but rare at sea level [16,17]. Regarding landforms, 51% of the total area is hilly, 34% mountainous and the remaining 15% is made up of plains. There are basically two climatic zones in Campania: (a) an area with a milder climate, which is clearly influenced by the presence of the sea, namely the coastal and archipelagic areas; (b) and an area with a harsher climate, namely the inland and mountainous areas. This is where the coldest temperatures occur in winter, but frost and fog can occur in the valleys too, sometimes accompanied by snowfalls that become more and more abundant with distance inland and elevation. In summer, high temperatures can be reached, but the sea and the orography mitigate this. In the urban areas of Naples the temperature (min/max) ranges roughly from 7 °C/13 °C in January to 21 °C/30 °C in August; the annual mean temperature is 17 °C/19 °C [18]. A large part of Campania is exposed to humid westerly or south-westerly winds, and when this synoptic condition occurs, the relative proximity of the Apennine ridge to the coastline causes rather abundant rains, even along the coasts. This scenario largely controls the synoptic patterns as well as the high- and low-pressure frontal boundaries in the region. The rain varies roughly from 50/100 mm in summer (June–August) to 400 mm in Autumn (October–December); the mean annual rain amount is roughly 800–1000 mm [19]. The relative humidity varies between 55% and 70%. The lowest rainfall values are recorded more inland, beyond the Apennine watershed, which tends to raise rainfall values tin the west of up to 2000 mm in some mountainous areas, while beyond the watershed, to the east (in the areas bordering on Apulia) it drops rapidly, to 600–700 mm (rain shadow). On Mt. Somma–Vesuvius, the vertical temperature gradient is, on average, −0.6 °C ÷ 0.7 °C/100 m of altitude. At higher elevations on the volcano—up to nearly 500 m—the relative humidity increases slightly, but towards its top, the climate becomes increasingly dry, and the top of the volcano is arid. So, the annual rainfall in the Vesuvius Park is, on average, lower than in in Naples (500 ÷ 600 mm). This scenario is not significantly affected by rare weather episodes from the east or north-east, as these currents are generally less charged with humidity (and therefore precipitation potential) than from the west. In Campania, the occurrence of intense floods, especially in autumn and winter, depends on small cyclonic areas, whose dynamics follow the genesis of tropical cyclones (hurricanes), but show low energy levels [20]. A major challenge for climate researchers is determining the degree of predictability associated with these and other events. The analysis of the historical records of rainfall has been the subject of many studies, but we want to contribute from another point of view, by studying the precipitable water content in the Naples and Mt. Somma–Vesuvius areas.

3. The Datasets

The NeVoCGPS network, operated by the Istituto Nazionale di Geofisica e Vulcanologia (INGV), was installed to monitor ground deformation in Neapolitan volcanic area. In this area, there are three active volcanoes, Somma–Vesuvius, Ischia island and Campi Flegrei caldera. Today, the NeVoCGPS network consists of 37 GNSS sites equipped with choke ring antennae and dual-frequency receivers. Our study concerns a part of this network, the one that covers the Neapolitan and Vesuvius areas. The Somma–Vesuvius is located east of Naples, has a surface of 165 km2 and is about 1200 m high [21], therefore, it is the highest relief in this area.
The selection of GNSS sites from NeVoCGPS network used in this study consists of 15 GNSS sites (Table 1), 10 stations located on the volcano and 5 outside the volcanic area. Sites located outside the volcano (Figure 1) are: ENAV, sited on the limestones of Sorrento Peninsula; PACA. placed on the first Apennine foothills, MAFE, TAI1 and FRUL, which are installed in Naples.
The dataset used in this study is divided into two parts, one used for studying the long-term trends of the tropospheric delay parameters having a climatological focus, and one analyzed to investigate the evolution of delay parameters during severe rainfall events. The relatively long data set consists of Rinex data, covering intervals ranging from 6 to 11 years, from 2006 to 2016. The other part consists of Rinex data collected in time intervals encompassing the thunderstorms that hit Naples on 23 September 2019, 26 September 2019 and 16 November 2020. As regards the last event, we also use the meteorological data from two stations, co-localized with the NeVoCGPS site MAFE (Table 1) and the IGS (International GPS Service) station (MATE-Matera). We even use GNSS Rinex data from a station not belonging to the NeVoCGPS network, located in the city of Naples, named TAI1. The latter has been set up in 2019, under the framework of the EU project TRYAT (https://www.tryat.eu/, accessed on 15 September 2021).

4. Methods and Data Analysis

In this section we provide an overview on the principles used to retrieve some useful parameters, such as zenith tropospheric delay (ZTD), zenith wet delay (ZWD) and precipitable water vapor (PWV), from the analysis of GPS data.

4.1. GPS-Derived Tropospheric Parameters

The GPS positioning technique, which has become GNSS (global navigation satellite system), in recent years, due to the advent of other orbiting positioning systems, is based on measuring signal travel time from the satellites to the receiving antenna, which could be located on or near the Earth’s surface or on other satellites, to estimate the geometric distance between them. GNSS signals, propagating through space to the receivers, undergo delay due to the total electron content (TEC) in the ionosphere and the amount of moisture and total density of the troposphere. Multi-frequency receivers allow accounting for ionospheric delay. GPS meteorology is concerned with inverting the remaining time delay due to a neutral troposphere, in order to retrieve useful atmospheric information. The two main branches of GPS meteorology are: (a) radio occultation (RO), a satellite-to-satellite, limb sounding technique based on measuring how the ray paths of GPS radio signals are bent by atmospheric refractive index gradients; and (b) ground-based GPS measurements.
The additional transit time required to cross the troposphere is equivalent to an excess path length ΔL, which is related to the refractive index of the atmosphere (n).
Δ L = c d t = L ( n 1 ) d L
where the integral is taken over the actual path L distance between the transmitter and receiver antennae. This has a magnitude of around 2.5 m, for a GPS transmitter at zenith, and, to a first approximation, it increases as 1/sinα, where α is the elevation angle of the satellite above the horizon. In meteo GPS, the refractivity index [N = (n − 1)·106] is routinely used instead of the refractive one. To better understand why refractivity is a measure of the physical state of the troposphere it is advisable to explicitly state the definition of N according to Thayer [22]:
N = K 1 P d T Z d 1 + K 2 P w T Z w 1 + K 3 P w T 2 Z w 1    
where, K1 = 77.6 K hPa−1, K2 = 64.8 K hPa−1, K3 = 3.776 × 10⁵ K2 hPa−1 are empirical constants [22]; Pd is the partial pressure of dry air and Pw is the water vapor partial pressure; Zd, Zw are the Bulk modulus of dry air and water vapor, respectively, and T is the atmospheric temperature (in Kelvin).
Bearing in mind that the refractive index in the atmosphere is a function of water vapour content, pressure and temperature, the tropospheric delay induced in any electromagnetic signal can be exploited for meteorological and climatological purposes.
The zenith tropospheric delay (ZTD) is typically split into two parts, the hydrostatic (ZHD) and wet delay (ZWD), and routinely treated as a combination of a zenith component, along the vertical to the antenna, and a corresponding mapping function that gives the slant delay at a whatever elevation angle of the satellites. The raytracing through a numerical weather model, such as the European Centre for Medium-Range Weather Forecasts (ECMWF), allows the retrieval of the coefficients of the mapping functions.
The ZHD (in mm) can be determined precisely by measuring the surface pressure (Ps, in hPa) at the station position [23] or assumed from models:
ZHD = ( 2.2768 ± 0.0005 ) P s 1 2.66 × 10 3 × cos ( 2 ϕ ) 2.8 × 10 7 h
where, h is the station ellipsoidal height (in meters). The formal error (±0.0005 mm/hPa) in the Equation (1) is suggested by [24], under the assumption that all uncertainties of the Ps and h parameters are uncorrelated.
ZWD is mainly a function of partial water vapour pressure (Pw) and the temperature (T), then it can be calculated [3] with a numerical integration through a full atmospheric profile starting from the orthometric height (H) of the observation point using the two refractivity constants (K2, K3)
ZWD = 10 6 H ( K 2 P w T + K 3 P w T 2 )
where, K2 =22.1 ± 2.2 K/hPa. In fact, in most of the available processing procedures, the tropospheric zenith delay (ZTD = ZHD + ZWD) is estimated jointly with position coordinates using a mapping function such as the Vienna Mapping Function [25,26] and consequently ZWD is derived as:
ZWD = ZTD − ZHD
A key parameter used to describe the water vapor content of the atmosphere is precipitable water vapour (PWV). This is a measure of the equivalent height of the column formed if all the water vapor was condensed and collected at the ground surface. According to [6], it can be computed as:
PWV = ZWD 10 6 ( K 2 + K 3 T m ) R v ρ        
where, in addition to the atmospheric refractivity constants (K2′, K3) given in Equation (4), Rv = 461 (expressed in J kg/K) stands for the ideal gas constant for water vapour, ρ is the density of the water vapour; Tm, the atmospheric column mean weighted temperature, is an essential parameter for retrieving PWV from the ZWD of GPS signal propagation. It is site-dependent and varies seasonally and diurnally. Routinely, in GPS analysis, Tm is derived from models (e.g., GPT2 [27]) or is tabulated in grid format (e.g., the European Center for Medium-Range Weather Forecasts (ECMWF) reanalysis dataset) or can be well-approximated by means of empirical relationships [6] from surface temperature observed with meteo stations.
The high spatial and temporal variability of PWV calls for its regular and accurate 4D monitoring for climatological and meteorological purposes. Indeed, knowing the total vertical column of this parameter, also called integrated water vapour (IWV), and its variations, is particularly more useful than surface humidity in understanding water vapour feedback on global warming and rain forecast. Assuming a stratified model for the troposphere with respect to refractivity (N), which is variable with height along the distance L of the ray path from the satellite (sat) to the receiver (rec), the IWV can be expressed as
IWV = Π ρ s a t r e c N d L
In SI units, IWV is expressed in kg/m2; a PWV value of 1 mm is equivalent to an IWV value of 1 kg/m2. When the vertically integrated water vapor is stated in terms of PWV, namely as the length of an equivalent column of liquid water, then this quantity can be related to the ZWD by means of an empirical dimensionless coefficient, П = PWV/ZWD [28,29], which can be derived from the Equation (6).
П is a function of the atmospheric column mean temperature (Tm), which is site-dependent too and might depend on the local climate (e.g., geography, season and weather) (П ≈ 0.15 ÷ 0.16).

4.2. Data Analysis

For at least three decades, the differential GPS (DGPS), and later DGNSS, technique has been the dominant operational mode for high-accuracy positioning for the geodesy, geoscience and navigation communities. Currently, however, the availability of precise GNSS orbit- and clock-data products with centimeter accuracy let PPP (precise point positioning) soar [30]. PPP is a GNSS-positioning method that employs readily available satellite orbit and clock-correction data from a global network to perform absolute 3D positioning, determining receiver-clock error and the total tropospheric delay using measurements from a single GNSS receiver. However, the single-receiver approach for PPP, traditionally, has also had some drawbacks, the most significant of which is its long convergence times (about a few tens of minutes) necessary for the ambiguity float solution to converge to achieve the required cm-level accuracy in positioning [30]. Recently, several analysis centres made available satellite phase biases, consistent with satellite orbits and clocks. allowing a valuable extension of the PPP concept towards PPP-RTK (real-time kinematics) [31]. This is the case of the post-processed Canadian Spatial Reference System Precise Point Positioning (CSRS-PPP) online web service, based on the application of backward filtering for ambiguity resolution [32].
For the purposes of our study, we have retrieved the tropospheric delay quantities and PWV from GPS data, processed with both DGPS and PPP techniques. More precisely, three different strategies of data analyses and associated products have been used:
(1)
GAMIT/GLOBK [33]
(2)
Nevada geodetic laboratory solutions [34]
(3)
The post-processed Canadian Spatial Reference System Precise Point Positioning (CSRS-PPP) online web service [32].
We analysed, with the above-mentioned techniques, three different data sets acquired by the NeVoCGPS network: a long data set, ranging from 2005 to 2016, and two short data sets, of 8 days and 5 days, respectively. The short series include time intervals when severe storms hit the Campania region. For the long time series, only differential method 1 [33] was used, because it also was used during those years. In fact, as mentioned above, only in more recent years have PPP techniques reached accuracy standards comparable to differential methods. Therefore, for our study, the differential method was the most suitable for studying the long-term temporal evolution of the tropospheric delay parameters. On the other hand, for short time series, aimed at studying storms, we used all the methods listed above, both differential and PPP techniques, and compared hourly differential and fast (5 min) and very fast (30 s) PPP solutions. These faster techniques could, in the future, play a decisive role in obtaining parameters of meteorological interest in real and near-real time.
For the first data set, we mainly focused on the Vesuvius sector of the network, since the latter is the most suitable to study the topographic effects on the characteristics of the estimated parameters. Due to the harsh topography, GPS stations in the Vesuvius area are distributed at different altitudes ranging from a few tens of metres to about 1000 m above sea level (Table 1). In detail, we have retrieved the tropospheric delay parameters and PWV from processing, carried out with GAMIT/GLOBK, of an 11-year-long data set. Then, we inspected the main spectral characteristics and the time evolution of the parameters of interest in GNSS meteorology, i.e., ZTD, ZWD and PWV. For the second and third datasets, we focused on the city of Napoli to investigate how GNSS-derived parameters can contribute to understanding the spatiotemporal evolution of three major thunderstorm/heavy rain events that hit the Neapolitan area during 2019 and 2020.
Presently, a brief overview on these strategies of analysis is outlined.
A set of continuous GPS (Figure 1) data was analyzed with the software GAMIT/GLOBK [33]. Rinex-format daily GPS observation files, with 30s sampling rate, were used as input; a cut off angle of 7° was set for the processing. The ocean load was modelled using FES2004 coefficients [35]. GAMIT/GLOBK uses a typical two-step procedure to process the data, following the DGNSS differential technique. Firstly, the “ionofree” linear combinations (LC) are computed to account for the ionospheric delay, then, with IGS-precise satellite orbits, 10 ppm loose constraints coordinates of GPS stations are retrieved. In the second step, the Kalman filter procedure, implemented in the GLOBK program, is applied to retrieve the final coordinates in ITRF2014 [36]. Eight IGS stations (AJAC, MATE, NOT1, POTS, GRAS, GRAZ, WTRZ, ZIMM) were included in the analysis to achieve the frame referencing. Station-specific discontinuities due to updates of antenna calibration parameters or associated with changes in instrumentation (antenna and/or receiver) are accounted for in the first step (GAMIT) and those found unaccountable were corrected in the GLOBK time series. For the purpose of estimating tropospheric delay parameters during episodes of heavy rainfall, in addition to GPS data, meteorological observations (atmospheric pressure, temperature, relative humidity) acquired at the meteorological station collocated with the MAFE station were incorporated in the analysis. Moreover, according to [37], GNSS and meteorological observations from a remote station (distance > 200 km), MATE (Matera, Italy), were included in the processing to avoid correlation of the tropospheric delay parameters within the small NeVoCGPS network. Besides quasi-observations, the daily GAMIT solutions contain the parameters of the piecewise-linear model estimated from the data, hence, the zenith total delay (ZTD) is obtained by interpolation. PWV is extracted from the GAMIT solutions with “sh_metutil” [33], available in the script library of GAMIT software sub-package. This tool extracts the ZTD values from the daily solutions, applies corrections for the ZHD [23] to retrieve the ZWD values and converts them into PWV; the NS and EW horizontal gradients with associated errors are computed as well.
In studying the thunderstorms, we have even used the freely available zenith total delay (ZTD) and PWV solutions produced by the Nevada Geodetic Laboratory (NGL), which employs the GIPSY/OASIS-II software in a PPP strategy [34]. The available solutions have a 5-min temporal resolution and the observation cut-off angle was 7°. The satellite clocks, receiver clocks, station coordinates, integer ambiguity and total zenith delays were estimated. Finer details on the processing strategies and setting parameters can be found at NGL website (http://geodesy.unr.edu/magnet.php, accessed on 15 September 2021). As a further alternative method of analysis, the CSRS-PPP service was used. It relies on precise satellite orbit, clock and bias corrections, derived from a global network of receivers, to determine accurate user positions. For the purpose of this study, the latest version of the service (version 3) was used, which implements several ambiguity resolution (AR) algorithms (PPP-AR), allowing faster convergence with external ionospheric information and the processing of multi-GNSS observations. Currently, this new algorithm achieves millimetre-level accuracies for long observation sessions (daily or longer) in static mode, but an accuracy of a few centimetres can typically be attained in 1–2 h. Further details can be found in [32]. The CSRS-PPP solutions have a 30-s temporal resolution and the observation cut-off angle was 7.5°.

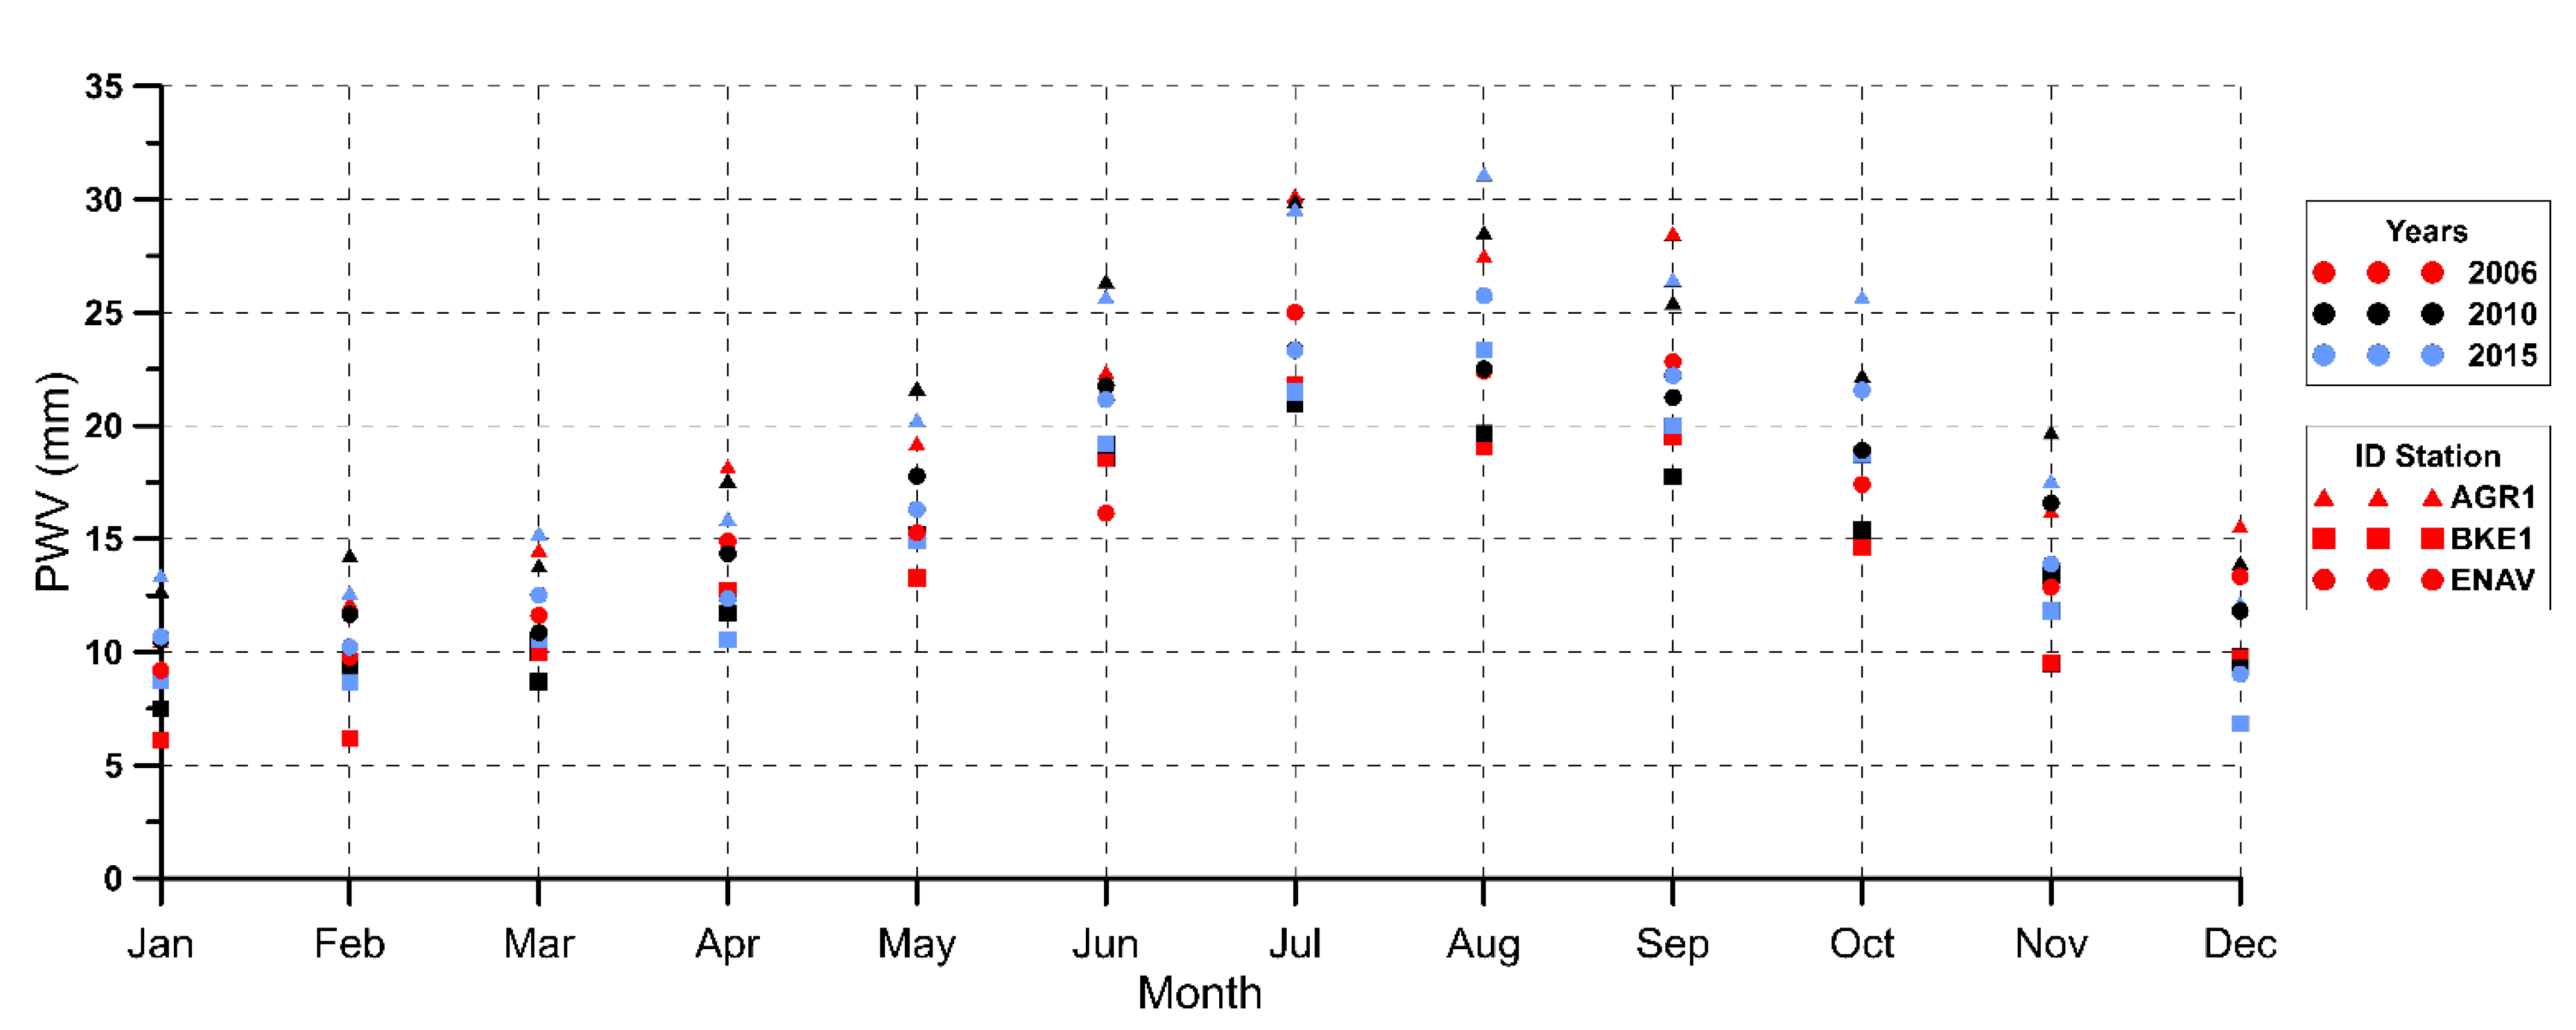
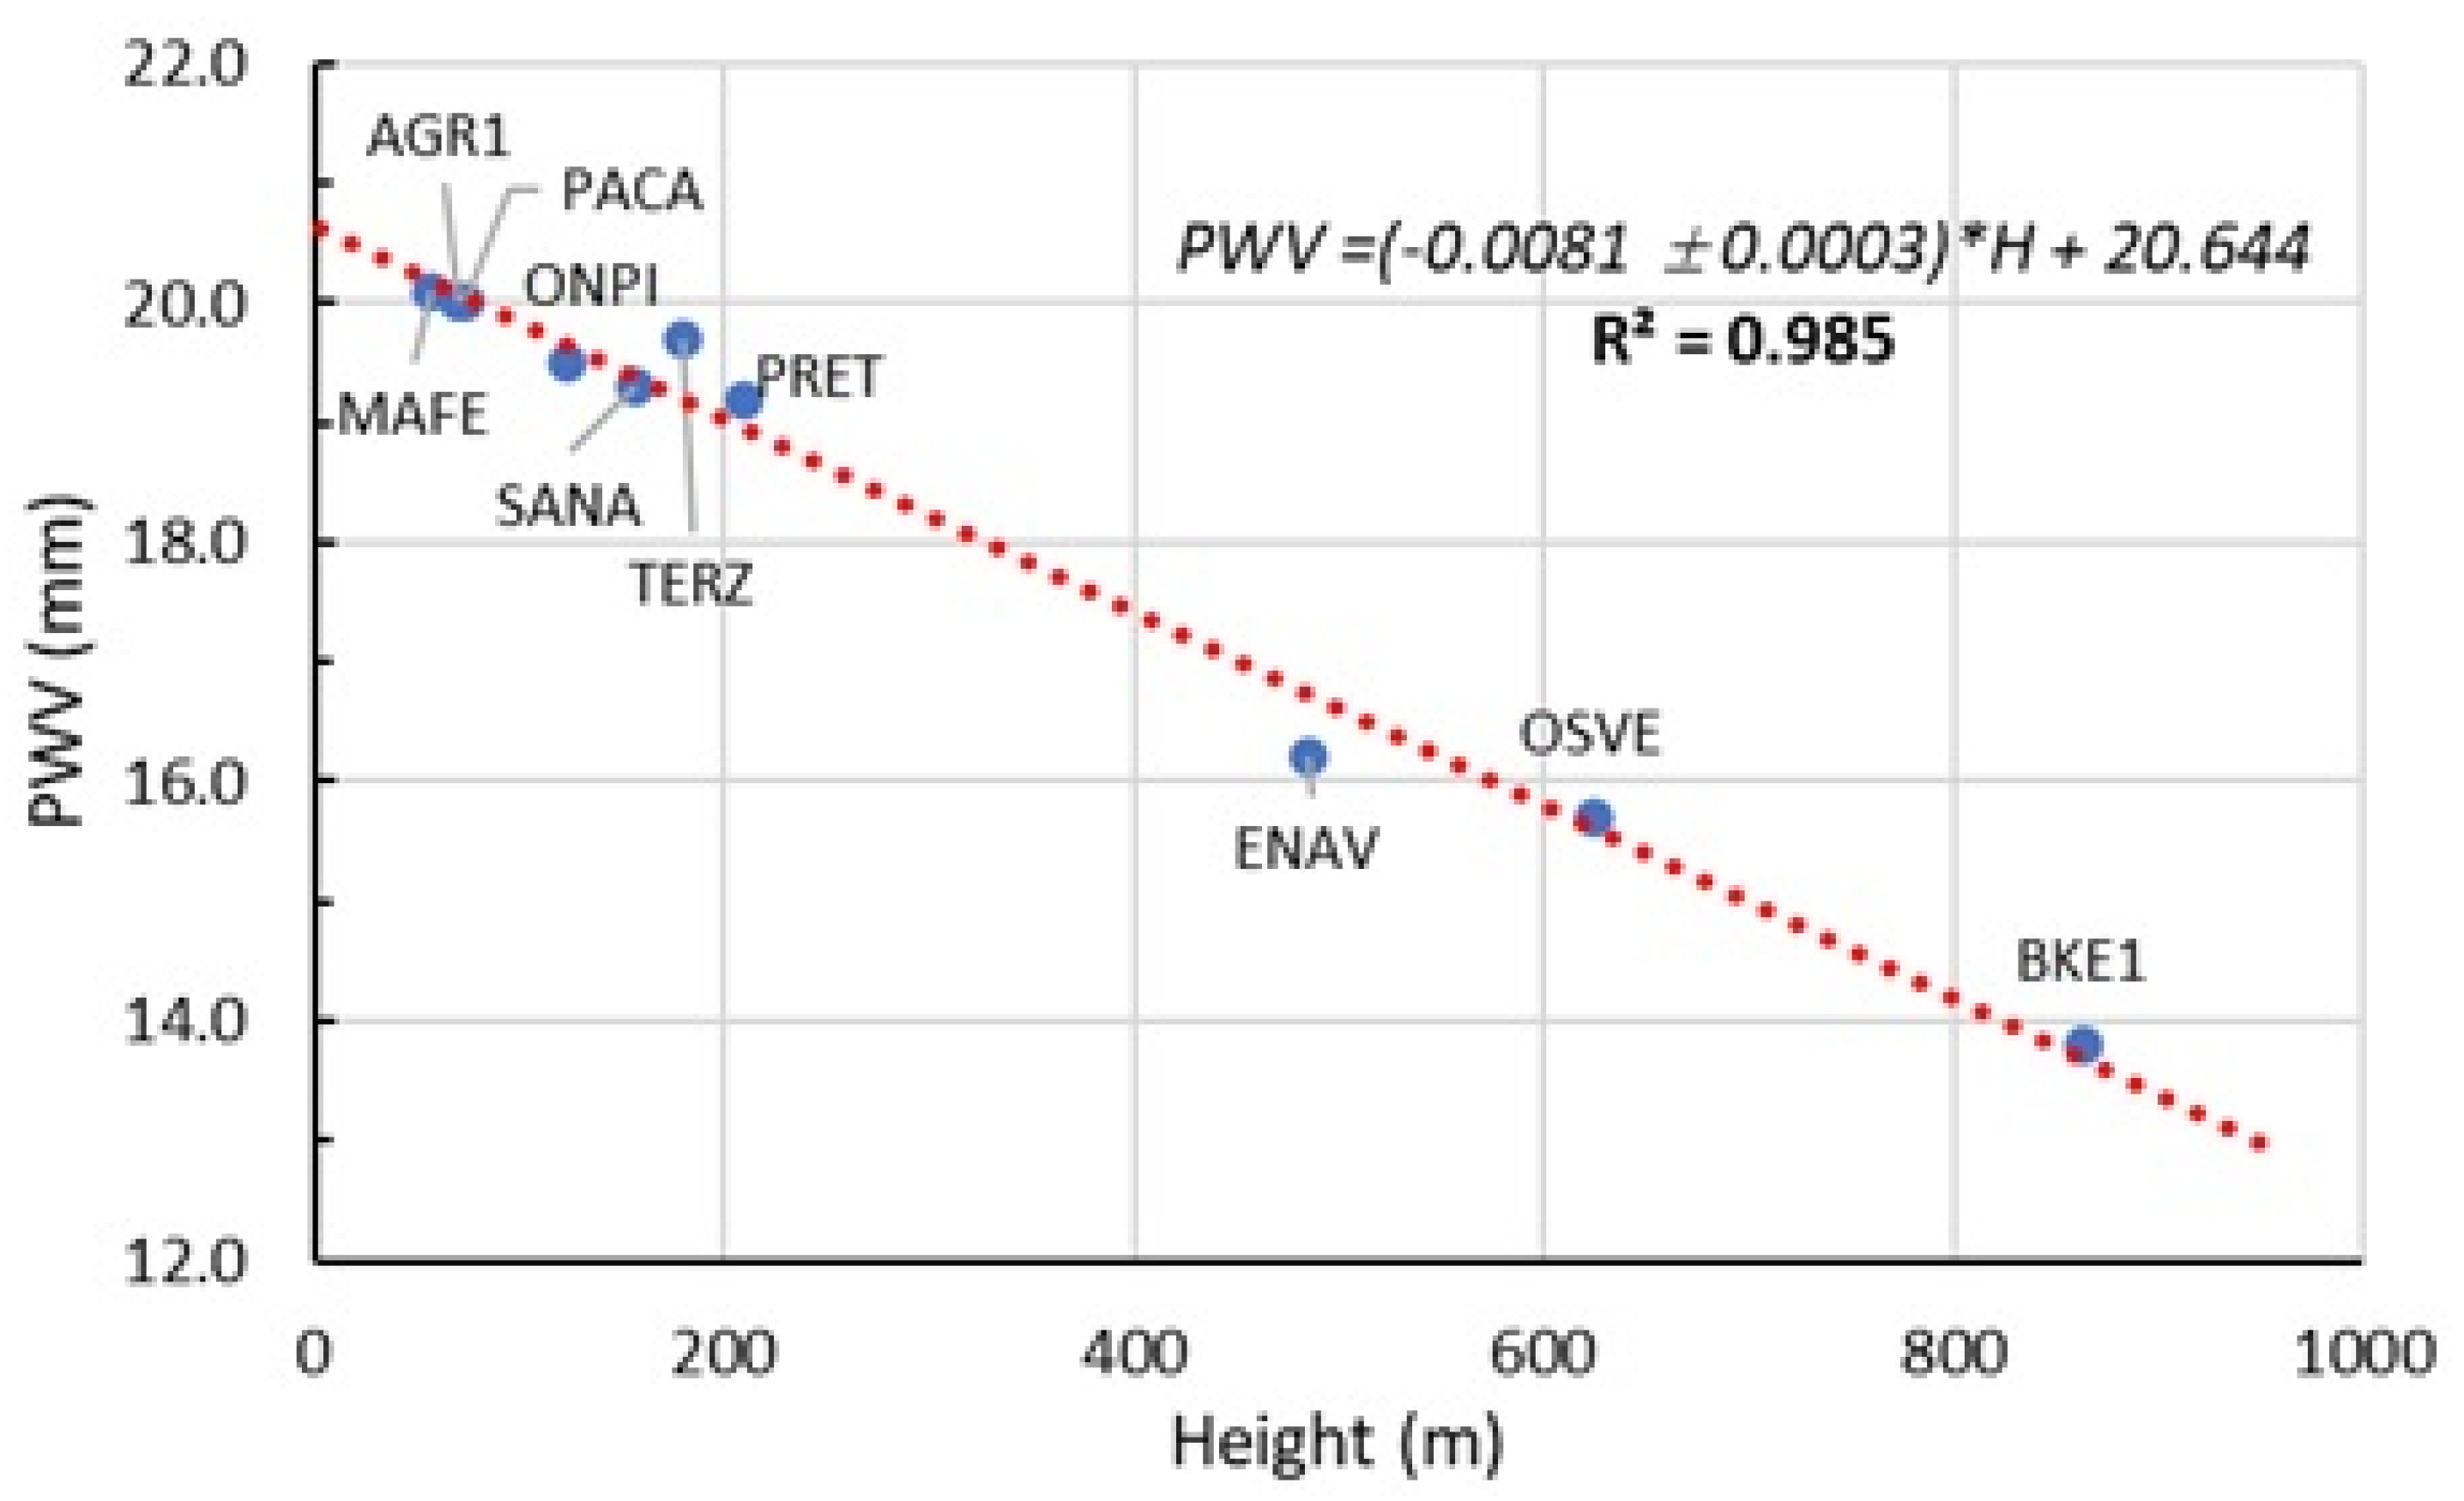
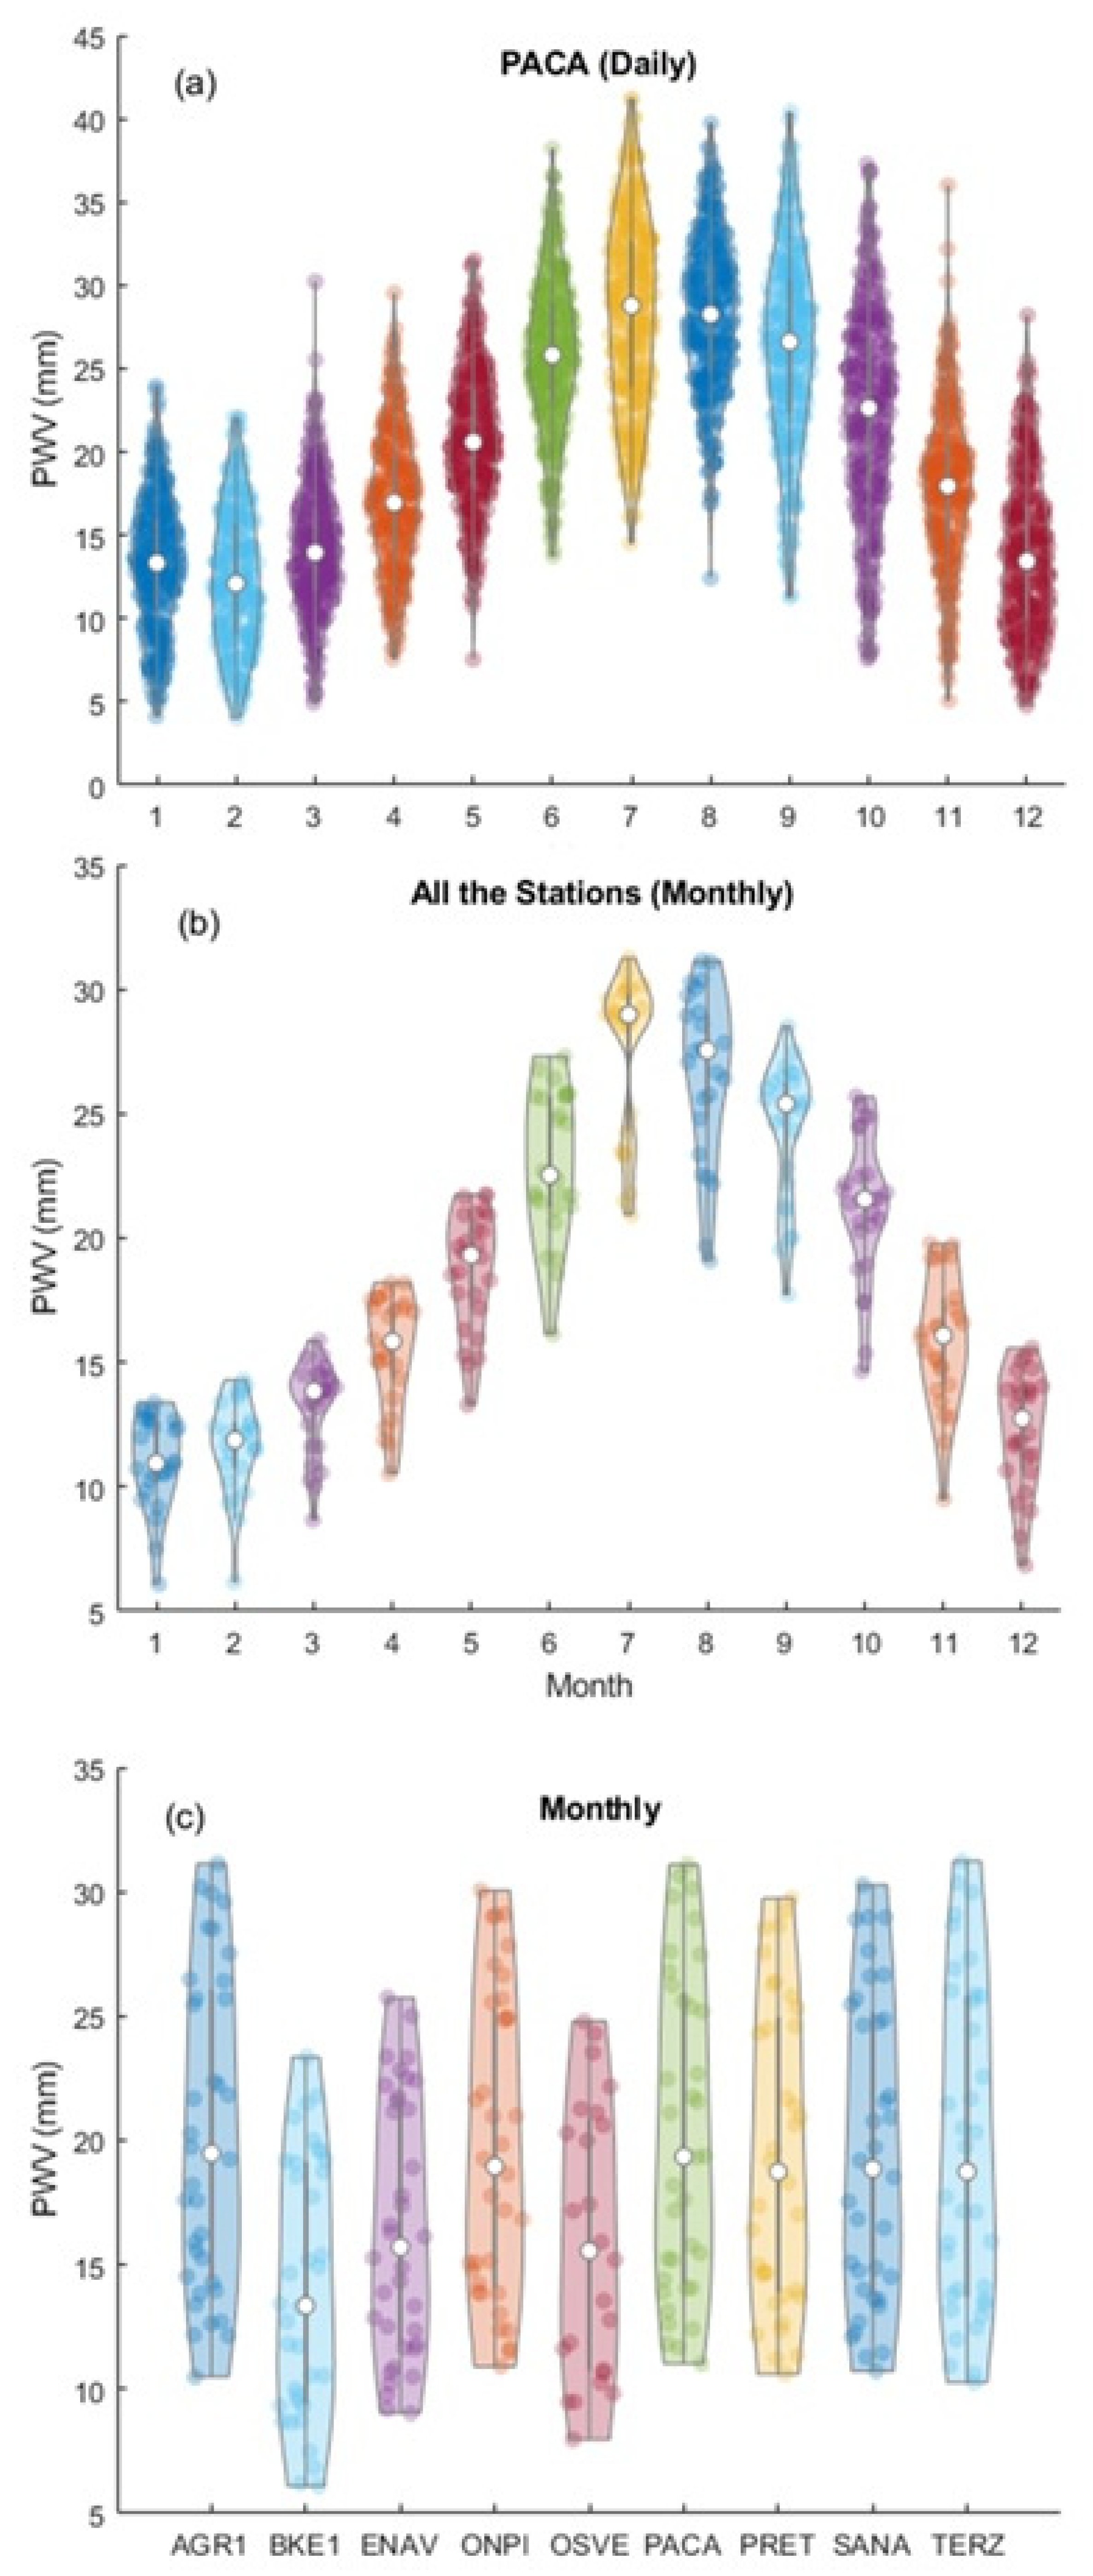
5. Results and Discussion

Three datasets, acquired on the NeVoCGPS network, were analysed with different techniques. A long dataset, ranging from 6 to 11 years, was used to study the long-term temporal evolution of parameters of interest in GNSS meteorology, i.e., ZTD, ZHD, ZWD and PWV to investigate climate trends in the region. In addition, a more focused analysis was conducted on two short data sets, 8-day and 5-day samples, respectively, encompassing the periods when three severe thunderstorms hit the Campania region on 23 and 26 September 2019, and 16 November 2020 (Table 2).
For these analyses we mainly focused on the Vesuvius sector of the network because it enables us to study the topographic effects on the characteristics of the estimated parameters. GPS stations in the Vesuvius area are, in fact, distributed at different altitudes, ranging from 70 m (AGR1) to about 900 (BKE1) metres above sea level.
In our Gamit data-processing for the thunderstorm study (short-term analysis), we used only real observations collected at a local weather station, co-located with the GPS site, MAFE, and on a remote site, MATE (Matera). In order to obtain the greatest accuracy for our weather studies, for the remaining stations and for the long-term analysis, the VMF1 mapping functions [27] were used, derived at 6-h intervals from numerical weather models and updated daily on GAMIT/GLOBK servers. Then, the variation in the zenith delay during the observation span can be assessed at a higher sampling rate (1 h in our study) by specifying a piecewise-linear model with stochastic constraints.

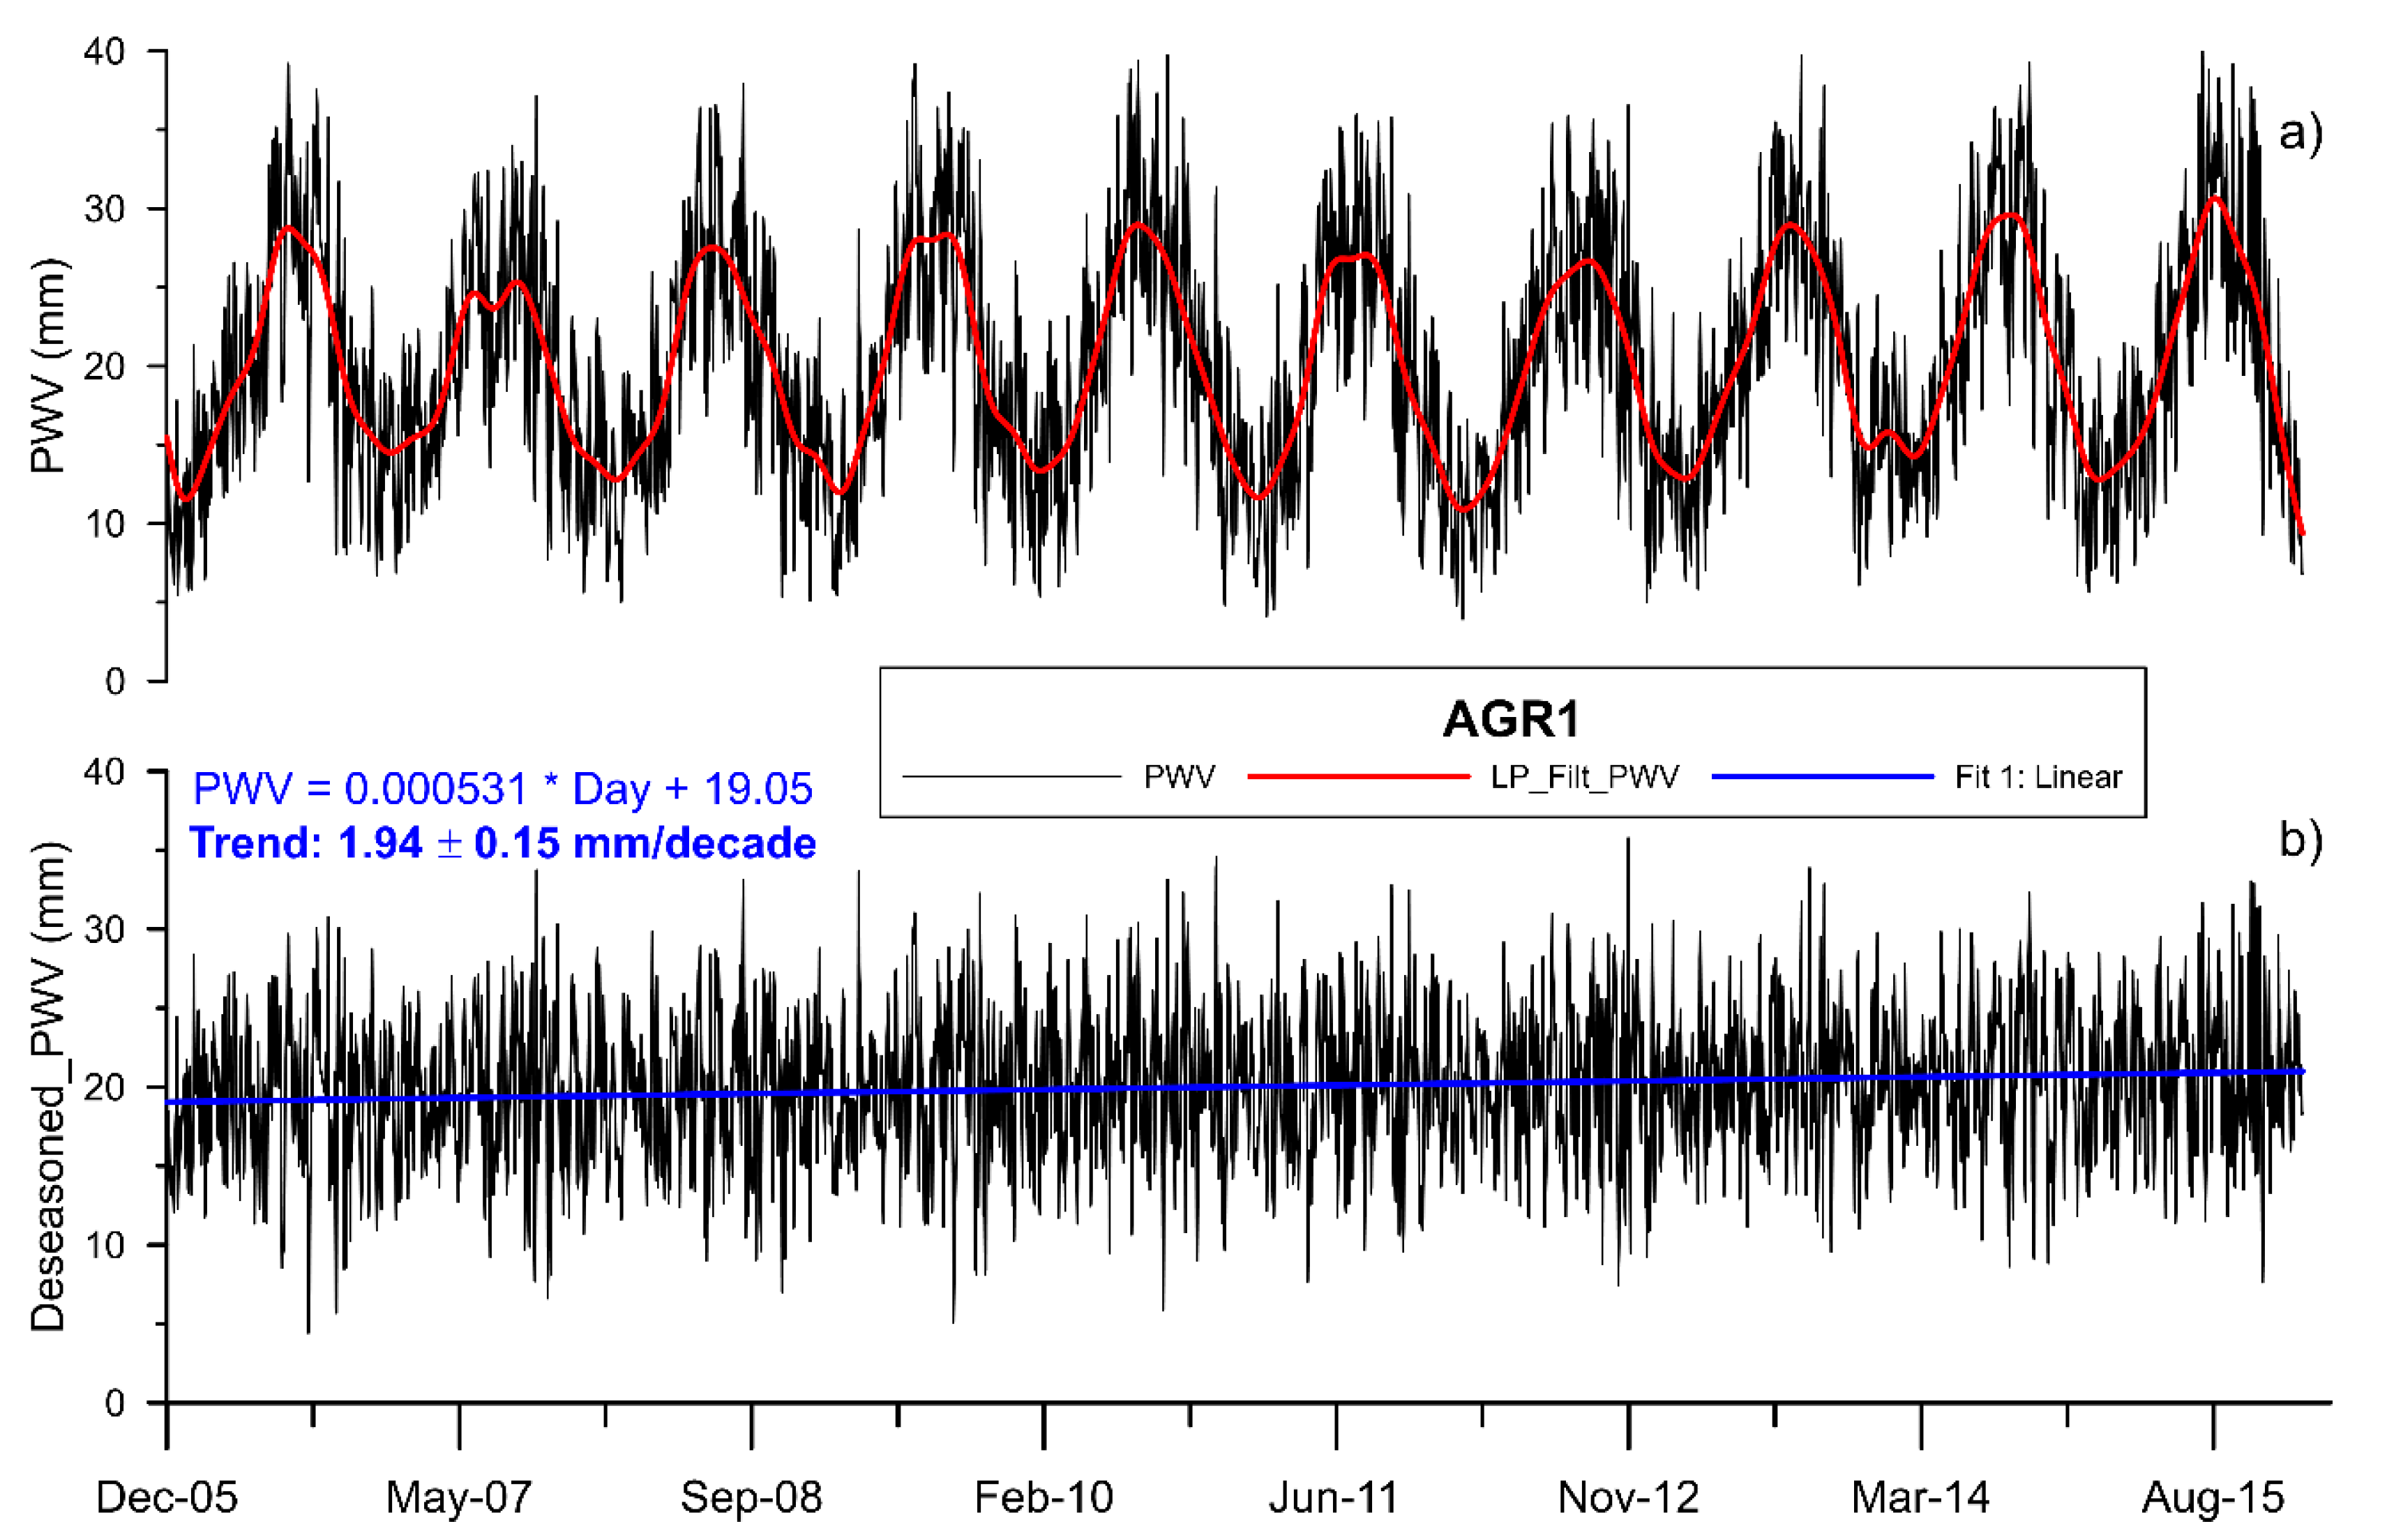
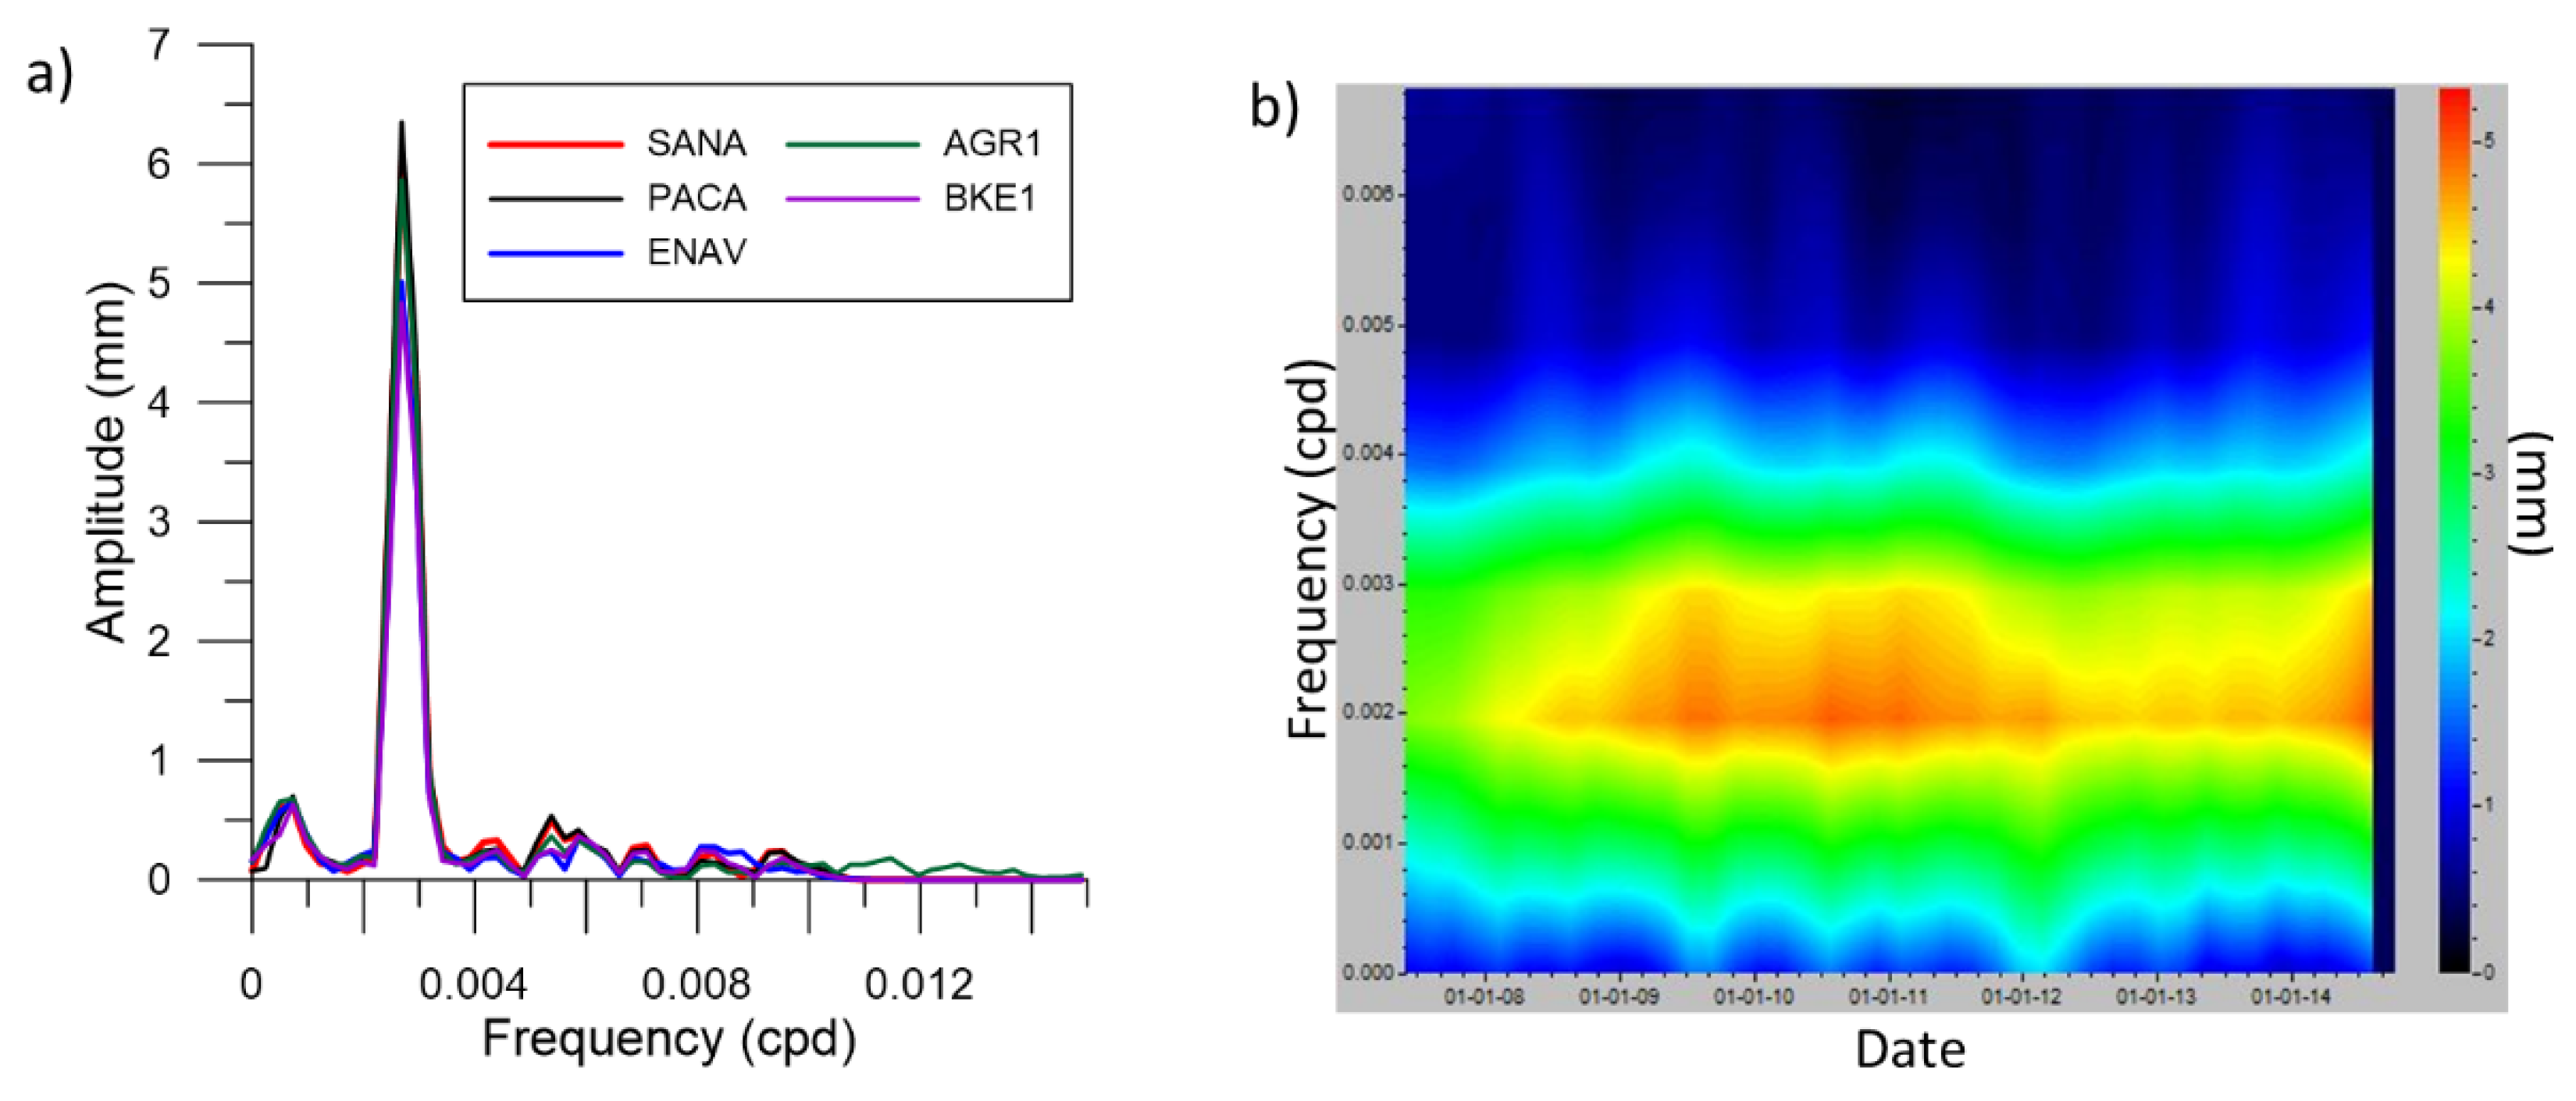
5.1. Long Term Analysis

The analysed series cover a time interval ranging from a maximum of 11 years to a minimum of 6 years (Table 3, Figure 1). The tropospheric time-delay parameters in the zenith direction (ZTD, ZHD, ZWD and PWV) are retrieved from the GAMIT daily solutions [33]. Meteorological data (pressure, temperature and humidity) were extracted from the GPT2 and VMF1 models [26,27].
There is clear evidence that the time evolution of the delay parameters and PWV are ruled by the evaporation cycle, showing a clear yearly periodicity (Figure 2 and Figure 3), with minimum values reached during January–February and peak values in July–August (Figure 4). Previous studies, e.g., [38], have shown that correlation between the annual cycle of PWV and temperature depends on factors such as the proximity to the coast, the altitude and the wind regime. The study area is very close to the sea; the mere variation in temperature throughout the year is expected to cause the amount of water vapor to be much greater during the warmer months. In fact, in summertime, the sea-breeze regime also increases, bringing humidity over land. Ziv et al. (2021) in analyzing the data of 21 GNSS stations in Israel, have shown that the PWV mean annual cycle peaks in September–October and is minimal in February–March.
For illustrative purposes only, Figure 2 shows the time series obtained at station AGR1. A periodic trend of the precipitable water values can be clearly seen, which appears clearly dominated by a seasonal character, coherently, with the climate in the region. To better highlight this component, the time series have been filtered with a low-pass FFT FIR filter, with 0.001 cycle/day (cpd) as a cut-off frequency and 0.001 cpd bandwith. Similar results were also obtained by fitting a set of sine waves in the time series. A spectral analysis was performed, confirming the presence of this annual component (frequency = 0.0027 cycles-per-day). Spectral analyses of the annual cycle of precipitable water were performed for five stations distributed at different altitudes and distances from the coast (Figure 3a). Small differences in the spectral amplitudes were observed, varying between 4.5 and 6.5 mm, with the lowest values for the higher altitude stations BKE1 and ENAV. The largest amplitude was recorded at station PACA, which is also the most inland station (about 20 km from the coast). We obtained some results of lesser clarity than Ortiz de Galisteo et al. [38]. Indeed, all the stations analyzed can be considered coastal; frankly, we did not analyze any continental stations. The effect of altitude therefore seems to be prevailing. The overlap of the amplitudes for ENAV and BKE1 could be explained by the peculiar position of ENAV, which is located on a peninsula of which three sides are exposed to the breeze, which could produce a flywheel effect by regulating the seasonal variations of humidity. Spectral analysis on a moving window (spectrogram) clearly shows (Figure 3b) that the amplitude of the annual component can be variable from year to year, as it is linked to the amount of incoming solar radiation and the seasonal average temperatures, which control the seasonal cycles of evaporation and evapotranspiration. For a more reliable assessment of the long-term trends, the periodic component has been subtracted from the time series and a least square linear regression is performed (Figure 2b). The outcomes for all the analyzed stations are summarized in Table 3. The analysis of the longest time series resulted in an increase in precipitable water vapor ranging between 1.1 and 2.9 mm/decade, with an average value of 1.9 mm/decade.
It is well known that, as temperature rises, the air’s capacity to hold moisture increases, by about 7% for every 1 °C, which is known as Clausius–Clapeyron rate; this has an obvious and paramount relevance in climatology. Amendola et al. [39], using the monthly average temperature of 54 Italian meteorological stations, in the period 1961–2016, found that the average temperature increase observed in recent decades in Italy is higher than the global average. They clearly state that Italian climate has shown rising mean temperatures on the last 30 years. Picone et al. [40] analyzed the sea surface temperature (SST) over the Tyrrhenian Sea for the last 60 years. They found an oscillatory variability, with a cooling of about 0.5 °C in 1970–1990 and a warming of 0.9 °C in the last 10 years (2006–2016); the latter corresponds closely to the time window of our analysis. Unlike temperature, the precipitation regime shows neither pronounced nor unambiguous trends over the Italian regions. Accounting for the previous considerations, we guess that the trends observed in GPS-retrieved PWV might be ruled by a general temperature increase, as was even found by Alshawaf et al. [41] in Germany (Central Europe), but we cannot exclude that there could also be feedback with synoptic mode variability in the region, as found by Ziv et al. [42], over the Eastern Mediterranean area. The retrieved increment in PWV (about 2 mm/decade) around 7 ÷ 9% of the mean PWV is comparable to the theoretical rate of the Clausius–Clapeyron gradient.
Since the Neapolitan area is near the Mediterranean Sea, we can compare our results with other studies that analyze PWV in this type of climate. Ziv et al. [42], in Israel, have shown that the PWV long-term trend for 1998–2019 is ~0.5 mm decade−1 while it is ~1.1 mm decade−1 for 2010–2019 interval. Ziv et al. [42] speculate that the PWV increase, in the last decade, is due to the response to an increasing temperature signal. Based on the analyses of time series collected on globally distributed 150 IGS stations (1994–2006), Jin et al. [43] investigated the secular trend and seasonal variation of zenith tropospheric delay (ZTD), as well as its implications for the climate. They found that secular variations are systematically increasing in most of the northern hemisphere and decreasing in the southern hemisphere, meaning that, at a global scale, the secular ZTD variation is in balance. Furthermore, seasonal ZTD cycles were recognized and interpreted as mainly due to the wet-component variations (ZWD).
Unfortunately, more actual meteorological observations would be needed to validate our results as well as longer data sets, which were not available for this research.
As expected, the spatial distribution of PWV is clearly influenced by the topography of the volcanic edifice, the range of variations presents cylindrical symmetry, i.e., similar values for homogeneous altitude bands. Namely, as the PWV and the IWV depends on the height of the tropospheric column (Equation [7]), the values of PWV are inversely correlated with altitude (Figure 4 and Figure 5) and emerge larger in summertime, coherently with the climate in the target region. Figure 5 shows the dependence of PWV on height above sea level for the analyzed stations. Based on the similarity of the ZTD on both GPS and DInSAR, Alinia et al. [44] used DInSAR data, with high spatial and temporal resolution, to model the local seasonal variations of ZTD in a region of high topographic relief, the Kilauea volcano (Hawaii). They successfully retrieved an altitude-dependent ZTD correction to be applied to the local monitoring GPS network time-series, where meteorological data were not available.
For a better visualization of the variability of PWV over the year, a so-called violin plot is used (Figure 6). This representation, which consists of a combination of a classic box plot with a rotated KDE (kerneldensity estimation) on each side, is better suited to dealing with multimodal data and can therefore be used as a simple outlier-detection technique.
The PWV mean annual cycle for all the NeVoCGPS stations is shown in Figure 6b. For the PWV mean values, December–February represent the lowest values for all stations and are generally less variable (Figure 6a,b). The highest values are reached during July and August. The increasing trend in PWV mean values from winter to summer is steeper than the decreasing ones from summer to winter. This type of analysis also shows no significant differences between the different stations in the network, with the exceptions of the topographical effect and altitude dependence (Figure 6c). This would suggest almost homogeneous climatic conditions in the analysed sectors of the GPS network.

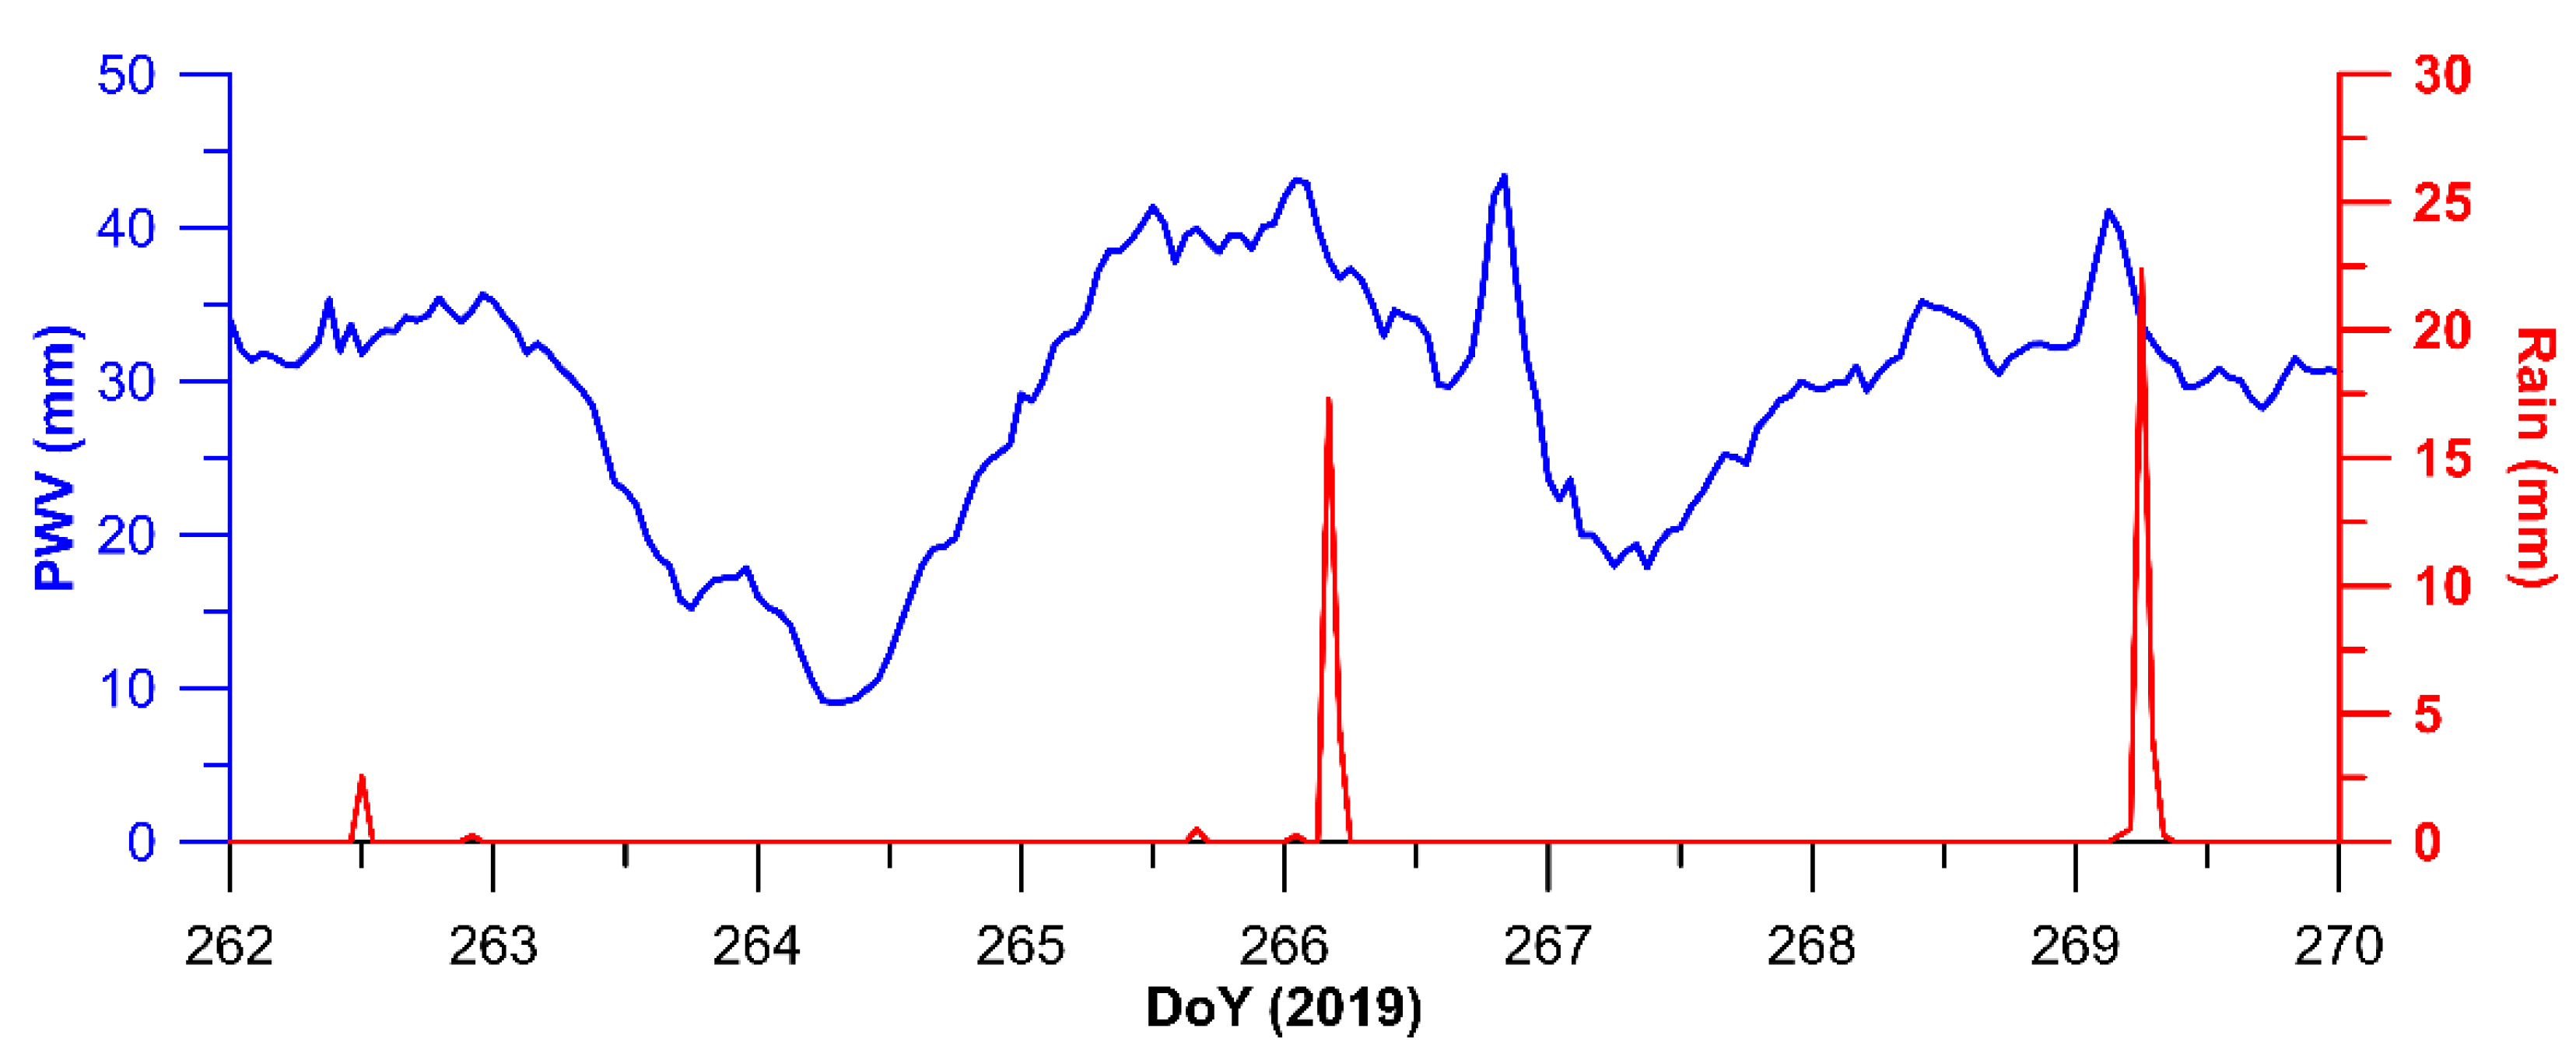
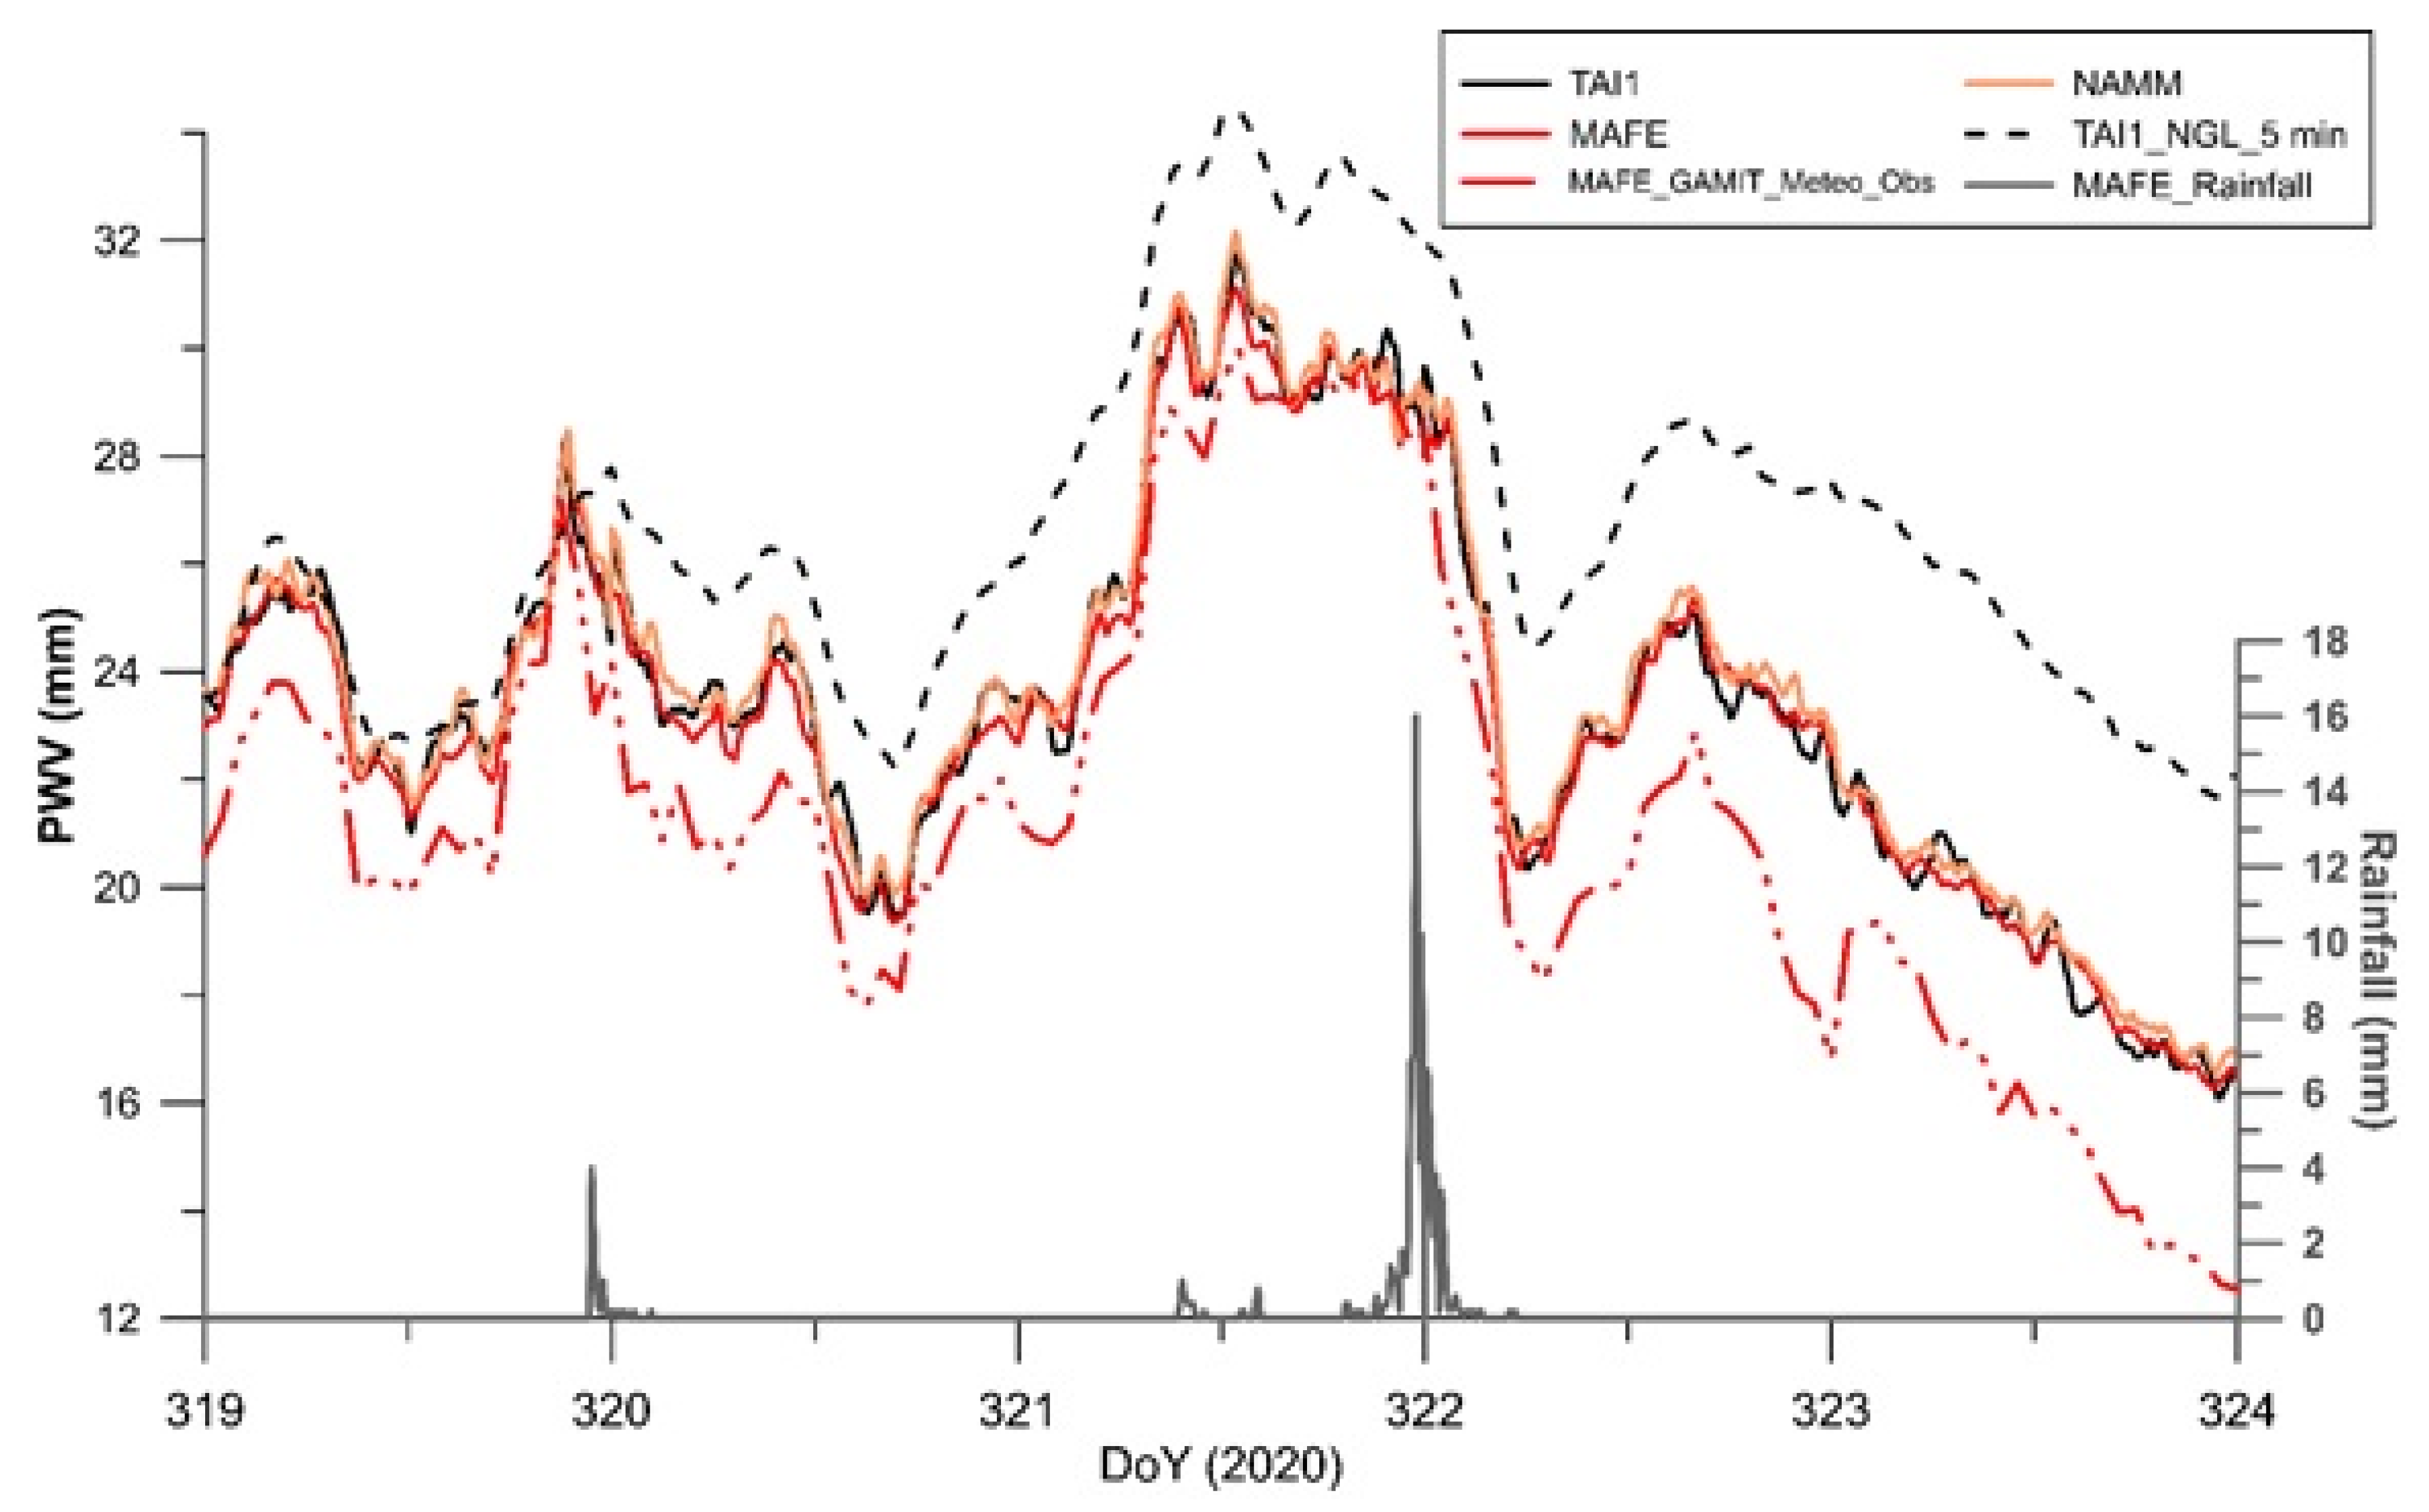
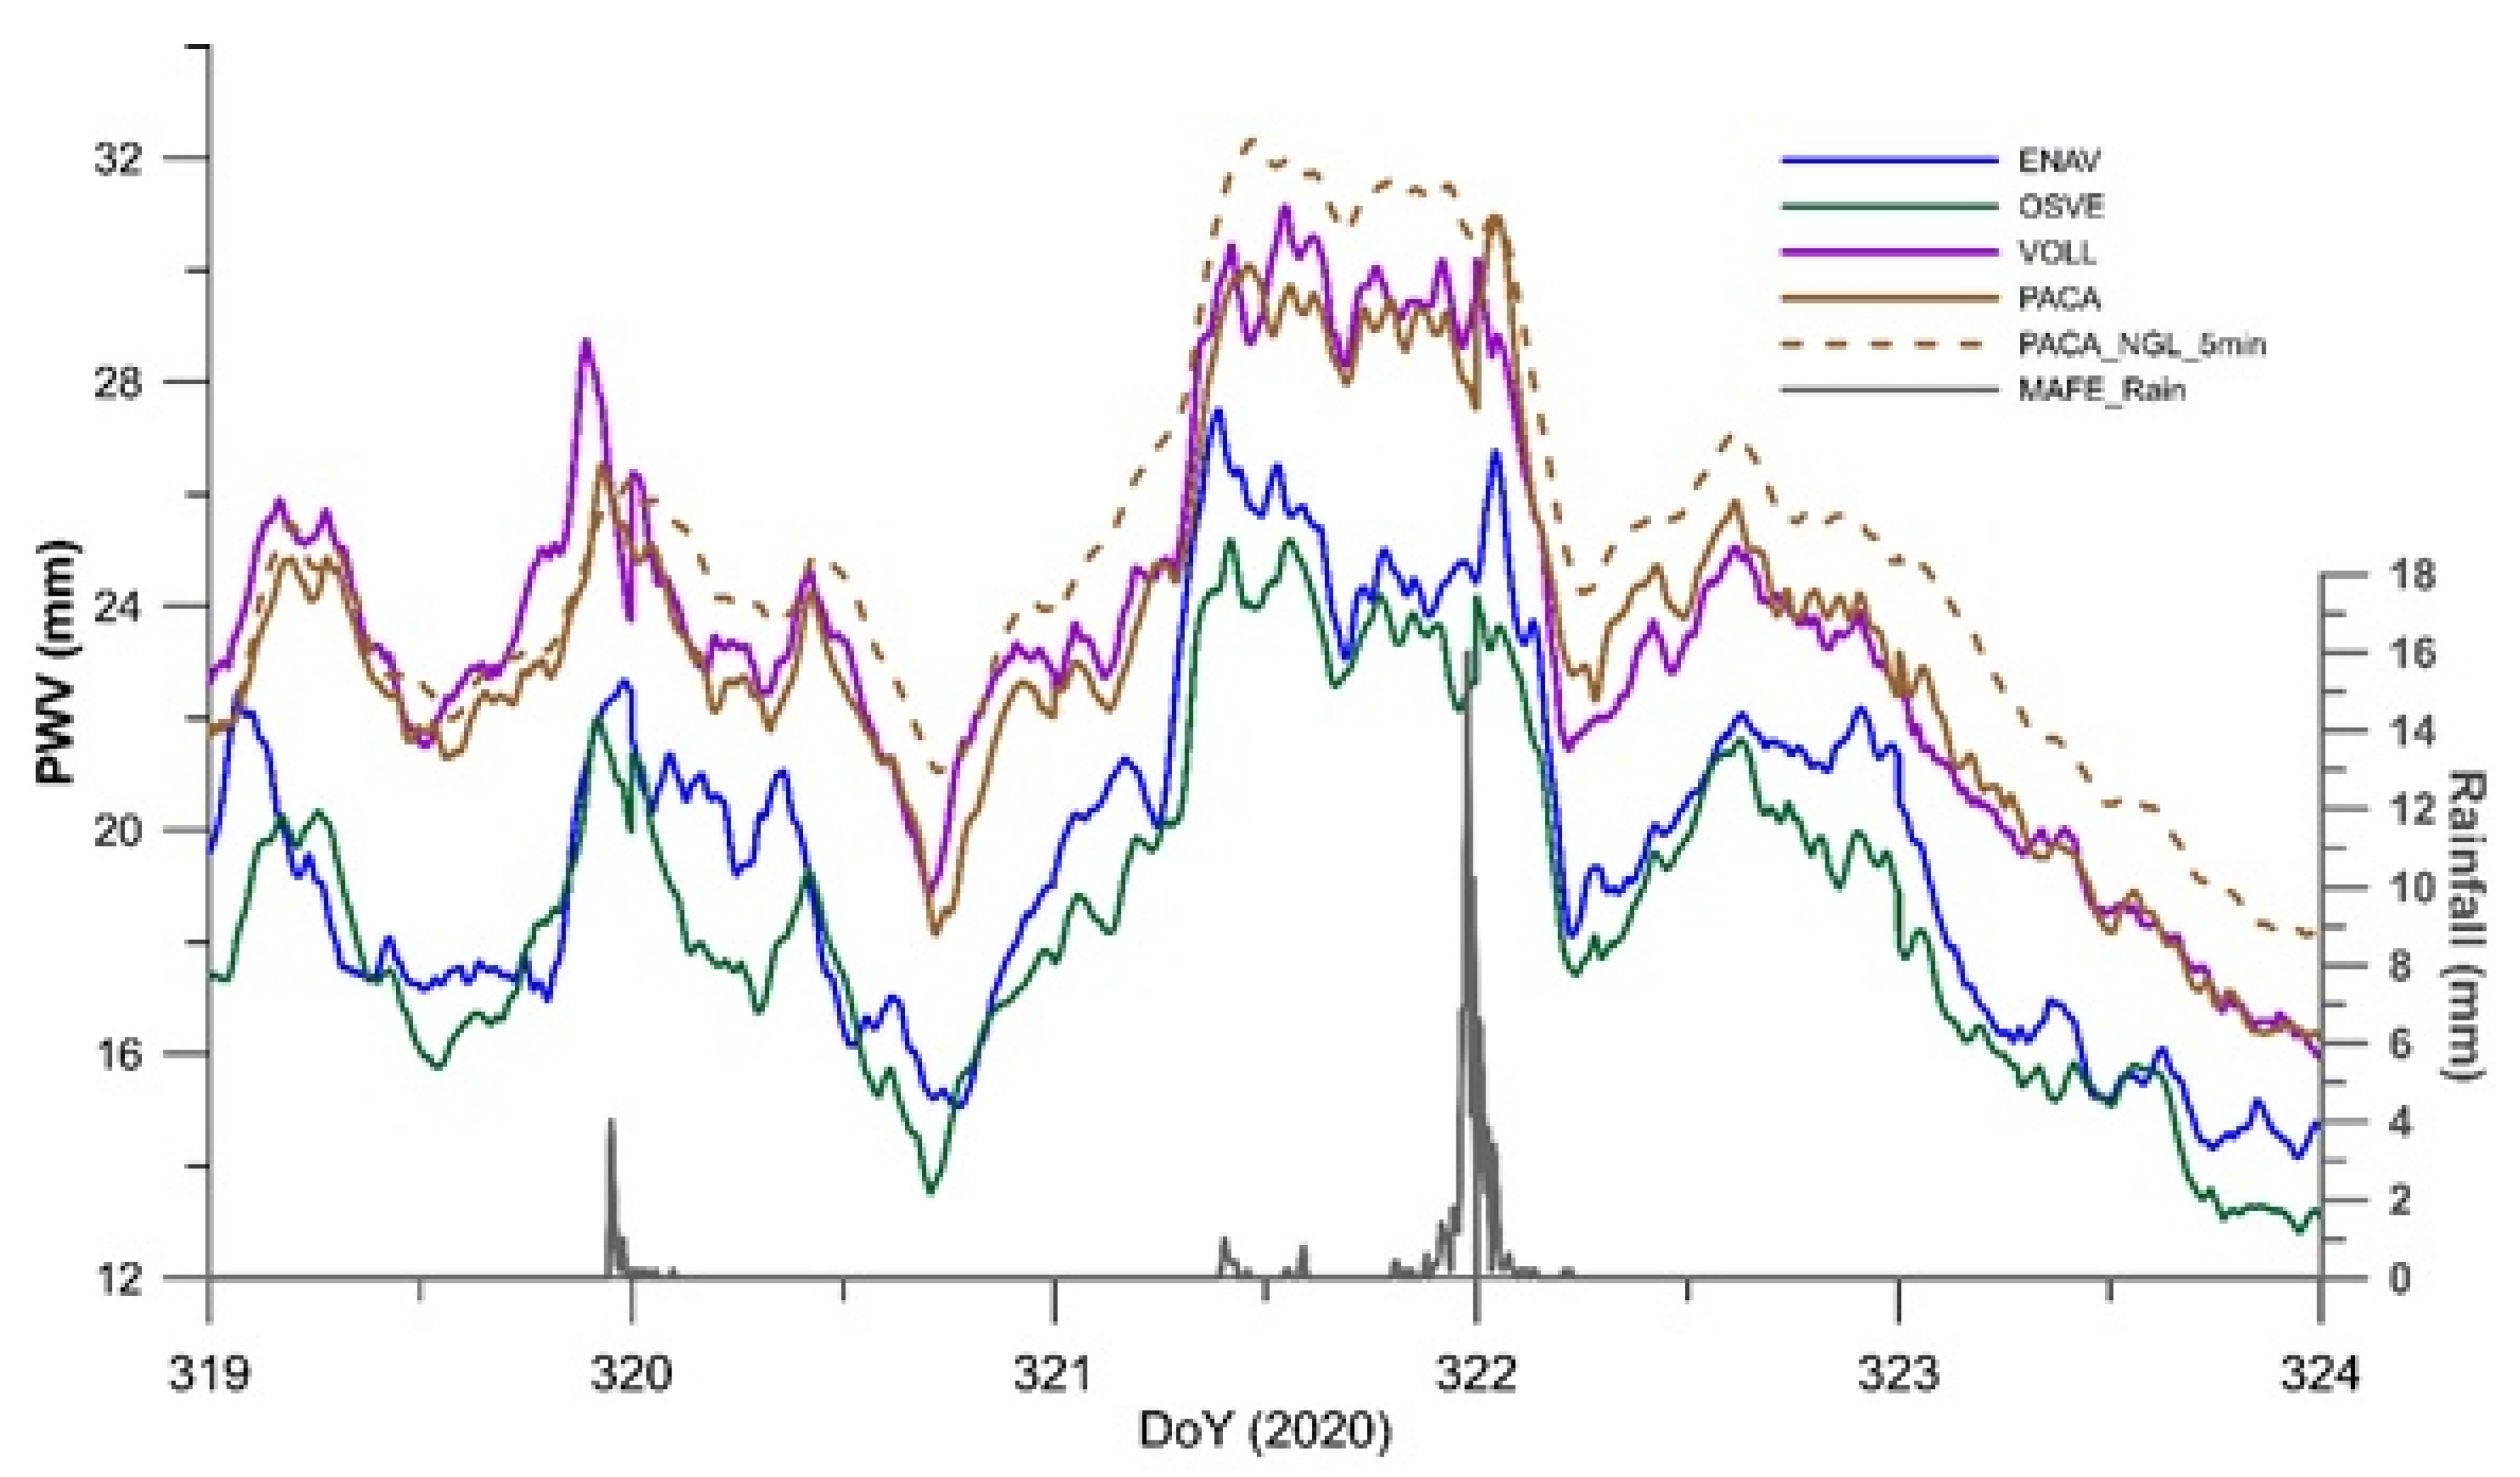
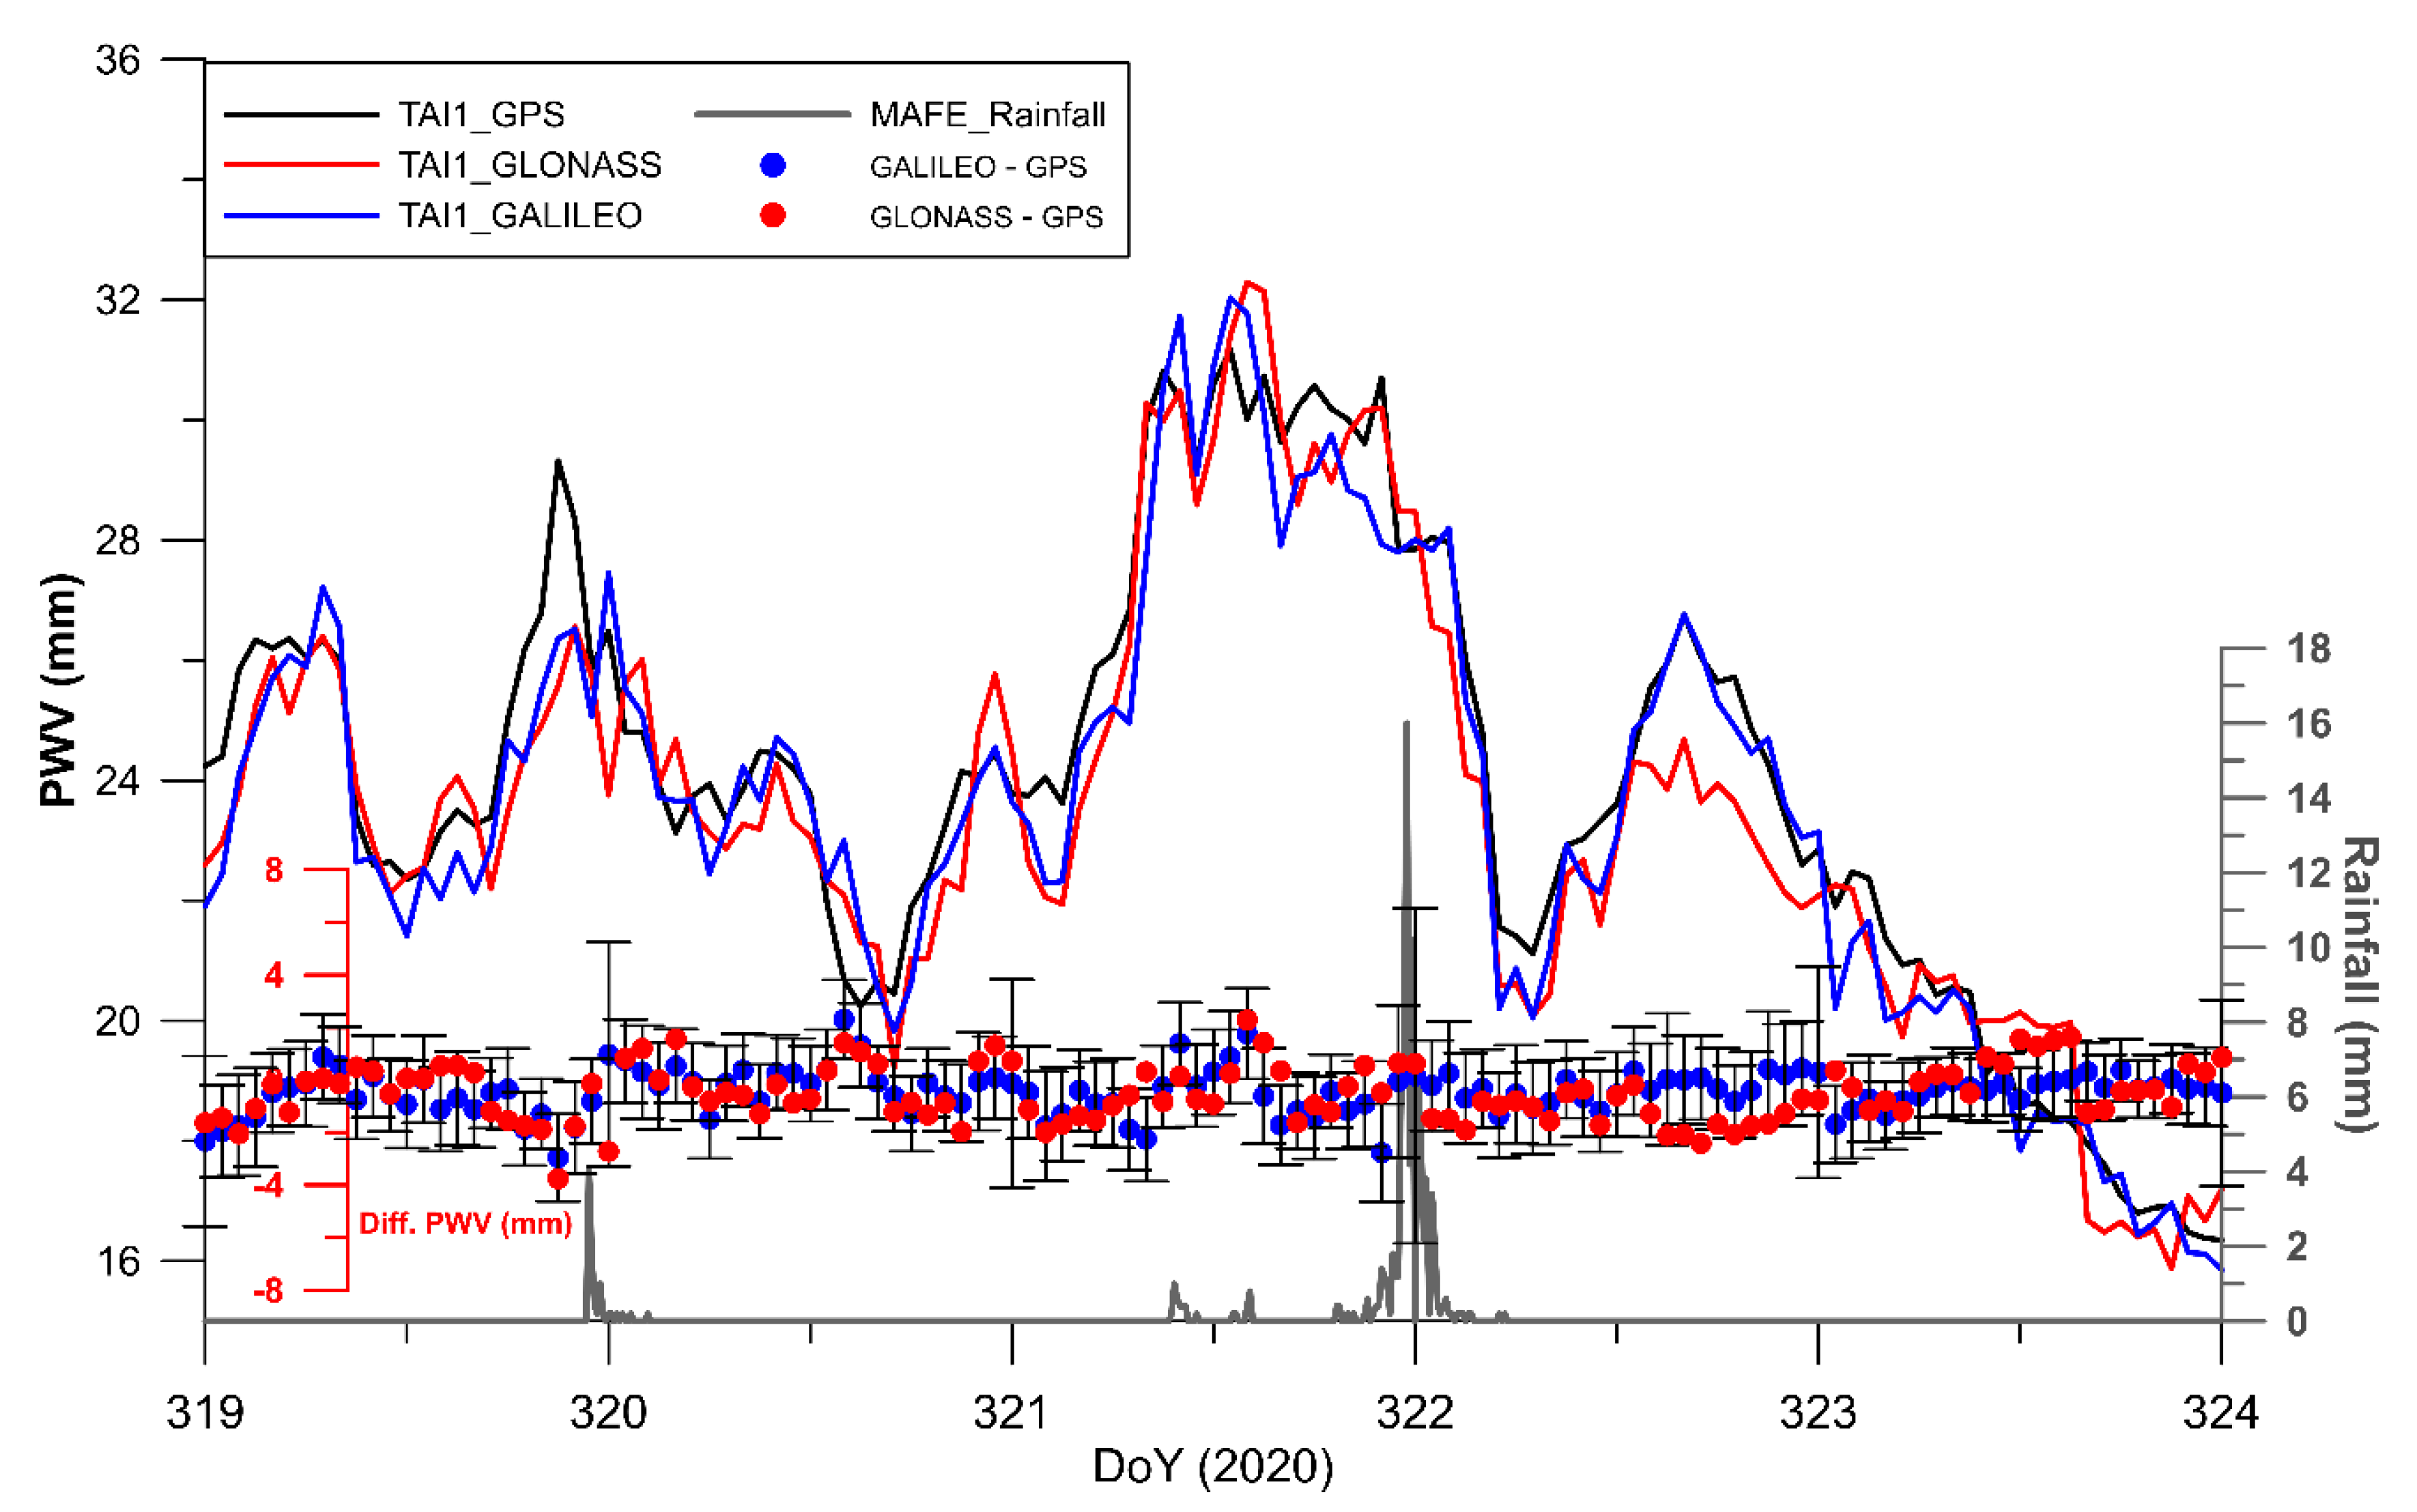
5.2. Short-Term Analysis

In this section we discuss the tropospheric delay parameters and PWV retrieved from the analysis of GNSS data with different techniques. We employed GPS-derived PWV data to track and investigate the characteristics of some thunderstorm occurrences and their spatial and temporal evolution, using a selection of stations belonging to NeVoCGPS network.
In detail, we report on the tropospheric delay parameters and PWV on the occasions of three heavy rain episodes: 23 and 26 September 2019 [Day of the Year (DoY): 266, 269) and 16 November 2020 [DoY: 322] (Table 2).
All these thunderstorms had a common peculiar evolution for the region, where most of the storms followed a nearly west-to-east trend, entering the Campania region through its Tyrrhenian side.
For the first two events listed in Table 2, we retrieved the PWV analyzing an 8-day-long GPS data sample (red and yellow squares in Figure 1), spanning 19–26 September 2019. For the third thunderstorm, the GNSS data analyses covered an interval of 5 days, from 14 to 18 November 2020. The analyses were performed with GAMIT/GLOBK and the aid of the sh_metutil script [33], as described in the previous paragraphs. For the last event we compare the results coming from different techniques of GNSS data analysis, namely the GAMIT/GLOBK [33] and GIPSY/OASIS-II software, in a PPP strategy according to the solutions provided by NGL [34] and CSRS-PPP [32]. For one site of the network (TAI1), equipped with a GNSS station, a comparison of PWV as retrieved for GPS, GLONASS and Galileo satellite constellations is provided too. The GAMIT/GLOBK processing was done by including meteorological data (pressure, temperature, humidity), acquired at a meteorological station collocated with MAFE, with a sampling step, every 10 min. For all the sites for which no meteorological observations were available, values from GPT2 and VMF1 models were used [26,27]. To avoid correlation of the delay parameters in the small regional network [37], the remote IGS station (MATE–Matera) and related meteorological data acquired at a GPS-located station were also included in the tropospheric delay retrieval.
The humidity above MAFE (Figure 7), as deduced from the PWV, increases approximately 24–36 h before precipitation events, probably when a low-pressure system enters the area above the station. Then, for about 10–12 h for the 23 September (DoY 266) event and for about 6–8 h for the 26 September (DoY 269) event, the PWV fluctuated about a value. Finally, a clear and steep increase in PWV values was observed a few hours before the two storms (Figure 7) followed by a sharp decrease. Clear anomalies can be seen, for different satellites, in the temporal variation of the phase residuals iono-free LC component at TAI1 and MAFE stations (see Supplemental Material Figure S1). A time interval when the amplitude of the residuals is much higher than before and after the thunderstorm can be clearly seen. It indicates that the increase of PWV had significantly disturbed the propagation of GPS signal.
This temporal evolution of PWV has already been observed by several authors (e.g., [12,46]). That is, thunderstorms occur after an accumulation of PWV and, during the hours immediately following the event, a rapid decrease in PWV is observed.
During the night between 16–17 November 2020, about 30 mm of rain fell on the city of Naples in less than one hour and more than 70 mm in about four hours (Table 2), according to the observations collected at the meteorological station collocated with MAFE (Figure 8 and Figure 9). The main thunderstorm event was preceded by few minor raining episodes that occurred in the morning (7:00 ÷ 12:00 UT). The evolution of the main thunderstorm over the Napoli urban area began around 23:00 UT on 16 November and continued through the early hours of 17 November (Figure 8). The analysis of GPS data has allowed us to follow the evolution of the phenomenon through the time changes of the tropospheric delay parameters and the phase residuals. Four-hour snapshots of LC residuals (MAFE station) for the days 16–17 November 2020 are shown (See Supplemental Materials Figure S2).
It is clear that, in the last hours of 16 November and in the first hours of 17 November, the amplitude of the phase residuals was much higher than in the hours before and after the phenomenon, which is indicative of the increase of tropospheric water vapour strongly disturbing the propagation of GPS signal through the atmosphere. In fact, the root–mean–square (rms) of the phase residuals, which, on a dry day for MAFE, is nearly 5 mm, on 16 November was 9 mm and, on 17 November, 8 mm. The analysis of time correlation between phase residuals and satellite radar images confirms the coherence between the time changes of phase residuals (See Supplemental Materials Figure S2) and the evolution of the thunderstorm (Figure 7).
Figure 9 depicts the 30-s PWV retrieved from CSRS-PPP service for some stations in Napoli and Vesuvius areas. Also, in that case, the soaring of the PWV curve a few hours before the raining events and the rapid decrease afterwards is quite evident. Thanks to the high temporal resolution of these PPP solutions, even minor raining events are well-traceable in the PWV curve. The rapid increase in PWV about 2 h before rain at the end of day 319 (14 November) was not repeated at the end of day 321 (16 November), however, the volume of rain that fell was much higher. This is probably due to the fact that the PWV content, before the rain at the end of day 319, is much lower than at the end of day 321. Rain seems to fall, at least for the events we studied, only if a particular PWV range is reached. In fact, the 2019 events (Figure 8) also show the same PWV trend. Before the 26 September event (DoY 269) there was a larger increase in PWV, although the amount of rain that fell was smaller. This hypothesis is in agreement with Li and Deng [47], who showed that rain falls during high PWV values, but pointed out that the differences in PWV evolution are related to different weather systems. It is well known that the relationship between the temporal evolution of PWV and rainfall is complex. Several authors have explored the temporal variation of PWV before and after the onset of heavy precipitations. Priego et al. [48] identify an increase in PWV, which peaks just before the onset of precipitation. This characteristic trend is the same as we have reconstructed in the analysed events (Figure 7 and Figure 9). The state-of-the-art testifies that, after reaching peak values, the PWV can vary in different ways; it can remain constant, e.g., [49], or decrease abruptly, e.g., [50], as in the cases we analyzed.
The time evolution of PWV during the storms was mostly the same at all the other stations (Figure 10) in NeVoCGPS network, except for the topographic effect that offsets the PWV values according to an inverse correlation to the height above sea level.
Various authors, e.g., [52,53,54], have studied the feasibility and prediction capabilities of GNSS-based PW-monitoring approaches to forecasting extreme precipitation. They applied techniques based on threshold values to trigger alarms, for example in the event of debris flows or flash floods.
In the analyzed area, a dramatic example of a flash flood is the event that produced 147 casualties in Sarno (Vesuvius area), in May 1998. It was generated by a sudden extreme rainfall event and the resulting flash floods and mudflows, due to the mobilisation of the Vesuvian pyroclastic layers that blanket the surrounding hills [55]. The Italian severe weather emergency plan is, now, based on rainfall alarm thresholds, defining three possible degrees of criticality (yellow, orange and red).
The linking of rainfall thresholds to PWV evaluation would make it possible to anticipate the actions envisaged in the emergency plan. With regard to the experience gained in our study, although limited to only three events, we can assume that an alarm system should be set to both absolute values (thresholds) and steep increases after a threshold value is reached. In other words, further analysis will have to aim at achieving a robust statistics in order to determine a value above which a steep increase in PWV triggers rain. Further studies, on a sufficient number of events, might confirm, or not, our hypothesis.
The TAI1 station, which is equipped with a GNSS receiver-chokering antenna system, enabled us to investigate the differential response (tropospheric delay) of the signals emitted by different satellite systems (Figure 11). The three systems analysed (GPS, GLONASS, GALILEO) showed no significant differences. In fact, calculating the difference in PWV with respect to the GPS system (Figure 11 below) yielded values ranging around ± 1.5 mm. In only a few time intervals did the difference between the various systems appear significant, and this is likely due to the different number of satellites visible at the station.
Such inter-system biases are in agreement with other studies. For example, Lu et al. [56], processing observations (for about six months) from 80 International GNSS Service (IGS) stations, found RMS values of ZTD differences between GPS and GLONASS ranging 5 ÷ 13 mm (which is equivalent to a PWV of 0.8 ÷ 2 mm). In addition, Li et al. [57], in developing a multi-GNSS model to improve real-time ZTD/IWV, retrieved RMS values for GPS and GLONASS differences of 3.2 and 5.5 mm, respectively.

6. Conclusions

Tropospheric water vapour content is a crucially important meteorological parameter because, besides being one of the main greenhouse gases, it is involved in the energy exchanges that take place in most of the meteorological and climatic phenomena. However, due to its extreme variability in space and time, water vapour is one of the most poorly understood weather components.
We have conducted a study on the potential use of dense GPS networks, designed for geodetic monitoring of active volcanoes in Naples. Our study demonstrates that the retrieval of GNSS tropospheric delay can provide important contributions, both for long-term trend analyses and for the prediction and study of the evolution of intense thunderstorm phenomena. In the first case, it is possible to obtain information of fundamental importance for the long-term evolution of the climate and, therefore, all the problems related, for instance, to global warming, as well as sea-level rise.
From the analysis of the decadal time series, we estimated increases in precipitable water at an average rate of 1.9 mm/decade. This value is in agreement with estimates obtained in Europe by other authors, e.g., [58].
This rise, as per the Clausius–Clapeyron process, might be associated with a climatological trend of increasing air temperature and moisture content in the troposphere, leading to increased levels of rainfall, greenhouse effect and associated climatic feedbacks. Indeed, compared to the scale involved in routine climate studies, our analysis was conducted on a very small scale (a few tens of km). The involved time scale is not climatological, either;, in fact, our study covers a relatively long time span, of about 11 years, that is nonetheless too short to draw definitive conclusions of any climatological relevance. Consequently, our interpretation of the trends observed in the PWV can only remain at a speculative level. It has also become clear from our study that tropospheric delay is strongly controlled by orography. From the analysis of GPS data collected in the Vesuvius sector of the NeVoCGPS network, it is clear that the amplitude of the tropospheric delay is inversely correlated with altitude and, coherently with the climate in Vesuvius area, emerges as larger in summertime, with negligible differences for homogeneous altitude bands. An accurate knowledge of the 4D (space-time) distribution of tropospheric delay can certainly improve the signal-to-noise ratio of geodetic data. All the space geodesy techniques based on the study of the satellite-to-target electromagnetic signal propagation would benefit from this. As a result, our ability to solve problems typical of applied geodetic monitoring—for example, the monitoring of volcanic or landslide areas—would improve. Dense networks of permanent GNSS stations could even provide a fundamental contribution to the tomographic modelling of tropospheric delay functions.
In the short-term studies, it was possible to highlight the importance of tropospheric delay in tracking the evolution of the examined phenomena and, especially, the presence of an increase in precipitable water in the hours immediately preceding the meteoric event. In other words, the analysis of time transience and trends in precipitable water vapour can shed light on the preparatory stage of extreme rains. These outcomes, in particular, bode well for the possibility of using these results to set up an early warning system that could play a fundamental role in terms of civil protection and risk mitigation. Such a high density of stations is not necessary for warning purposes; to create an efficient early warning system, it would be more appropriate to select points to be equipped with permanent GNSS and weather stations close to areas exposed to landslide risk, especially of rapid flow, such as the Apennine slopes, which are covered with layers of unconsolidated pyroclastic sand primarily deriving from the explosive activities of Mt. Somma–Vesuvius and Campi Flegrei, facing the Naples area and the urban areas of the foothills.

Supplementary Materials

The following are available online at https://www.mdpi.com/article/10.3390/atmos12091225/s1, Figure S1: Temporal variation of the phase residuals of the iono-free LC component and elevation above the horizon; Figure S2: Four-hour snapshots of LC residuals (MAFE station) in topocentric coordinates for the days 16 & 17 November 2020.

Author Contributions

Conceptualization, U.R. and U.T.; methodology, U.R.; software, U.R.; validation, U.R., U.T. and P.C.; formal analysis, U.R.; investigation, U.R. and U.T.; resources, U.R. and U.T.; data curation, U.R. and U.T.; writing—original draft preparation, U.R., U.T. and P.C.; visualization, U.R.; supervision, U.R. and P.C.; project administration, U.R.; funding acquisition, U.R. and U.T. All authors have read and agreed to the published version of the manuscript.

Funding

TRYAT (TRack Your ATmosphere) project (2017-1-DE02-KA202-004229) Co-funded by ERASMUS + Programme of the European Union.

Institutional Review Board Statement

Not applicable.

Informed Consent Statement

Not applicable.

Data Availability Statement

Data set available on request to corresponding authors.

Acknowledgments

We are grateful to R. Viola and N. Scafetta from DiSTAR-UNINA, who made available meteorological data from MAFE site and the historical time series of Campania Region for the Climate setting of the study area. TRYAT project (2017-1-DE02-KA202-004229) staff is acknowledged too for the availability of data collected at TAI1 GNSS station. Last, but not least, we feel strongly indebted to the three anonymous reviewers who allowed us to significantly improve this article following their insightful comments and suggestions.

Conflicts of Interest

The authors declare no conflict of interest.

References

  1. Wickert, J.; Michalak, G.; Schmidt, T.; Beyerle, G.; Cheng, C.Z.; Healy, S.B.; Heise, S.; Huang, C.Y.; Jakowski, N.; Kohler, W.; et al. GPS Radio Occultation: Results from CHAMP, GRACE and FORMOSAT-3/COSMIC. Terr. Atmos. Ocean. Sci. 2009, 20, 35–50. [Google Scholar] [CrossRef] [Green Version]
  2. Jin, S.; Van Dam, T.; Widowinski, S. Observing and understanding the Earth system variations from space geodesy. J. Geodyn. 2013, 72, 1–10. [Google Scholar] [CrossRef] [Green Version]
  3. Guerova, G.; Jones, J.; Douša, J.; Dick, G.; de Haan, S.; Pottiaux, E.; Bock, O.; Pacione, R.; Elgered, G.; Vedel, H.; et al. Review of the state of the art and future prospects of the ground-based GNSS meteorology in Europe. Atmos. Meas. Tech. 2016, 9, 5385–5406. [Google Scholar] [CrossRef] [Green Version]
  4. Tapley, B.D.; Watkins, M.M.; Flechtner, F.; Reigber, C.; Bettadpur, S.; Rodell, M.; Sasgen, I.; Famiglietti, J.S.; Landerer, F.W.; Chambers, D.P.; et al. Contributions of GRACE to understanding climate change. Nat. Clim. Chang. 2019, 9, 358–369. [Google Scholar] [CrossRef]
  5. Famiglietti, J.S. The global groundwater crisis. Nat. Clim. Chang. 2014, 4, 945–948. [Google Scholar] [CrossRef]
  6. Bevis, M.; Businger, S.; Herring, T.A.; Rocken, C.; Anthes, R.A.; Ware, R.H. GPS Meteorology: Remote sensing of atmospheric water vapor using the global positioning system. J. Geophys. Res. Atmos. 1992, 97, 15787–15801. [Google Scholar] [CrossRef]
  7. Rius, A.; Ruffini, G.; Romeo, A. Analysis of ionospheric electron density distribution from GPS/MET occultation. IEEE Trans. Geosci. Rem. Sens. 1998, 36, 383–394. [Google Scholar] [CrossRef] [Green Version]
  8. Zhang, K.; Fu, E.; Silcock, D.; Wang, Y.; Kuleshov, Y. An investigation of atmospheric temperature profiles in the Australian region using collocated GPS radio occultation and radiosonde data. Atmos. Meas. 2011, 4, 2087–2092. [Google Scholar] [CrossRef] [Green Version]
  9. Gaffen, D.J.; Elliott, W.P.; Robock, A. Relationships between tropospheric water vapor and surface temperature as observed by radiosondes. Geophys. Res. Lett. 1992, 19, 1839–1842. [Google Scholar] [CrossRef] [Green Version]
  10. IPCC. Climate Change 2013: The Physical Science Basis. In Contribution of Working Group I to the Fifth Assessment Report of the Intergovernmental Panel on Climate Change; Stocker, T.F., Qin, D., Plattner, G.-K., Tignor, M., Allen, S.K., Boschung, J., Nauels, A., Xia, Y., Bex, V., Midgley, P.M., Eds.; Cambridge University Press: Cambridge, UK; New York, NY, USA; p. 1535.
  11. Seneviratne, S.I.; Nicholls, N.; Easterling, D.; Goodess, C.M.; Kanae, S.; Kossin, J.; Luo, Y.; Marengo, J.; McInnes, K.; Rahimi, M. Changes in Climate Extremes and Their Impacts on the Natural Physical Environment.; Cambridge University Press: Cambridge, UK, 2012; pp. 109–230. [Google Scholar]
  12. Champollion, C.; Masson, F.; Van Baelen, J.; Walpersdorf, A.; Chéry, J.; Doerflinger, E. GPS monitoring of the tropospheric water vapor distribution and variation during the 9 September 2002 torrential precipitation episode in the Cévennes (southern France). J. Geophys. Res. 2004, 109, D24102. [Google Scholar] [CrossRef] [Green Version]
  13. Riccardi, U.; Tammaro, U.; Capuano, P. Evaluation of the atmospheric precipitable water at local scale during extreme weather using groundbased CGPS measurements. In Proceedings of the 2013 IEEE Workshop on Environmental, Energy and Structural Monitoring Systems, Trento, Italy, 11–12 September 2013; pp. 37–40. [Google Scholar]
  14. Tammaro, U.; Riccardi, U.; Masson, F.; Capuano, P.; Boy, J.P. Atmospheric Precipitable Water in Somma-Vesuvius Area during Extreme Weather Events from Ground-Based GPS Measurements. In International Symposium on Earth and Environmental Sciences for Future Generations; International Association of Geodesy Symposia; Freymueller, J.T., Sánchez, L., Eds.; Springer: Cham, Swizterland, 2016; Volume 147. [Google Scholar] [CrossRef]
  15. Ejigu, Y.G.; Teferle, F.N.; Klos, A.; Bogusz, J.; Hunegnaw, A. Tracking Hurricanes Using GPS Atmospheric Precipitable Water Vapor Field. In International Association of Geodesy Symposia; Springer: Berlin/Heidelberg, Germany, 2020. [Google Scholar] [CrossRef]
  16. Palumbo, A.; Mazzarella, A. The heat-island over Naples. Weather 1981, 36, 28–29. [Google Scholar]
  17. Palumbo, A.; Mazzarella, A. Local recent changes in extreme air temperatures. Clim. Chang. 1984, 6, 303–309. [Google Scholar] [CrossRef]
  18. Fortelli, A.; Scafetta, N.; Mazzarella, A. Local Warming in the Historical Center of Naples. Int. J. Heat Technol. 2016, 34, S569–S572. [Google Scholar] [CrossRef]
  19. Scafetta, N.; Di Cristo, R.; Mazzarella, A.; Viola, R. L’Osservatorio Meteorologico di San Marcellino Napoli Centro. Rend. Acc. Sc. Fis. Mat. Napoli 2019, LXXXVI, 201–250. Available online: http://www.societanazionalescienzeletterearti.it/index.php?pg=218 (accessed on 15 September 2021). [CrossRef]
  20. Tranfaglia, G.; Braca, G. Analisi Idrologica e Meteorologica dell’Evento Alluvionale del 25–26 Ottobre 1954: Confronto con le Serie Storiche e Valutazione del Periodo di Ritorno di Eventi Analoghi. In Il Nubifragio dell’Ottobre 1954 a Vietri sul Mare. Costa di Amalfi, Salerno; Esposito, E., Porfido, S., Violante, C., Eds.; 2004; pp. 295–348. Available online: https://www.researchgate.net/publication/285503827_Analisi_idrologica_e_meteorologica_dell’evento_alluvionale_del_25-26_ottobre_1954_confronto_con_le_serie_storiche_evalutazione_del_periodo_di_ritorno_di_eventi_analoghi (accessed on 15 September 2021).
  21. Principe, C.; Rosi, M.; Santacroce, R.; Sbrana, A. Explanatory Notes to the Geological Map. In Somma-Vesuvius, Quaderni de “La Ricerca Scientifica”, CNR, 114 (Progetto Finalizzato Geodinamica, Monografie Finali, 8); Santacroce, R., Ed.; Consiglio Nazionale della Ricerca: Naples, Italy, 1987; pp. 11–52. ISSN 0556-9664. [Google Scholar]
  22. Thayer, G.D. An improved equation for the radio refractive index of air. Radio Sci. 1974, 9, 803–807. [Google Scholar] [CrossRef]
  23. Saastamoinen, J. Atmospheric correction for the troposphere and stratosphere in radio ranging satellites. The use of artificial satellites for geodesy. Geophys. Monogr. Ser. 1972, 15, 247–251. [Google Scholar]
  24. Davis, J.L.; Herring, T.A.; Shapiro, I.I.; Rogers, A.; Elgered, G. Geodesy by radio interferometry: Effects of atmospheric modeling errors on estimates of baseline length. Radio Sci. 1985, 20, 1593–1607. [Google Scholar] [CrossRef]
  25. Boehm, J.; Schuh, H. Vienna mapping functions in VLBI analyses. Geophys. Res. Lett. 2004, 31, L01603. [Google Scholar] [CrossRef]
  26. Boehm, J.B.; Werl, S.H. Troposphere mapping functions for GPS and very long baseline interferometry from European Centre for Medium-Range Weather Forecasts operational analysis data. J. Geophys. Res. 2006, 111, B02406. [Google Scholar] [CrossRef]
  27. Lagler, K.; Schindelegger, M.; Böhm, J.; Krásná, H.; Nilsson, T. GPT2: Empirical slant delay model for radio space geodetic techniques. Geophys. Res. Lett. 2013, 40, 1069–1073. [Google Scholar] [CrossRef] [Green Version]
  28. Askne, J.; Nordius, H. Estimation of tropospheric delay for microwaves from surface weather data. Radio Sci. 1987, 22, 379–386. [Google Scholar] [CrossRef]
  29. Bevis, M.; Businger, S.; Chiswell, S.; Herring, T.A.; Anthes, R.A.; Rocken, C.; Ware, R.H. GPS Meteorology: Mapping Zenith Wet Delays onto Precipitable Water. J. Appl. Meteorol. 1994, 33, 379–386. [Google Scholar] [CrossRef]
  30. Rizos, C.; Janssen, V.; Roberts, C.; Grinter, T. GNSS: Precise Point Positioning PPP versus DGNSS. Geomat. World 2012, 20, 18–20. [Google Scholar]
  31. Teunissen, P.J.G.; Khodabandeh, A. Review and principles of PPP-RTK methods. J. Geod. 2015, 89, 217–240. [Google Scholar] [CrossRef]
  32. Banville, S. CSRS-PPP Version 3: Tutorial. Last update: 25 August 2020; p. 11. Available online: https://webapp.geod.nrcan.gc.ca/geod/tools-outils/sample_doc_filesV3/NRCan%20CSRS-PPP-v3_Tutorial%20EN.pdf (accessed on 15 September 2021).
  33. Herring, T.A.; King, R.W.; Floyd, M.A.; McClusky, R.W. Gamit-Globk. Reference Manuals. Release 10.71. 2018, p. 168. Available online: http://geoweb.mit.edu/gg/docs.php (accessed on 15 September 2021).
  34. Blewitt, G.; Hammond, W.C.; Kreemer, C. Harnessing the GPS Data Explosion for Interdisciplinary Science. Eos 2018, 99, 99. [Google Scholar] [CrossRef]
  35. Lyard, F.; Lefevre, F.; Letellier, T.; Francis, O. Modelling the global ocean tides: Modern insights from FES2004. Ocean Dyn. 2006, 56, 5–6. [Google Scholar] [CrossRef]
  36. Altamimi, Z.; Rebischung, P.; Métivier, L.; Collilieux, X. ITRF2014: A new release of the International Terrestrial Reference Frame modeling nonlinear station motions. J. Geophys. Res. Solid Earth 2016, 121, 6109–6613. [Google Scholar] [CrossRef] [Green Version]
  37. Duan, J.; Bevis, M.; Fang, P.; Bock, Y.; Chiswell, S.R.; Businger, S.; Rocken, C.; Solheim, F.S.; Van Hove, T.; Ware, R.; et al. GPS meteorology: Direct estimation of the absolute value of precipitable water. J. Appl. Meteorol. 1996, 35, 830–838. [Google Scholar] [CrossRef] [Green Version]
  38. Ortiz de Galisteo, J.P.; Bennouna, Y.; Toledano, C.; Cachorro, V.; Romero, P.; Andres, M.I.; Torres, B. Analysis of the annual cycle of the precipitable water vapour over Spain from 10-year homogenized series of GPS data. Q. J. R. Meteorol. Soc. 2014, 140, 397–406. [Google Scholar] [CrossRef]
  39. Amendola, S.; Maimone, F.; Pelino, V.; Pasini, A. New records of monthly temperature extremes as a signal of climate change in Italy. Int. J. Climatol. 2019, 39, 2491–2503. [Google Scholar] [CrossRef]
  40. Picone, M.; Orasi, A.; Nardone, G. Sea Surface Temperature monitoring in Italian Seas: Analysis of long-term trends and short-term dynamics. In Proceedings of the IMEKO International Conference on Metrology for The Sea, Naples, Italy, 11–13 October 2017; Available online: https://www.imeko.org/publications/tc19-Metrosea-2017/IMEKO-TC19-METROSEA-2017-07.pdf (accessed on 15 September 2021).
  41. Alshawaf, F.; Balidakis, K.; Dick, G.; Heise, S.; Wickert, J. Estimating trends in atmospheric water vapor and temperature time series over Germany. Atmos. Meas. Tech. 2017, 10, 3117–3132. [Google Scholar] [CrossRef] [Green Version]
  42. Ziv, S.Z.; Alpert, P.; Ruveni, Y. Long-term variability and trends of precipitable water vapour derived from GPS tropospheric path delays over the Eastern Mediterranean. Int. J. Climatol. 2021, 1–22. [Google Scholar] [CrossRef]
  43. Jin, S.G.; Park, J.; Cho, J.; Park, P. Seasonal variability of GPS-derived zenith tropospheric delay (1994–2006) and climate implications. J. Geophys. Res. 2007, 112, D09110. [Google Scholar] [CrossRef]
  44. Alinia, S.; Tiampo, K.F.; Samsonov, S.V.; González, P.J. Modelling the elevation-dependent seasonal amplitude of tropospheric delays in GPS time-series using DInSAR and meteorological data. Geophys. J. Int. 2019, 216, 676–691. [Google Scholar] [CrossRef]
  45. Bechtold, B. Violin Plots for Matlab, Github Project. 2016. Available online: https://github.com/bastibe/Violinplot-Matlab (accessed on 15 September 2021). [CrossRef]
  46. Benevides, P.; Catalao, J.; Miranda, P.M.A. On the inclusion of GPS precipitable water vapour in the nowcasting of rainfall. Nat. Hazards Earth Syst. Sci. 2015, 15, 2605–2616. [Google Scholar] [CrossRef] [Green Version]
  47. Li, G.; Deng, J. Atmospheric water monitoring by using ground-based GPS during heavy rains produced by TPV and SWV. Adv. Meteorol. 2013, 12, 793957. [Google Scholar] [CrossRef]
  48. Priego, E.; Jones, J.; Porres, M.J.; Seco, A. Monitoring water vapour with GNSS during a heavy rainfall event in the Spanish mediterranean area. Geomat. Nat. Hazards Risk 2017, 8, 282–294. [Google Scholar] [CrossRef]
  49. Huelsing, H.K.; Wang, J.; Mears, C.; Braun, J.J. Precipitable water characteristics during the 2013 Colorado flood using ground-based GPS measurements. Atmos. Meas. Tech. 2017, 10, 4055–4066. [Google Scholar] [CrossRef] [Green Version]
  50. Barindelli, S.; Realini, E.; Venuti, G.; Fermi, A.; Gatti, A. Detection of water vapor time variations associated with heavy rain in northern Italy by geodetic and low-cost GNSS receivers. Earth Planets Space 2018, 70, 28. [Google Scholar] [CrossRef] [Green Version]
  51. EUMETSAT Data Service. 2021. Available online: https://view.eumetsat.int/productviewer (accessed on 20 June 2021).
  52. Sato, K.; Eugenio, R.; Tsuda, T.; Oigawa, M.; Iwaki, Y.; Shoji, Y.; Seko, H. A High-Resolution, Precipitable Water Vapor Monitoring System Using a Dense Network of GNSS Receivers. J. Disaster Res. 2013, 8, 37–47. [Google Scholar] [CrossRef] [Green Version]
  53. Ferretti, R.; Lombardi, A.; Tomassetti, B.; Sangelantoni, L.; Colaiuda, V.; Mazzarella, V.; Maiello, I.; Verdecchia, M.; Redaelli, G. A meteorological–hydrological regional ensemble forecast for an early-warning system over small Apennine catchments in Central Italy. Hydrol. Earth Syst. Sci. 2020, 24, 3135–3156. [Google Scholar] [CrossRef]
  54. Zanchetta, A.D.L.; Coulibaly, P. Recent advances in real-time pluvial flash flood forecasting. Water 2020, 12, 570. [Google Scholar] [CrossRef] [Green Version]
  55. Barredo, J.I. Major flood disasters in Europe: 1950–2005. Nat. Hazards 2007, 42, 125–148. [Google Scholar] [CrossRef]
  56. Lu, C.; Li, X.; Ge, M.; Heinkelmann, R.; Nilsson, T.; Soja, B.; Dick, G.; Schuh, H. Estimation and evaluation of real-time precipitable water vapor from GLONASS and GPS. GPS Solut. 2016, 20, 703–713. [Google Scholar] [CrossRef] [Green Version]
  57. Li, X.; Dick, G.; Lu, C.; Ge, M.; Nilsson, T.; Ning, T.; Wickert, J.; Schuh, H. Multi-GNSS Meteorology: Real-Time Retrieving of Atmospheric Water Vapor from BeiDou, Galileo, GLONASS, and GPS Observations. IEEE Trans. Geosci. Remote Sens. 2015, 53, 6385–6393. [Google Scholar] [CrossRef] [Green Version]
  58. Gurbuz, G.; Jin, S. Long-time variations of precipitable water vapour estimated from GPS, MODIS and radiosonde observations in Turkey. Int. J. Climatol. 2017, 37, 5170–5180. [Google Scholar] [CrossRef]
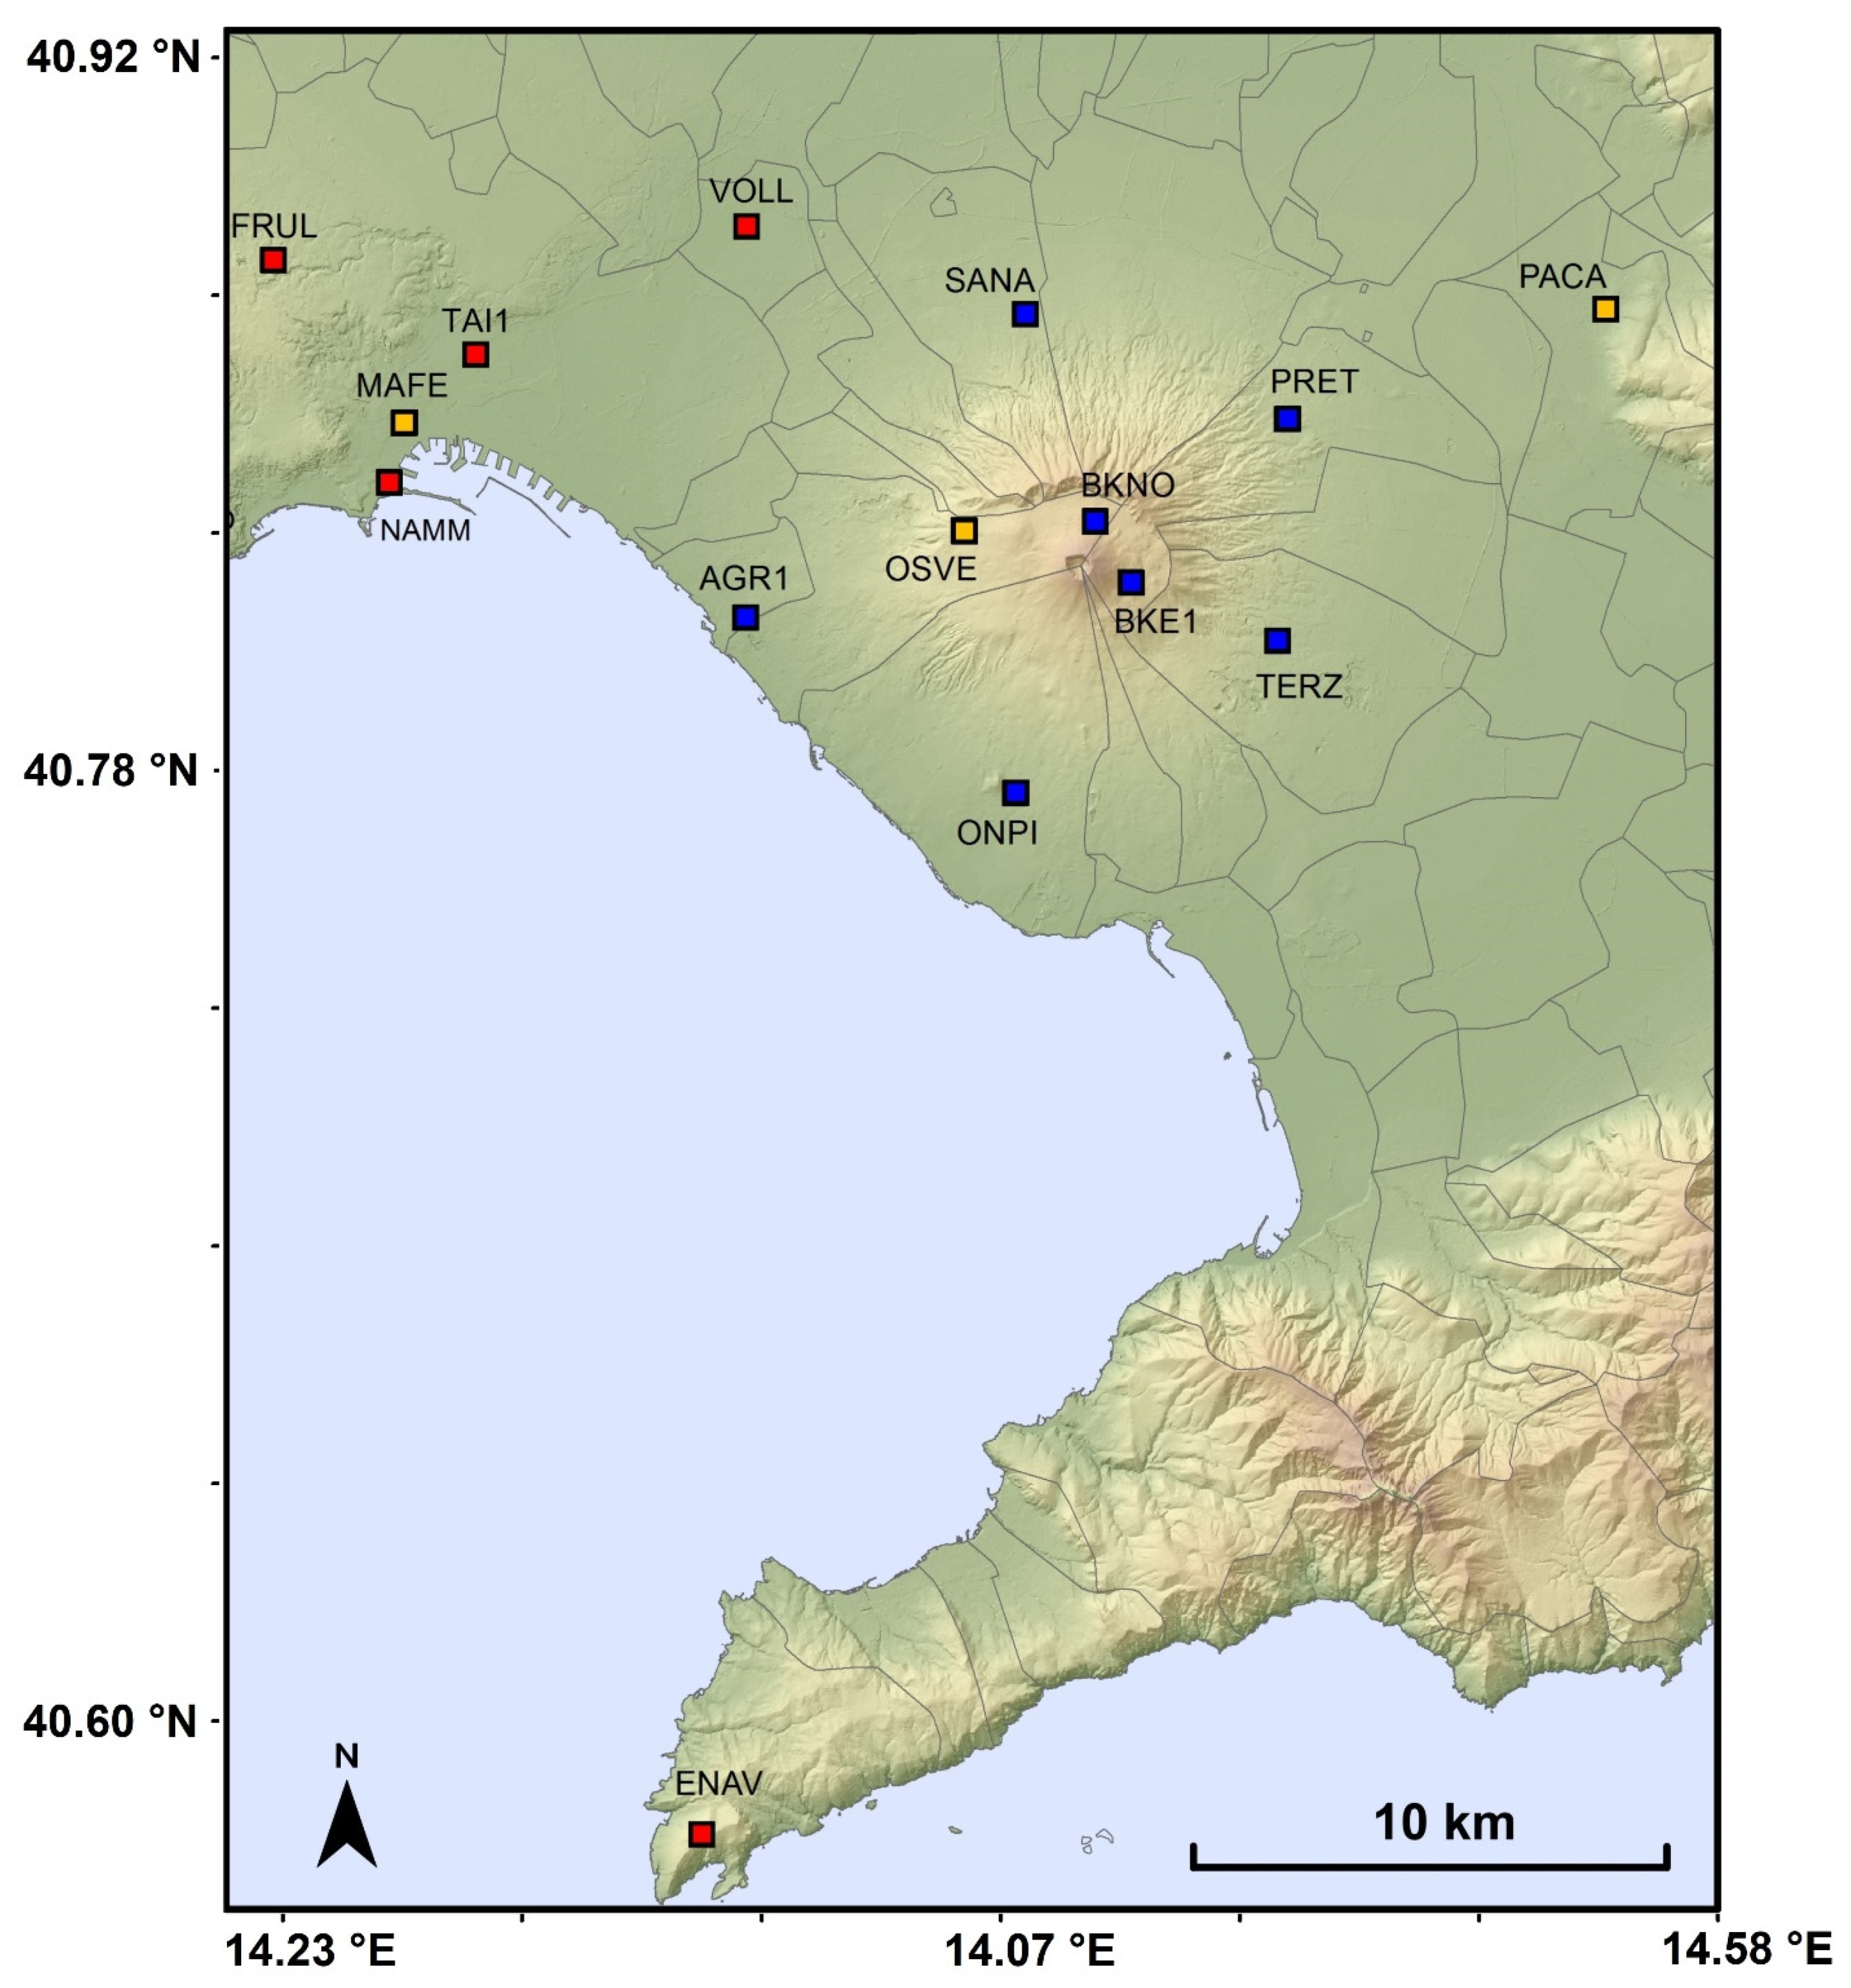
Figure 1. NeVoCGPS network. Selection of GPS sites used for the study of the thunderstorms (red and yellow squares) and the long-term PWV time series (blue and yellow squares). The map was produced by the INGV-OV Laboratory of Geomatics and Thermography. © LGT INGV OV.
Atmosphere 12 01225 g001
Figure 2. Time evolution of the PWV from 2006 to 2016 at AGR1 station (a,b) assessment of decadal trend (blue curve) after removal of an annual periodic component (red curve).
Atmosphere 12 01225 g002
Figure 3. Spectral analysis of the low-pass-filtered daily PWV (like the red curve in Figure 2a) at five stations of the network; FFT amplitude spectrum (a) and a spectrogram of PWV time series at AGR1 (b); units of frequency are cycles per day (cpd).
Atmosphere 12 01225 g003
Figure 4. Monthly variability in different years of PWV at three stations of the NeVoCGPS, located at heights ranging between 70 m (AGR1) and 864 m (BKE1) a.s.l.
Atmosphere 12 01225 g004
Figure 5. Regression of the average PWV for each station versus its altitude above sea level.
Atmosphere 12 01225 g005
Figure 6. Violin plots for PWV values: (a) daily values for PACA site used as an example, (b,c) monthly values for several NeVoCGPS sites. Each PWV value is plotted with a kernel density estimate (the violin shaped envelope), where the individual daily/monthly mean values (circles) are also plotted within each shape. The annual cycle (a,b) and the variability of PWV with height (c) are clearly visible; the white circle indicates the median, the thicker grey bars in the middle of the violin indicate the interquartile range (IQR), the lower/upper adjacent values (the grey lines stretched from the bar)—defined as first quartile −1.5 IQR and third quartile +1.5 IQR, respectively. Plots have been produced with the Matlab® code by Bechtold and Bastian [45].
Atmosphere 12 01225 g006
Figure 7. PWV at MAFE GPS station retrieved from GAMIT/GLOBK analysis (blue curve) and rainfall amount on the occasions of two thunderstorms (DoY 266, 269 = 23, 26 September 2019).
Atmosphere 12 01225 g007
Figure 8. IR images from the SEVIRI instrument on-board Meteosat Second Generation (MSG) satellites “calibrated” by precipitation measurements from PMW satellite sensors in sun-synchronous orbits (EUMETSAT Data Service, 2021) [51]); the red box marks the target area (same as in Figure 1).
Atmosphere 12 01225 g008
Figure 9. Thirty-second values of PWV, obtained with CSRS-PPP analysis, for a selection of stations of NeVoCGPS network close to MAFE, where weather observations are collected, and rainfall amounts (grey curve); NGL and Gamit solutions for TAI1 and MAFE stations, respectively, are also plotted as a reference.
Atmosphere 12 01225 g009
Figure 10. Thirty-second values of PWV, obtained with CRS-PPP analysis, for a selection of stations of NeVoCGPS network located at different heights and rainfall amounts (grey curve); NGL and Gamit solutions for TAI1 and MAFE stations, respectively, are also plotted too a reference.
Atmosphere 12 01225 g010
Figure 11. Hourly PWV values retrieved from Gamit analysis at the GNSS station TAI1 for different satellite constellations. The inter-constellation difference and rainfall is also plotted.
Atmosphere 12 01225 g011
Table 1. Geographical coordinates, altitude above sea level, analysis type and the name of the GNSS stations used in this study.
Station (ID)Latitude (°N)Longitude (°E)Altitude (m a.s.l.)Analysis Type
AGR140.81114.34370long term
BKE140.81914.439864long term
BKNO40.83014.430959long term
ENAV40.58214.335485long term
FRUL40.87714.225233thunderstorm
MAFE40.84714.25857long term/thunderstorm
NAMM40.83614.2543thunderstorm
ONPI40.77914.411123long term
OSVE40.82814.397624long term/thunderstorm
PACA40.87014.55674long term/thunderstorm
PRET40.84914.477209long term
SANA40.86914.412156long term
TAI140.85914.27635thunderstorm
TERZ40.80814.475180long term
VOLL40.88314.34833thunderstorm
Table 2. Thunderstorms analysed in this study; rain amounts measured at MAFE station.
Thunderstorms
StartEndTotal Rain (mm)
23 September 2019, 01:0023 September 2019, 04:0021.6
26 September 2019, 01:0026 September 2019, 06:0028.2
16 November 2020, 22:3017 November 2020, 02:3070.2
Table 3. PWV trends retrieved from the GAMIT/GLOBK analysis [33] applied on the decadal GPS data sets; it was not possible to determine the trend for BKNO because data had different gaps.
Station
(Id)
Altitude
(m a.s.l.)
Time Span
(Years)
PWV Trend Rate
(mm/Decade)
AGR17010+1.94 ± 0.15
BKE186410+1.8 ± 0.22
BKNO95911N.D.
ENAV48510+1.4 ± 0.12
MAFE576N.D.
ONPI12310+2.0 ± 0.22
OSVE6246N.D.
PACA7410+1.8 ± 0.11
PRET20911+1.1 ± 0.26
SANA15611+1.94 ± 0.26
TERZ18011+2.9 ± 0.27
Publisher’s Note: MDPI stays neutral with regard to jurisdictional claims in published maps and institutional affiliations.

