Short- to Medium-Term Sea Surface Height Prediction in the Bohai Sea Using an Optimized Simple Recurrent Unit Deep Network
 Pengfei Ning1,2
  Xuefeng Zhang
- 1School of Marine Science and Technology, Tianjin University, Tianjin, China
- 2National Marine Data and Information Service, Ministry of Natural Resources, Tianjin, China
Global warming has intensified the rise in sea levels and has caused severe ecological disasters in shallow coastal waters such as the Northeastern China's Bohai Sea. The prediction of the sea surface height anomaly (SSHA) has great significance in the context of monitoring changes in sea levels. However, the non-linearity of SSHA due to the occurrence of dynamic physical phenomena poses a challenge to current methods(e.g., ROMS, MITgcm) that aim to provide accurate predictions of SSHA. In this study, we have developed an optimized Simple Recurrent Unit (SRU) deep network for the short- to medium-term prediction of the SSHA using Archiving Validation and International of Satellites Oceanographic (AVISO) data. Thanks to the parallel structure of the SRU, the computational complexity of the deep network can be reduced to a considerable extent and this makes the short- to medium-term prediction more efficient. To avoid over-fitting and a vanishing gradient, a skip-connection strategy has been utilized for model optimization, and this improves significantly the accuracy of prediction. Detailed experiments were carried out in the Bohai Sea to evaluate the proposed model and it was demonstrated that the proposed framework (i) outperformed significantly the current deep learning methods such as the BP (Backpropagation), the RNN (Recurrent Neural Network), the LSTM (Long Short-term Memory), and the GRU (Gated Recurrent Unit) algorithms for 1, 5, 20, and 300-day prediction; (ii) can predict the short-term trend in the SSHA (for the next day or 2 days) in real time; and (iii) achieves medium-term prediction in seconds for the next 5–20 days and shows great potential for applications requiring medium- to long-term predictions. To the best of our knowledge, this is the first paper that investigates the effectiveness of the SRU deep learning model for short- to medium-term SSHA predictions.
1. Introduction
1.1. Research Background
As a result of global warming, the sea-level has rose considerably in the last few decades (Fasullo et al., 2020). Studies have shown that in recent decades the global sea-level has changed from a relatively low average rate (0.4 mm/a) of increase in the past two thousand years to a much higher rate (3.6 mm/a) (Kittel et al., 2021). However, the magnitude of the rise in the global sea-level is not consistent in space, and the changes in sea-level have significant regional characteristics from the decadal to the multigenerational scale. The global average rate of rise in sea-level for the period 1993–2019 was 3.24 ± 0.3 mm/a; in the same period, the rate of rise of sea-level along China's coast was 3.9 mm/a (Kappelle, 2020). Sea level rise along China's coast is more serious (Jeon et al., 2021). In the last 10 years, the average sea-level of China's coastal areas has been at a high level in the past 40 years, being about 100 mm higher than the average sea-level in 1980–1989. Due to the shallow water of the Bohai Sea (average 18 m), the rate of rise of the sea-level in this area for 1980–2019 was 3.7 mm/a. It is estimated that, in the next 30 years, the sea-level of the Bohai Sea will rise by 55–180 mm (Tang et al., 2021).
Rises in sea-level have a serious impact on the economic and social development of the coastal areas of China. A recent analysis of the Global Navigation Satellite System (GNSS) data over a 10 year period showed that although, in the main, the sea-level in the north coast of the Yangtze River estuary has risen, the sea-level in the west coast of Bohai Bay has decreased significantly. The west bank of Bohai Bay has numerous rivers due to the low lying and flat terrain and strong land subsidence, hence this area has become one of the most sensitive areas to experience regional sea-level changes (Wang et al., 2017; Cui et al., 2018; Feng et al., 2019).
The factors affecting sea-level change include melting glacial ice, precipitation, evaporation, runoff, and other seawater exchange processes, as well as changes in seawater density due to changes in temperature or salinity (Jeon et al., 2021). These factors are classified as spatial effects (Tang et al., 2021). It was reported (Guo et al., 2015) that the seasonal variation and spatial distribution of SSHA were related to the changes in the volume of seawater and the effect of differences in temperature, which are due to changes in the onset of the monsoon and the seawater temperature, respectively. Also, based on satellite altimetry data, the spatial and seasonal variations of the SSHA in the coastal waters to the east of China have been analyzed (Yan et al., 2020).
Given the increase in sea-level, how best to accurately predict the changes in sea-level and then make risk management decisions and adopt effective prevention strategies based on the science has become an important issue of widespread concern to the scientific community and society. However, the stochastic dynamics and instabilities of changes in sea-level brings many challenges with respect to the prediction of the SSHA and may limit our ability to respond in a timely manner to the effects of global change (Yu et al., 2019a; Wang et al., 2020).
1.2. Related Works
The traditional research methods for prediction of the SSHA mainly comprise physics-based and statistical-based methods. Based on the sea-level, temperature, salinity, wind field, and other relevant environmental parameters, the physical processes that control ocean movement and circulation may be described; then a method of converting the physics-based model to obtain a model that describes the changes in sea-level is called a physics-based method. In general, for long-term prediction, physics-based methods tend to have excellent characteristics, while statistical-based methods are more suitable for short-term prediction in specific practical applications. Physics-based models have very strict requirements for high-performance computing systems: first, the solution of the model requires very large computing power, and the real-time requirements for prediction are very high, thus the model must complete the calculation within the specified time. Second, with the continuous improvement of forecasting accuracy, the required computing power will show a geometric growth. Therefore, the effective predictable period of the current prediction system based on physical model is about one week and the accuracy of ~0.9 (Qiao et al., 2016, 2019). Statistical-based methods and deep learning networks using a data-driven approach to SSHA forecasting, and have the ability to do so with less computational and time costs. The current method achieves average predicting accuracy of coming 24, 48, 72, 96, and 120 h by 0.9, 0.85, 0.79, 0.74, 0.68, respectively (Shao et al., 2015; Song et al., 2020). Statistical-based methods focus on building a prediction model using the relationships between historical data. The interaction of factors that affect the changes in sea-level make the time-series data exhibit variation and non-linear characteristics, which lead to large deviations between the prediction results, based on the traditional time-series, the statistical model, and other conventional methods, and the actual results; moreover it is difficult to obtain satisfactory results. With the development of artificial intelligence (AI)-based algorithms, deep learning methods have shown great power in being able to undertake prediction tasks. The deep learning method has obvious advantages in being able to process a large number of samples and non-linear data, and can describe the highly complex relationships existing between the input data and the output data. Well-known deep learning networks for spatio-temporal learning and predictions include the Recurrent Neural Network (RNN) (Mahata et al., 2019), the Long Short-Term Memory (LSTM) (Graves, 2012), and the Gated Recurrent Unit (GRU) (Li et al., 2021), etc. Recently, the prediction systems based on these neural networks have been applied for the prediction of the SSHA (Shao et al., 2015; Song et al., 2020).
1.2.1. Recurrent Neural Networks (RNN)
Traditional neural networks usually assume that all inputs (or outputs) are independent of each other. However, in the process of practical operation, there is a dependency between the current state of each node and the previous steps, and this is the basic assumption of expanded RNN. The signal feedback structure of the recurrent neural networks (RNN) (Mahata et al., 2019) adopts the output state of the network at the time of K associated with the historical signal before the time of K, in order for it to have dynamic characteristics and a memory capability. However, RNNs are challenged by the vanishing gradient problem, where the gradient decreases over time (Mahata et al., 2019). Moreover, the RNN may also suffer from the gradient explosion problem. Although many techniques have been developed to address these issue, it remains difficult to obtain long-term memory.
1.2.2. Long Short-Term Memory (LSTM)
The phenomena of the vanishing gradient and the exploding gradient of the RNN may not mean that learning cannot be implemented, but even if it can, the process will be very slow. One solution is to establish the weight of linear self-connections with a value close to 1 in the self-connection part, which is called the leaky unit. At present, the most effective way to adjust the weight of the linear self-linking is through gates, thus allowing the weight of linear self-linking to change and make adjustments at each step. LSTM (Graves, 2012) is an implementation of gated RNNs. The LSTM is a new cyclic network architecture training method featuring a gradient based learning algorithm. The approach can learn how to span a time interval of more than 1,000 steps to overcome the problem of error return. The LSTM has successfully solved the defects of the original cyclic neural network and has become the most popular RNN (Yu et al., 2019b).
1.2.3. Gated Recurrent Unit (GRU)
Due to its complex internal structure, the training of the LSTM network is the very time-consuming and the LSTM exhibits a poor real-time capability. With the rapid growth in demand for speech-to-text applications, computing resources are currently not even keeping up with its needs. To solve this problem, Gated Recurrent Unit (GRU) network model (Li et al., 2021) was proposed on the basis of the original LSTM model. The forget gate and the input gate are combined into a single update gate, and the cell state, the hidden state and other changes are also mixed. The GRU neural network has been successfully applied to sequential or temporal data. The GRU has a simpler structure than the LSTM; nevertheless, its performance is comparable with the LSTM. The GRU even outperforms LSTM but has a lower complexity and faster convergence (Zhou et al., 2021). However, the GRU has a serial structure, which makes parallel computation hard to implement.
1.2.4. Simple Recurrent Unit (SRU)
The common feature of LSTM and GRU is that the calculation of the gate of each time step depends on the output of the previous time step, which leads to a high serial dependence of the network. Also, it is difficult to speed up the calculation by parallel calculation. To solve this problem, the Simple Recurrent Unit (SRU) network was proposed (Lei et al., 2018). The main design feature of the SRU is that the gate calculation depends only on the current input cycle. In this way, only the point-by-point matrix multiplication of the model depends on the previous time step. Thus, the network can be configured in parallel. In addition, the SRU also reduces the number of gates, and the design only features the forget gate and the reset gate. In this way, the calculation efficiency of SRU neural network is higher than that of LSTM and GRU (Jiang et al., 2018).
1.3. The Contribution of This Paper
This paper has developed an SRU model for the short- to medium-term prediction of the SSHA. The parallel computing afforded by the SRU makes it more efficient than the traditional RNN, LSTM, and GRU methods. To solve the problems of over-fitting and vanishing gradient, a skip-connection strategy, which can significantly improve the prediction accuracy, was utilized for model optimization. An outline of the workflow is as follows: We analyzed and normalized the historical SSHA data from the Archiving Validation and International of Satellites Oceanographic (AVISO) center, and then, using the statistical relationships for the historical data, the SRU model for training of the historical data was established. In the training process, we introduced the SRU optimization strategy to solve the gradient explosion phenomenon and the disappearance. Finally, the well-trained model was applied for the short- to medium-term prediction of the SSHA in the Bohai Sea. The model is compared with traditional models (e.g., BP, RNN, LSTM, GRU, and SRU) with regards to prediction accuracy and efficiency.
The organization of this paper is as follows: section 2 introduces the methodology, which includes the principle of the SRU model and its construction. Section 3 analyses the results for 1, 5, 20, and 300-day prediction by comparing the results for the proposed model with the existing BP, RNN, LSTM, and GRU models. We summarize the results of this paper in section 4 and provide future research directions.
2. Methodology
2.1. The Principle of SRU
The basic structure of SRU is shown in Figure 1, where the SRU infrastructure consists of a single forget gate. Assumed input Xt and time t, we need to calculate linear transformation and forget gate ft. This calculation only depends on Xt, therefore parallel processing can be carried out.The forget gate contains internal state Ct, and we need to calculate output state ht, where G represents the activation function, f represents the forget gate, r denotes the reset gate, h is the output state, C represents the internal state, and x represents the input. The SRU is defined in Equation (1) where it can be shown that computations are dependent only on Xt, allowing computations to be parallelized.
SRU algorithm is mainly developed to remove the time dependence of the most computing operations, and carry out parallel processing. Figure 2 compares the structure of SRU with that of the traditional RNN. On the left is the traditional RNN/LSTM/GRU structure. The gray calculation part of each time has to wait until the last time. It is mainly reflected in the matrix multiplication of the hidden layer and the weight of each door in the last time, which is very time-consuming. While SRU can be parallel in calculating gate, that is to say, matrix operation with large amount of calculation at each time can be parallel. The rest of the dependence is the calculation of Ct and Ht. These calculations are all element-wise multiplication and addition, which is very fast.
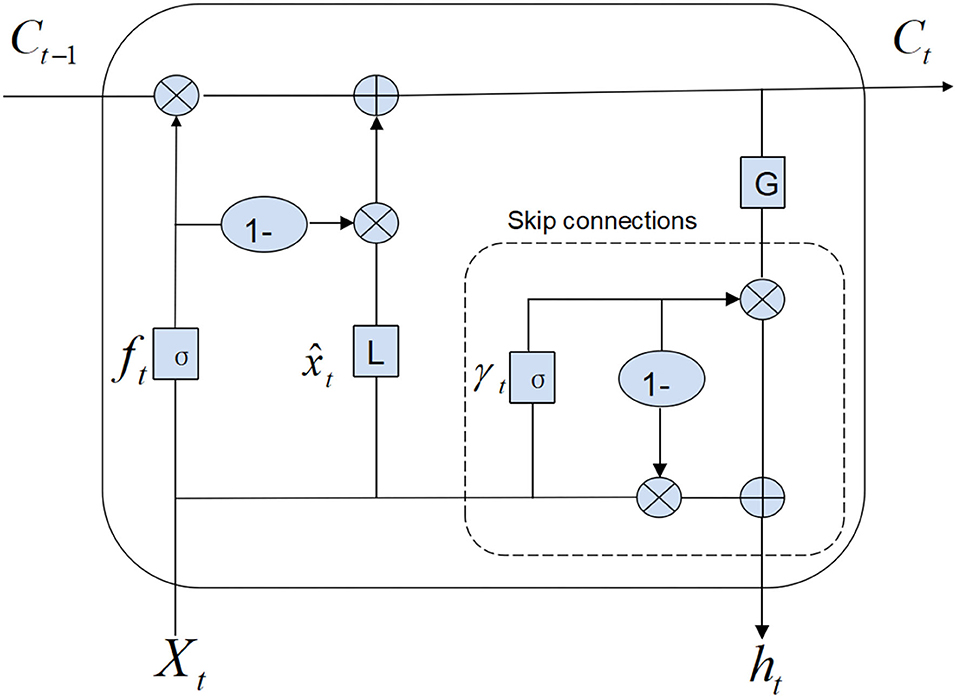
Figure 1. The basic structure of SRU. From the above diagram, we can see that the SRU infrastructure consists of the input Xt and time t, a single forget gate ft, and reset gate rt. The forget gate contains internal state Ct, and we need to calculate output state ht, where G represents the activation function. In SRU, we just need to calculate linear transformation and forget gate ft, which only depends on Xt. Therefore, parallel processing can be carried out.
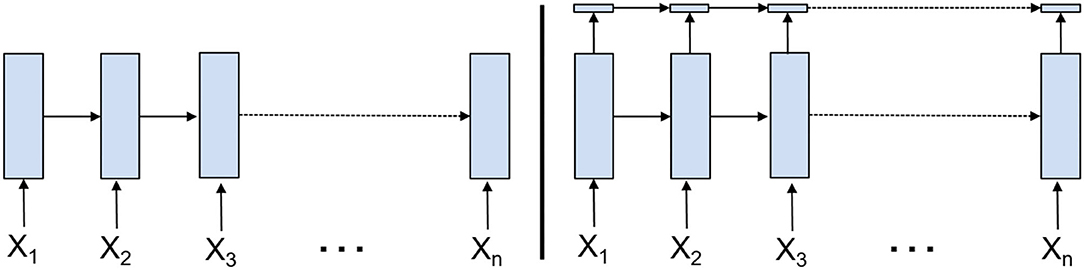
Figure 2. The structure of RNN (left) vs. that of SRU cells (right). Compared with the structure of the traditional RNN, SRU eliminates the time dependence of most computing operations and carries out parallel processing.
SRU is much faster than the current loop implementation, and the loop unit simplifies the state calculation. For SRU, CUDA level optimization method can be used to integrate all elements into a single core function call, which shows the same parallelism similar to CNN, attention model and feedforward network. In particular, although the internal state Ct still using the previous state Ct−1, but in the loop step, it is no longer dependent on ht−1. Finally, all matrix multiplication operations in SRU can be easily parallelized. That is, SRU network ensures most of the operations are put into parallel processing. Only the steps with small amount of operations are serialized.
2.2. The Data Source and Model Construction
In this paper, the sources of data were the altimetry data of TOPEX/Poseidon, Jason 1, ERS-1, and ERS-2 downloaded from the Archiving Validation and International of Satellites Oceanographic (AVISO) website (http://marine.copernicus.eu/). This data consist of daily product on a 1/4° × 1/4° Mercator grid ranging from 1993 to 2018. The study area is the Bohai Sea (37–41° N, 117–122° E). The SSHA data ranges from January 1 1993 to December 31 2018 and is divided into training and testing sets on a 4:1 ratio. Figure 3 shows the Research area and the Absolute dynamic topography of the Bohai Sea. Figure 4 shows the climatology of SSHA distribution in the Bohai Sea. The graph shows that the overall difference in the Bohai Sea is smaller at the same time of the year. For the Bohai Sea, this study first calculate the daily mean SSHA value over the whole Bohai Sea region, and then used this one-dimensional time series data for training and testing. The length of the data sequence was 10,000, and 80% of the data were selected as the training dataset and the remaining 20% were used as the test set.
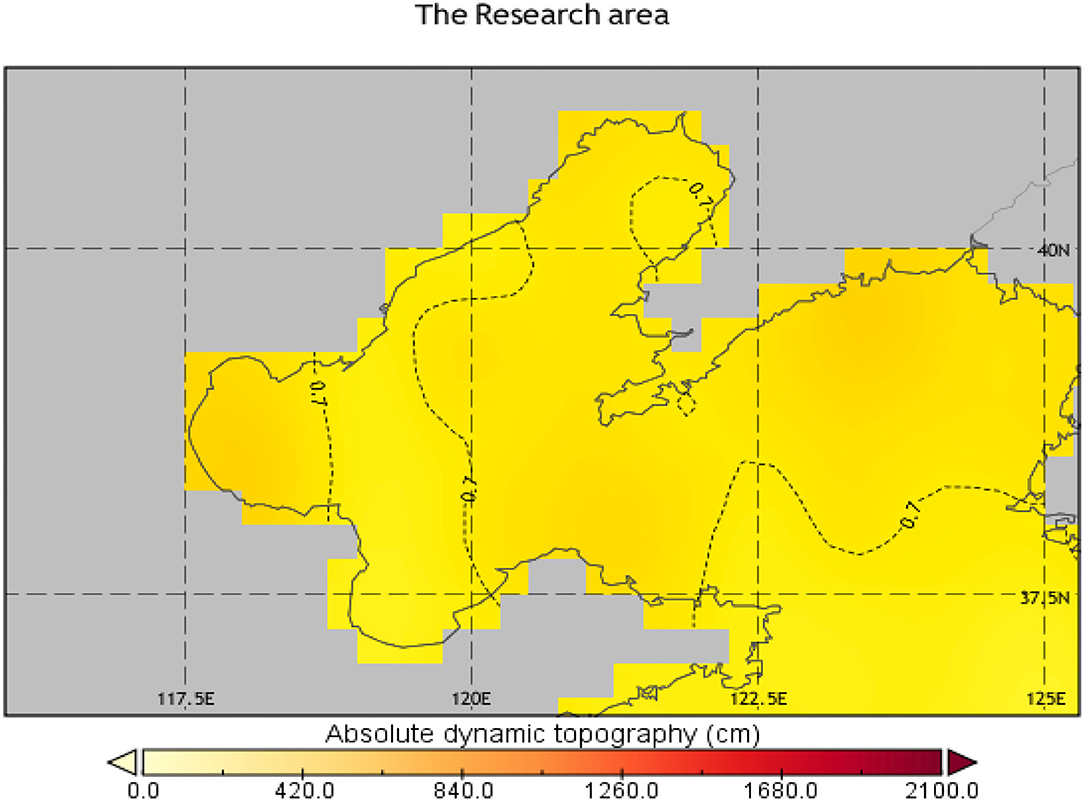
Figure 3. The Research area and the Absolute dynamic topography of the Bohai Sea. As can be seen from the contour lines (dashed lines) in the graph, there is little diversity across the region.
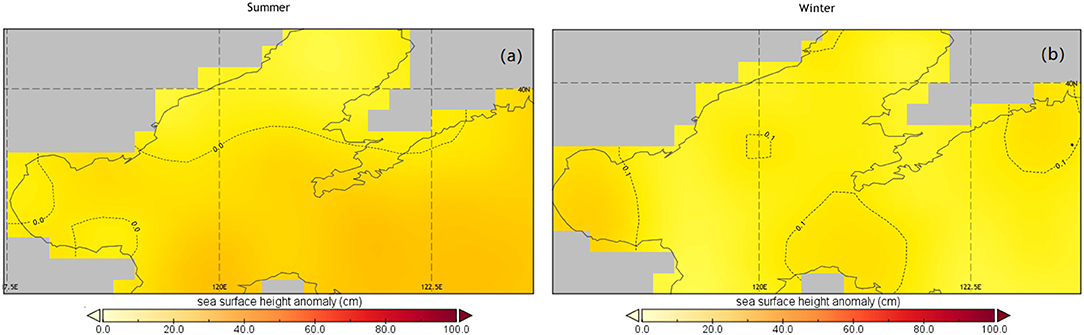
Figure 4. The climatology of SSHA distribution in the Bohai Sea. The graph shows that the SSHA in the Bohai Sea is slightly higher in summer (A) than in winter (B), but the overall difference in the Bohai Sea is smaller at the same time of the year.
Before implementation of the training model, it was necessary to perform data normalization in the pre-processing step. This plays an important role in establishing a robust training model, which can (i) ensure a positive impact during updating of the parameters; (ii) reduce the training time; and (iii) help avoid the side effects caused by the variable distributions and ranges of input data, and make the calculation of the measurement parameters accurate as a result of training.
In this paper, we construct a SRU framework for SSHA prediction with a three-layer SRU modules. Its structure is shown in Figure 5, where x, y denote the input and output data and A, B, C denote the first, second, and third level of SRU module, respectively. This framework eliminates the dependence on T − 1 time step, so it can be accelerated in parallel across time dimension (or input position). During the model training, several parameters need to be initialized. The learning rate (Lr) was initialized to 0.001, batch size was initialized to 100, epoch was initialized to 50, and dropout was initialized to 0.5; each epoch ran 1,000 steps, and each step ran all the input data in the network for one round completely. The parameters of our method were optimized by the Adam algorithm to minimize the loss on the training dataset.
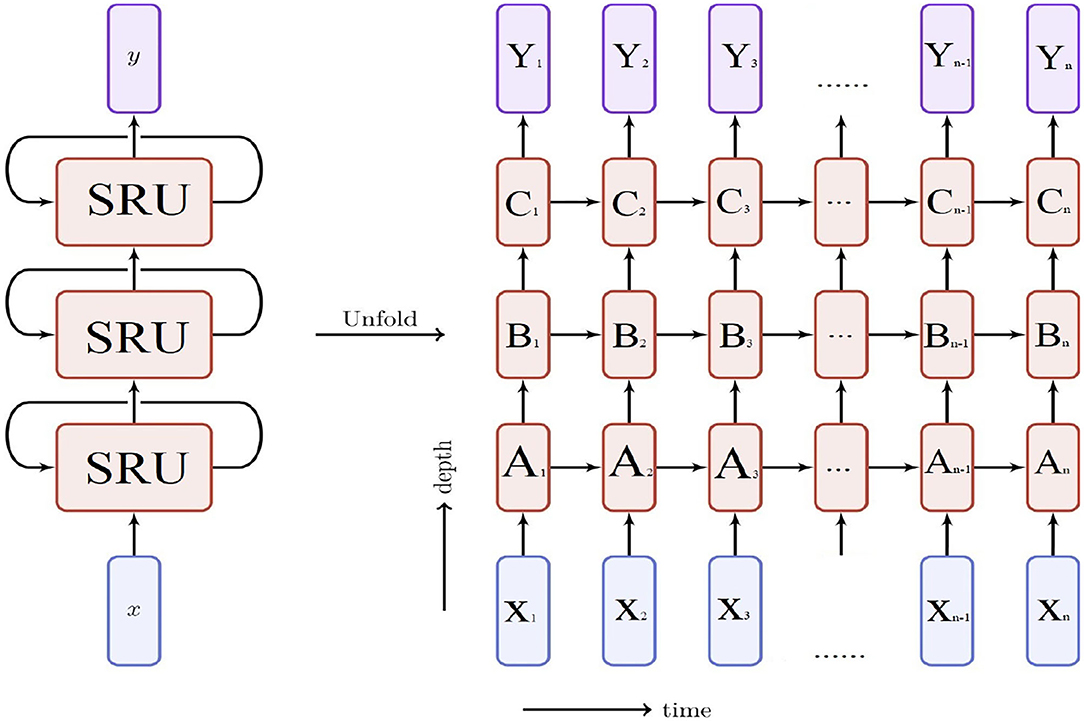
Figure 5. The structure of our model. From the above diagram, we can see that the Xt is the input, Yt is the output. The SRU network ensures most of the operations are all element-wise multiplication and addition, these calculations can be put into parallel processing. With A, B, and C three-layer SRU modules that can be accelerated in parallel across the time dimension.
Well-known data normalization method include the maximum-minimum normalization and the average standard deviation normalization. Here, we use the first one, which has been widely used in deep learning systems. It can scale the original data into 0–1 range through dividing the original data by the difference of the maximum and minimum value. The formula is shown in Equation (2), where denotes the value after normalization:
To evaluate the performance of our method, we define two error indicators to evaluate the performance of our method: R-Squared (R2) and Root Mean Square Error (RMSE). R-Squared (R2) is an important statistical measure of fit which indicates how much variation of a dependent variable is explained by the independent variable(s) in a regression model. It ranges from 0 to 1, where the best fit closes to 1. (R2) can be calculated by Equation (4), where the mean square error (MSE) is defined in Equation (3) as follows:
RMSE is the standard deviation of the residuals (prediction errors), which is a measure of how spread out these residuals are. It identifies how concentrated the data is near the best fit. RMSE is commonly used in prediction analysis to verify experimental results. In the AVISO dataset used in this paper, the SSHA data are in centimeters and the unit of RMSE is the same as SSHA. It is defined in Equation (5) as follows:
3. Prediction Results
To evaluate the effectiveness and efficiency of the proposed method, the performance of the proposed method based on the SRU deep network was compared with that of several existing models, including BP (He et al., 2018), LSTM (Graves, 2012), GRU (Li et al., 2021), and the original SRU (Lei et al., 2018) models without optimization and parallel computing. The performance of the original SRU network without parallel computing was considered mainly because in most scenarios parallel computing is supported in marine survey platforms and equipment. For certain applications, however, and especially for small survey vessels or on small islands, high performance equipment is not readily available and hence parallel computing is not supported. Thus, for these situations, it is necessary to ensure that the SRU framework can be applied for prediction of the SSHA. The short- to medium-term prediction was first performed for the 1, 5, and 20-day prediction. Also, to demonstrate the capability of the method for long-term prediction, a 300-day experiment was performed. The training and testing environment was equipped with 2 × 10 Intel Platinum9200 Xeon scalable processors (128 GB memory) and 16 Tesla V100 SXM2 GPU (total 512 GB).
3.1. Short-Term Prediction Results
The results for the 1 and 5-day predictions are presented in Figure 6 and Table 1 as follows, where SRU denotes the original SRU without optimization and parallel computing. This experiment was performed to show the effectiveness and efficiency of the SRU compared to the existing BP and LSTM family algorithms (LSTM, GRU) for short-term prediction. Given that the 1 and 5-day predications can be performed with the SRU very quickly, it was desirable to include parallel computing in the SRU implementation.
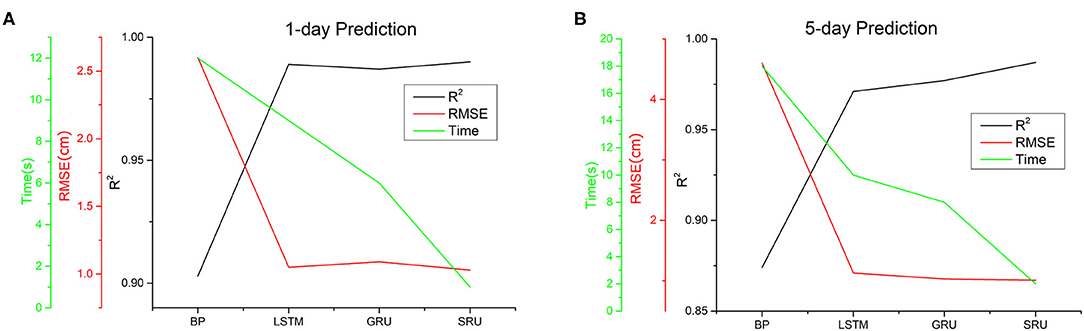
Figure 6. The experimental results of prediction,1-day prediction in (A) and 5-day prediction in (B). LSTM and its variants GRU and SRU methods have the advantage of gating mechanism, which leads to the very high goodness of fit values.
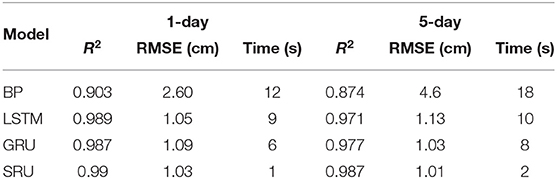
Table 1. The experimental results of 1 and 5-day prediction.
From the experimental results, it can be seen that the LSTM and the GRU and SRU variants outperform the BP method significantly in terms of both accuracy and efficiency. The respective R2 values are all >0.9, and the RMSE values are around 1, which is much lower than 2.6, the value for the BP method. Compared with the commonly used BP neural network, the LSTM family of methods have the advantage of the gating mechanism, which leads to very high goodness-of-fit values. The forget gate in the network can filter the unimportant information automatically and leave the important information for prediction assessment. This mechanism enables the LSTM method to avoid the problem of the vanishing gradient during learning, and to select and memorize important information to make the prediction more accurate.
By comparing the LSTM, GRU, and SRU methods, it can be seen that the SRU gave much better performance than the LSTM and GRU due to its simpler structure. The accuracy of the algorithm is comparable with and even outperforms that of the LSTM and GRU, while it is much faster than the LSTM and GRU methods. Further, the time consumption factor has been reduced to 1 s for 1-day prediction and 2 s for 5-day prediction, which makes the short-term SSHA prediction essentially equivalent to real-time prediction. Overall, this experiment demonstrates good performance for the SRU method in terms of short-term prediction of the SSHA.
3.2. Medium-Term Prediction Results
The medium-term prediction, which plays a significant role in monitoring sea-level changes for decision making, is the most appropriate task for demonstrating the performance of the proposed method. Here, the revised SRU model (SRU*), which features skip-connection optimization and parallel computation, was compared with the BP, LSTM, GRU, and the original SRU method (without optimization and parallel computation). The experimental results, presented in Figure 7 and Table 2, show that the proposed method achieves much more satisfactory results than the current published state-of-the-art methods. The R2 value is much lower. This means that the skip-connection optimization can help alleviate the over-fitting and vanishing gradient problem in the SRU to reduce fitting errors to a large extent. Above all, the time consumption for the SRU* is much lower than that for the existing methods (BP, LSTM, GRU, and original SRU), hence demonstrating the effectiveness of parallel computing in SRU. Moreover, in this experiment, we also tried to build higher-layer SRU models. When the SRU deep network was increased from three to six layers, it was found that the accuracy increased (R2 increased by 9.2% and RMSE decreased by 30%), while the training time changed little. In comparison with the results for short-term prediction, medium-term prediction cannot be performed in real time; however, the method is still fast enough for most applications that require medium-term prediction of sea-level rise.

Figure 7. The experimental results of 20-day prediction. Our medium-term predict method is still fast enough for most applications of sea-level rise.
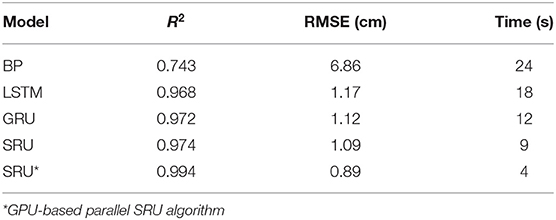
Table 2. The experimental results of 20-day prediction.
3.3. Long-Term Prediction Results
To demonstrate the full extent of the prediction and fitting capabilities of the neural network model, the long-term 300-day prediction was examined. The training time for the three-layer SRU was about 210 s, and the prediction accuracy of the six-layer SRU was found to be better than that of the three-layer SRU; however, the increase in the prediction time was not significant because the jump connection structure greatly increases the calculation speed. In addition, comparing the R2 and RMSE values for the SRU with those of the other neural network models, indicated that the run time for the whole SRU program was shorter than that of the LSTM and the GRU, and the actual prediction outcome was better. The main reason for the improvements is that the SRU's high network and light cycle structure make the SRU outperform the other neural networks in terms of the accuracy and speed of calculation, confirming that the SRU prediction time-series model is superior to that of the other RNN neural networks.
To demonstrate the capability for long-term SSHA prediction, the 300-day prediction experiment was performed. The results are shown in Figure 8 and Table 3, it was observed that the method needed about 210 s to train a three-layer SRU model. Although the computational complexity of long-term prediction is somewhat higher than that of short- and medium-term predictions, the experiment demonstrates the possibilities and power of the method when it is applied to long-term prediction. In addition, compared to the BP and other LSTM models, the run time of the present method is much lower while the prediction accuracy is comparable or even better than the aforementioned methods.
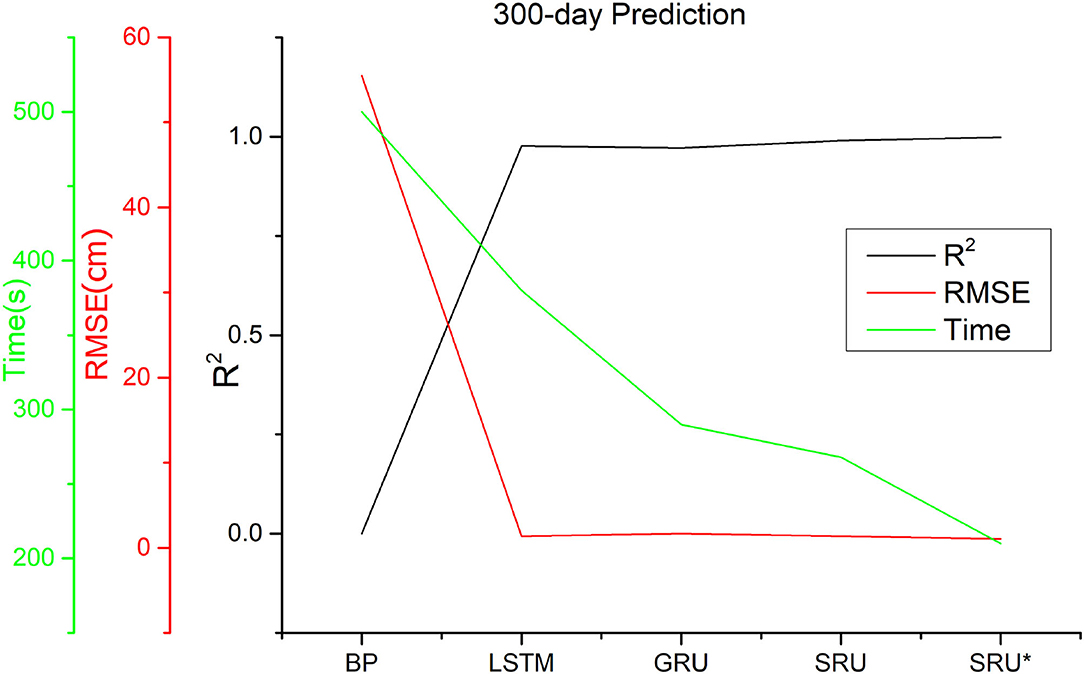
Figure 8. The experimental results of 300-day prediction. The results proves the possibility and power of our method to be applied to long-term prediction.
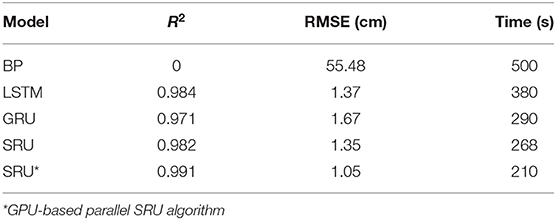
Table 3. The experimental results of 300-day prediction.
The above-mentioned improvements arise mainly from the benefits from the skip connection optimization strategy, which effectively reduces the fitting error. The short- to long- term prediction results all demonstrate the effectiveness and efficiency of the SRU based framework to model the changes in the nonlinear chaotic structure of sea levels. The skip-connection strategy helps the SRU avoid the problem of the vanishing gradient in the empirical prediction, and, in so doing, simultaneously improves the prediction accuracy and reduces the computational complexity.
3.4. The Generalization of the Deep Learning Model
The model generalization of a deep learning model is also a key factor for considering to be used for practical applications. In this section, we investigate the generalization ability of the deep learning model by introducing a new test set: the datasets of National Marine Data and Information Service (NMDIS) reanalysis data (http://mds.nmdis.org.cn/). This dataset belongs to the reanalysis dataset. It is different from the observational AVISO dataset, which is used for training in this paper. The new dataset comprises of daily SSHA data from January 1, 1958 to December 31, 2018. The spatial resolution is 0.5° × 0.5°.
Experimental results of the deep learning model (SRU* with parallel computing and skip-connection) on the 1, 5, 20, and 300-day predictions are shown in Figure 9 and Table 4, respectively. It can be seen from the results that for short and medium prediction, the performance of the deep learning model is almost the same with that on the original dataset. Although for the long term prediction, the R2 of the deep learning model is a little bit lower and its RMSE is relatively higher than that on the original dataset. The performance of the deep learning method for long-term prediction on the new test set is still comparable with that on the original dataset. That is, the deep learning model has very good generalization ability and it can be widely applied to SSHA prediction problems with variant kinds of dataset.
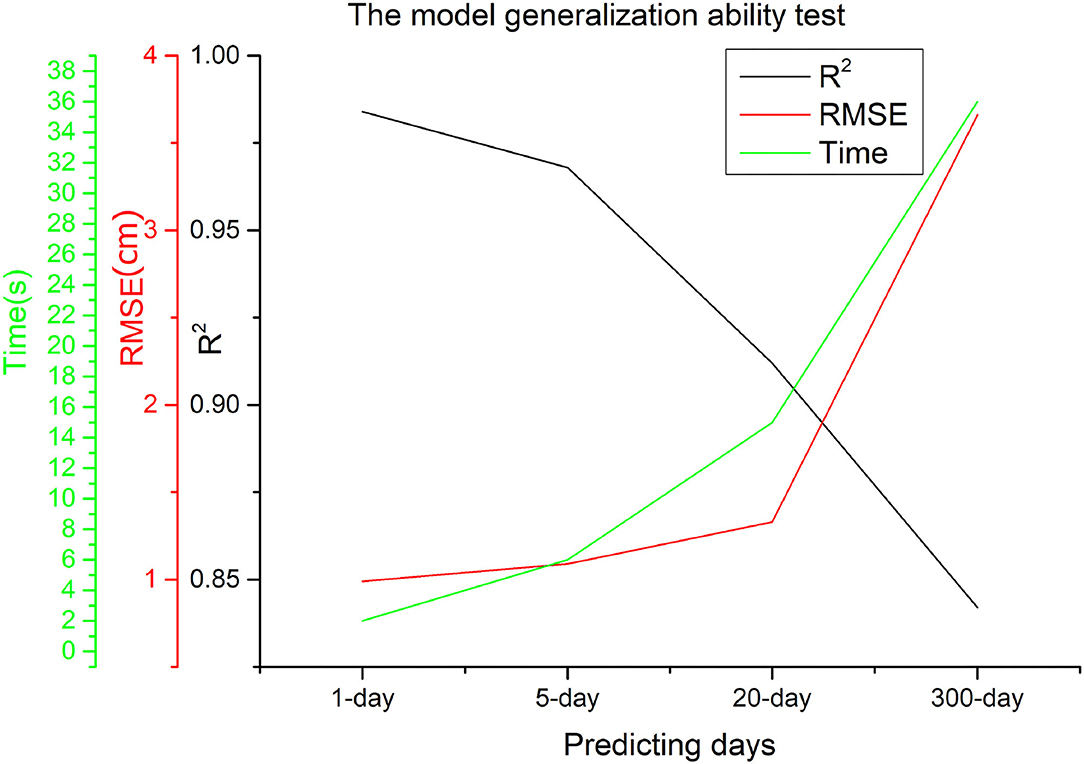
Figure 9. The investigation of model generalization using the new National Marine Data and Information Service test set.
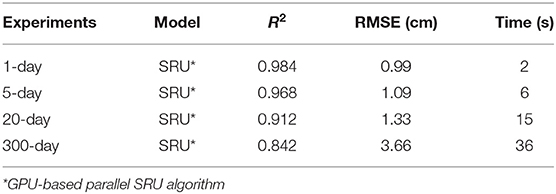
Table 4. The investigation of model generalization using an additional test set.
4. Summary and Discussion
An SRU deep learning network for the short- to medium-term prediction of the sea surface height anomaly (SSHA) has been developed. The parallel structure of the SRU ensures good efficiency of the prediction. To avoid the over-fitting and vanishing gradient problems, the skip-connection strategy was utilized to speed up the convergence in the loss function in the SRU. To evaluate the effectiveness and efficiency of the method, detailed experiments were performed for 1, 5, 20, and 300-day SSHA predictions in the Bohai Sea using AVISO data. The main findings were as follows:
1. For short-term (1 and 5-day) prediction, the original SRU model achieved the best performance with the lowest time consumption among the LSTM family of methods (LSTM and GRU) and also significantly outperformed the traditional BP method. The SRU method can effectively undertake short-term SSHA prediction in real time.
2. For medium-term (20-day) prediction, the revised SRU and SRU* frameworks gave the most satisfactory results compared with the existing methods (BP, LSTM, GRU, original SRU) by introducing the skip-connection optimization strategy and parallel computing. When the SRU deep network was increased from three to six layers, the accuracy clearly increased (R2 increased by 9.2% and RMSE decreased by 30%), while the training time changed little. Although the revised SRU cannot perform medium-term SSHA prediction, it is fast enough for most applications.
3. For long-term (300-day) prediction, the revised SRU and SRU* framework also had great capabilities and possibilities for use in long-term prediction. Compared to the BP and other LSTM models, the running time of the method is much shorter while the prediction accuracy is comparable or even superior. These improvements arise mainly from the skip-connection optimization strategy, which effectively reduces the fitting error.
This study shows that the prediction of the changes in sea-level from the perspective of non-linearity can not only explain the physical laws underpinning the data pertaining to changes in sea-level, but can also play an essential role in establishing the prediction theory based on non-linear deep learning methods. The sensitivity of the non-linear chaotic system to the initial value shows that for the traditional linear model it is difficult to track and predict such non-linear data. In the critical period of global climate change, the changes in sea-level not only follow the basic laws of physics, but also are affected by the unique and non-repetitive events of the climate, such as the impact of global warming and the ENSO (El Nino southern oscillation) events. There are many factors that affect the sea-level, hence proper understanding of the changes which affect the sea-level is a complex task. Given such circumstances, there is an immediate need to improve the accuracy of the prediction algorithms such as the non-linear deep learning methods; these methods are of great significance in the context of prediction capability and forward-looking decision-making.
For the future work, we will put our efforts in improving the performance of SRU framework by introducing more effective optimization and speeding-up techniques to make our method more powerful to be applied for medium and long-term prediction. Moreover, the current work treats the Bohai Sea as a whole region, and uses its mean value as one-dimensional data for SSHA prediction. In the future, we also want to build two-dimensional prediction model, which can be applied for SSHA prediction over each grid point in the Bohai Sea.
Data Availability Statement
The original contributions presented in the study are included in the article/supplementary material, further inquiries can be directed to the corresponding author/s.
Author Contributions
PN and XZ: conceptualization and software. PN, XZ, and XJ: formal analysis. PN, XZ, and CZ: methodology and writing—review and editing. PN: writing—original draft. All authors contributed to the article and approved the submitted version.
Funding
This work was supported by National Natural Science Foundation of China (No. 41806116) and Municipal Natural Science Foundation of Tianjin (No. 20JCQNJC01230).
Conflict of Interest
The authors declare that the research was conducted in the absence of any commercial or financial relationships that could be construed as a potential conflict of interest.
Publisher's Note
All claims expressed in this article are solely those of the authors and do not necessarily represent those of their affiliated organizations, or those of the publisher, the editors and the reviewers. Any product that may be evaluated in this article, or claim that may be made by its manufacturer, is not guaranteed or endorsed by the publisher.
Acknowledgments
This research was supported/partially supported by Tianjin University, National Marine Data and Information Service. We have to express our appreciation to the Jingsheng Zhai for sharing pearls of wisdom with us during the course of this research. We are also immensely grateful to Jinkun Yang and Yulong Liu for their comments on earlier versions of the manuscript, although any errors are our own and should not tarnish the reputations of these esteemed professionals. We are also grateful to Xiaoyu He for assistance with python programming technology, and Xi He who polished this paper and in that line improved the manuscript significantly.
References
Cui, Q., Xie, W., and Liu, Y. (2018). Effects of sea level rise on economic development and regional disparity in China. J. Clean. Prod. 176, 1245–1253. doi: 10.1016/j.jclepro.2017.11.165
Fasullo, J. T., Gent, P. R., and Nerem, R. S. (2020). Sea level rise in the CESM large ensemble: the role of individual climate forcings and consequences for the coming decades. J. Clim. 33, 6911–6927. doi: 10.1175/JCLI-D-19-1001.1
Feng, J., Li, D., Wang, T., Liu, Q., Deng, L., and Zhao, L. (2019). Acceleration of the extreme sea level rise along the chinese coast. Earth Space Sci. 6, 1942–1956. doi: 10.1029/2019EA000653
Graves, A., (ed.). (2012). “Long short-term memory,” in Studies in Computational Intelligence, Vol. 1 (Berlin; Heidelberg: Springer), 37–45. doi: 10.1007/978-3-642-24797-2_4
Guo, J., Wang, J., Hu, Z., Hwang, C., Chen, C., and Gao, Y. (2015). Temporal-spatial variations of sea level over China seas derived from altimeter data of TOPEX/Poseidon, Jason-1 and Jason-2 from 1993 to 2012. Chin. J. Geophys. 58, 3103–3120. doi: 10.6038/cjg20150908
He, L., Chen, J., Zhang, Y., Guo, T., and Li, G. (2018). An EEMD and BP neural network hybrid approach for modeling regional sea level change. Desal. Water Treat. 121, 139–146. doi: 10.5004/dwt.2018.22378
Jeon, T., Seo, K.-W., Kim, B.-H., Kim, J.-S., Chen, J., and Wilson, C. R. (2021). Sea level fingerprints and regional sea level change. Earth Planet. Sci. Lett. 567:116985. doi: 10.1016/j.epsl.2021.116985
Jiang, C., Chen, S., Chen, Y., Bo, Y., Han, L., Guo, J., et al. (2018). Performance analysis of a deep simple recurrent unit recurrent neural network (SRU-RNN) in MEMS gyroscope de-noising. Sensors 18:4471. doi: 10.3390/s18124471
Kappelle, M. (2020). WMO statement on the state of the global climate in 2019. World Meteorol. Organ. 1, 1–10. doi: 10.13140/RG.2.2.13705.19046
Kittel, C., Amory, C., Agosta, C., Jourdain, N. C., Hofer, S., Delhasse, A., et al. (2021). Diverging future surface mass balance between the Antarctic ice shelves and grounded ice sheet. Cryosphere 15, 1215–1236. doi: 10.5194/tc-15-1215-2021
Lei, T., Zhang, Y., Wang, S. I., Dai, H., and Artzi, Y. (2018). “Simple recurrent units for highly parallelizable recurrence,” in Proceedings of the 2018 Conference on Empirical Methods in Natural Language Processing, Vol. 1 (Brussels:Association for Computational Linguistics), 4470–4481. doi: 10.18653/v1/D18-1477
Li, N., Hu, L., Deng, Z.-L., Su, T., and Liu, J.-W. (2021). Research on GRU neural network satellite traffic prediction based on transfer learning. Wireless Pers. Commun. 118, 815–827. doi: 10.1007/s11277-020-08045-z
Mahata, S. K., Das, D., and Bandyopadhyay, S. (2019). MTIL2017: machine translation using recurrent neural network on statistical machine translation. J. Intell. Syst. 28, 447–453. doi: 10.1515/jisys-2018-0016
Qiao, F., Wang, G., Khokiattiwong, S., Akhir, M. F., Zhu, W., and Xiao, B. (2019). China published ocean forecasting system for the 21st-century maritime silk road on december 10, 2018. Acta Oceanol. Sin. 38, 1–3. doi: 10.1007/s13131-019-1365-y
Qiao, F., Zhao, W., Yin, X., Huang, X., Liu, X., Shu, Q., et al. (2016). “A highly effective global surface wave numerical simulation with ultra-high resolution,” in SC16: International Conference for High Performance Computing, Networking, Storage and Analysis (Beijing), 46–56. doi: 10.1109/SC.2016.4
Shao, C., Zhang, W., Sun, C., Chai, X., and Wang, Z. (2015). Statistical prediction of the South China Sea surface height anomaly. Adv. Meteorol. 2015:907313. doi: 10.1155/2015/907313
Song, T., Jiang, J., Li, W., and Xu, D. (2020). A deep learning method with merged LSTM neural networks for SSHA prediction. IEEE J. Select. Top. Appl. Earth Observ. Remote Sens. 13, 2853–2860. doi: 10.1109/JSTARS.2020.2998461
Tang, W., Zhan, W., Jin, B., Motagh, M., and Xu, Y. (2021). Spatial variability of relative sea-level rise in Tianjin, China: insight from InSAR, GPS, and tide-gauge observations. IEEE J. Select. Top. Appl. Earth Observ. Remote Sens. 14, 2621–2633. doi: 10.1109/JSTARS.2021.3054395
Wang, X., Wang, Y., Tan, M., and Cai, F. (2020). Deep-water deposition in response to sea-level fluctuations in the past 30 kyr on the northern margin of the South China Sea. Deep Sea Res. Part I 163:103317. doi: 10.1016/j.dsr.2020.103317
Wang, Z., Wu, J., Liu, C., and Gu, G. (2017). “The impact of sea level rise,” in Integrated Assessment Models of Climate Change Economics, Vol. 3 (Singapore: Springer), 43–57. doi: 10.1007/978-981-10-3945-4_3
Yan, D., Wünnemann, B., Gao, S., and Zhang, Y. (2020). Early Holocene tidal flat evolution in a western embayment of East China Sea, in response to sea level rise episodes. Quat. Sci. Rev. 250:106642. doi: 10.1016/j.quascirev.2020.106642
Yu, K., Liu, H., Chen, Y., Dong, C., Dong, J., Yan, Y., et al. (2019a). Impacts of the mid-latitude westerlies anomaly on the decadal sea level variability east of China. Clim. Dyn. 53, 5985–5998. doi: 10.1007/s00382-019-04909-8
Yu, Y., Si, X., Hu, C., and Zhang, J. (2019b). A review of recurrent neural networks: LSTM cells and network architectures. Neural Comput. 31, 1235–1270. doi: 10.1162/neco_a_01199
Keywords: short-to medium-term, sea surface height, recurrent neural network, simple recurrent unit, deeplearning model
Citation: Ning P, Zhang C, Zhang X and Jiang X (2021) Short- to Medium-Term Sea Surface Height Prediction in the Bohai Sea Using an Optimized Simple Recurrent Unit Deep Network. Front. Mar. Sci. 8:672280. doi: 10.3389/fmars.2021.672280
Received: 25 February 2021; Accepted: 23 August 2021;
Published: 17 September 2021.
Edited by:
Zhengguang Zhang, Ocean University of China, ChinaReviewed by:
Sheng Li, National Institute of Information and Communications Technology, JapanChangming Dong, Nanjing University of Information Science and Technology, China
Qing Xu, Ocean University of China, China
Copyright © 2021 Ning, Zhang, Zhang and Jiang. This is an open-access article distributed under the terms of the Creative Commons Attribution License (CC BY). The use, distribution or reproduction in other forums is permitted, provided the original author(s) and the copyright owner(s) are credited and that the original publication in this journal is cited, in accordance with accepted academic practice. No use, distribution or reproduction is permitted which does not comply with these terms.
*Correspondence: Xuefeng Zhang, xuefeng.zhang@tju.edu.cn