
A Study on the Classification Effect of sEMG Signals in Different Vibration Environments Based on the LDA Algorithm

 ,
,
Abstract
:1. Introduction
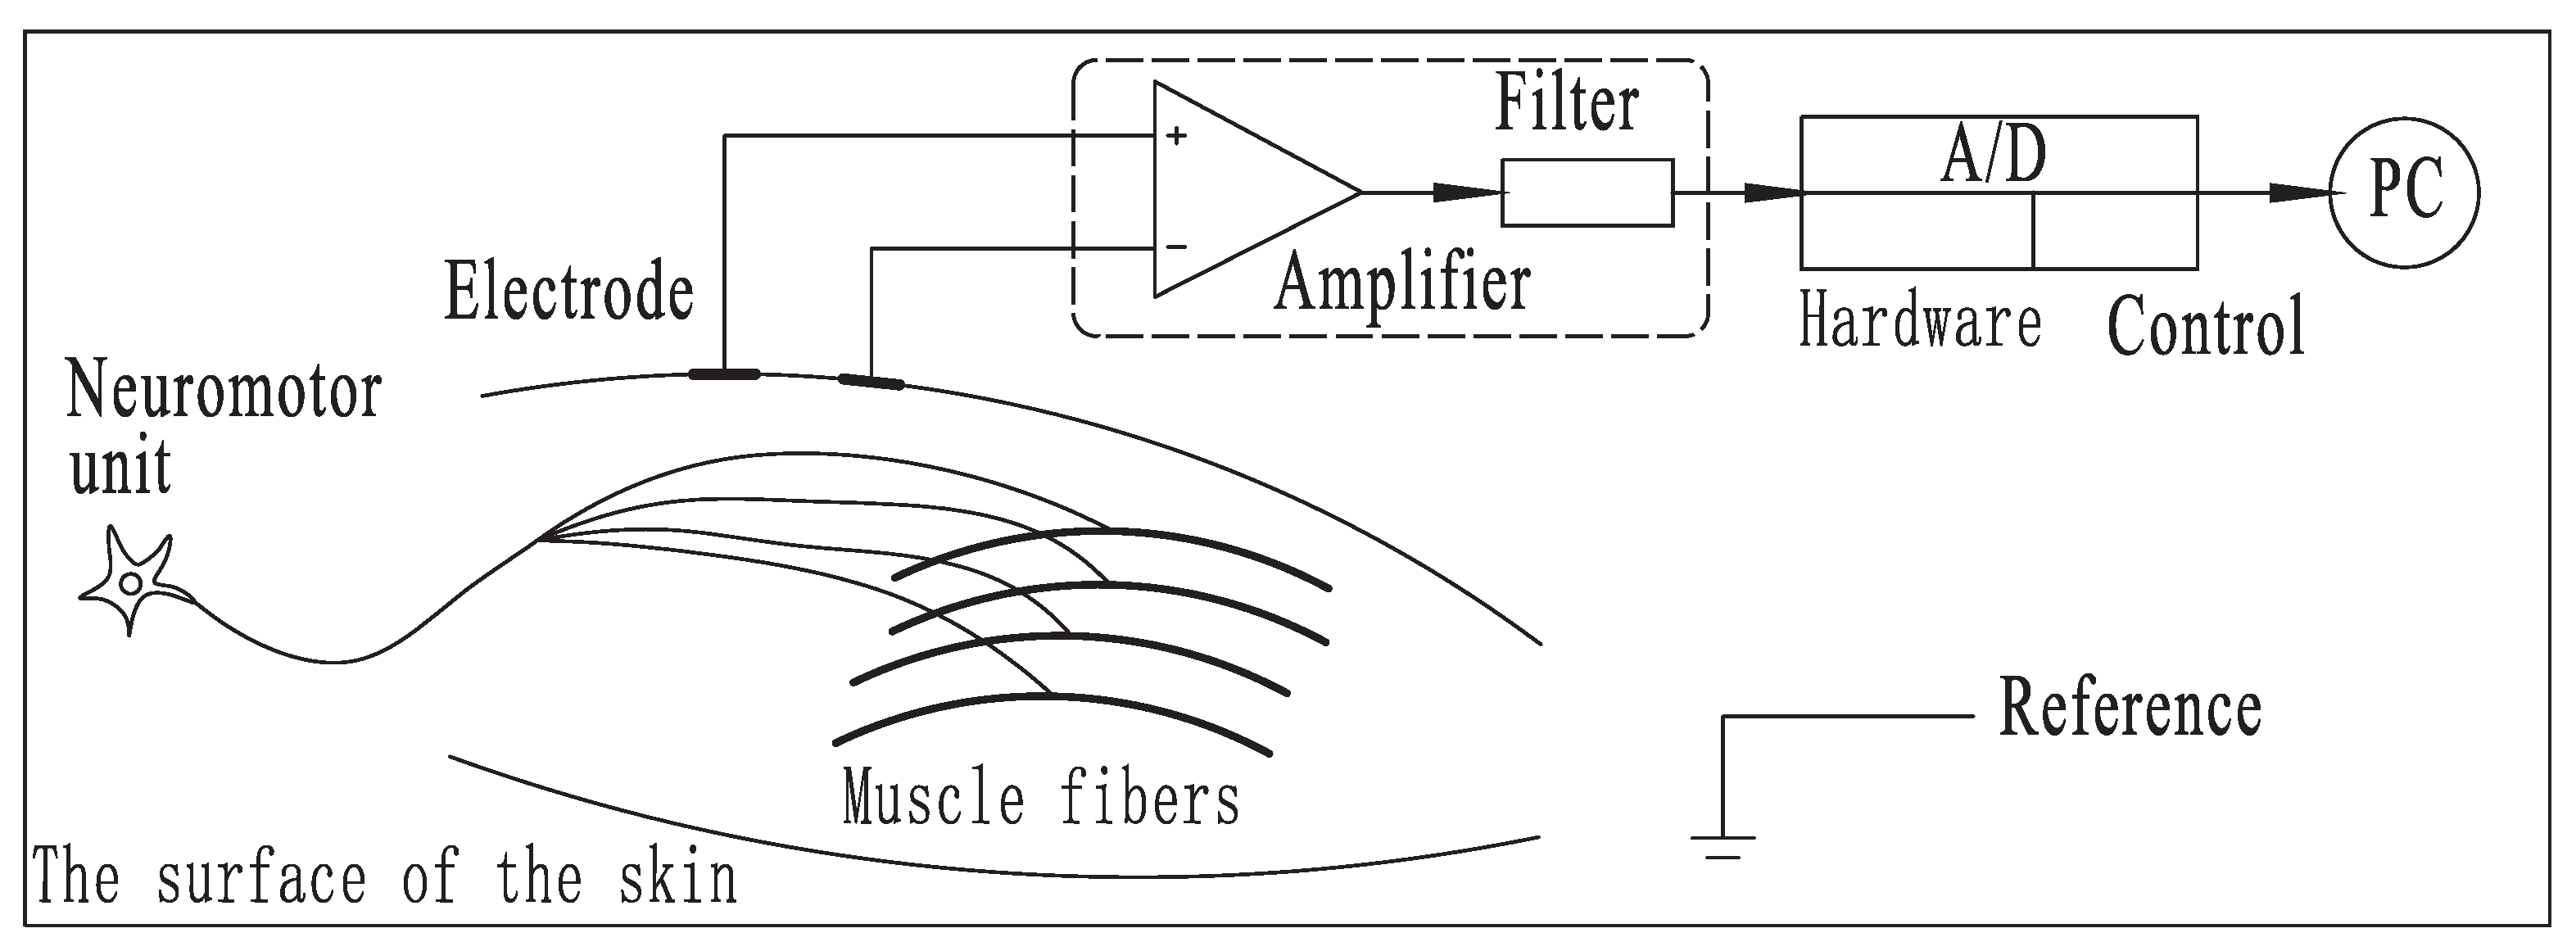
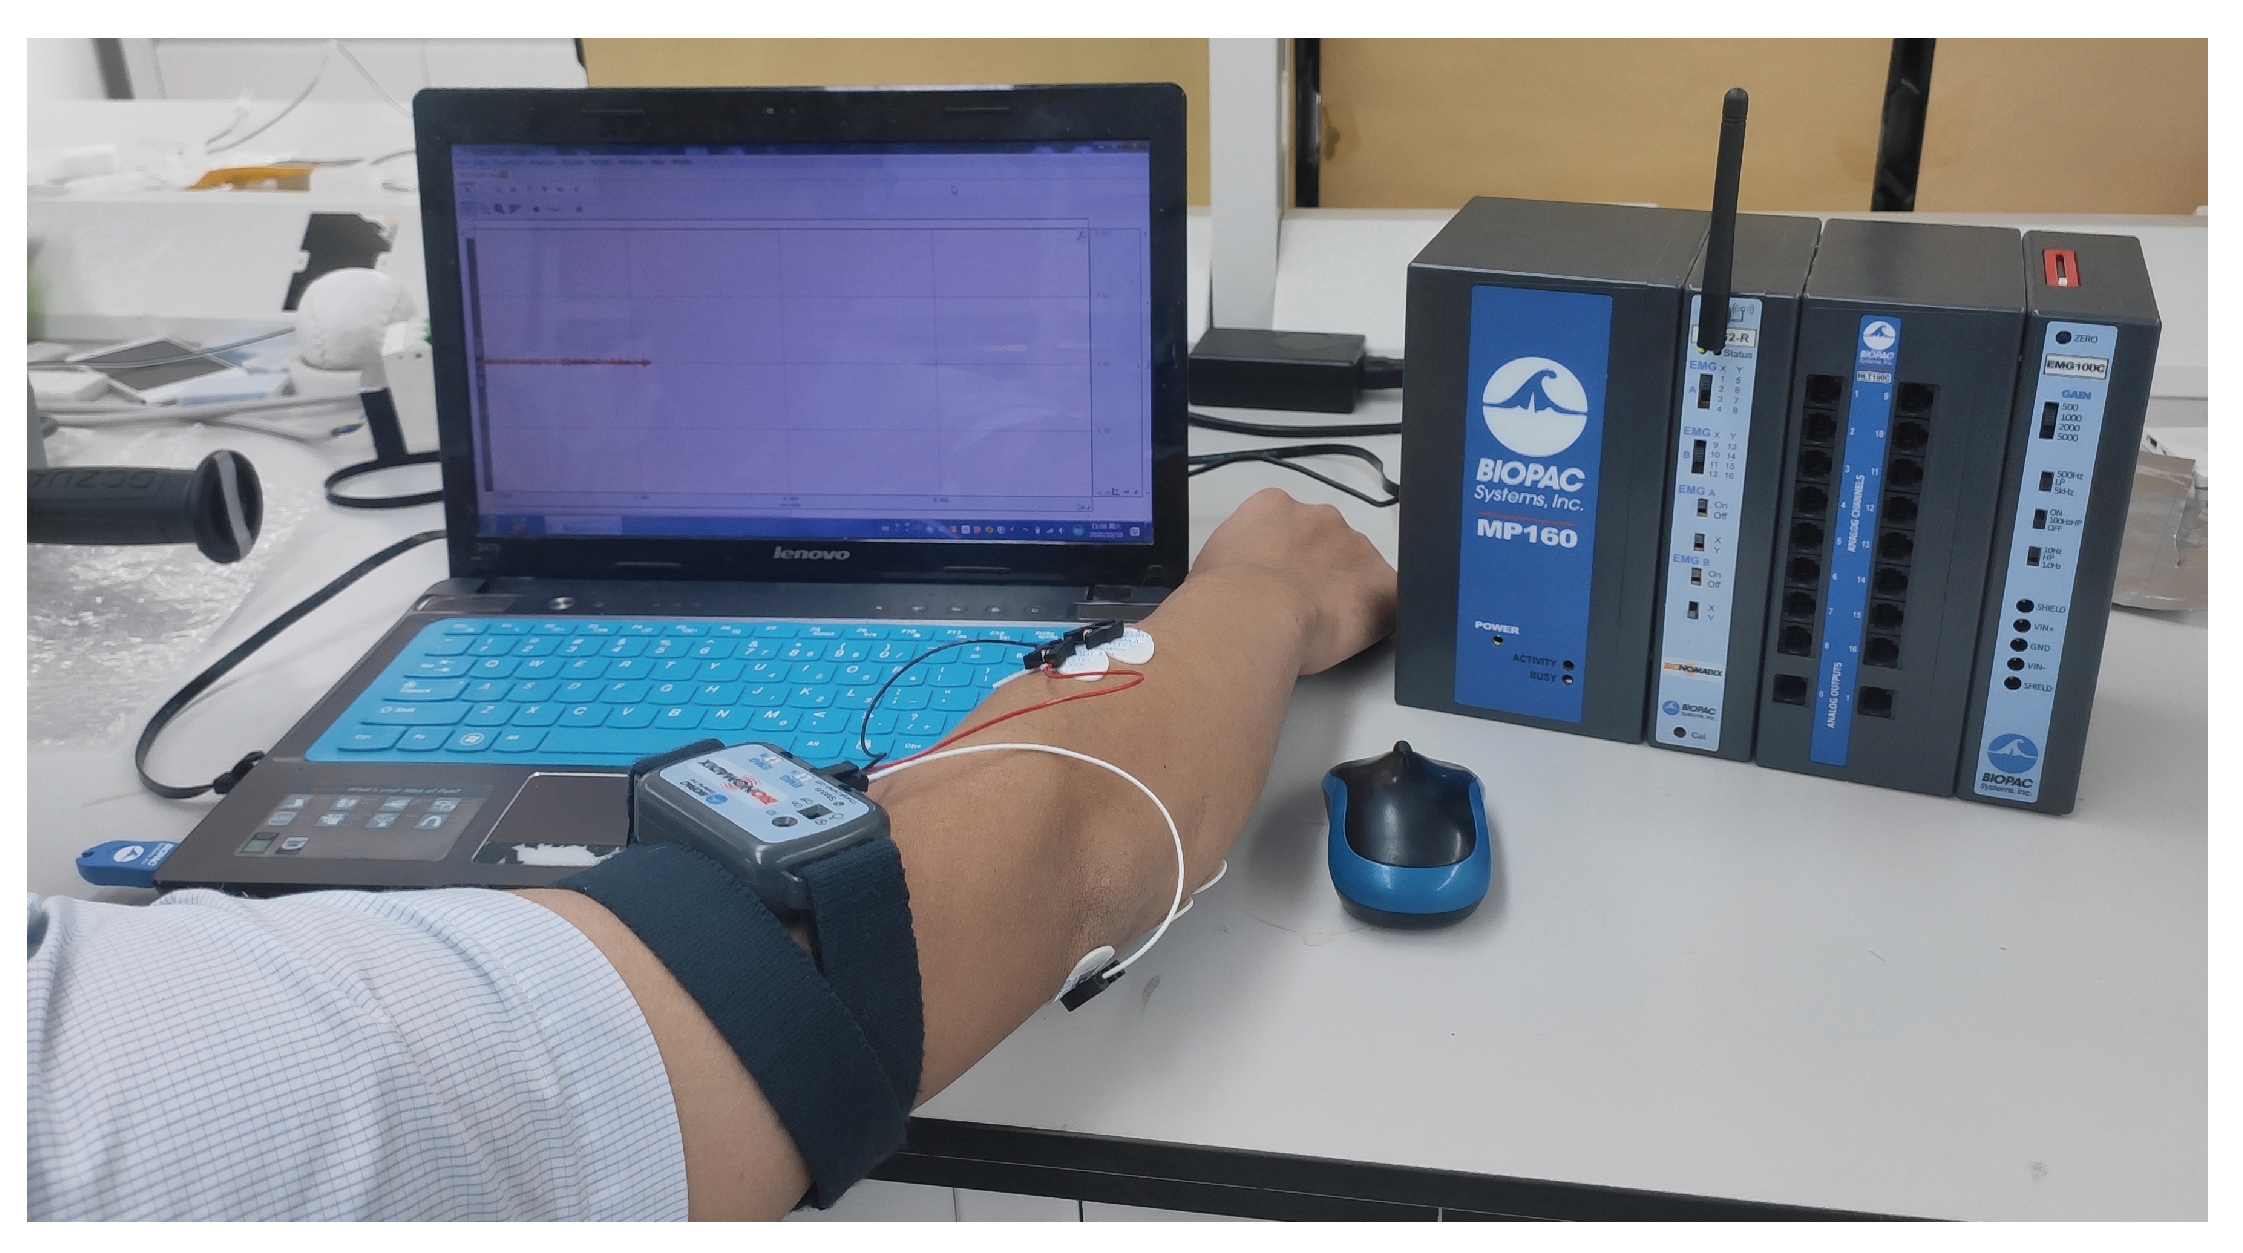
2. Data Acquisition
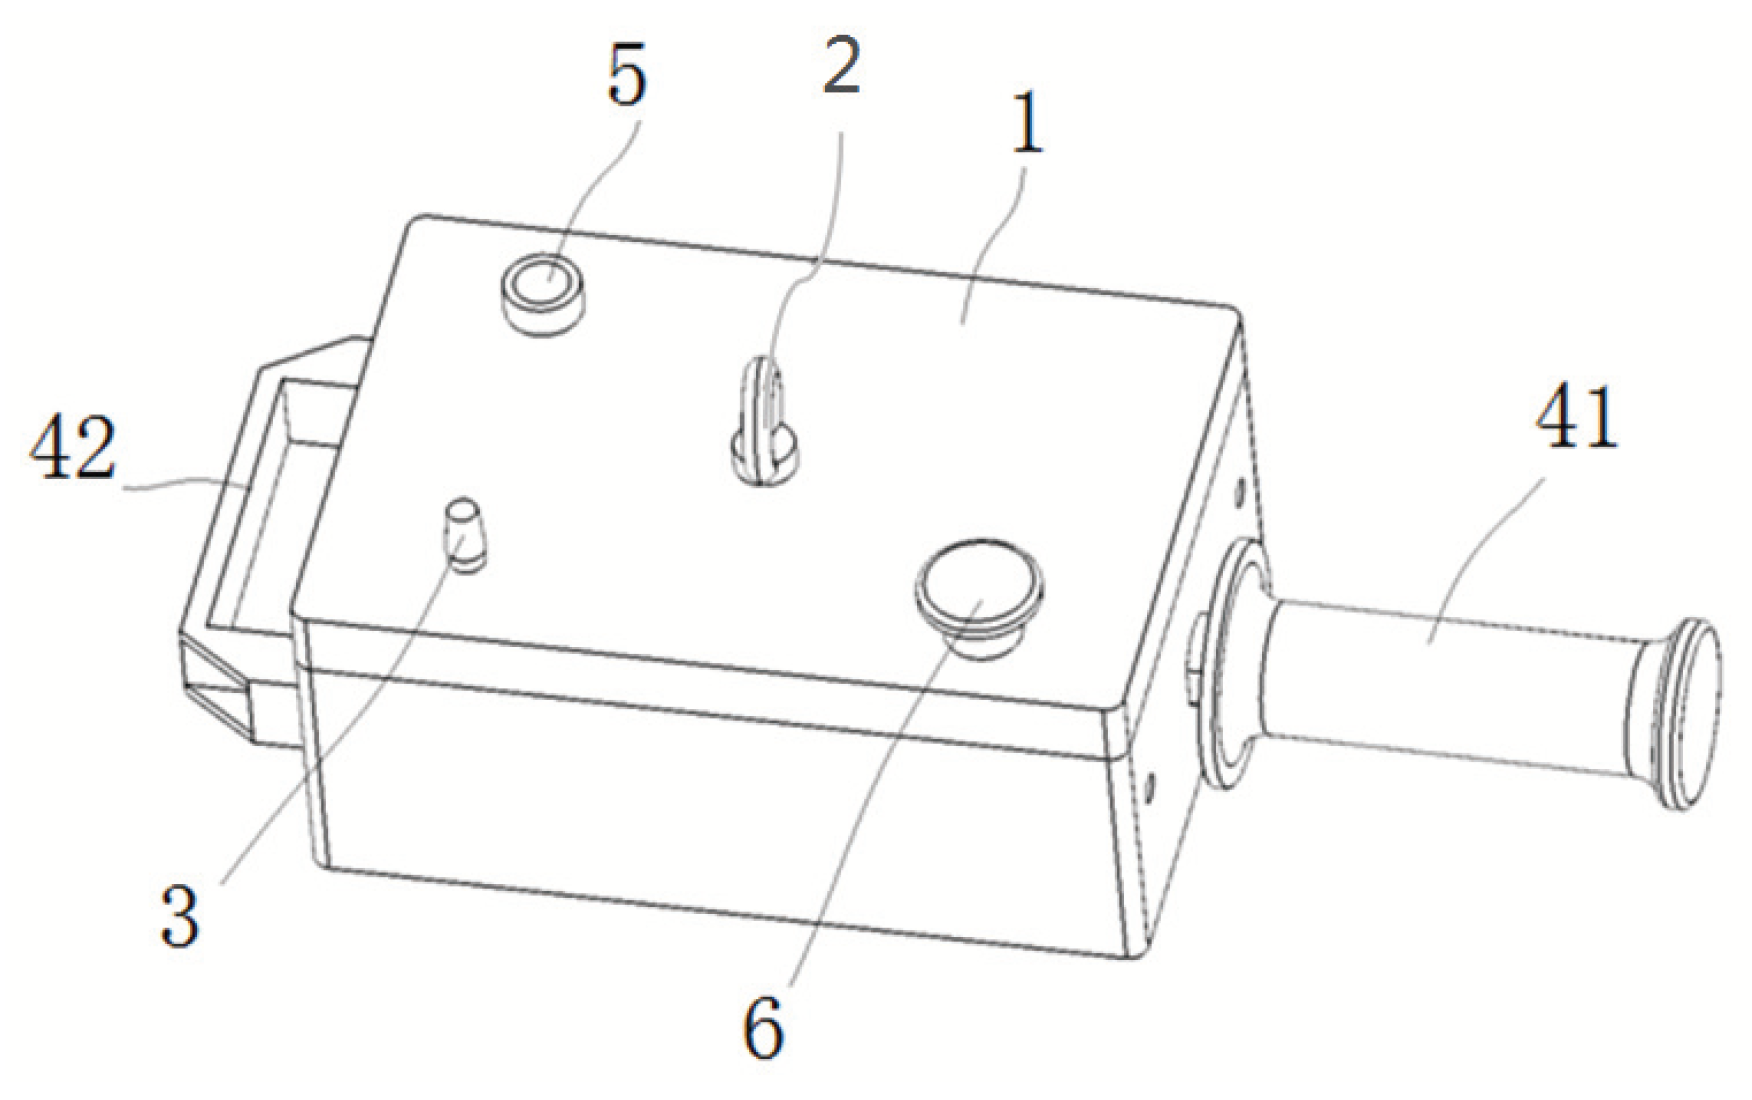
2.1. Data Platform Construction
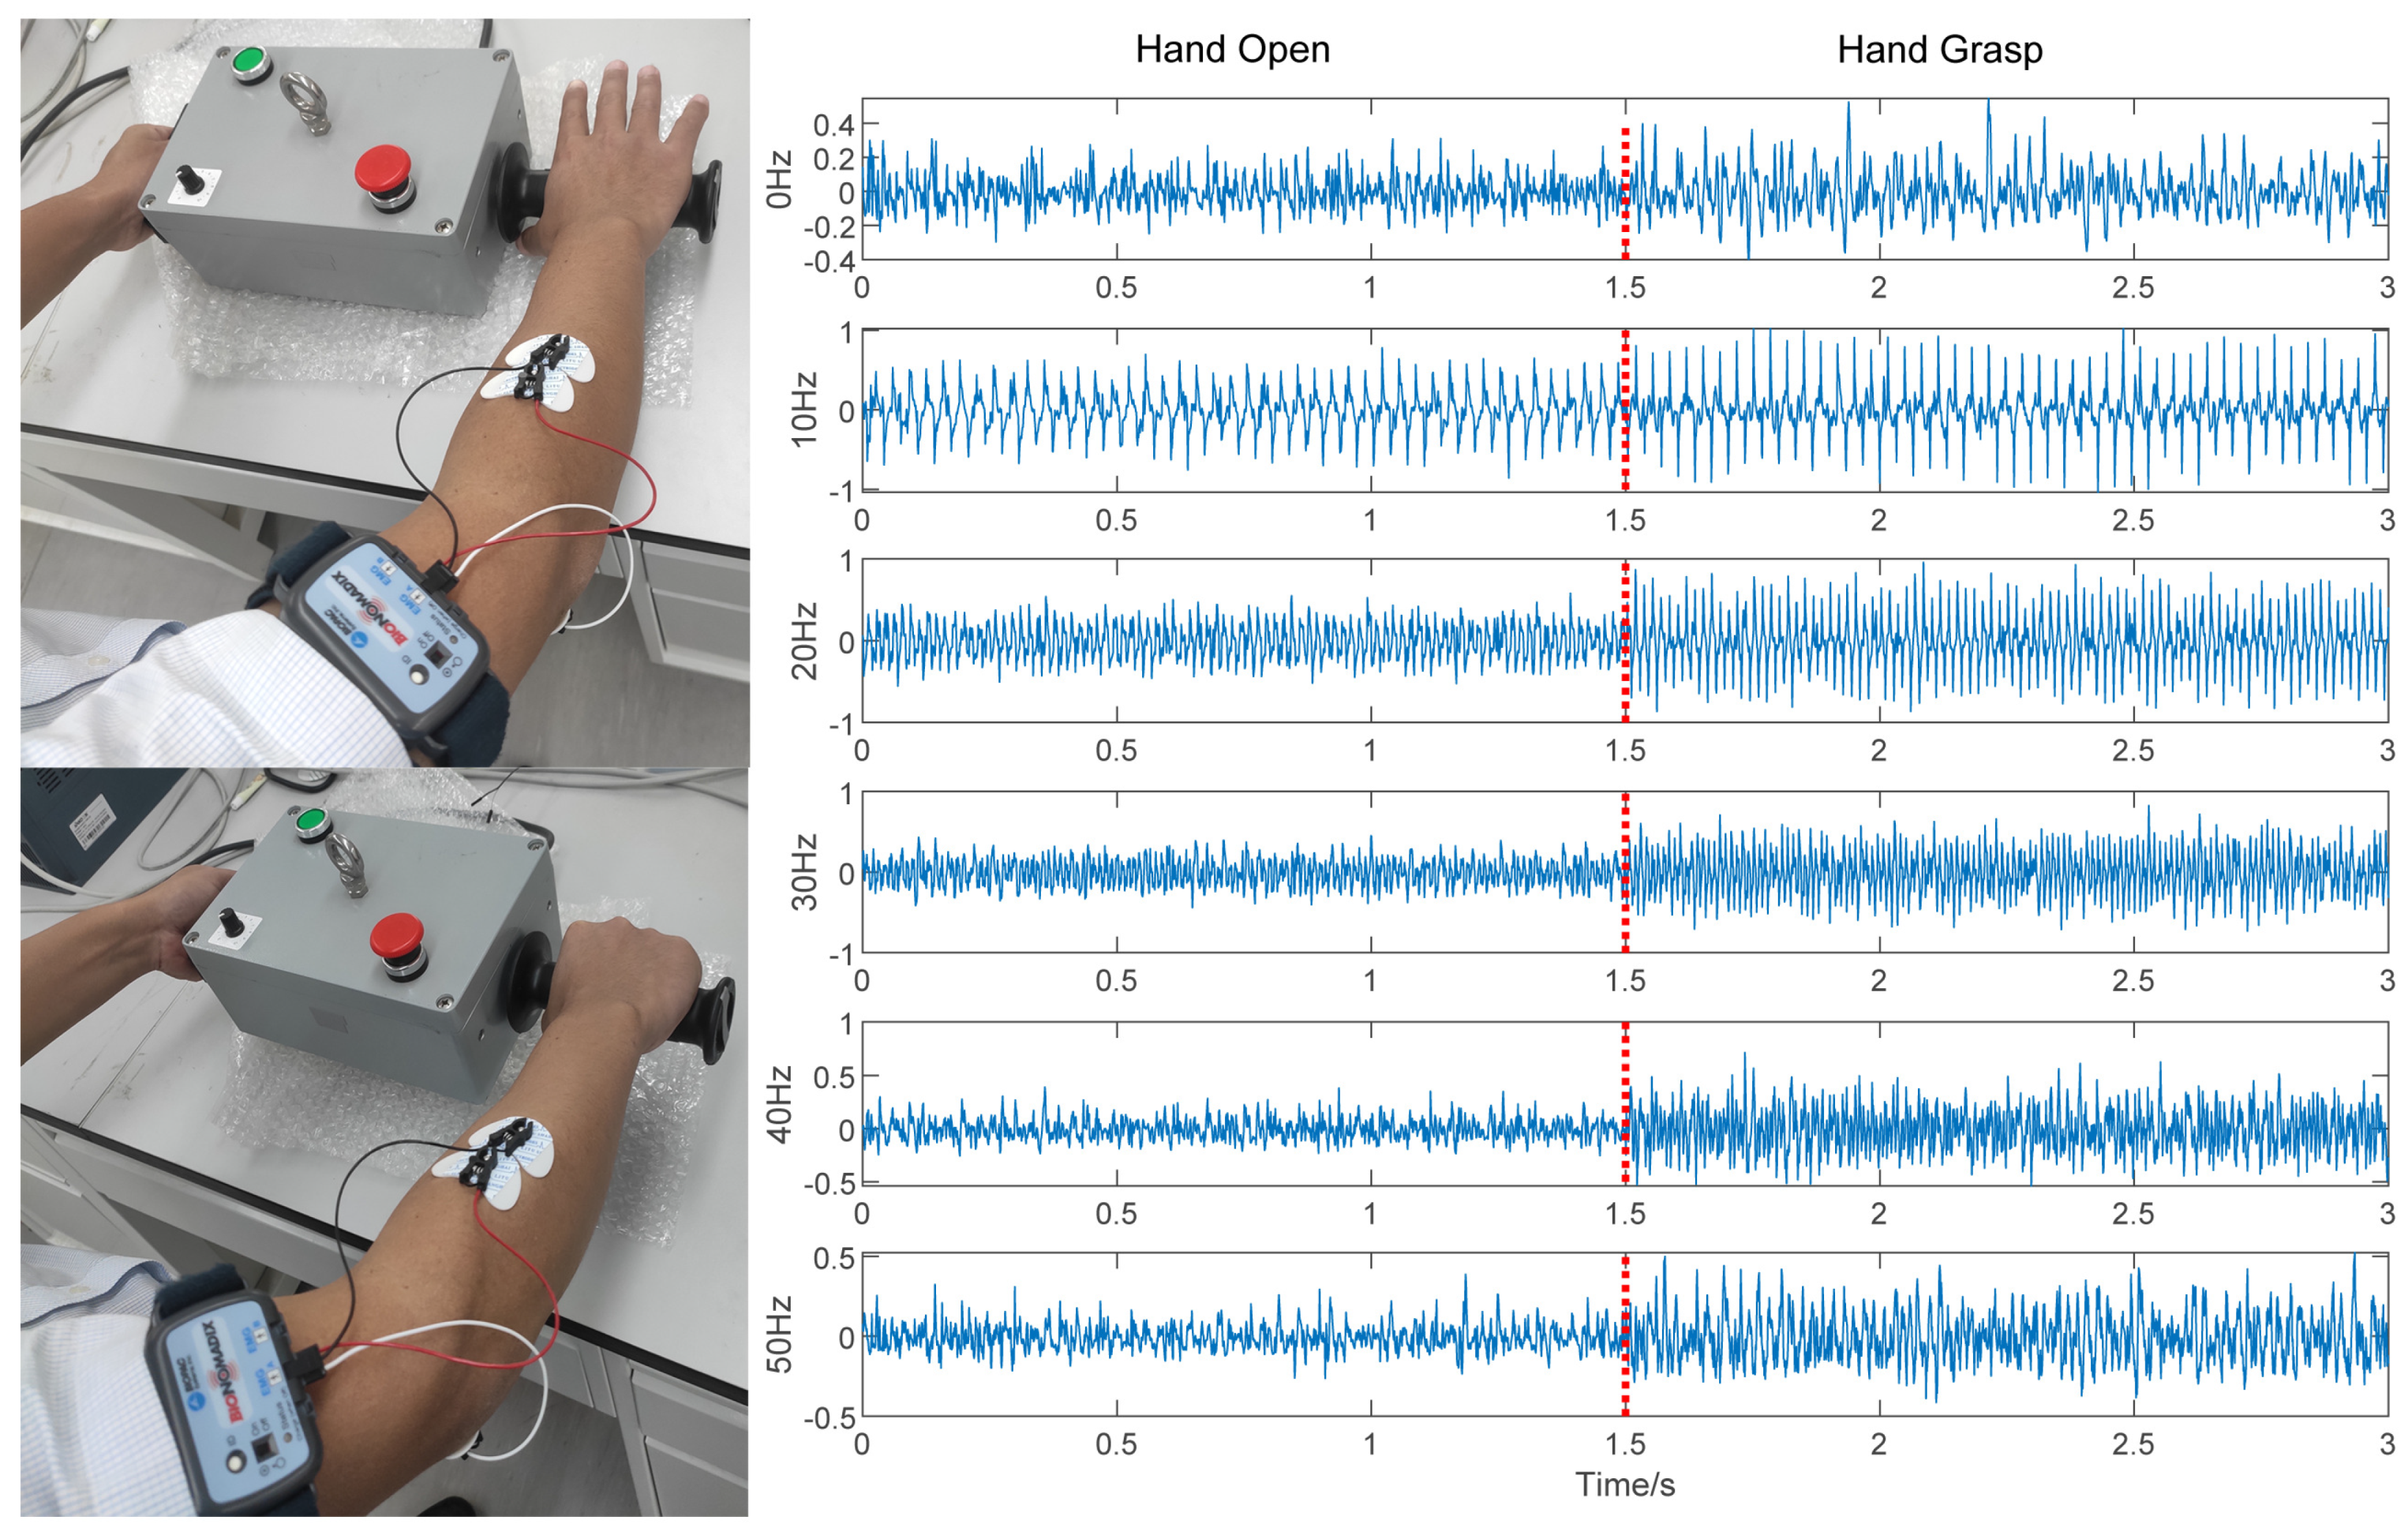
2.2. Acquisition of Signals at Various Vibration Frequencies
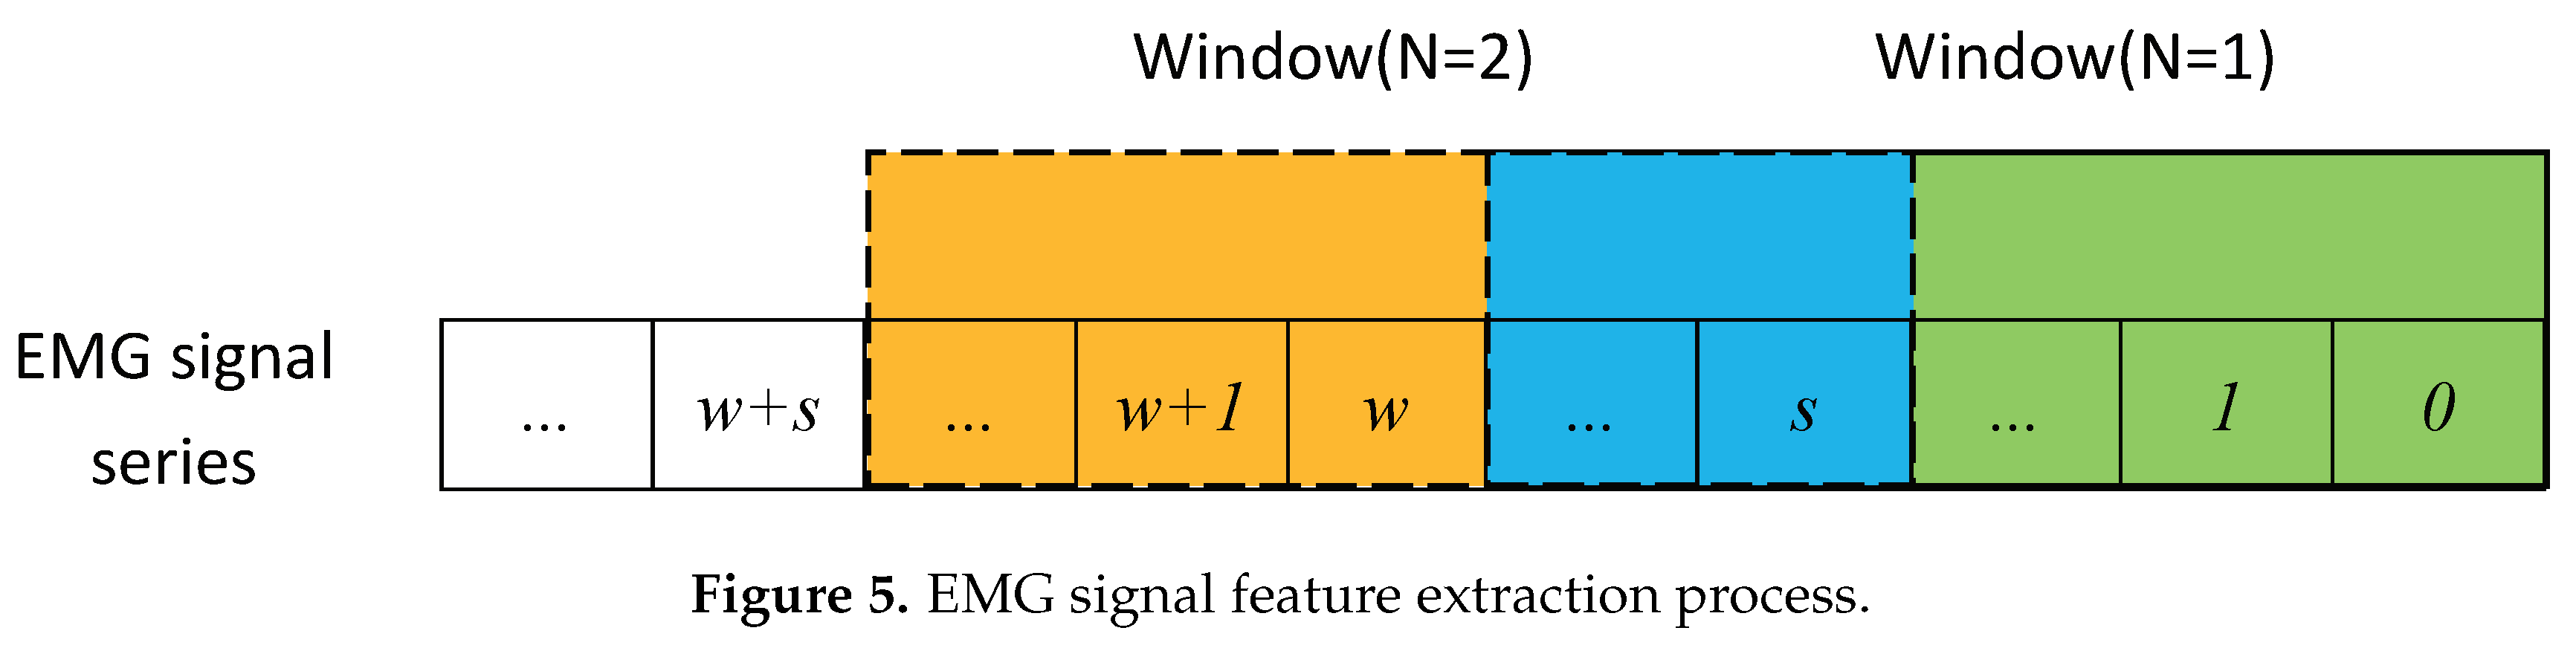
2.3. Signal Window Processing
3. Algorithm Description
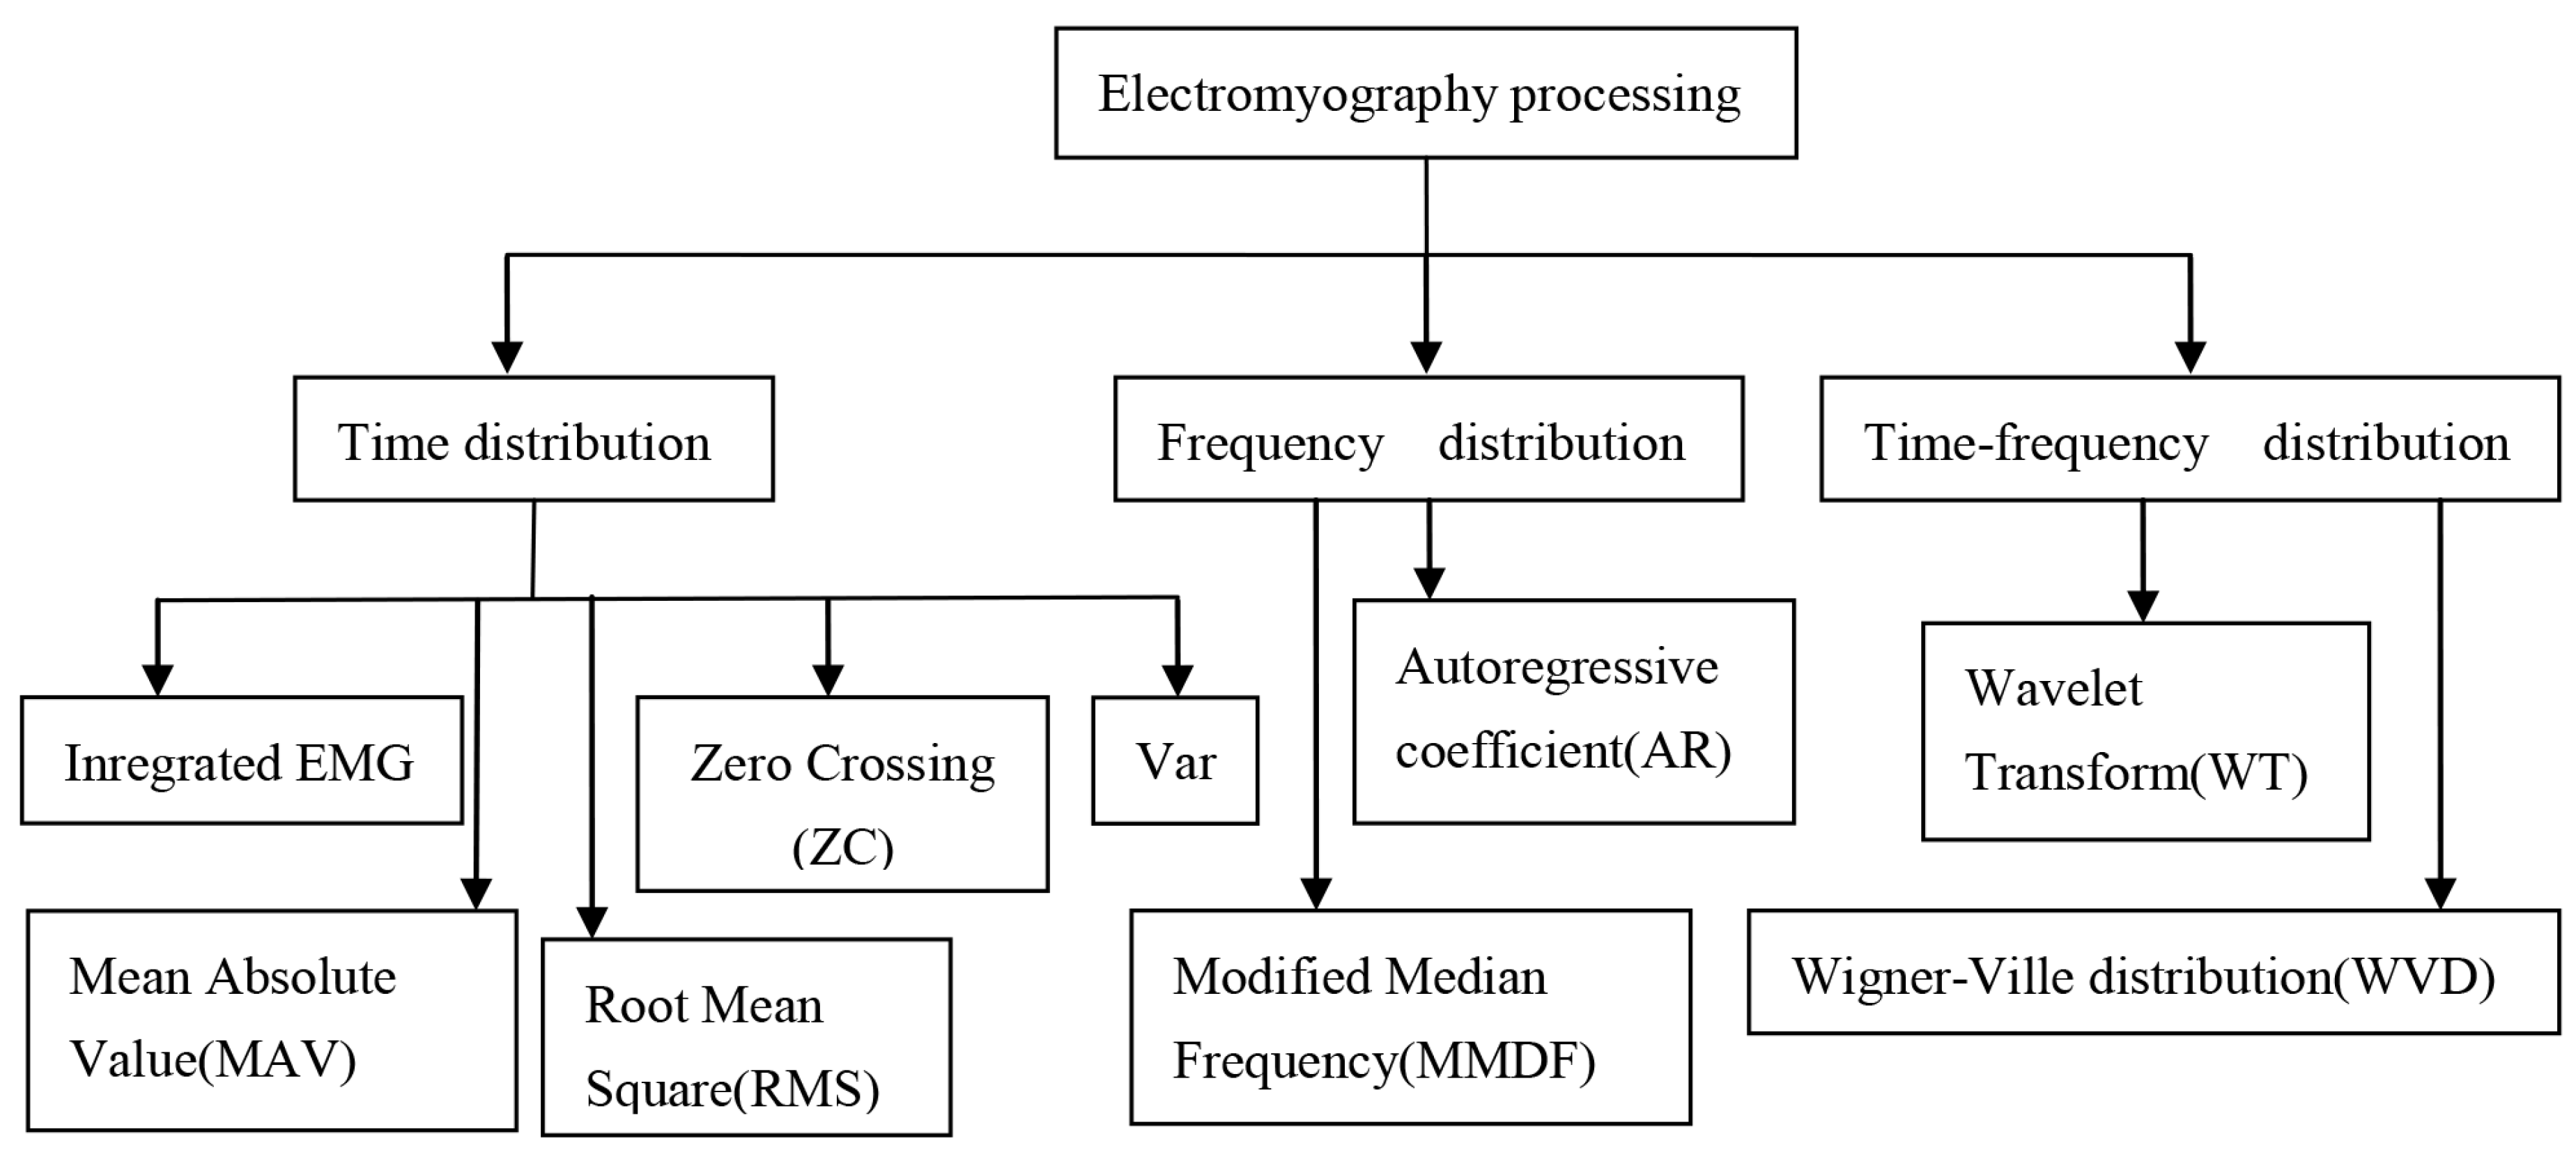
3.1. Feature Extraction Methods
3.2. Feature Classification
4. Data Analysis and Processing
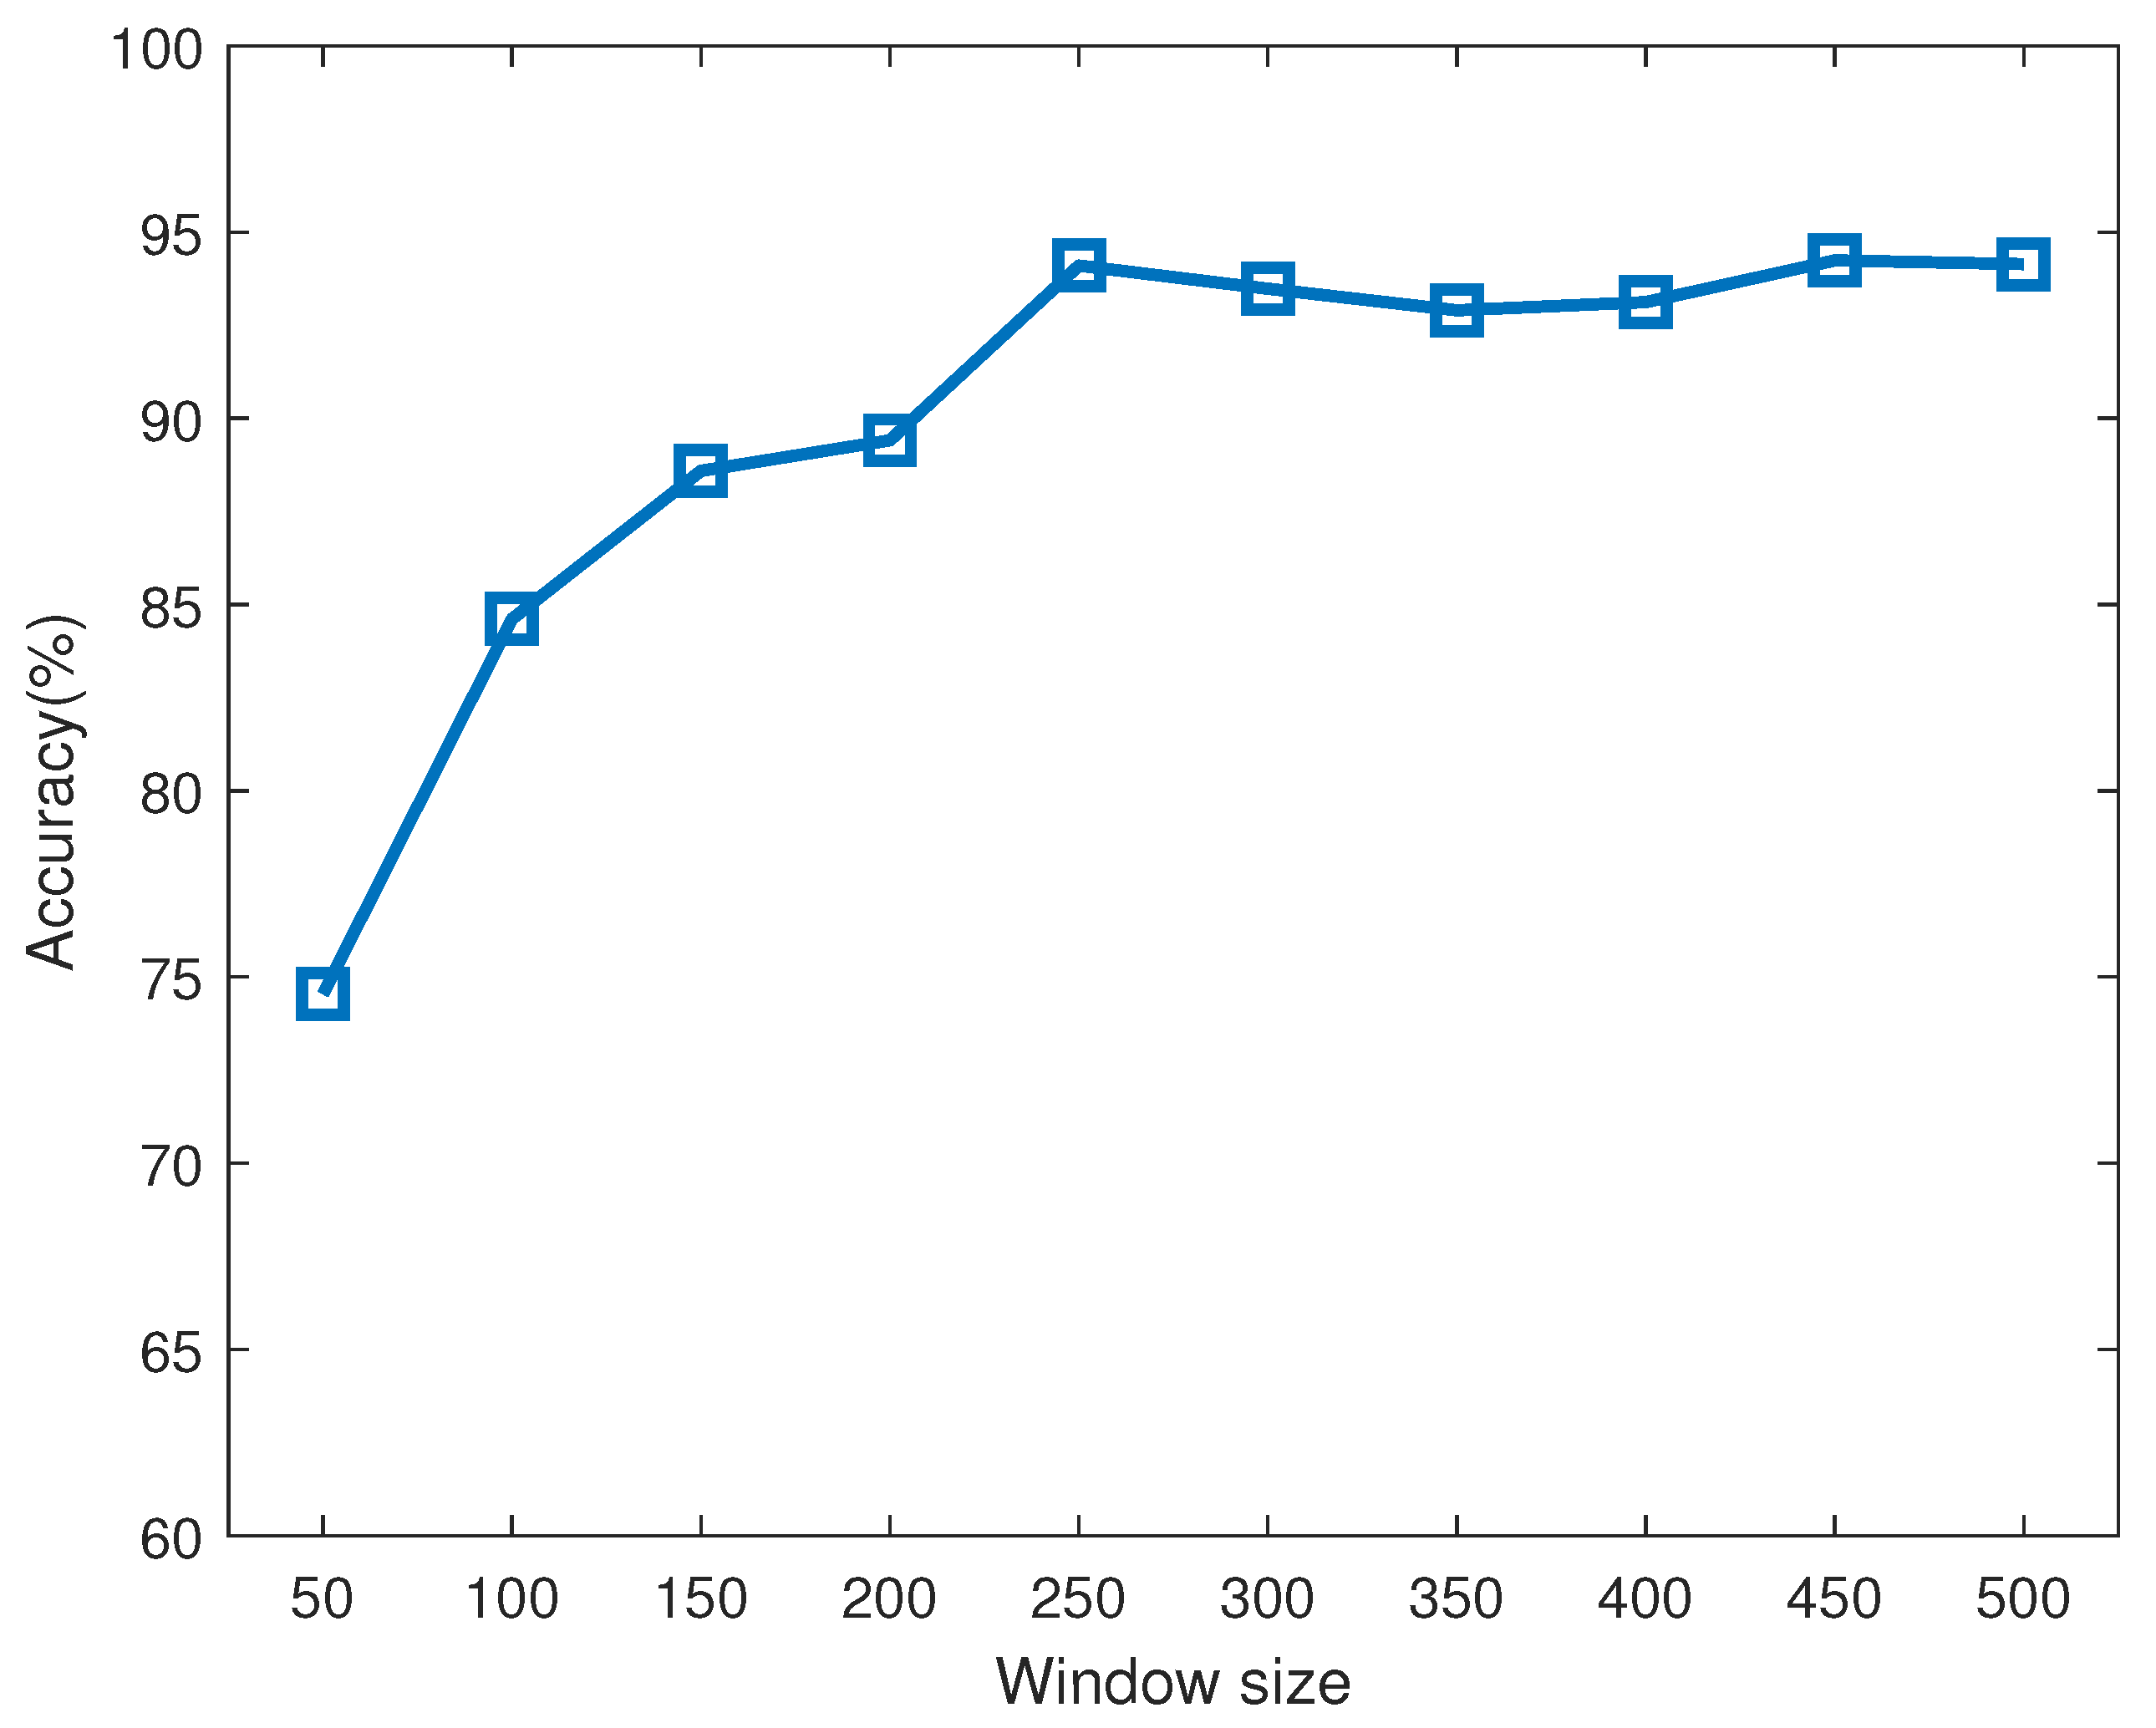
4.1. Window Size Selection
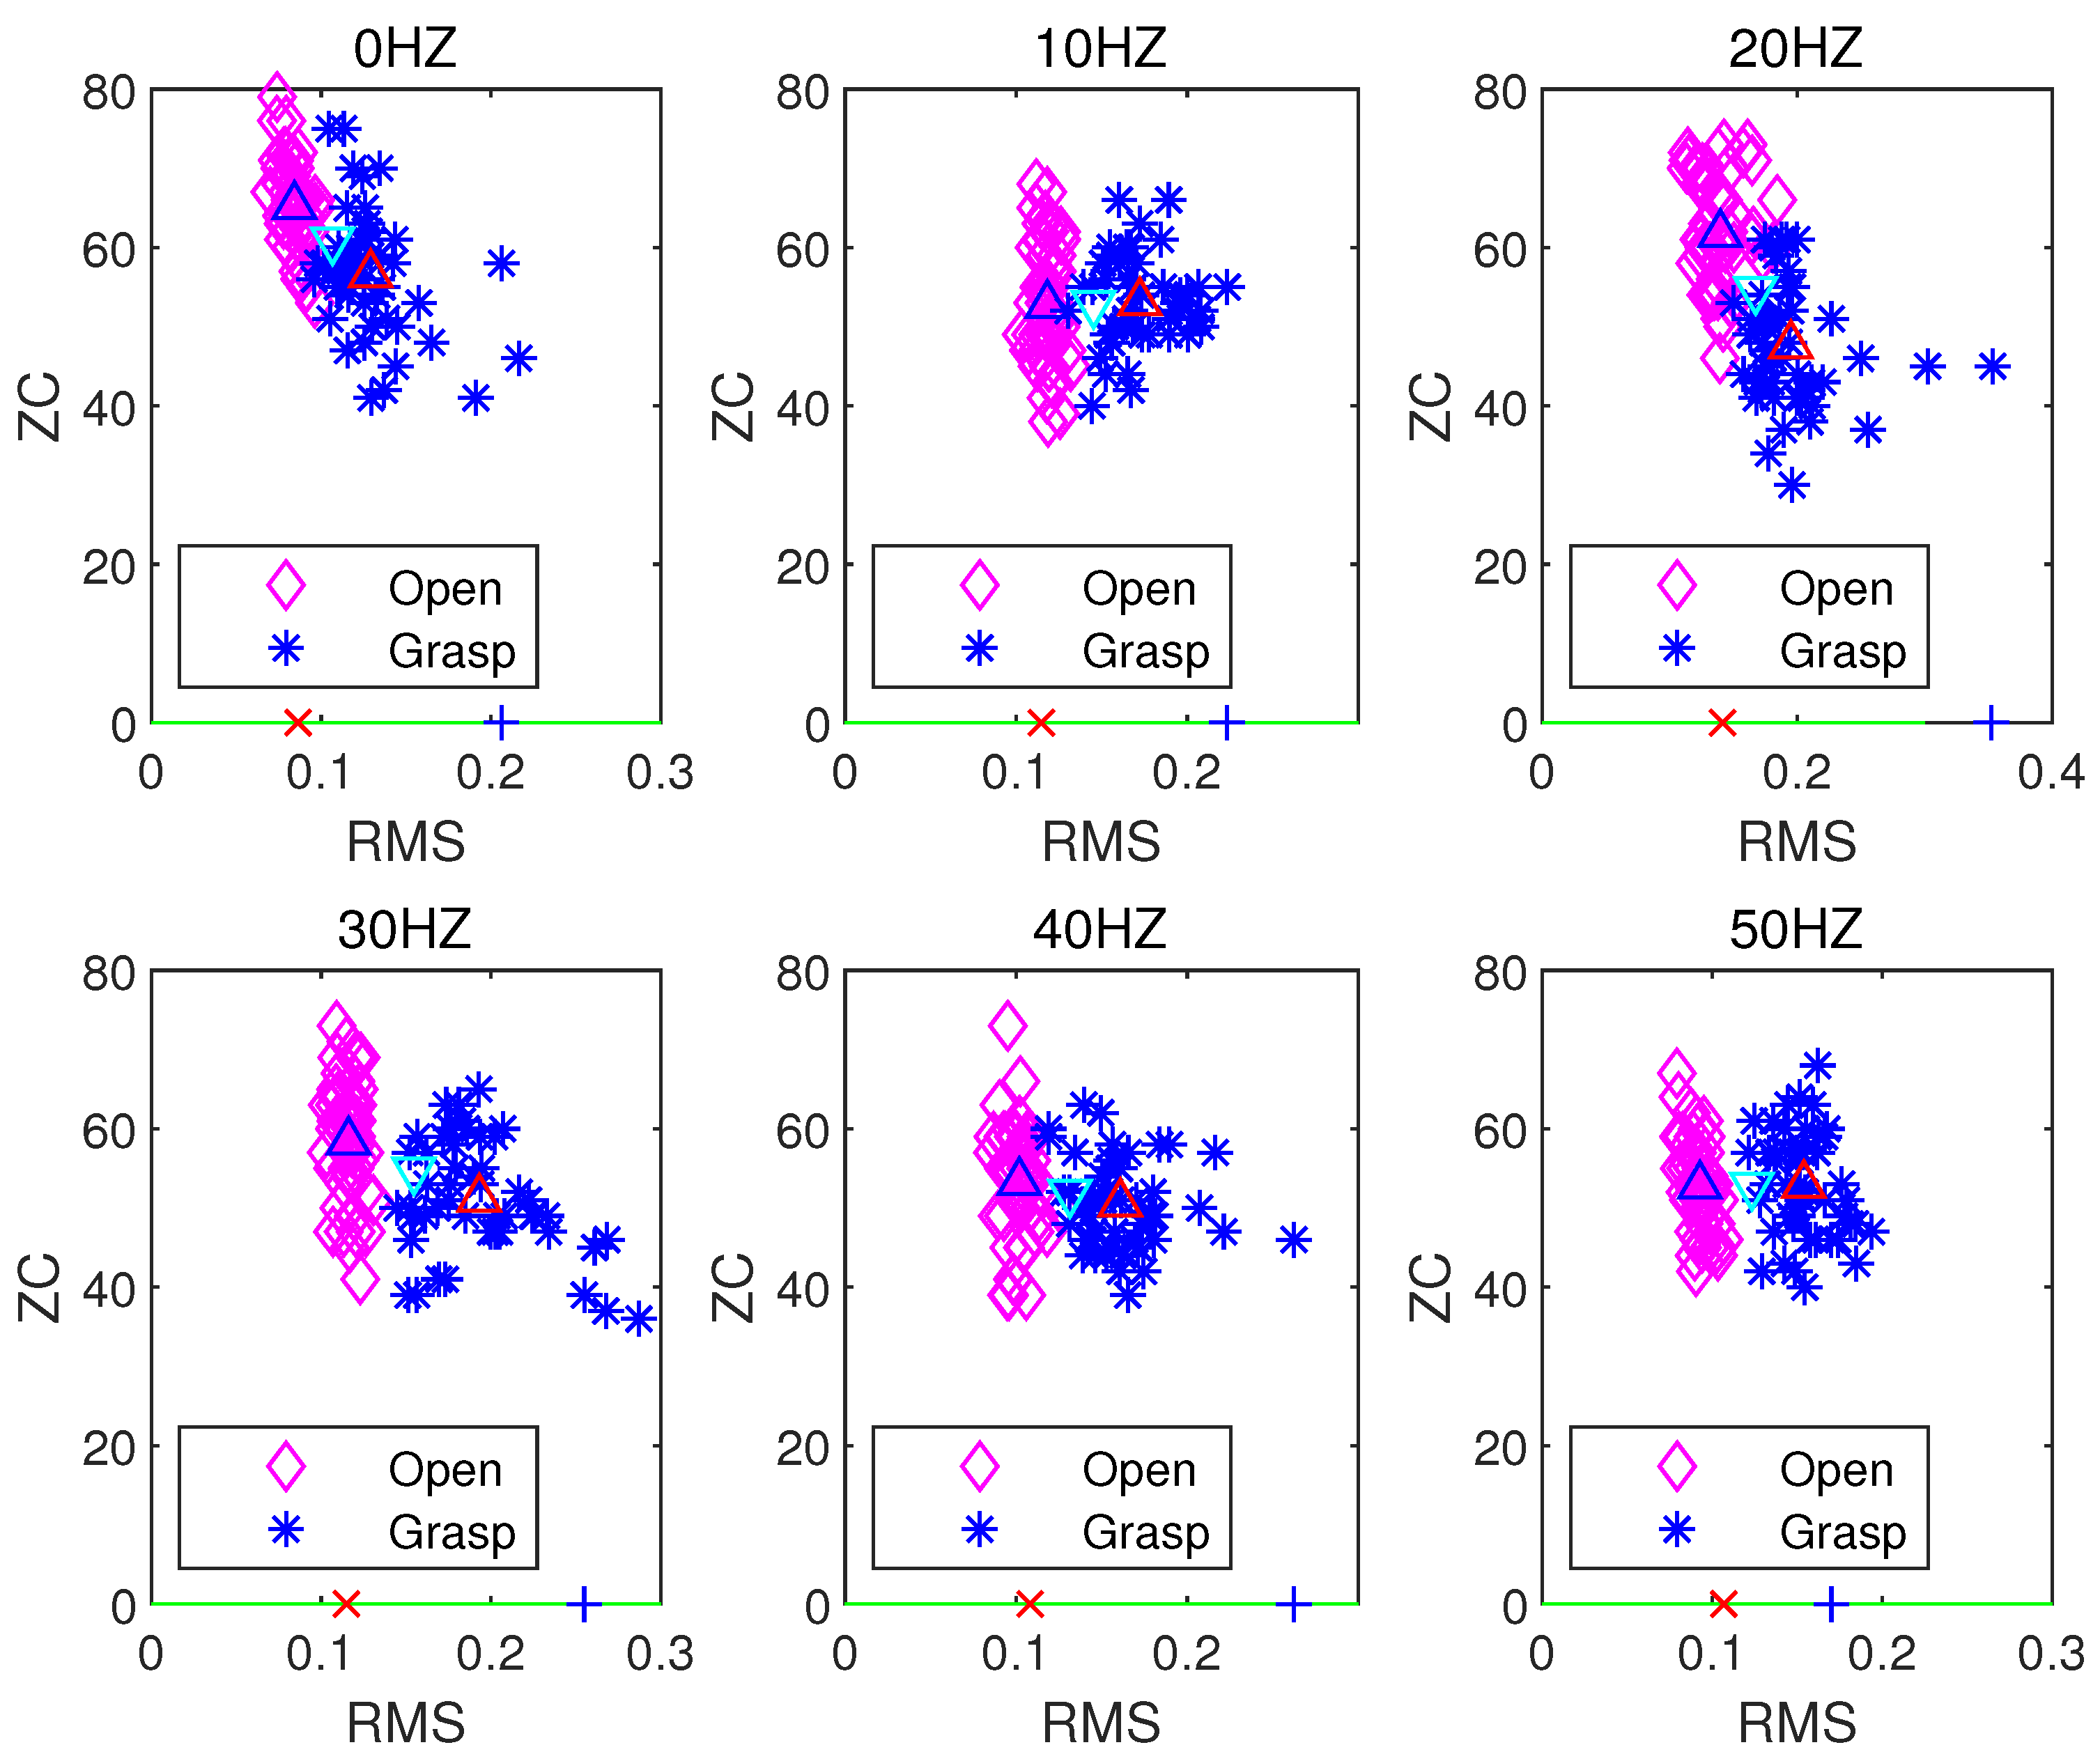
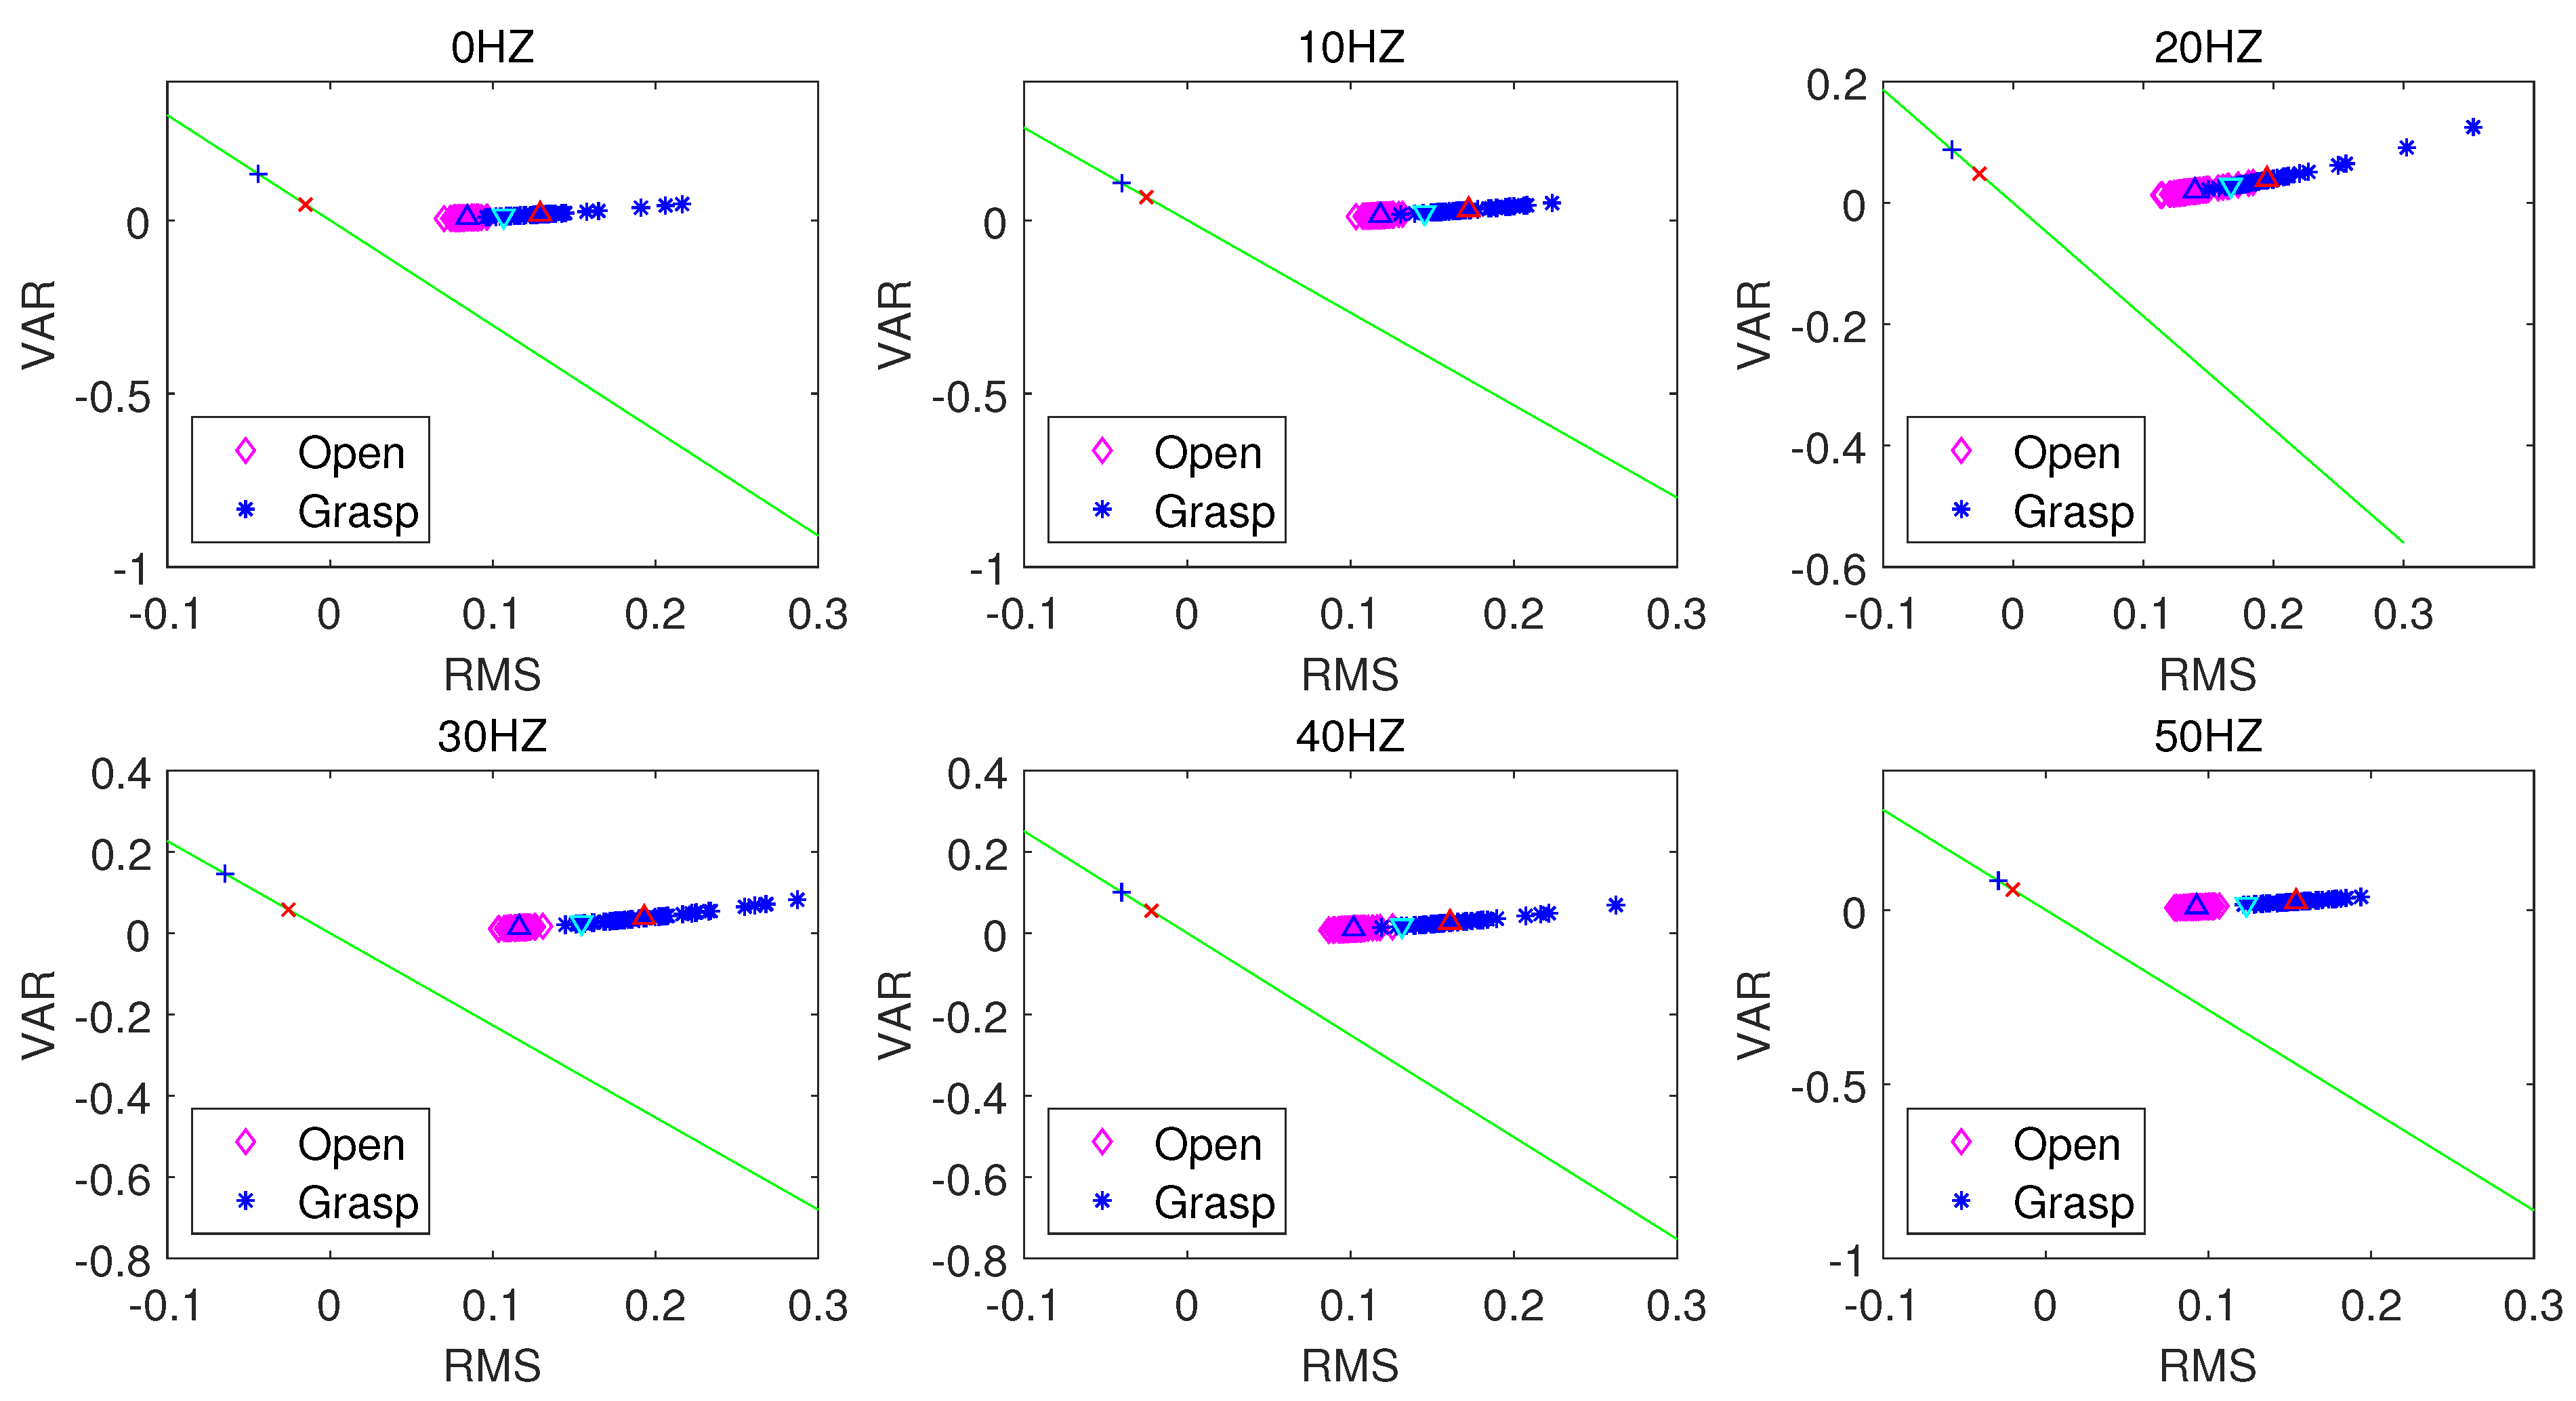
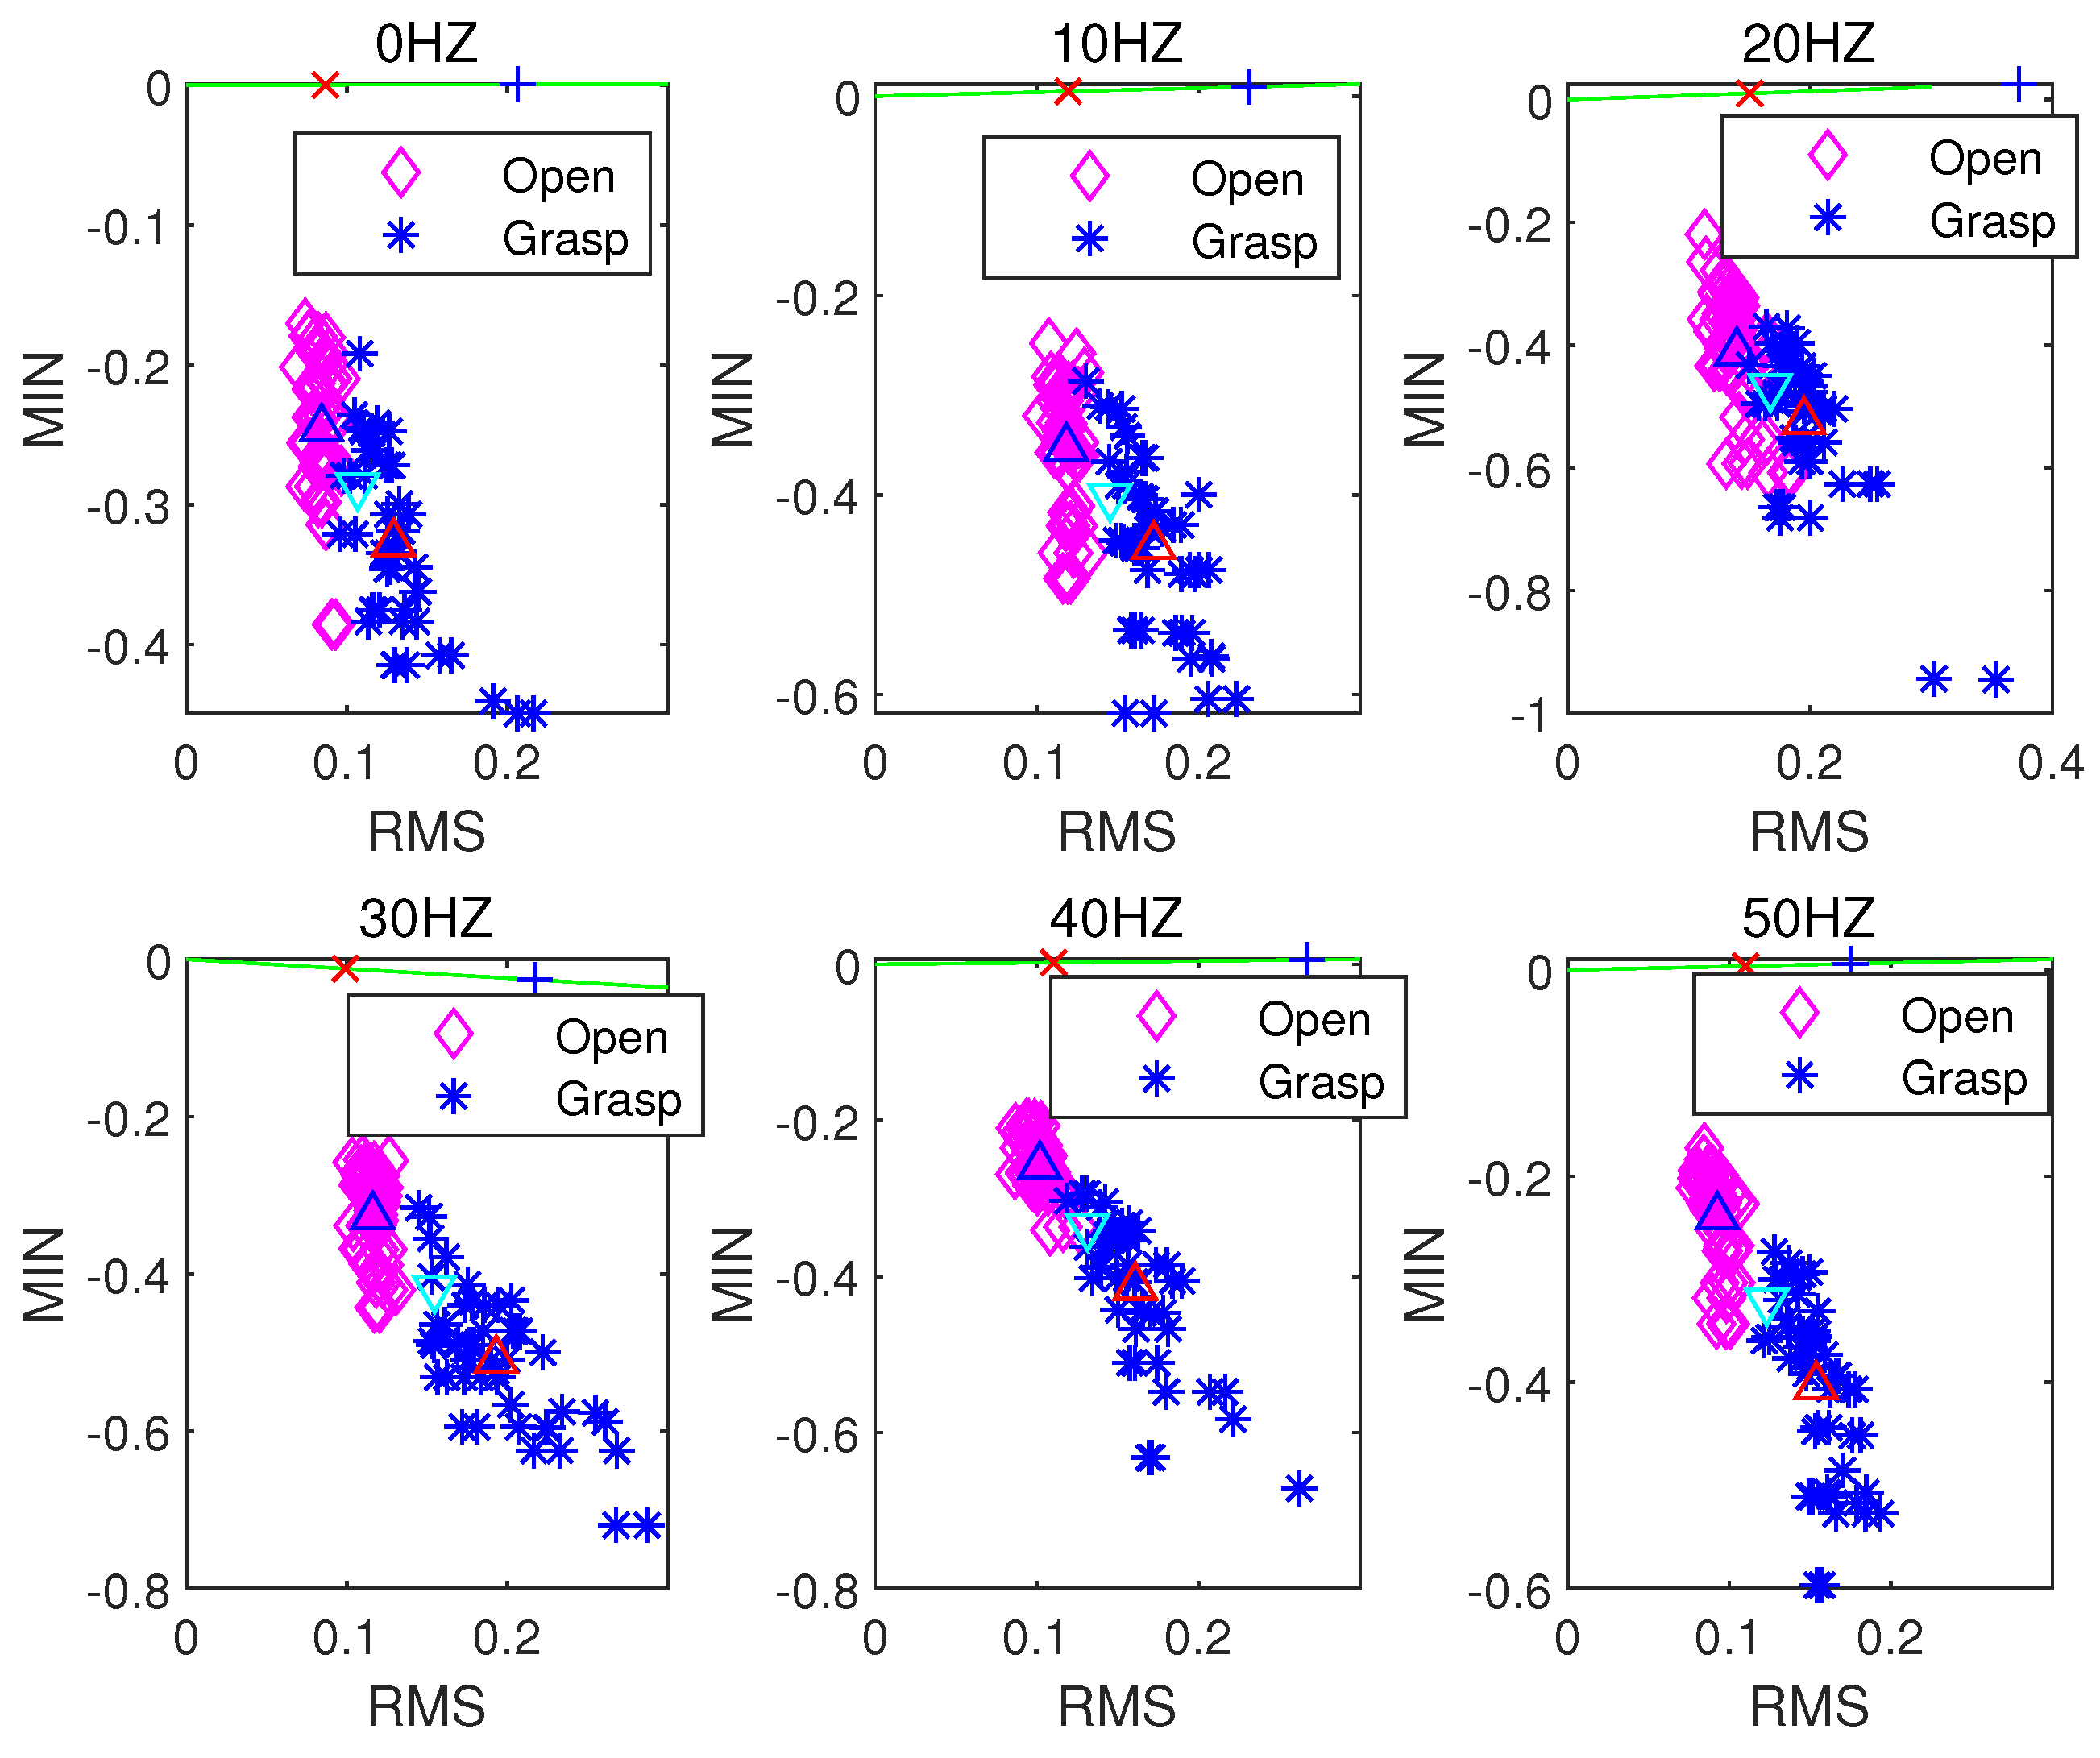
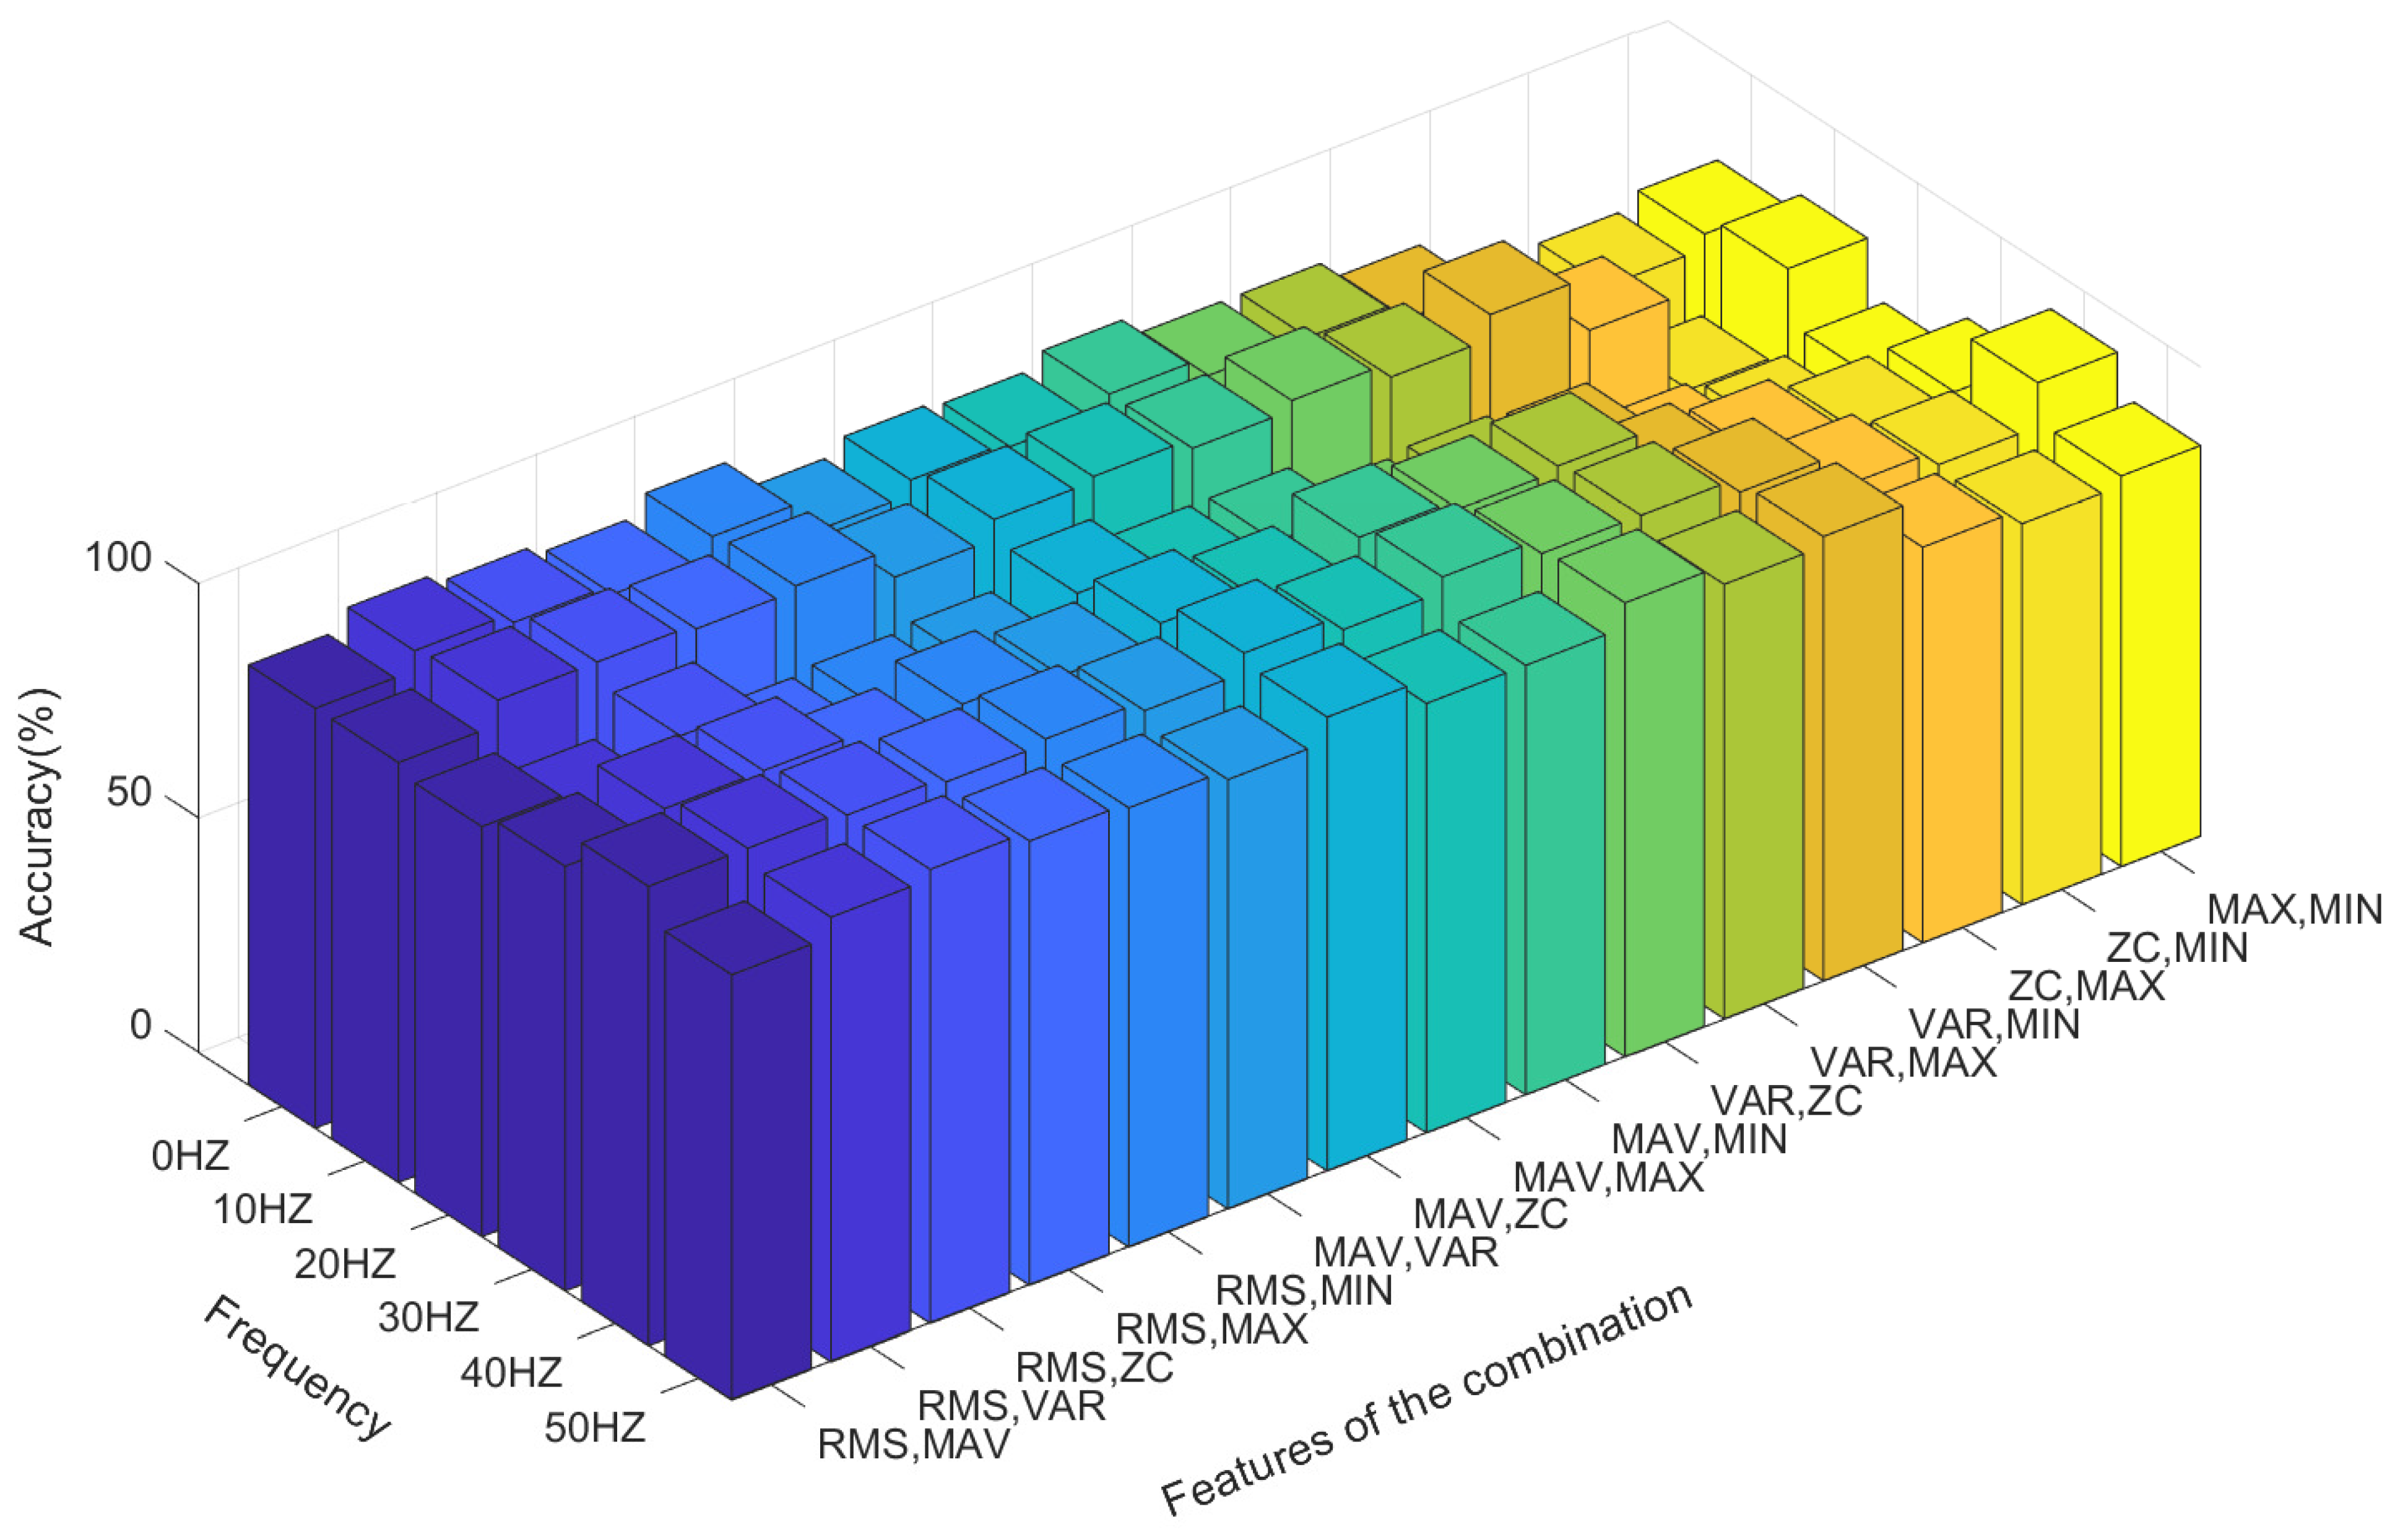
4.2. Combinatorial Optimization Design of Two-Feature Classification
4.3. Combinatorial Optimization Design of Three-Feature Classification
4.4. Combinatorial Optimization Design of Classification Using All Features as Input
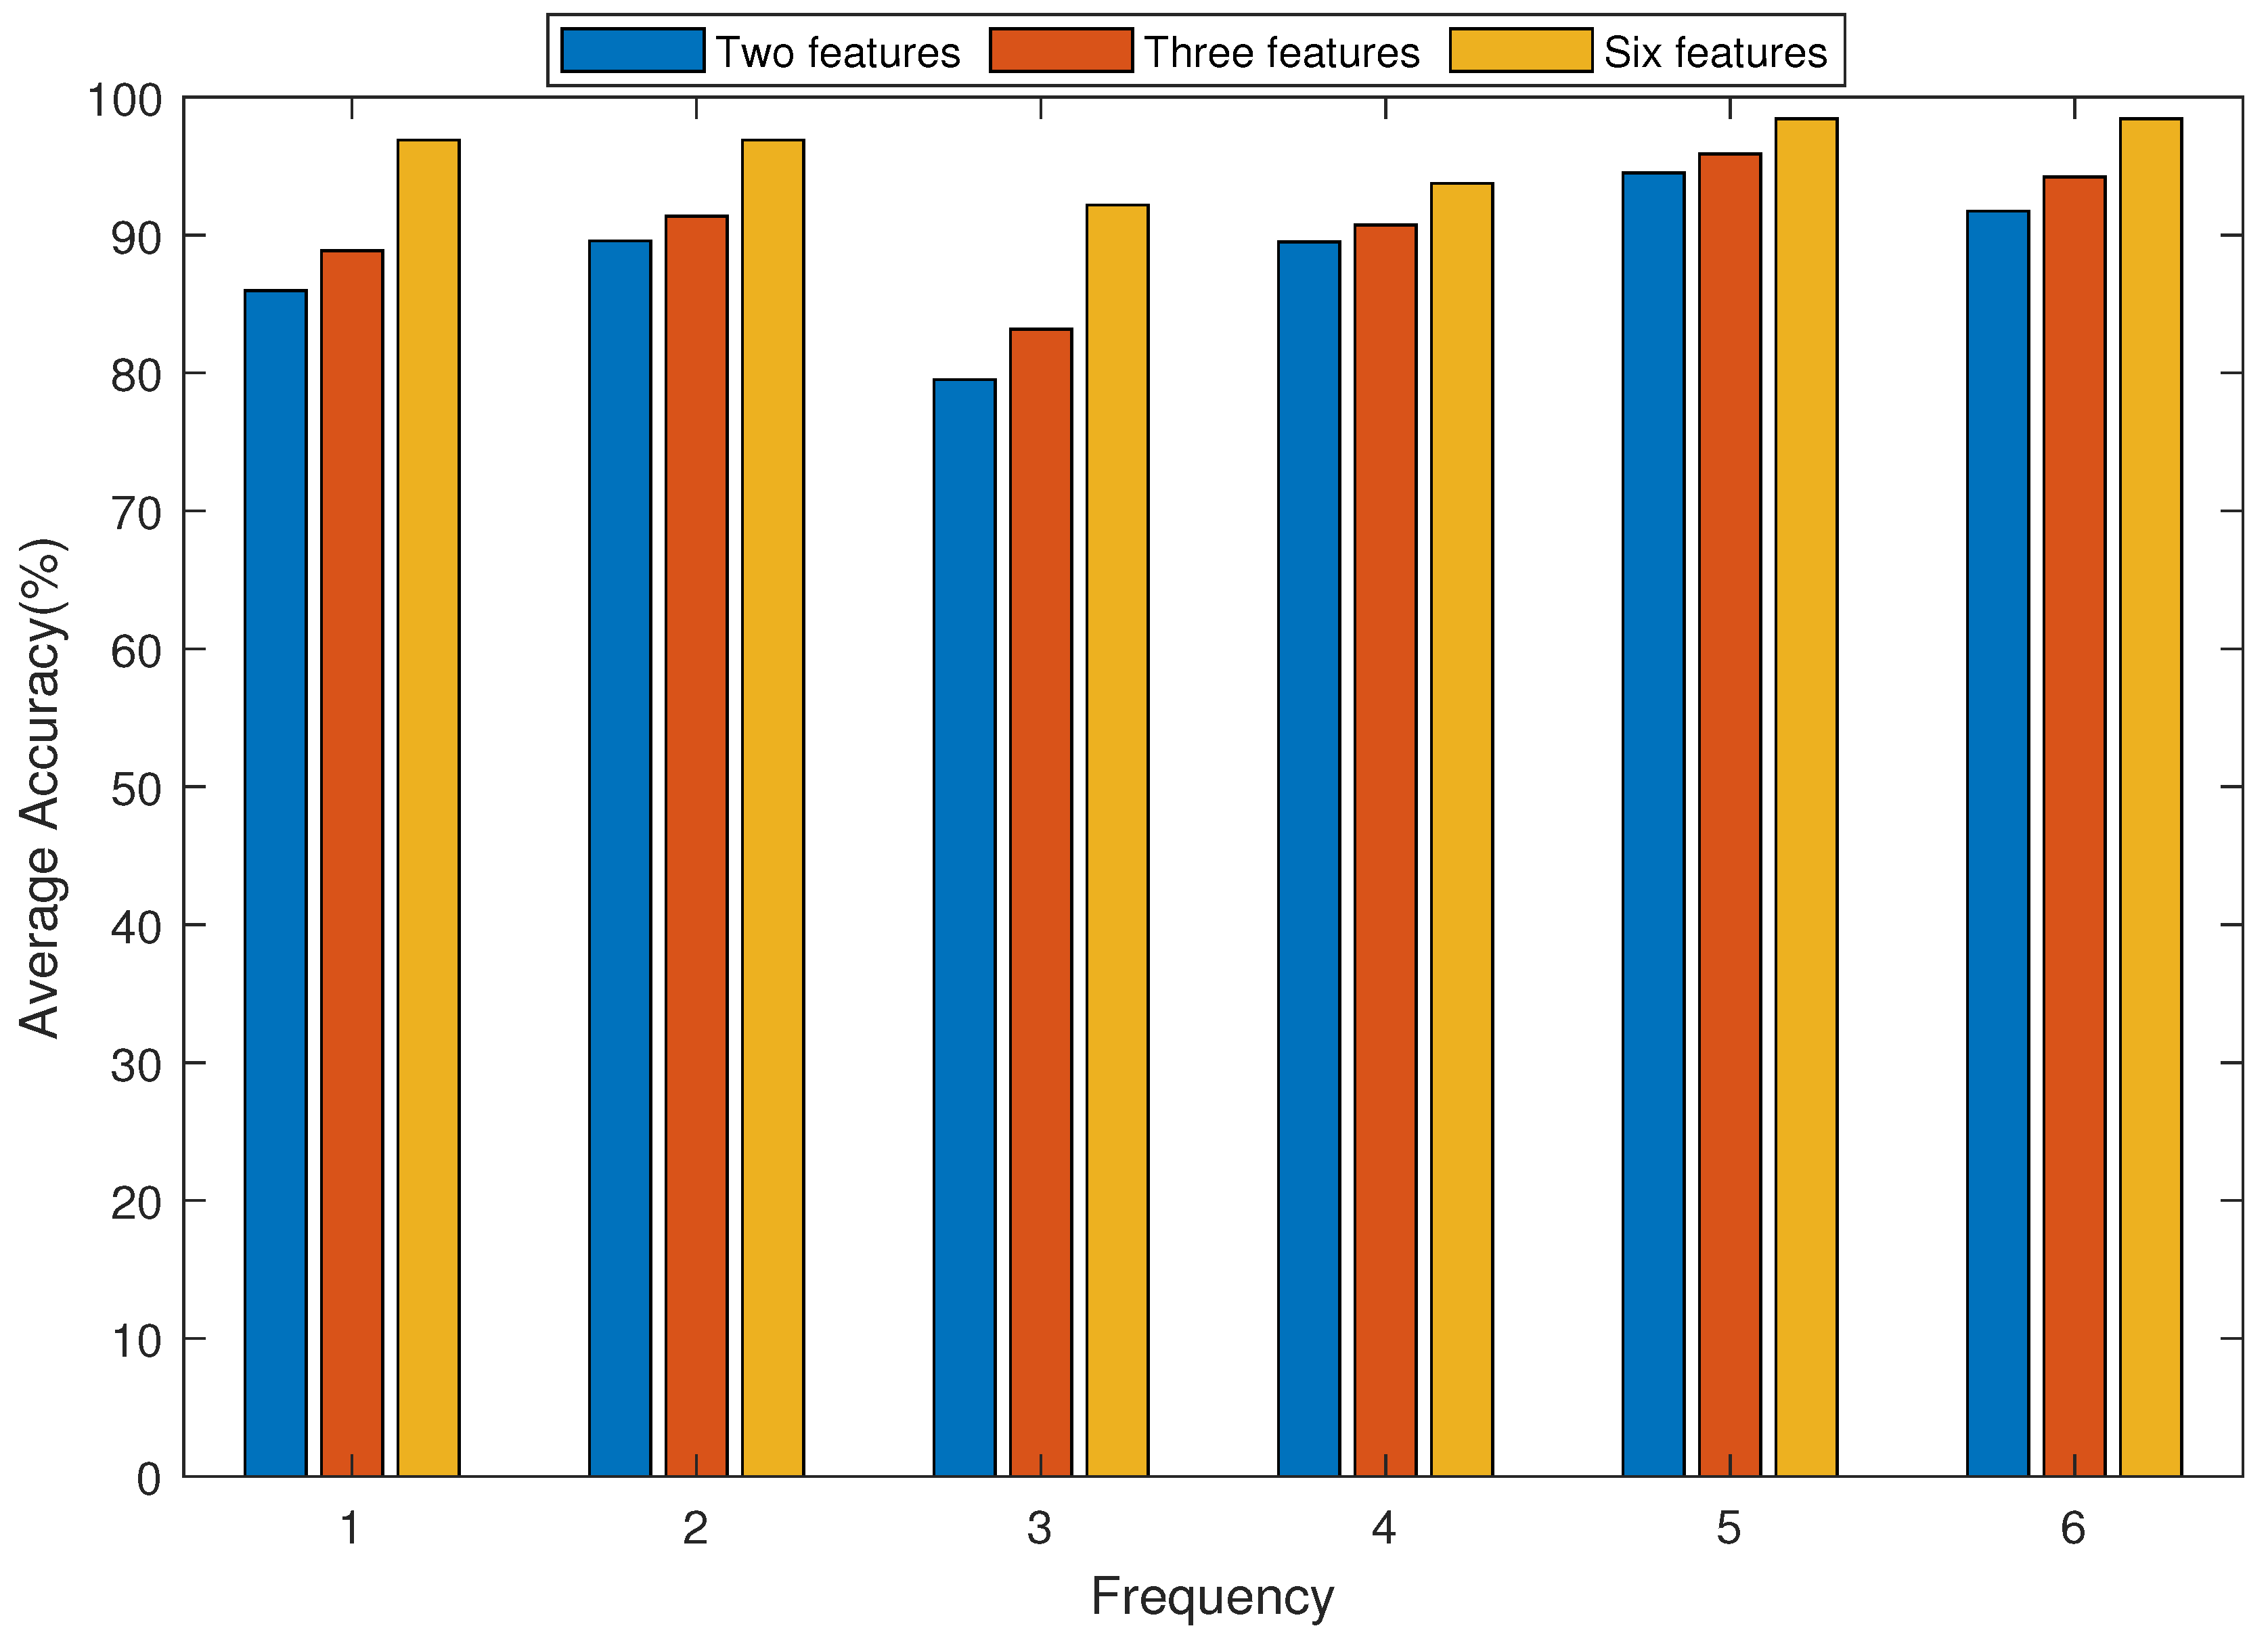
4.5. Comparison of Average Accuracy
5. Conclusions
- (1)
- Enlarge the vibration frequency of the vibration environment and study the influence of a wider range of vibration frequencies on sEMG signals.
- (2)
- Study the accuracy of the LDA algorithm in terms of human intention recognition by comparing the time-domain and frequency-domain characteristics of sEMG signals.
- (3)
- Further compare the classification effects of various classifiers, such as the SVM, fuzzy logic, and the ANN.
Author Contributions
Funding
Institutional Review Board Statement
Informed Consent Statement
Data Availability Statement
Conflicts of Interest
Abbreviations
| sEMG | surface electromyographic |
| LDA | linear discriminant analysis |
| RMS | root mean square |
| ANN | artificial neural network |
| MAV | mean absolute value |
| ZC | zero crossing |
| VAR | variance |
References
- Xing, K.; Yang, P.; Huang, J.; Wang, Y.; Zhu, Q. A real-time EMG pattern recognition method for virtual myoelectric hand control. Neurocomputing 2014, 136, 345–355. [Google Scholar] [CrossRef]
- Veer, K.; Sharma, T. A novel feature extraction for robust EMG pattern recognition. J. Med. Eng. Technol. 2016, 40, 149–154. [Google Scholar] [CrossRef] [PubMed]
- Carlucci, F.; Orlando, G.; Haxhi, J.; Laudani, L.; Giombini, A.; Macaluso, A.; Pigozzi, F.; Sacchetti, M. Older Age Is Associated with Lower Optimal Vibration Frequency in Lower-Limb Muscles During Whole-Body Vibration. Am. J. Phys. Med. Rehabil. 2015, 94, 522–529. [Google Scholar] [CrossRef] [PubMed]
- Lienhard, K.; Vienneau, J.; Nigg, S.; Friesenbichler, B.; Nigg, B.M. Older adults show higher increases in lower-limb muscle activity during whole-body vibration exercise. J. Biomech. 2017, 52, 55–60. [Google Scholar] [CrossRef] [PubMed]
- Zaidell, L.N.; Mileva, K.N.; Sumners, D.P.; Bowtell, J.L. Experimental Evidence of the Tonic Vibration Reflex during Whole-Body Vibration of the Loaded and Unloaded Leg. PLoS ONE 2013, 8, e85247. [Google Scholar]
- Roelants, M.; Delecluse, C.; Verschueren, S.M. Whole-Body-Vibration Training Increases Knee-Extension Strength and Speed of Movement in Older Women. J. Am. Geriatr. Soc. 2004, 52, 901–908. [Google Scholar] [CrossRef]
- Perchthaler, D.; Horstmann, T.; Grau, S. Variations in neuromuscular activity of thigh muscles during whole-body vibration in consideration of different biomechanical variables. J. Sports Sci. Med. 2013, 12, 439–446. [Google Scholar]
- Giombini, A.; Macaluso, A.; Laudani, L.; Di Cesare, A.; Piccinini, A.; Pigozzi, F.; Saraceni, V.M. Acute Effect of Whole-Body Vibration at Optimal Frequency on Muscle Power Output of the Lower Limbs in Older Women. Am. J. Phys. Med. Rehabil. 2013, 92, 797–804. [Google Scholar] [CrossRef]
- Cardinale, M.; Leiper, J.; Erskine, J.; Milroy, M.; Bell, S. The acute effects of different whole body vibration amplitudes on the endocrine system of young healthy men: A preliminary study. Clin. Physiol. Funct. Imaging 2010, 26, 380–384. [Google Scholar] [CrossRef] [PubMed]
- Chu, J.U.; Moon, I.; Lee, Y.J.; Kim, S.K.; Mun, M.S. A Supervised Feature-Projection-Based Real-Time EMG Pattern Recognition for Multifunction Myoelectric Hand Control. IEEE/ASME Trans. Mechatron. 2007, 12, 282–290. [Google Scholar] [CrossRef]
- Konrad, P. The ABC of EMG. A Practical Introduction to Kinesiological Electromyography; Noraxon Inc.: Scottsdale, AZ, USA, 2005. [Google Scholar]
- Scheme, E.J.; Englehart, K.B.; Hudgins, B.S. Selective Classification for Improved Robustness of Myoelectric Control Under Nonideal Conditions. IEEE Trans. Biomed. Eng. 2011, 58, 1698–1705. [Google Scholar] [CrossRef]
- Shair, E.F.; Ahmad, S.A.; Marhaban, M.H.; Mohd Tamrin, S.B.; Abdullah, A.R. EMG Processing Based Measures of Fatigue Assessment during Manual Lifting. BioMed Res. Int. 2017, 2017, 3937254. [Google Scholar] [CrossRef]
- Nsugbe, E.; Phillips, C.; Fraser, M.; McIntosh, J. Gesture Recognition for Trans-humeral Prosthesis Control Using EMG and NIR. IET Cyber-Syst. Robot. 2020, 2, 122–131. [Google Scholar] [CrossRef]
- Phinyomark, A.; Hirunviriya, S.; Limsakul, C.; Phukpattaranont, P. Evaluation of EMG feature extraction for hand movement recognition based on Euclidean distance and standard deviation. In Proceedings of the ECTI-CON2010: The 2010 ECTI International Confernce on Electrical Engineering/Electronics, Computer, Telecommunications and Information Technology, Chiang Mai, Thailand, 19–21 May 2010. [Google Scholar]
- Wang, N.; Lao, K.; Zhang, X. Design and Myoelectric Control of an Anthropomorphic Prosthetic Hand. J. Bionic Eng. 2017, 14, 47–59. [Google Scholar] [CrossRef]
- Farina, D.; Lucas, M.F.; Doncarli, C. Optimized wavelets for blind separation of non-stationnary surface myoelectric signals. IEEE Trans. Biomed. Eng. 2007, 55, 78–86. [Google Scholar] [CrossRef] [PubMed]
- Tkach, D.; Huang, H.; Kuiken, T.A. Study of stability of time-domain features for electromyographic pattern recognition. J. Neuroeng. Rehabil. 2010, 7, 21. [Google Scholar] [CrossRef] [PubMed] [Green Version]
- Potluri, C.; Kumar, P.; Anugolu, M.; Urfer, A.; Chiu, S.; Naidu, D.S.; Schoen, M.P. Frequency domain surface EMG sensor fusion for estimating finger forces. In Proceedings of the 2010 Annual International Conference of the IEEE Engineering in Medicine and Biology, Buenos Aires, Argentina, 31 August–4 September 2010; pp. 5975–5978. [Google Scholar]
- Sapsanis, C.; Georgoulas, G.; Tzes, A. EMG based classification of basic hand movements based on time-frequency features. In Proceedings of the 21st Mediterranean Conference on Control and Automation, Platanias, Greece, 25–28 June 2013. [Google Scholar]
- Hudgins, B.; Parker, P.; Scott, R.N. A new strategy for multifunction myoelectric control. IEEE Trans. Biomed. Eng. 1993, 40, 82–94. [Google Scholar] [CrossRef]
- Kim, K.S.; Choi, H.H.; Moon, C.S.; Mun, C.W. Comparison of k-nearest neighbor, quadratic discriminant and linear discriminant analysis in classification of electromyogram signals based on the wrist-motion directions. Curr. Appl. Phys. 2011, 11, 740–745. [Google Scholar] [CrossRef]
- Zhang, H.; Zhao, Y.; Yao, F.; Xu, L.; Shang, P.; Li, G. An adaptation strategy of using LDA classifier for EMG pattern recognition. In Proceedings of the 2013 35th Annual International Conference of the IEEE Engineering in Medicine and Biology Society (EMBC), Osaka, Japan, 3–7 July 2013; pp. 4267–4270. [Google Scholar]
- Mane, S.M.; Kambli, R.A.; Kazi, F.S.; Singh, N.M. Hand Motion Recognition from Single Channel Surface EMG Using Wavelet and Artificial Neural Network. Procedia Comput. Sci. 2015, 49, 58–65. [Google Scholar] [CrossRef] [Green Version]
- Oskoei, M.A.; Hu, H. Support Vector Machine-Based Classification Scheme for Myoelectric Control Applied to Upper Limb. IEEE Trans. Biomed. Eng. 2008, 55, 1956–1965. [Google Scholar] [CrossRef]
- Zecca, M.; Micera, S.; Carrozza, M.C.; Dario, P. Control of multifunctional prosthetic hands by processing the electromyographic signal. Crit. Rev. Biomed. Eng. 2002, 30, 459–485. [Google Scholar] [CrossRef] [Green Version]
- Khushaba, R.N.; Kodagoda, S.; Takruri, M.; Dissanayake, G. Toward improved control of prosthetic fingers using surface electromyogram (EMG) signals. Expert Syst. Appl. 2012, 39, 10731–10738. [Google Scholar] [CrossRef]
- Stankovic, L.; Stankovic, S.; Dakovic, M. From the STFT to the Wigner Distribution [Lecture Notes]. IEEE Signal Process. Mag. 2014, 31, 163–174. [Google Scholar] [CrossRef]
- Chi, P.J.; Russell, C.T. Use of the Wigner-Ville distribution in interpreting and identifying ULF waves in triaxial magnetic records. J. Geophys. Res. Space Phys. 2008, 113. [Google Scholar] [CrossRef] [Green Version]
- Adam, O. The use of the Hilbert-Huang transform to analyze transient signals emitted by sperm whales. Appl. Acoust. 2006, 67, 1134–1143. [Google Scholar] [CrossRef]
- She, H.; Zhu, J.; Tian, Y.; Wang, Y.; Yokoi, H.; Huang, Q. sEMG Feature Extraction Based on Stockwell Transform Improves Hand Movement Recognition Accuracy. Sensors 2019, 19, 4457. [Google Scholar] [CrossRef] [Green Version]
- Rabiei, B.; Rahimi, M.D. Evaluation of Different Grouping Methods of Rapeseed Genotypes Using Fisher’s Linear Discrimination Function Analysis. J. Sci. Technol. Agric. Nat. Resour. 2009, 13, 529–543. [Google Scholar]
- Choi, J.; Park, D. A stable feedback control of the buffer state using the controlled Lagrange multiplier method. IEEE Trans. Image Process. 1994, 3, 546–558. [Google Scholar] [CrossRef]


| No. | Subject | 0 Hz | 10 Hz | 20 Hz | 30 Hz | 40 Hz | 50 Hz |
|---|---|---|---|---|---|---|---|
| 1 | ZC, RMS | 91.67 | 94.79 | 90.63 | 94.79 | 96.88 | 96.88 |
| 2 | VAR, RMS | 93.75 | 94.79 | 82.29 | 94.79 | 97.92 | 94.79 |
| 3 | MIN, RMS | 93.75 | 94.79 | 80.21 | 92.71 | 96.88 | 93.75 |
| 4 | MAV, RMS | 89.58 | 89.58 | 87.50 | 90.63 | 97.96 | 90.63 |
| 5 | MAX, RMS | 89.58 | 93.75 | 79.17 | 88.54 | 95.83 | 94.79 |
| 6 | MAV, VAR | 86.46 | 88.54 | 81.25 | 90.63 | 94.79 | 91.67 |
| 7 | MAV, ZC | 89.58 | 92.71 | 88.54 | 93.75 | 98.96 | 96.88 |
| 8 | MAV, MAX | 88.54 | 93.75 | 83.33 | 90.63 | 95.83 | 91.67 |
| 9 | MAV, MIN | 91.67 | 91.67 | 83.33 | 95.83 | 98.96 | 91.67 |
| 10 | VAR, ZC | 87.5 | 93.75 | 77.08 | 93.75 | 95.83 | 96.88 |
| 11 | VAR, MAX | 87.5 | 90.63 | 78.13 | 94.79 | 95.83 | 92.71 |
| 12 | VAR, MIN | 83.33 | 95.83 | 77.08 | 84.38 | 92.71 | 94.79 |
| 13 | ZC, MAX | 65.63 | 84.36 | 68.75 | 81.25 | 85.42 | 84.38 |
| 14 | ZC, MIN | 73.96 | 63.54 | 66.67 | 78.13 | 82.29 | 81.25 |
| 15 | MAX, MIN | 77.08 | 81.25 | 69.79 | 78.13 | 91.67 | 83.33 |
| No. | Subject | 0 Hz | 10 Hz | 20 Hz | 30 Hz | 40 Hz | 50 Hz |
|---|---|---|---|---|---|---|---|
| 1 | RMS, MAV, ZC | 86.46 | 90.63 | 89.58 | 89.58 | 97.92 | 95.83 |
| 2 | RMS, MAV, VAR | 90.63 | 92.71 | 76.04 | 95.83 | 96.88 | 92.71 |
| 3 | RMS, MAV, MAN | 89.58 | 90.63 | 81.25 | 91.67 | 94.79 | 91.67 |
| 4 | RMS, MAV, MIN | 90.63 | 90.63 | 82.29 | 91.67 | 97.79 | 92.71 |
| 5 | RMS, VAR, MIN | 92.71 | 95.83 | 88.54 | 94.79 | 96.88 | 94.79 |
| 6 | RMS, VAR, MAX | 91.67 | 92.71 | 82.29 | 94.79 | 96.88 | 95.83 |
| 7 | RMS, VAR, ZC | 91.67 | 93.75 | 85.42 | 95.83 | 97.92 | 96.88 |
| 8 | RMS, MIN, MAX | 88.54 | 91.67 | 87.5 | 86.46 | 95.83 | 92.71 |
| 9 | RMS, MIN, ZC | 91.67 | 94.79 | 90.63 | 92.71 | 96.88 | 96.88 |
| 10 | RMS, MAX, ZC | 87.5 | 93.75 | 85.42 | 88.54 | 95.83 | 95.83 |
| 11 | MAV, VAR, MIN | 89.58 | 88.54 | 79.17 | 92.71 | 95.83 | 91.67 |
| 12 | MAV, VAR, MAX | 90.63 | 90.63 | 83.33 | 90.63 | 95.83 | 91.67 |
| 13 | MAV, VAR, ZC | 85.42 | 90.63 | 89.58 | 91.67 | 96.88 | 96.88 |
| 14 | MAV, MIN, ZC | 90.63 | 92.71 | 87.5 | 95.83 | 98.96 | 96.88 |
| 15 | MAV, MIN, MAX | 87.5 | 91.67 | 83.33 | 88.54 | 94.79 | 91.67 |
| 16 | MAV, MAX, ZC | 89.58 | 94.79 | 86.46 | 90.63 | 95.83 | 95.83 |
| 17 | VAR, MIN, MAX | 88.54 | 87.5 | 79.17 | 83.33 | 93.75 | 93.75 |
| 18 | VAR, MIN, ZC | 88.54 | 95.83 | 79.17 | 83.33 | 94.79 | 96.88 |
| 19 | VAR, MAX, ZC | 85.42 | 90.63 | 73.96 | 91.67 | 91.67 | 95.83 |
| 20 | MIN, MAX, ZC | 80.21 | 77.08 | 72.92 | 84.38 | 91.67 | 87.5 |
| No. | Subject | 0 Hz | 10 Hz | 20 Hz | 30 Hz | 40 Hz | 50 Hz |
|---|---|---|---|---|---|---|---|
| 1 | All Features | 96.88 | 96.88 | 92.19 | 93.75 | 98.44 | 98.44 |
Publisher’s Note: MDPI stays neutral with regard to jurisdictional claims in published maps and institutional affiliations. |
© 2021 by the authors. Licensee MDPI, Basel, Switzerland. This article is an open access article distributed under the terms and conditions of the Creative Commons Attribution (CC BY) license (https://creativecommons.org/licenses/by/4.0/).
Share and Cite
Wang, Y.; Tian, Y.; Zhu, J.; She, H.; Yokoi, H.; Jiang, Y.; Huang, Q. A Study on the Classification Effect of sEMG Signals in Different Vibration Environments Based on the LDA Algorithm. Sensors 2021, 21, 6234. https://doi.org/10.3390/s21186234
Wang Y, Tian Y, Zhu J, She H, Yokoi H, Jiang Y, Huang Q. A Study on the Classification Effect of sEMG Signals in Different Vibration Environments Based on the LDA Algorithm. Sensors. 2021; 21(18):6234. https://doi.org/10.3390/s21186234
Chicago/Turabian StyleWang, Yanchao, Ye Tian, Jinying Zhu, Haotian She, Hiroshi Yokoi, Yinlai Jiang, and Qiang Huang. 2021. "A Study on the Classification Effect of sEMG Signals in Different Vibration Environments Based on the LDA Algorithm" Sensors 21, no. 18: 6234. https://doi.org/10.3390/s21186234