
The Mitochondria-Independent Cytotoxic Effect of Leflunomide on RPMI-8226 Multiple Myeloma Cell Line

 , , and
Abstract
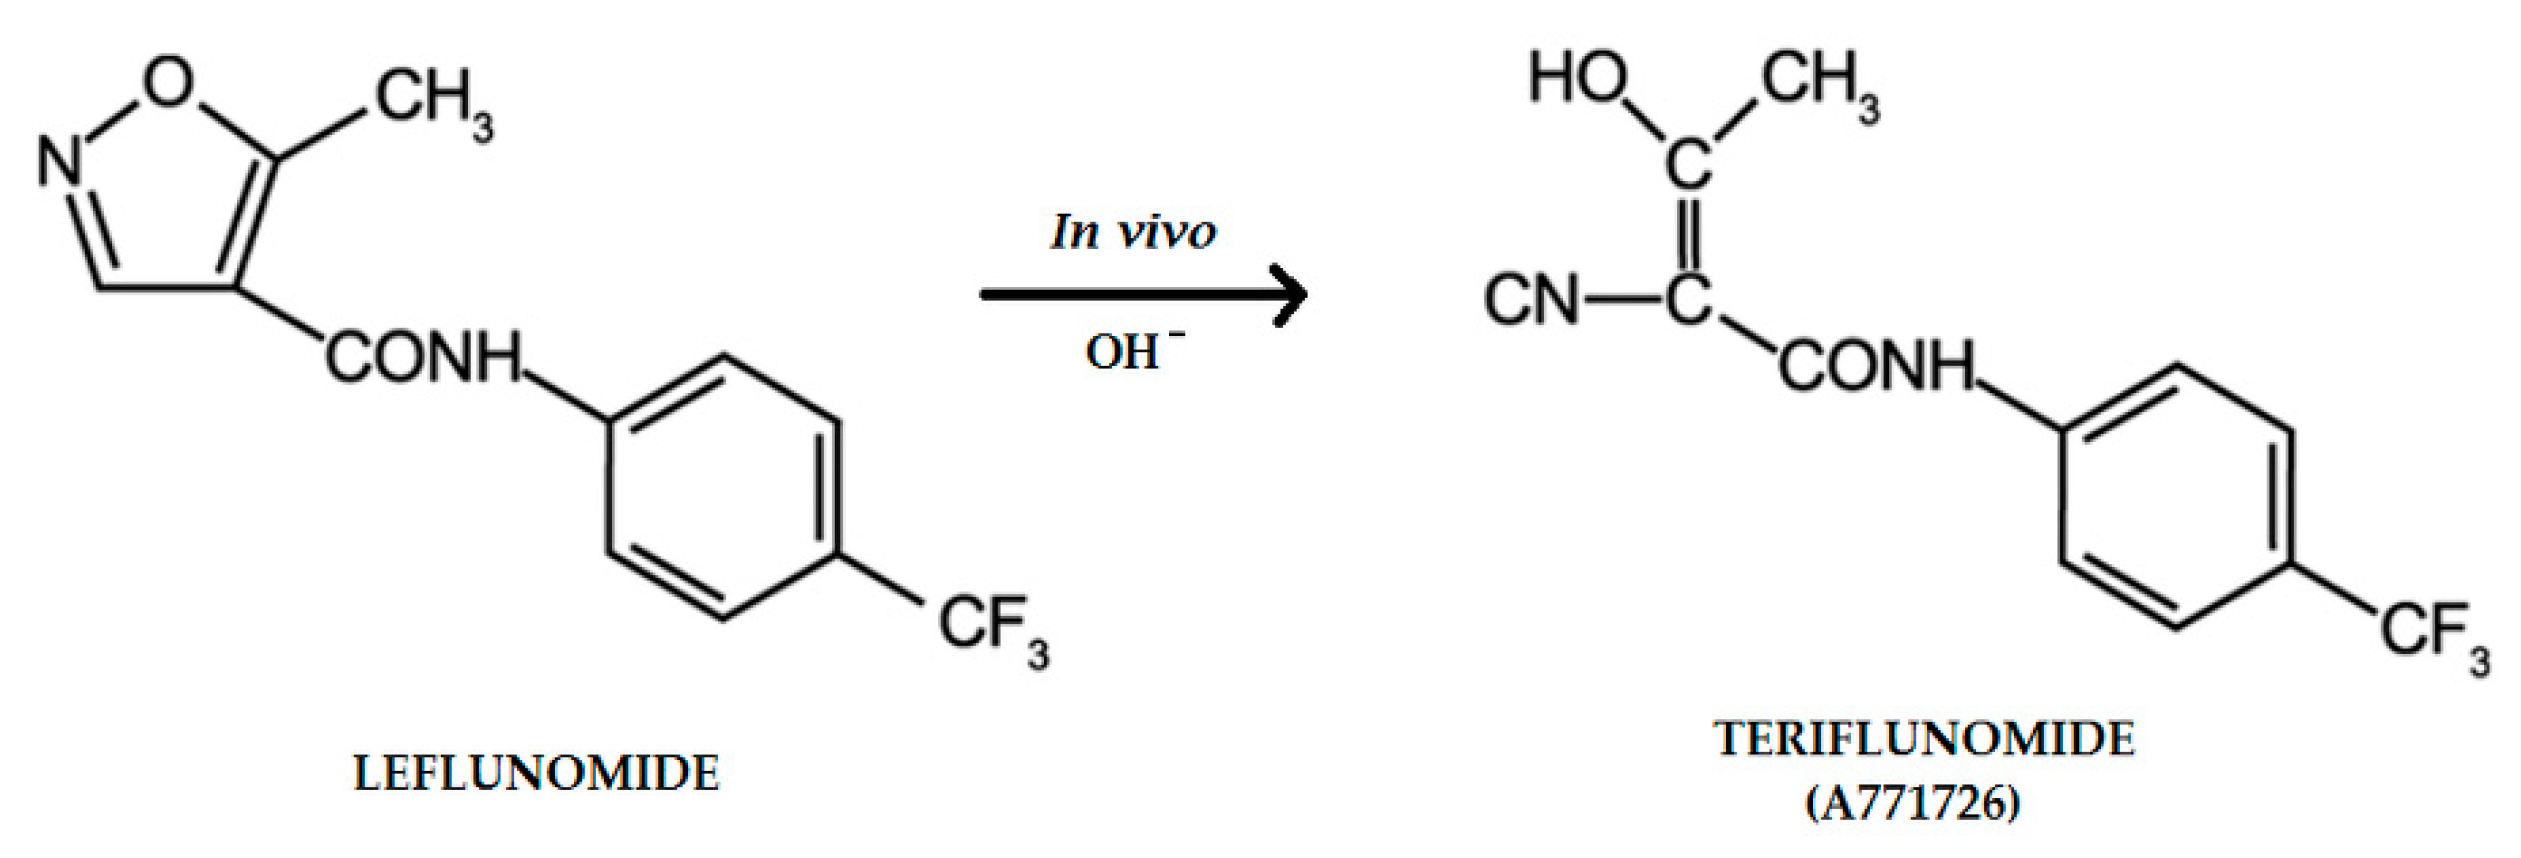
:1. Introduction
2. Results
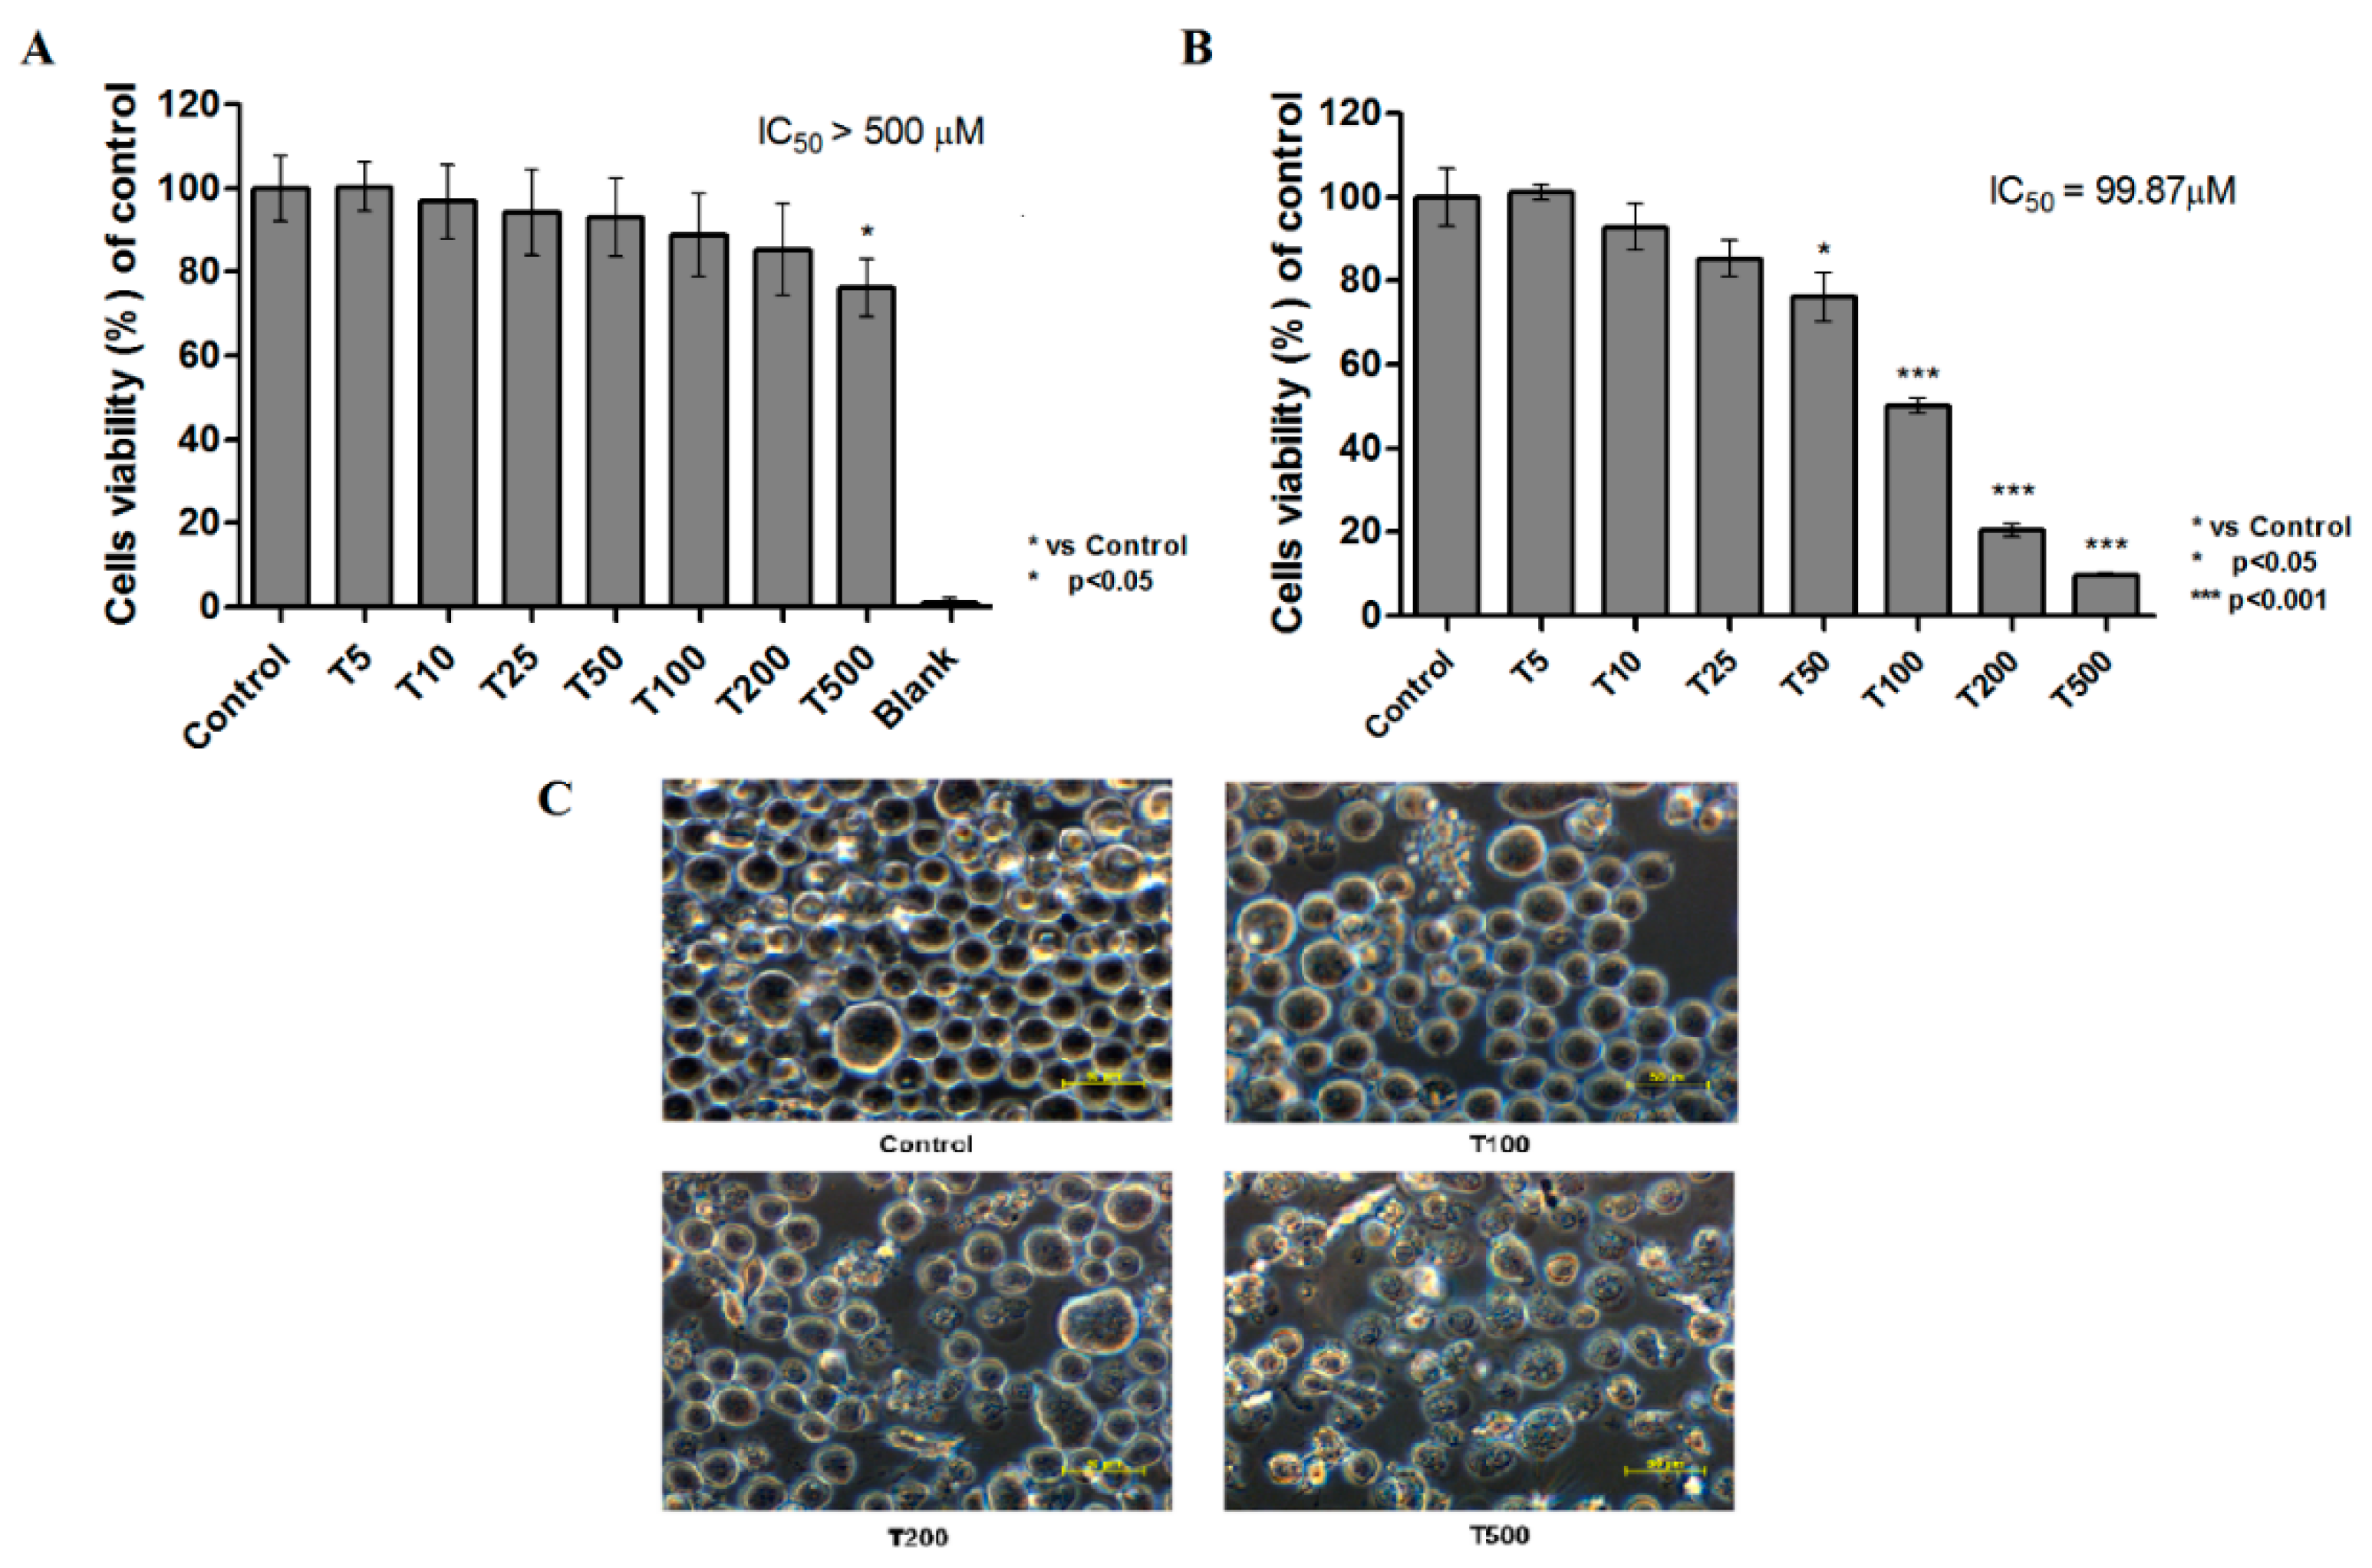
2.1. Cytotoxicity of Teriflunomide
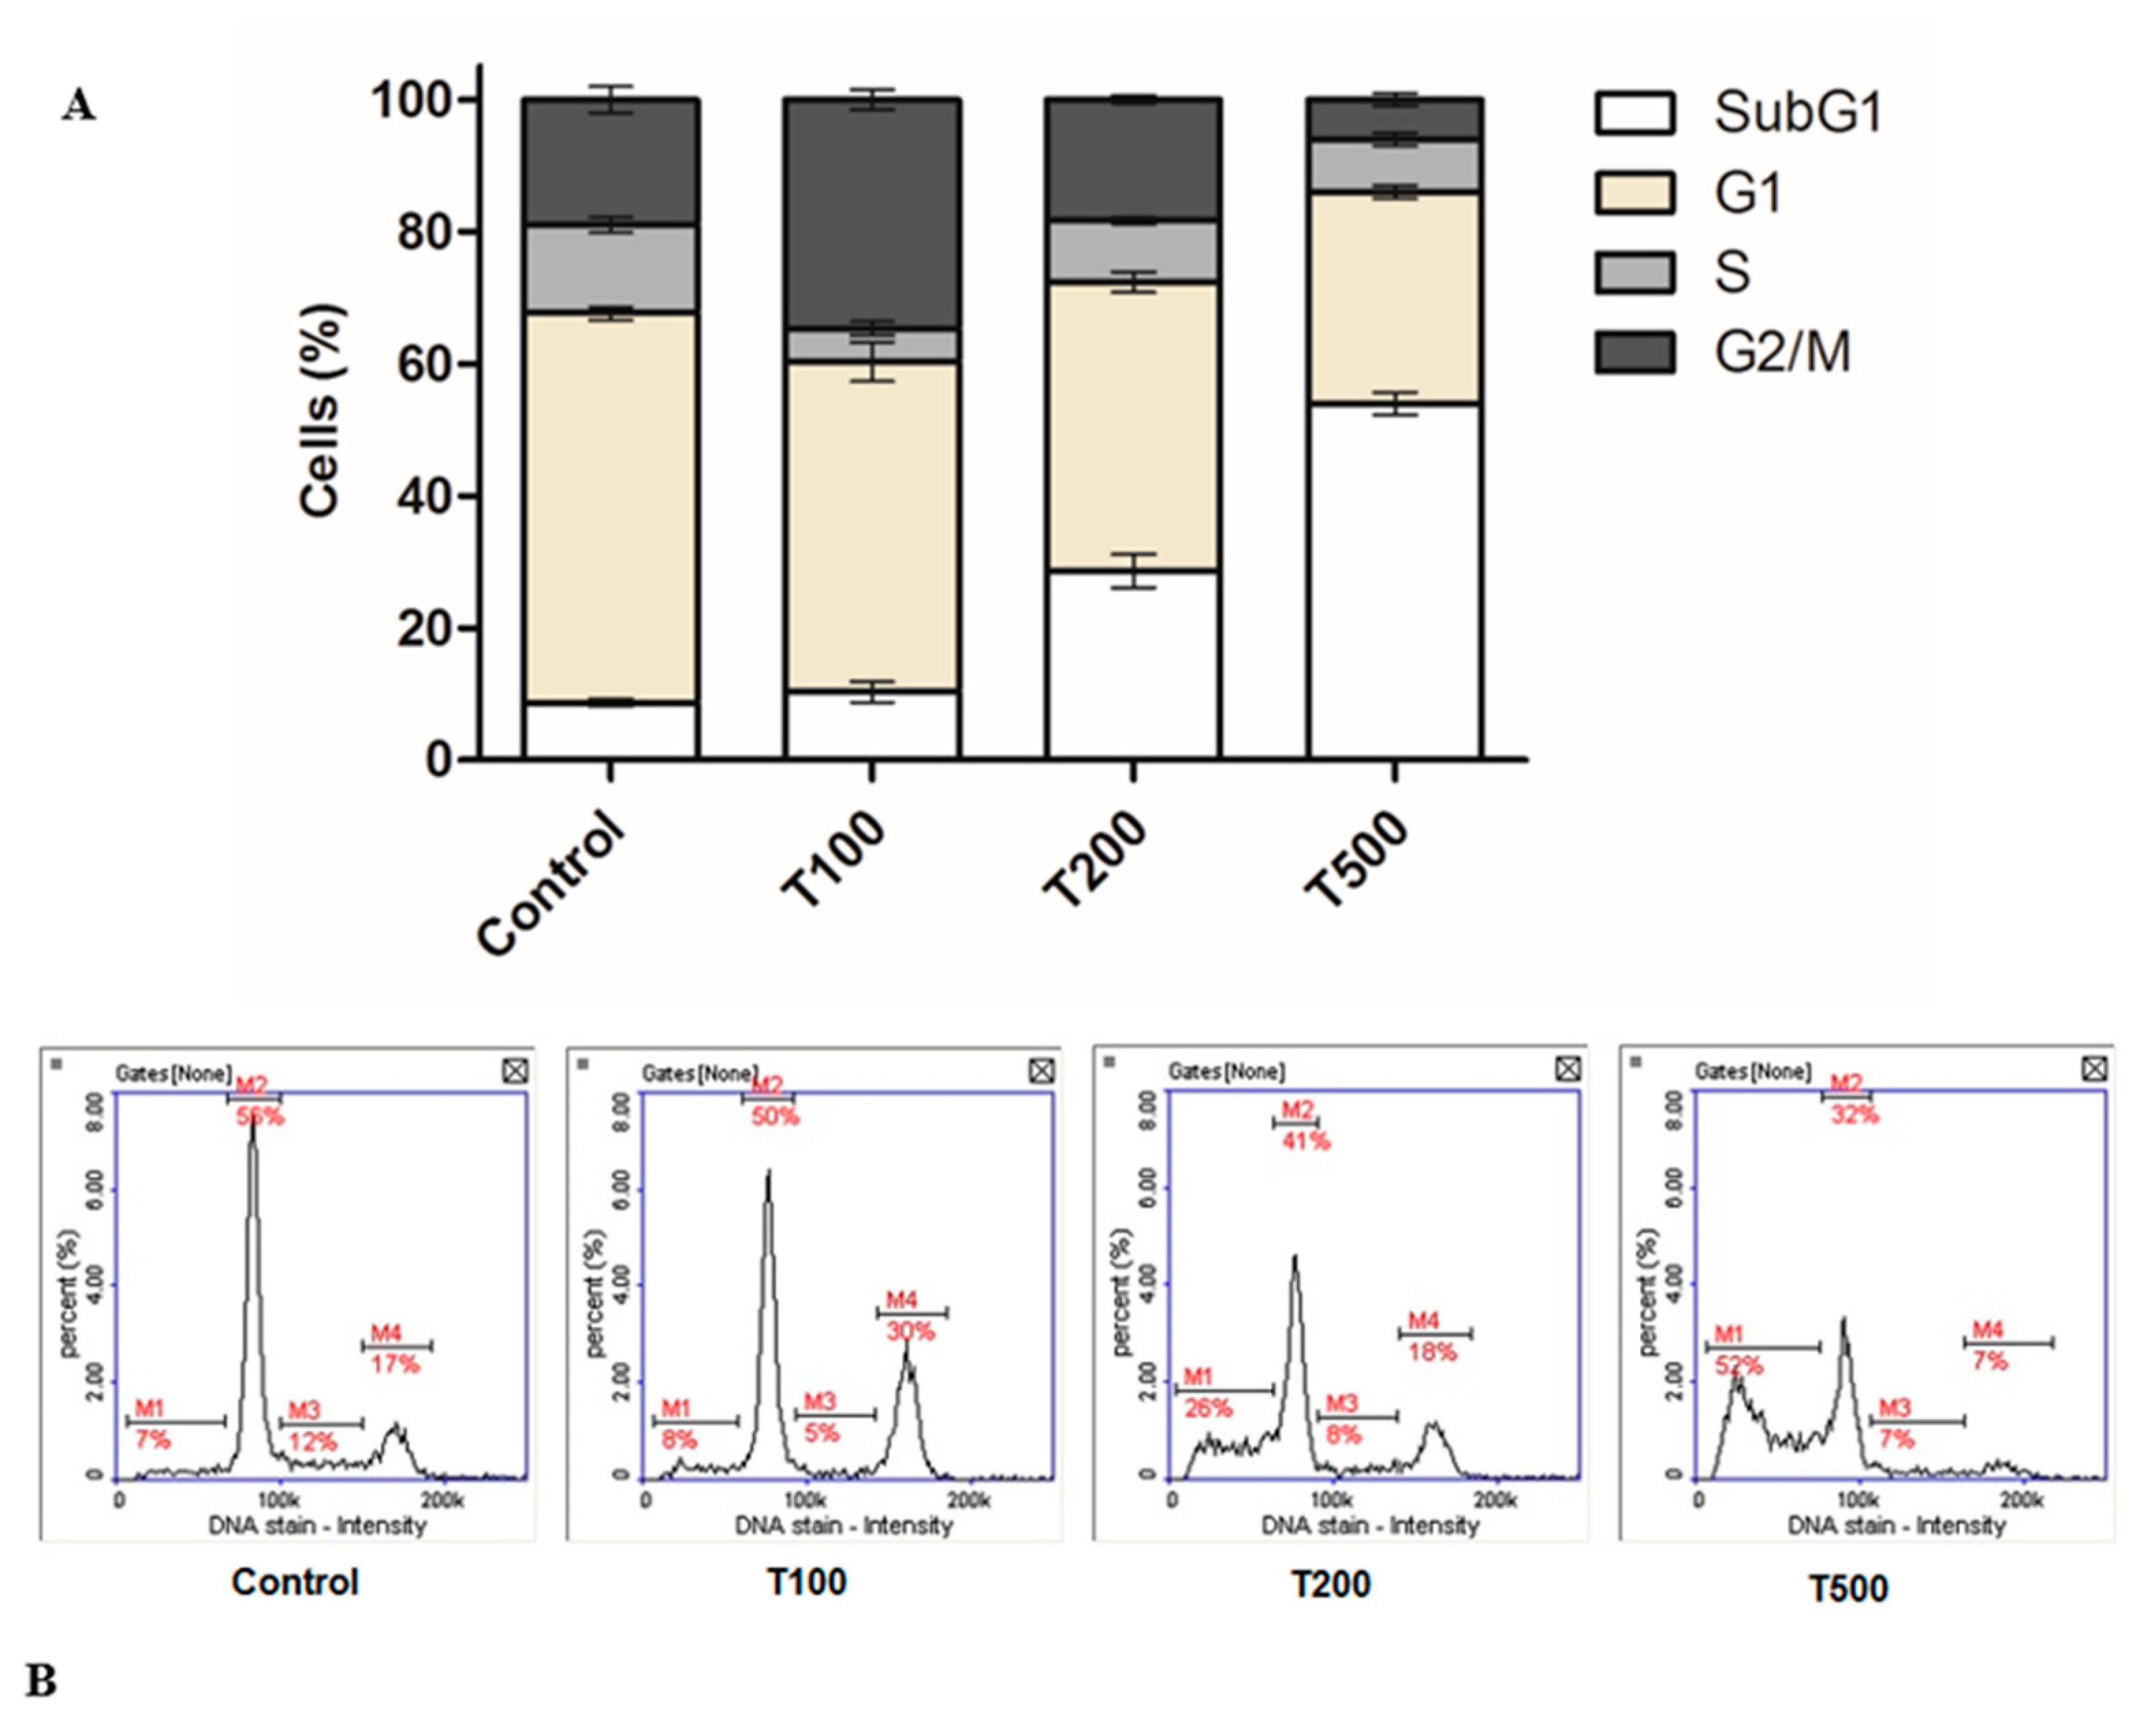
2.2. Teriflunomide-Induced Cell Cycle G2/M Phase Arrest
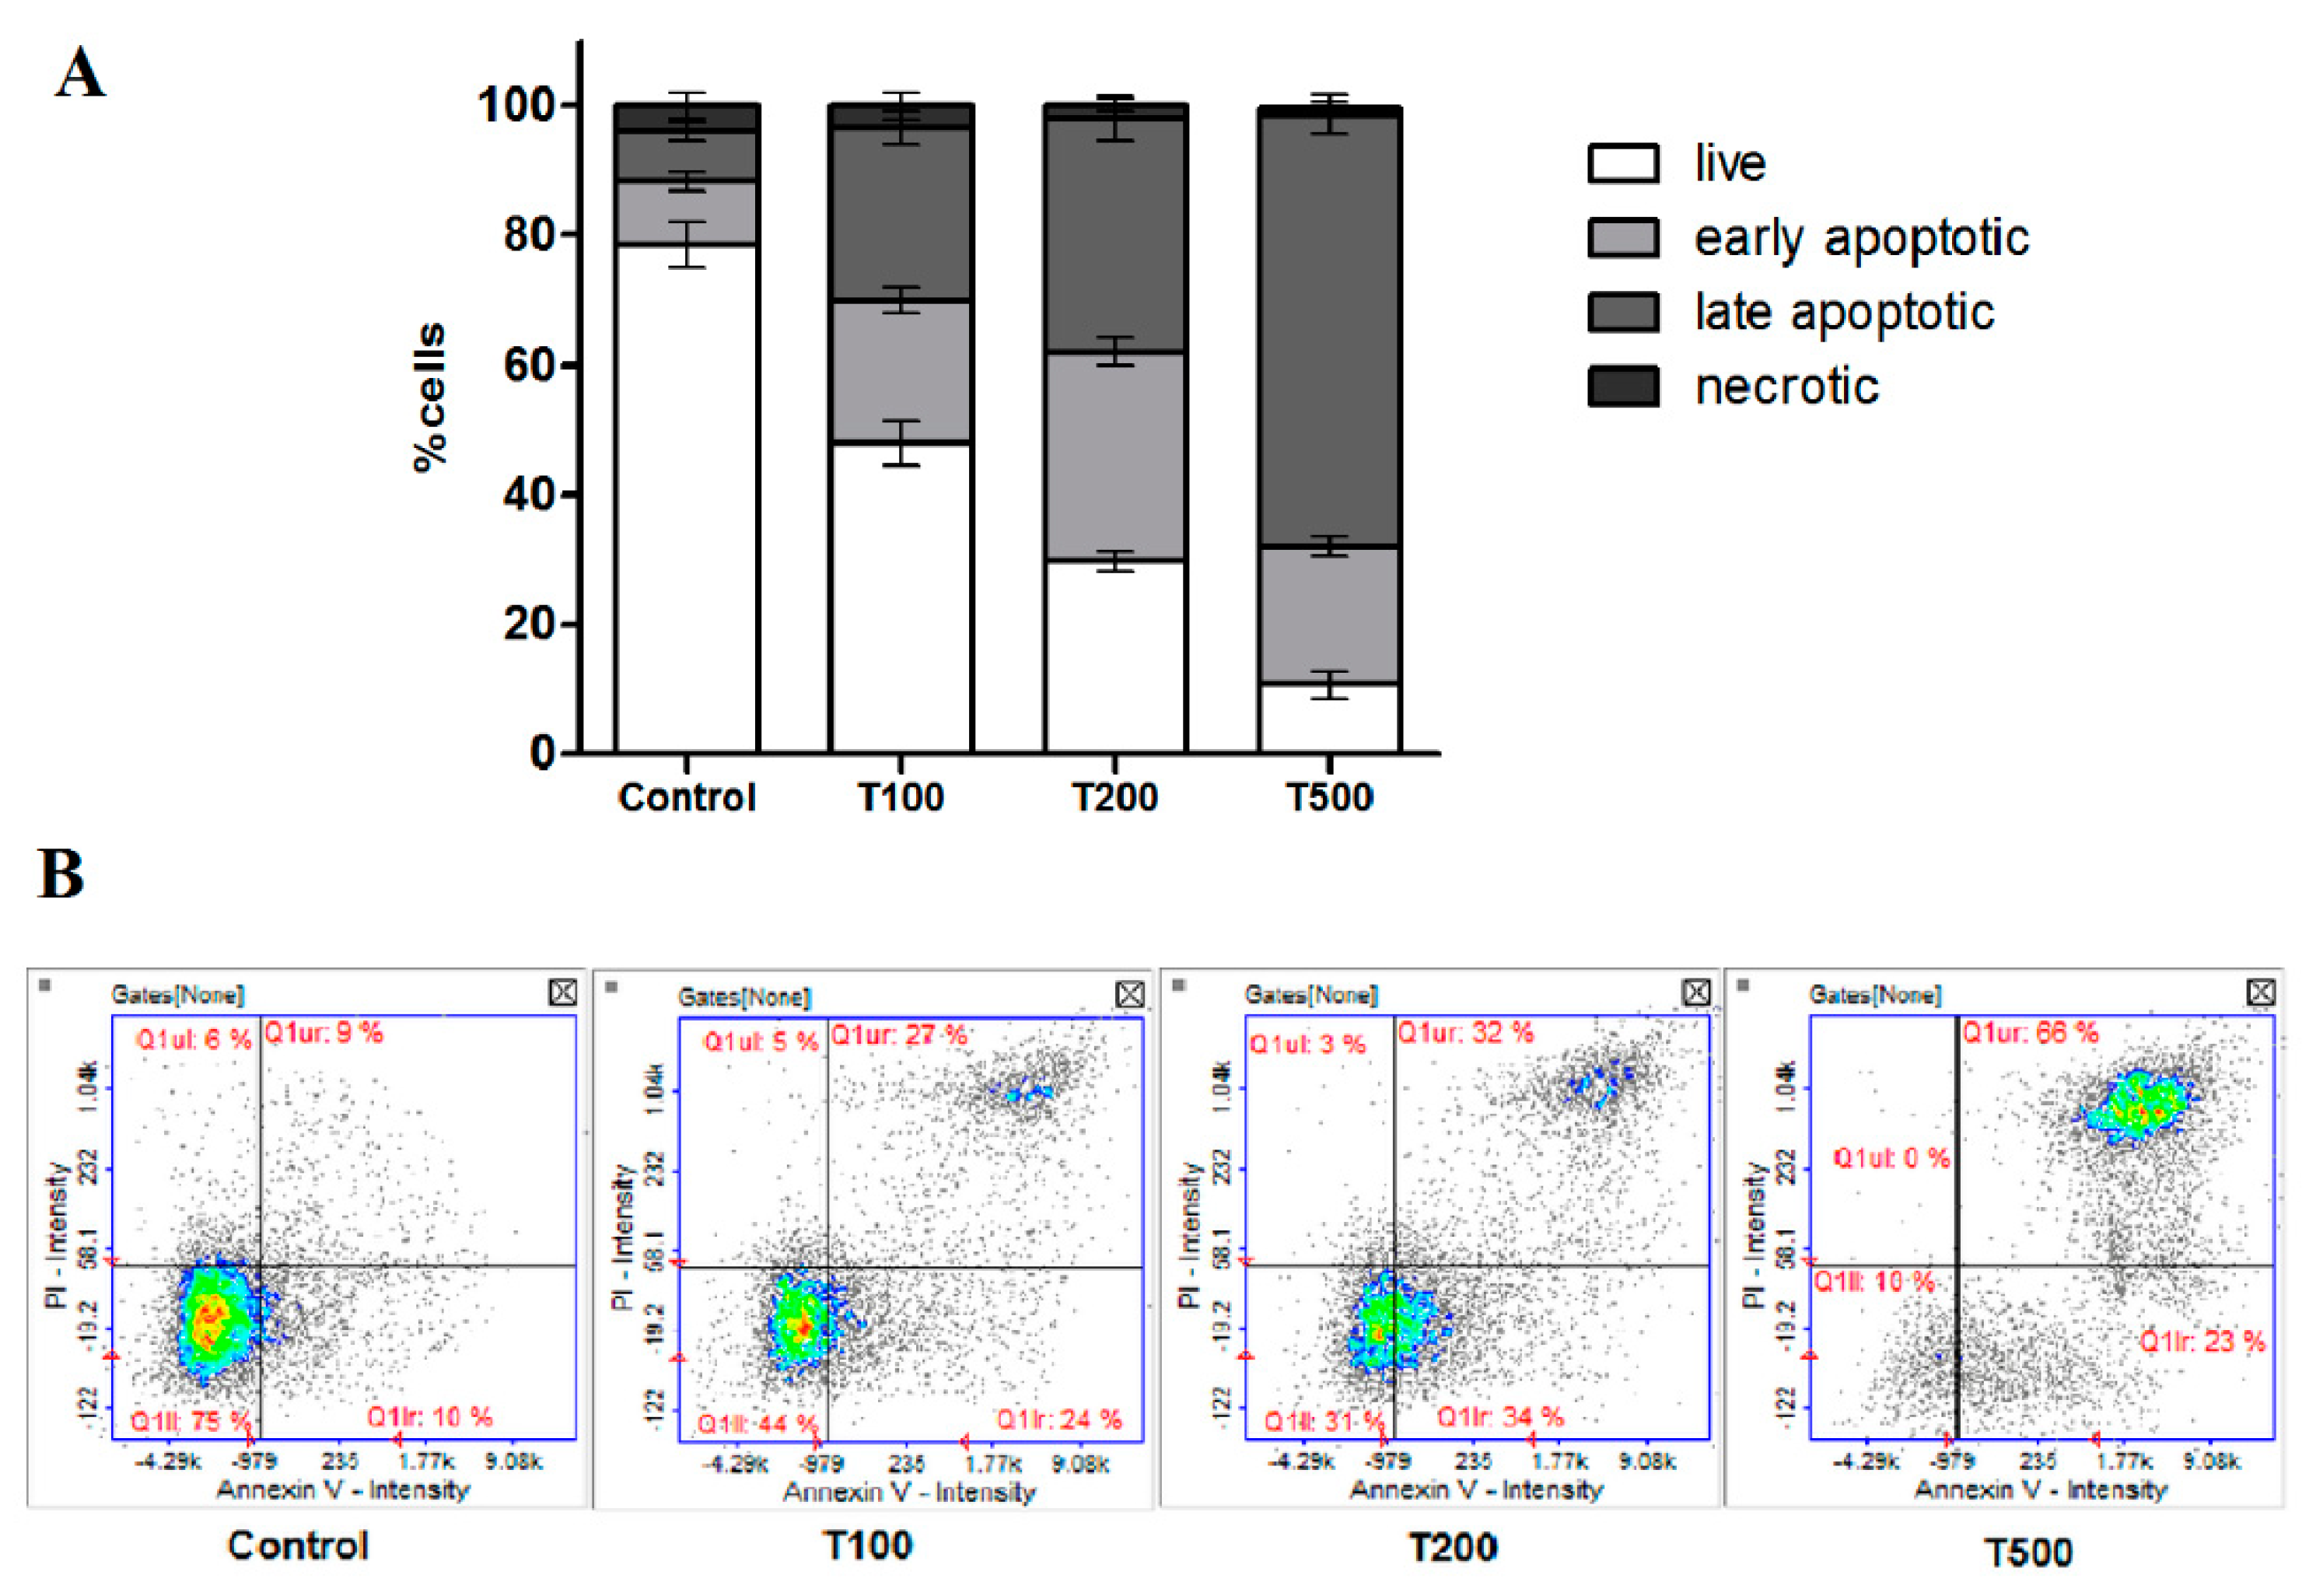
2.3. Teriflunomide-Induced RPMI 8226 Cells Apoptosis
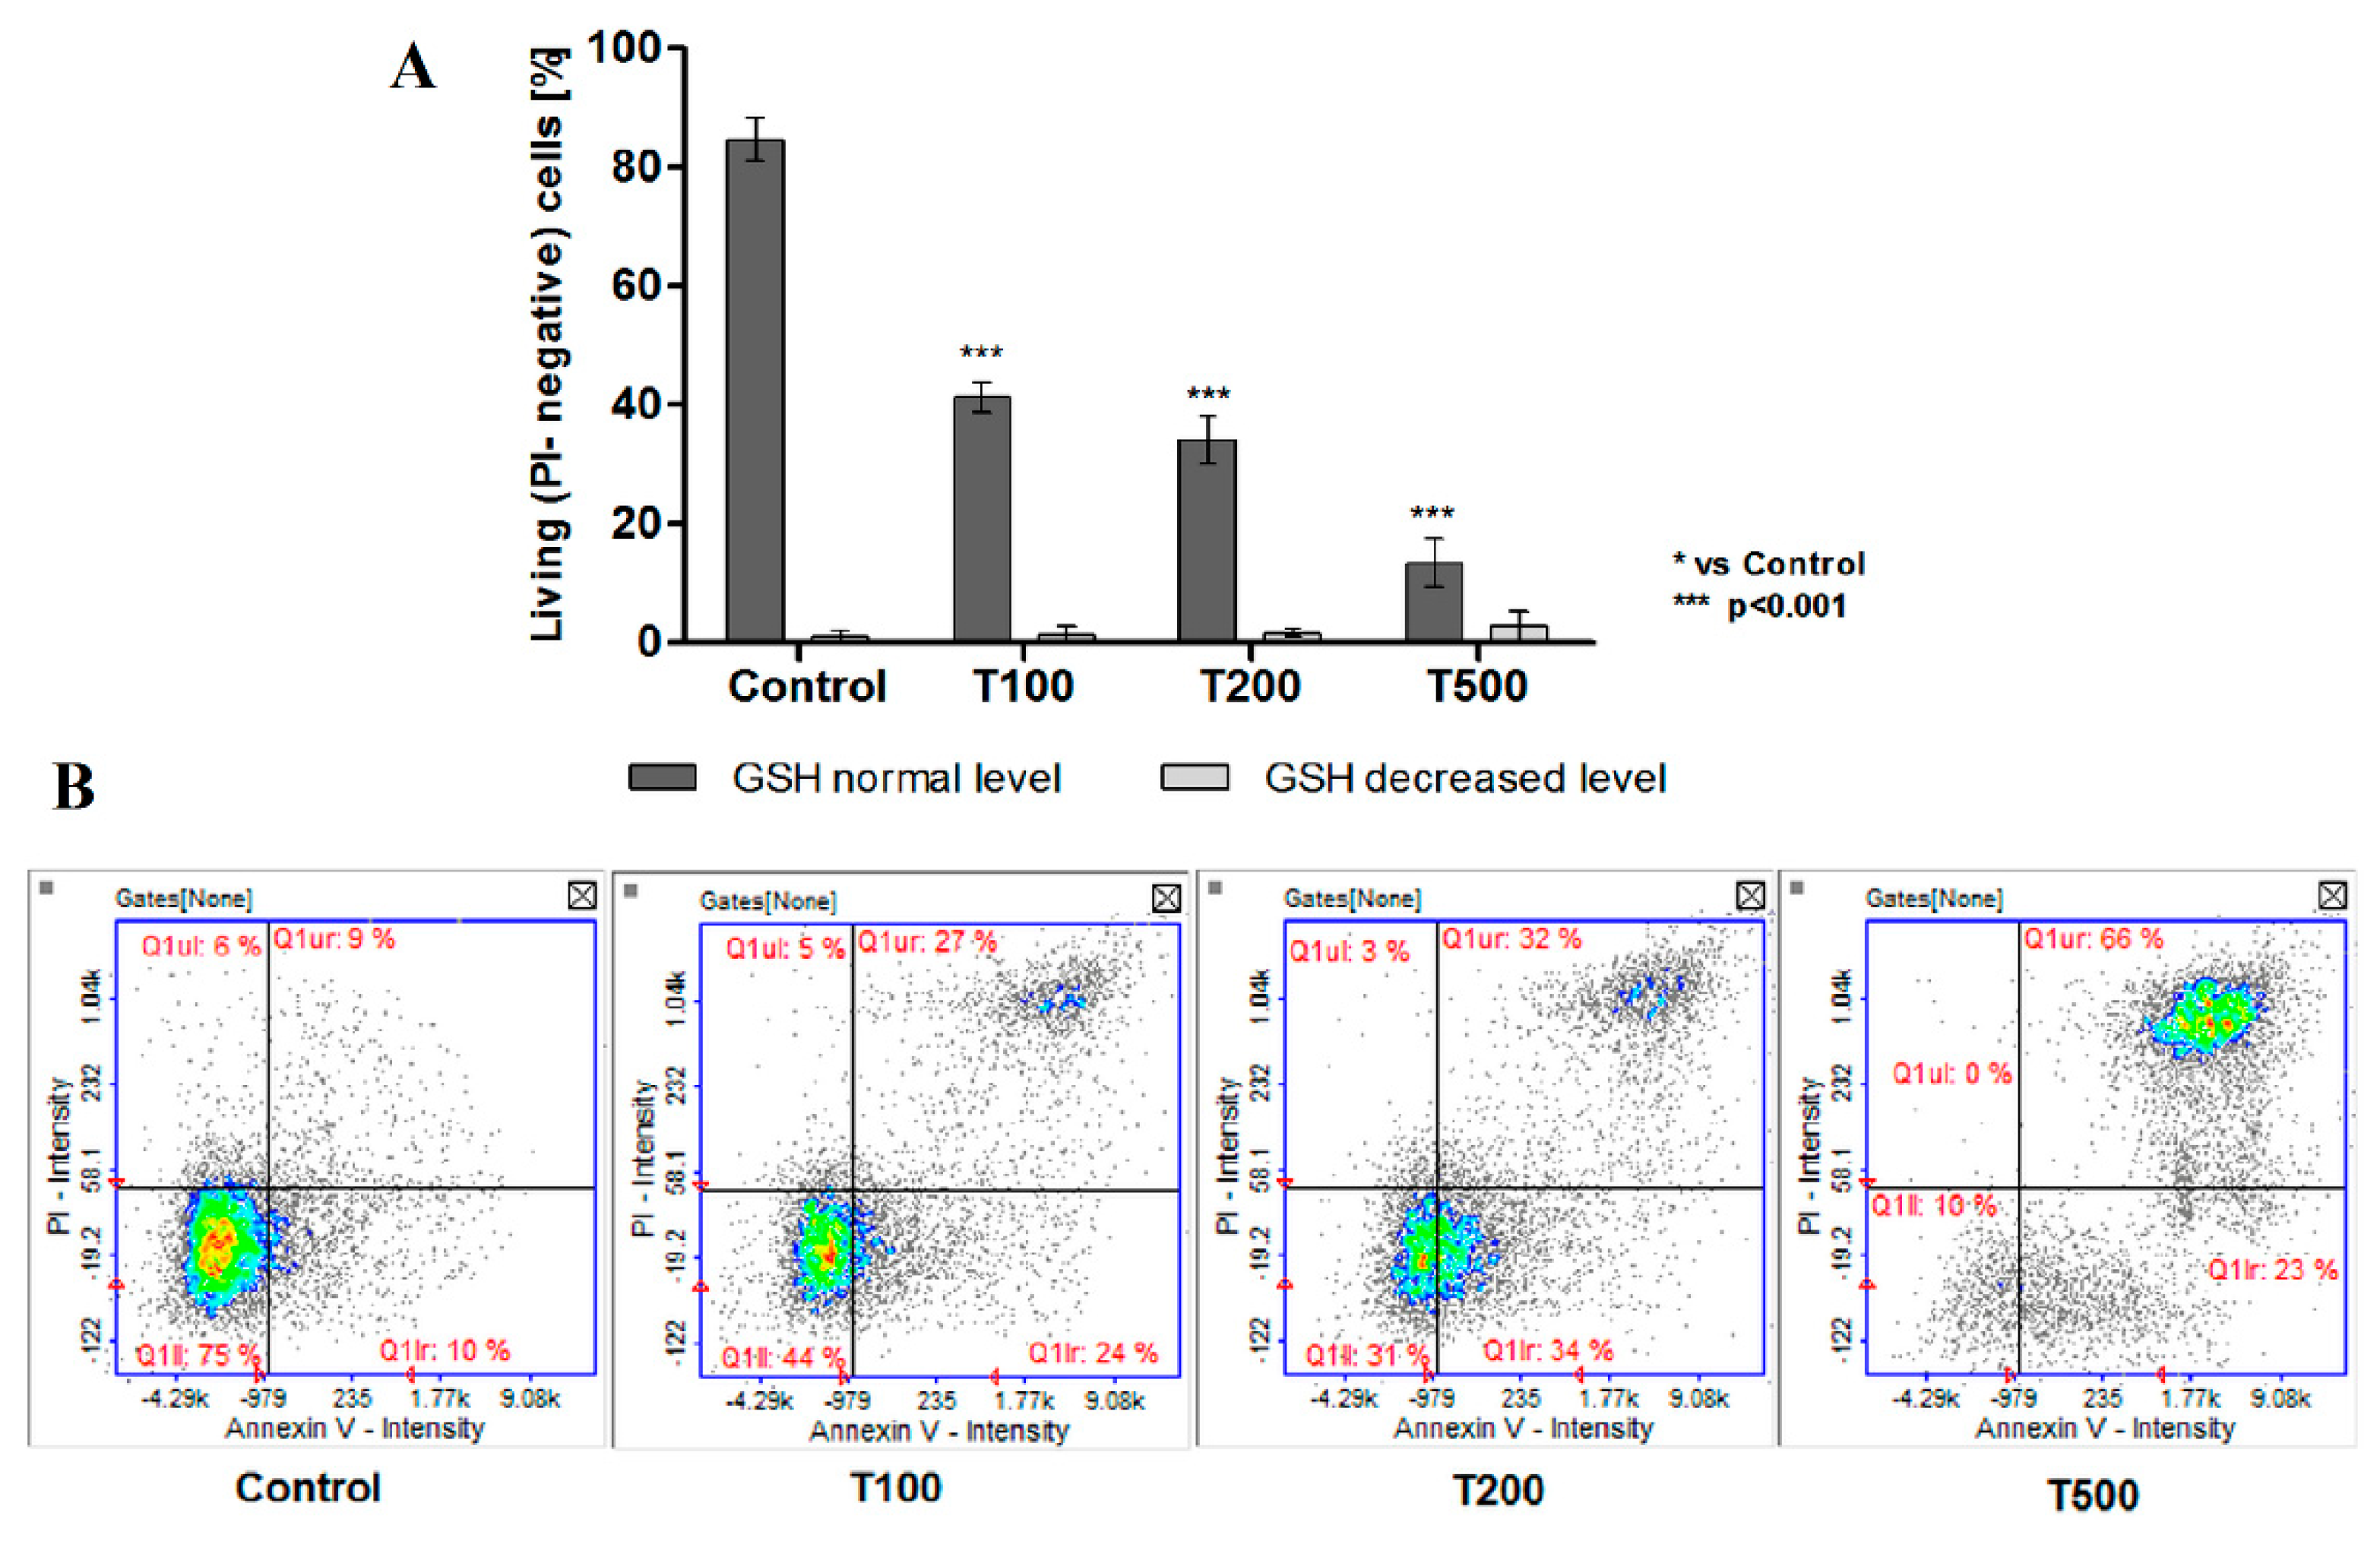
2.4. No Effect of Teriflunomide on the Level of Cellular Thiols
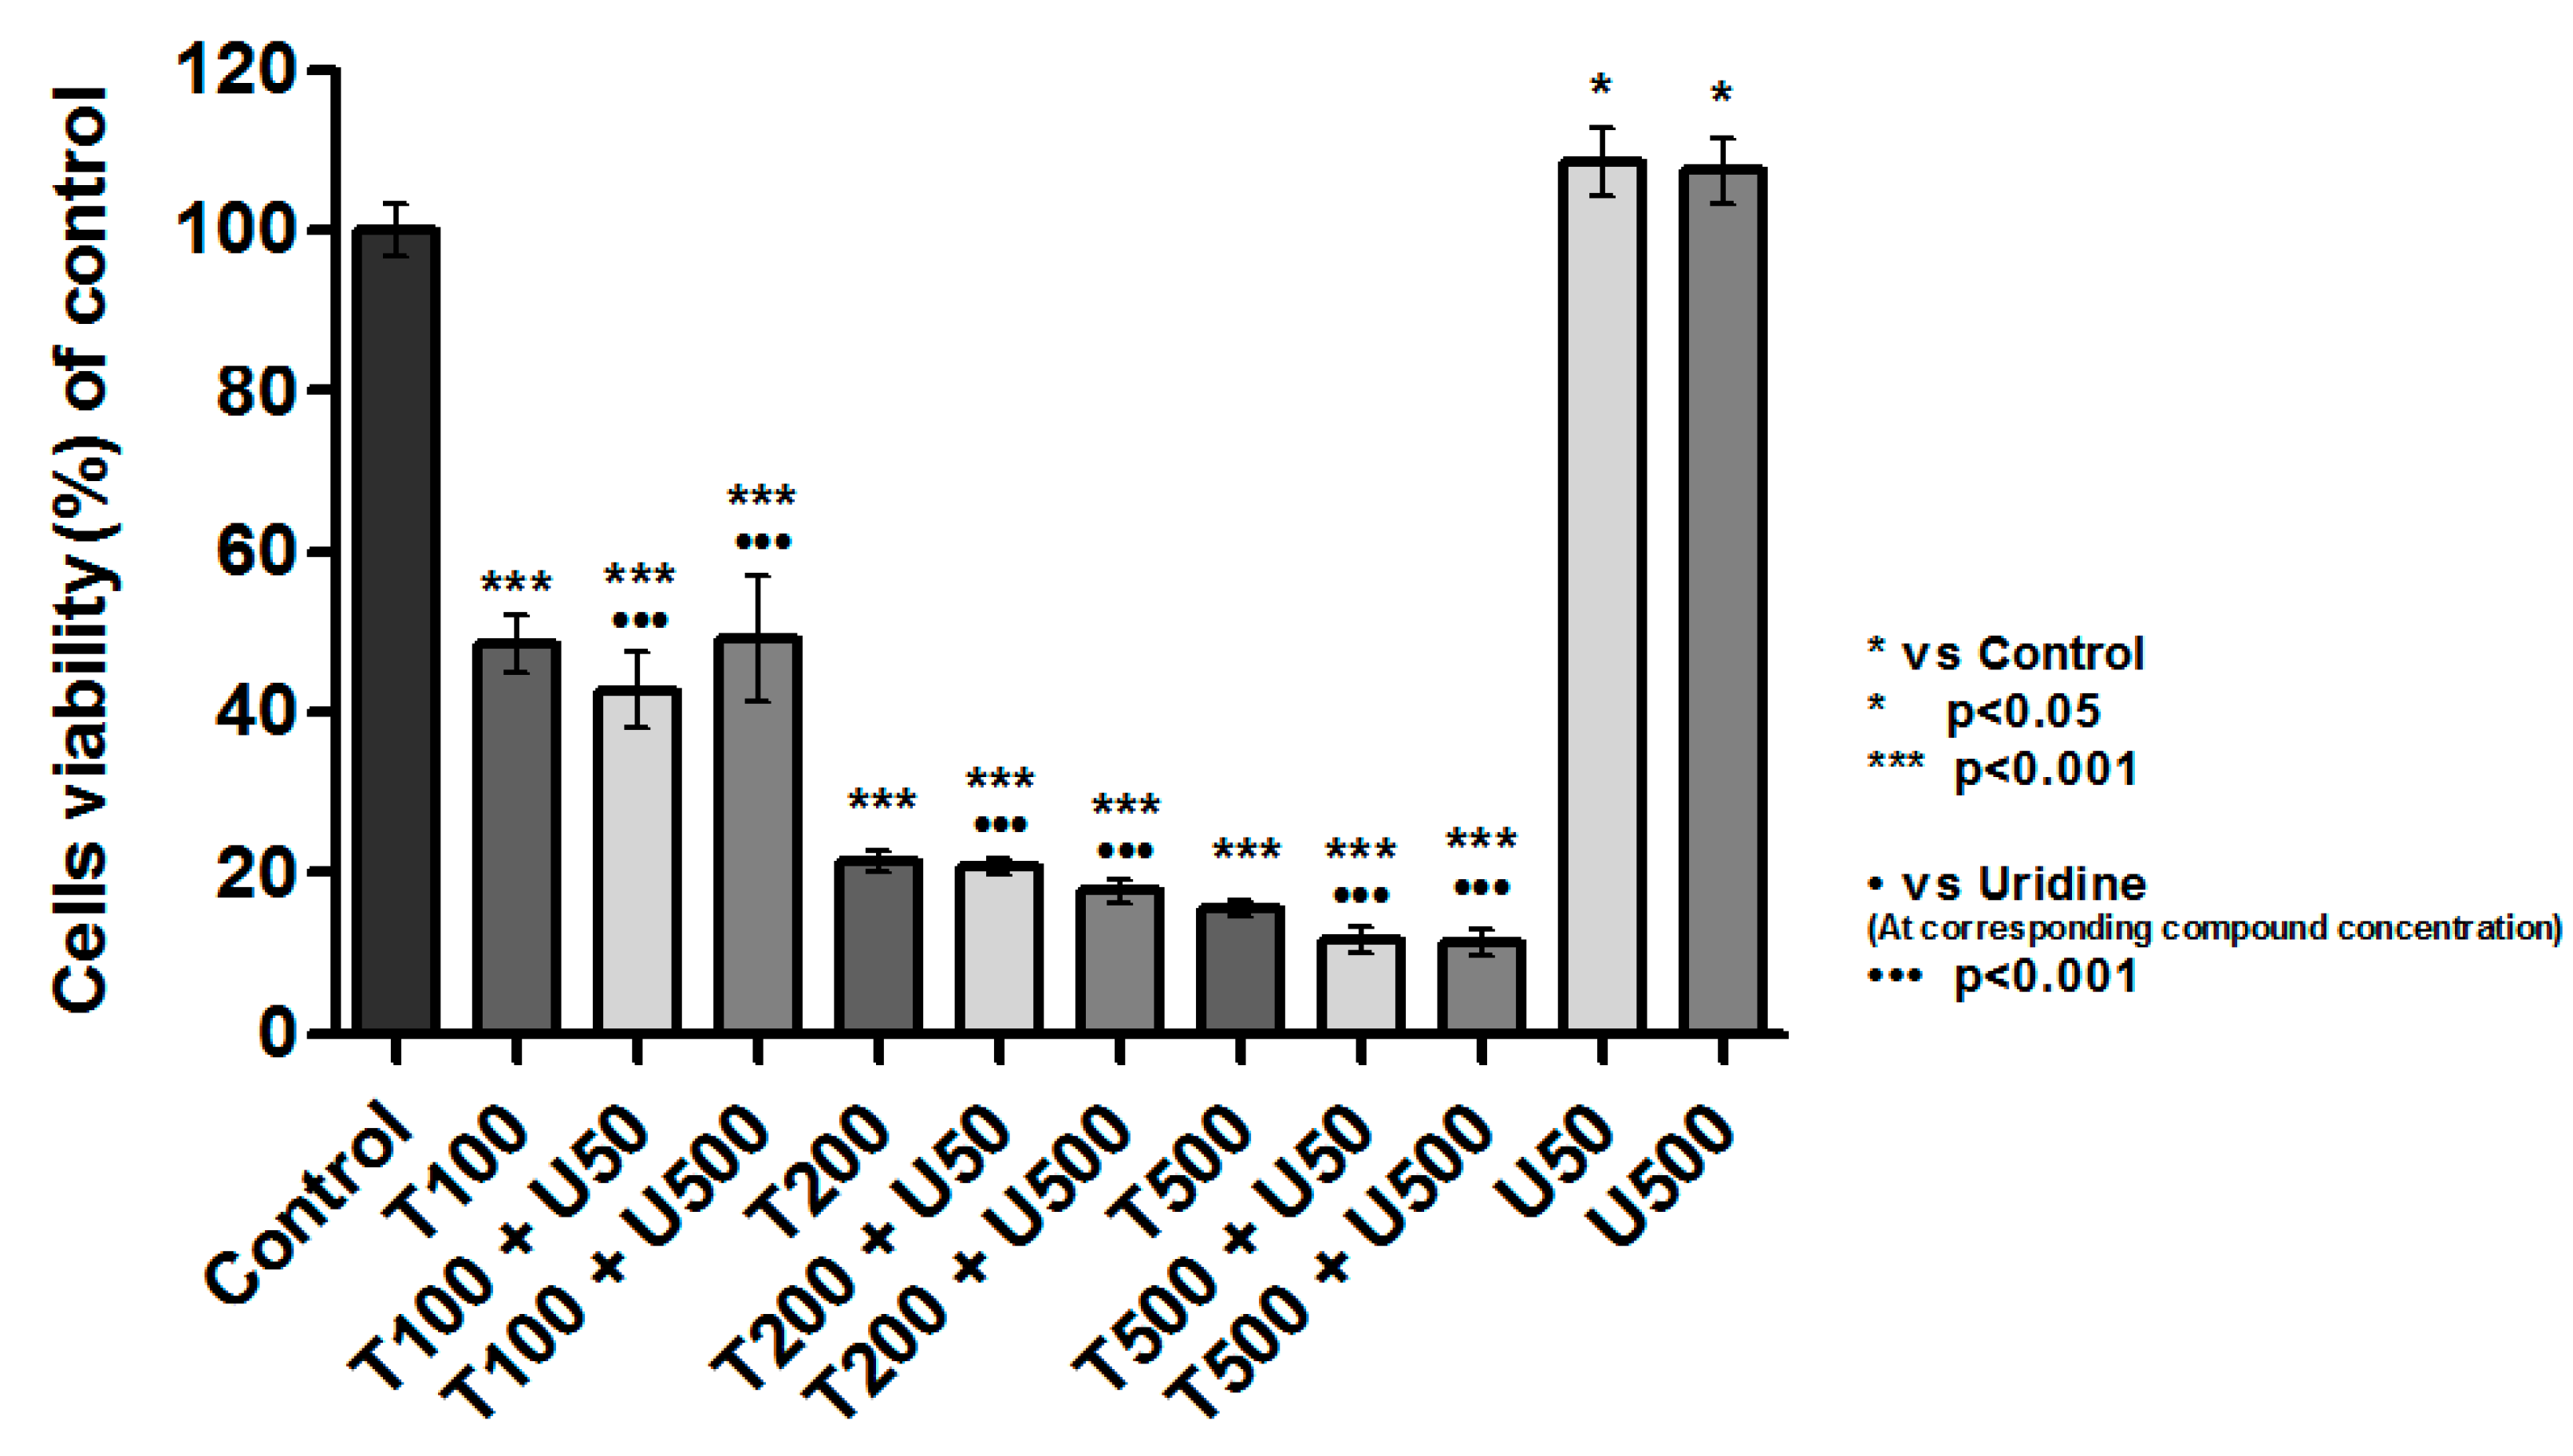
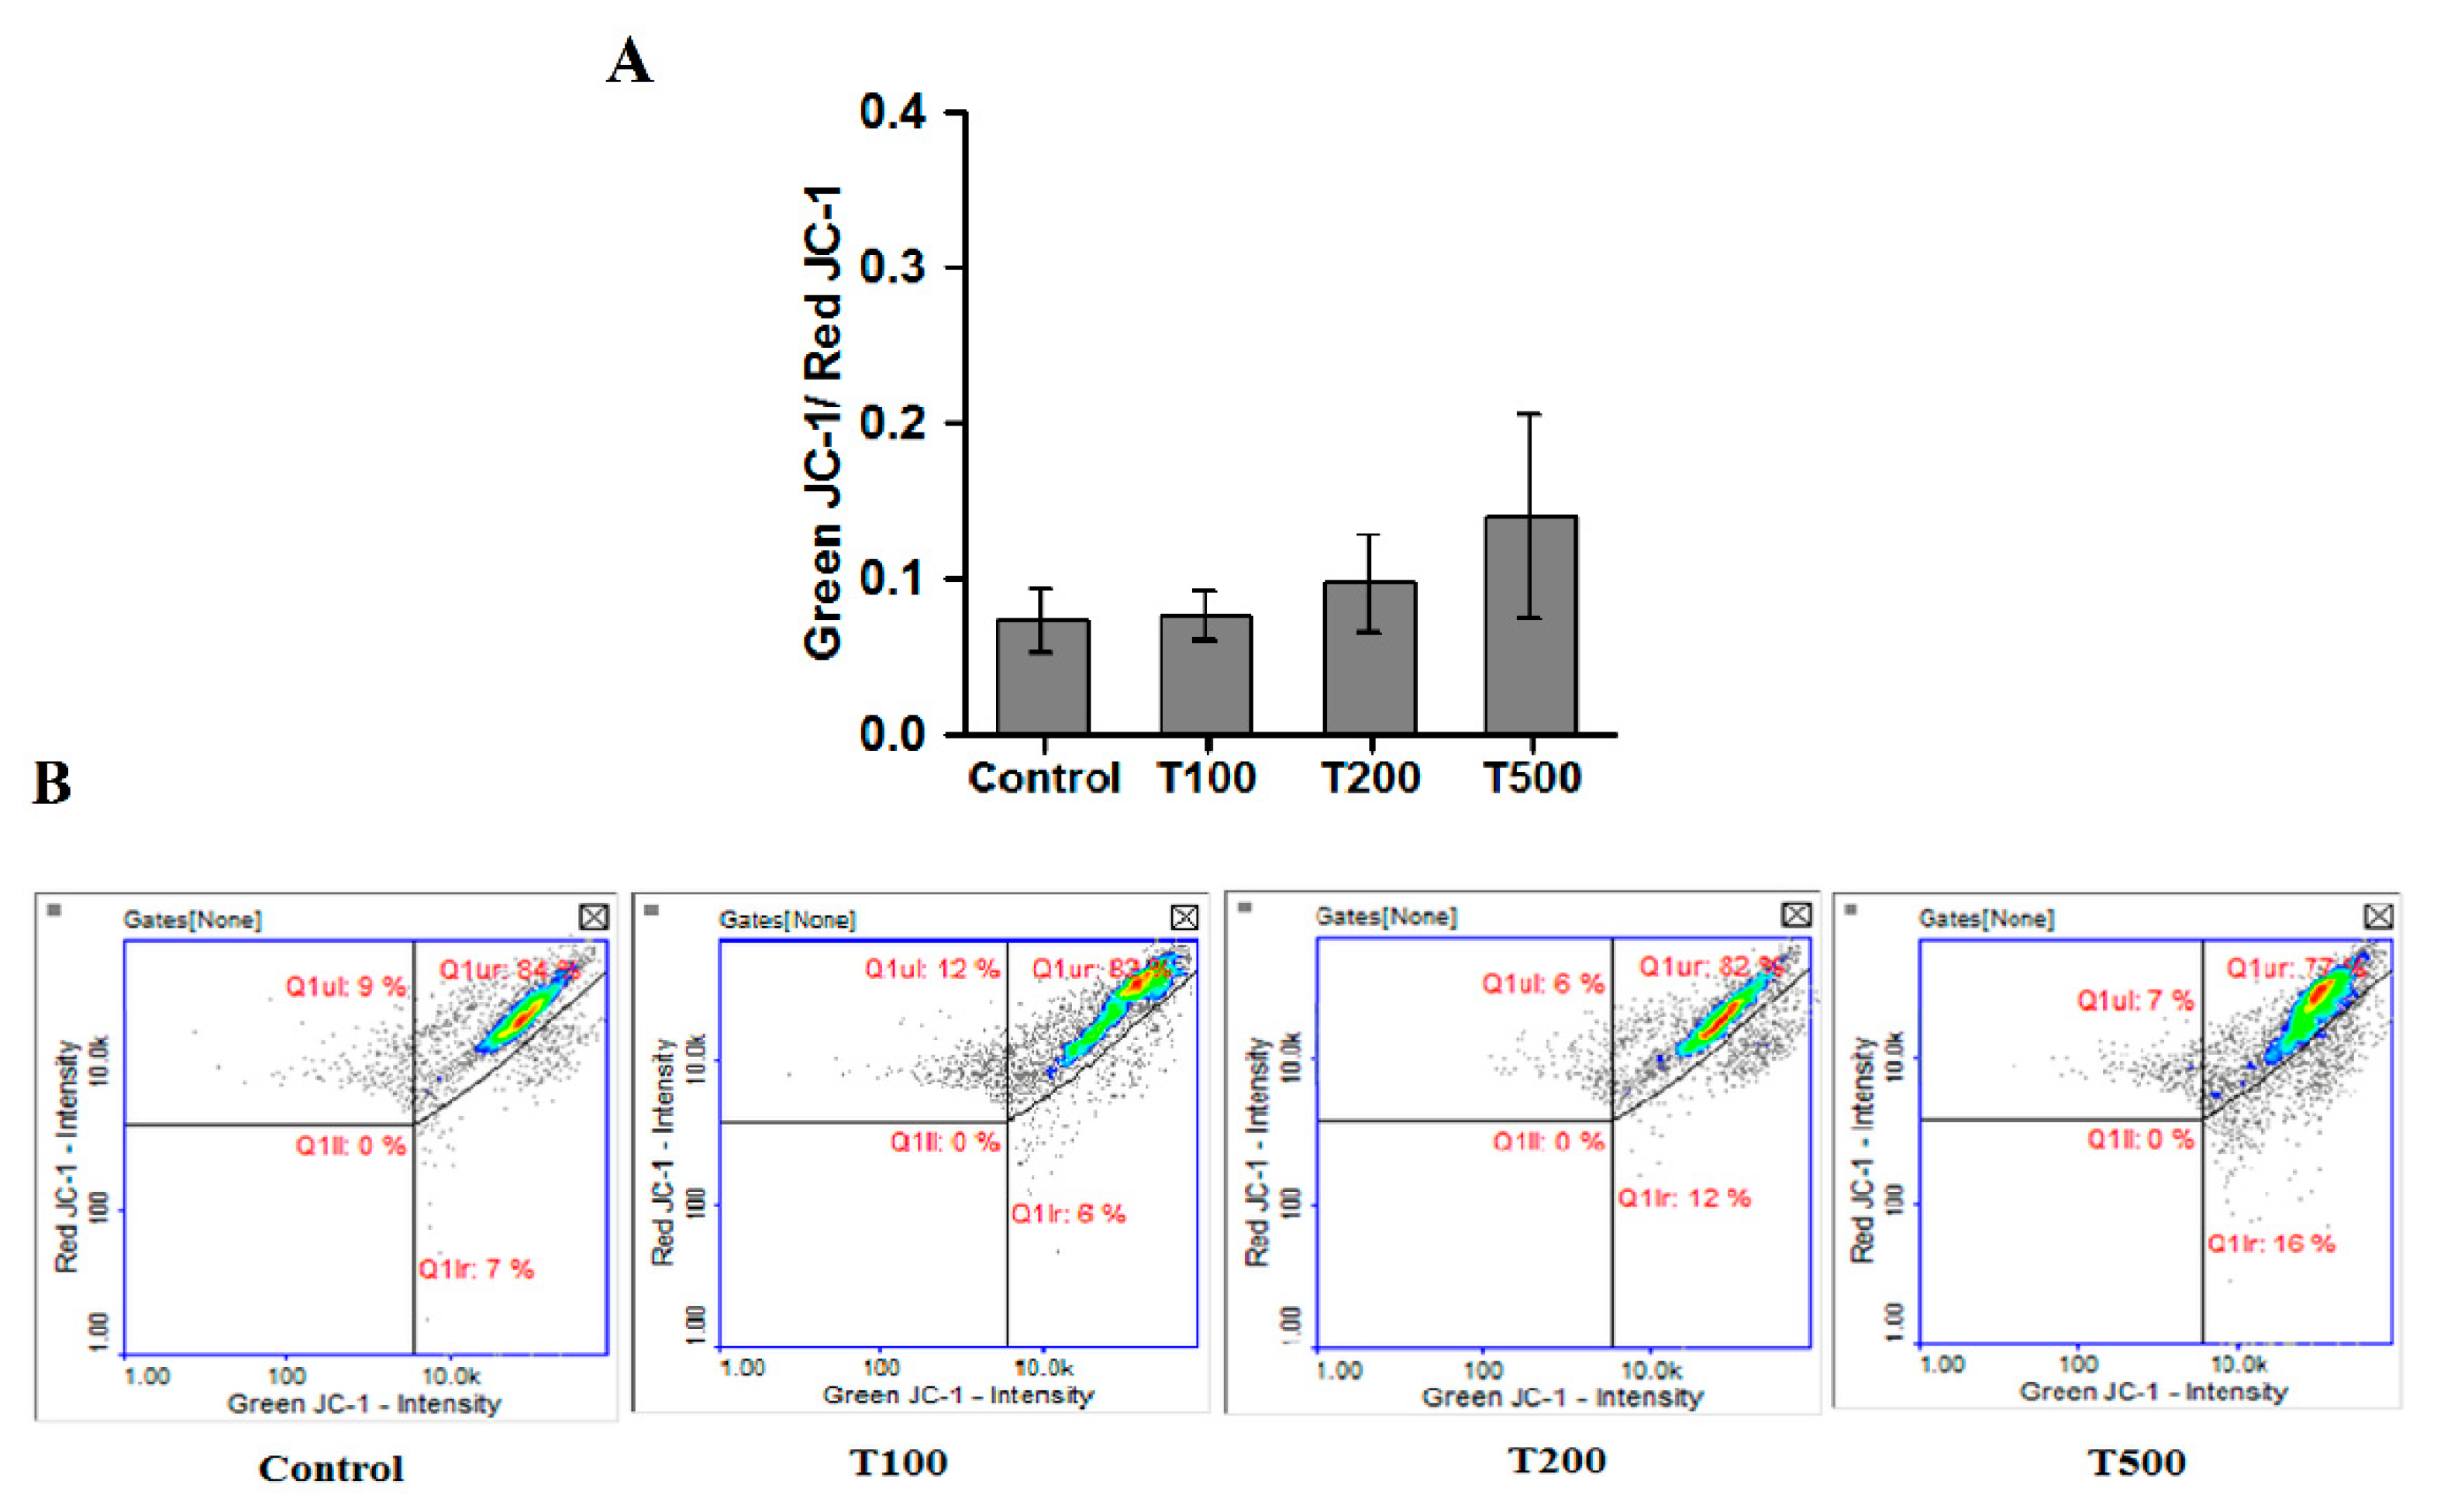
2.5. Teriflunomide-Induced Mitochondria—Independent Apoptosis in RPMI 8226 Cells
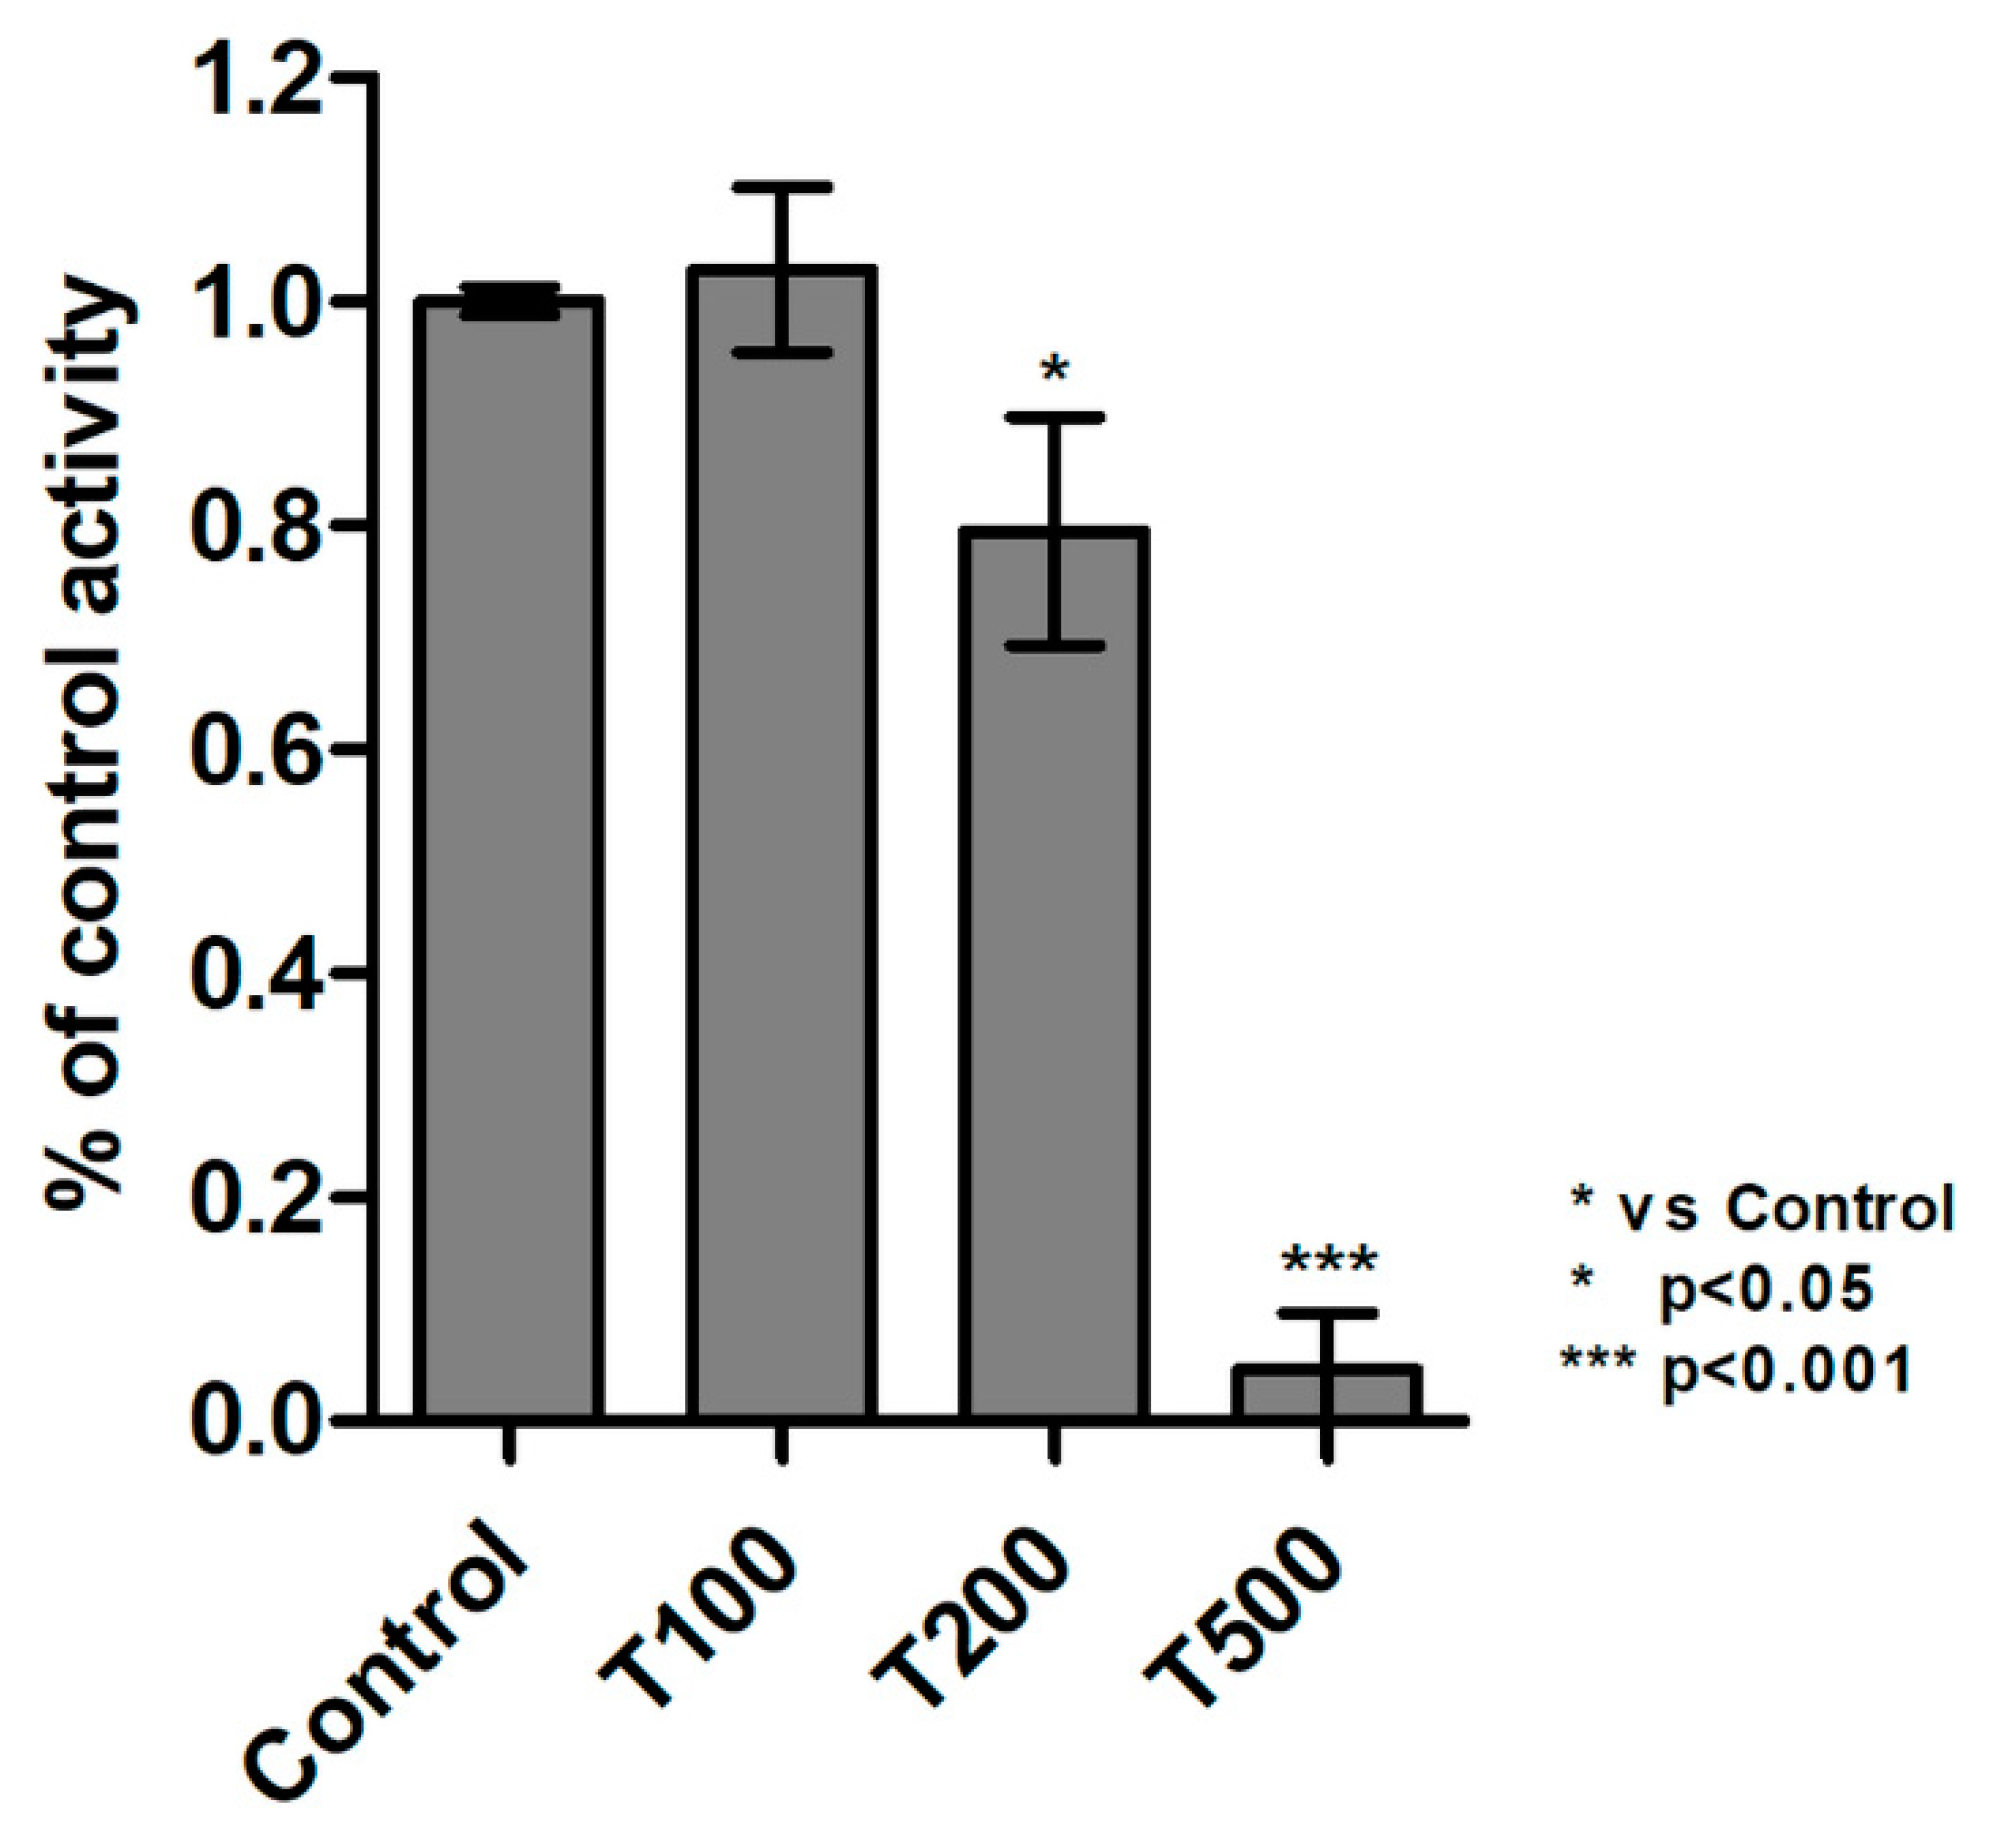
2.6. Teriflunomide Inhibited Activity of Protein Tyrosine Kinases
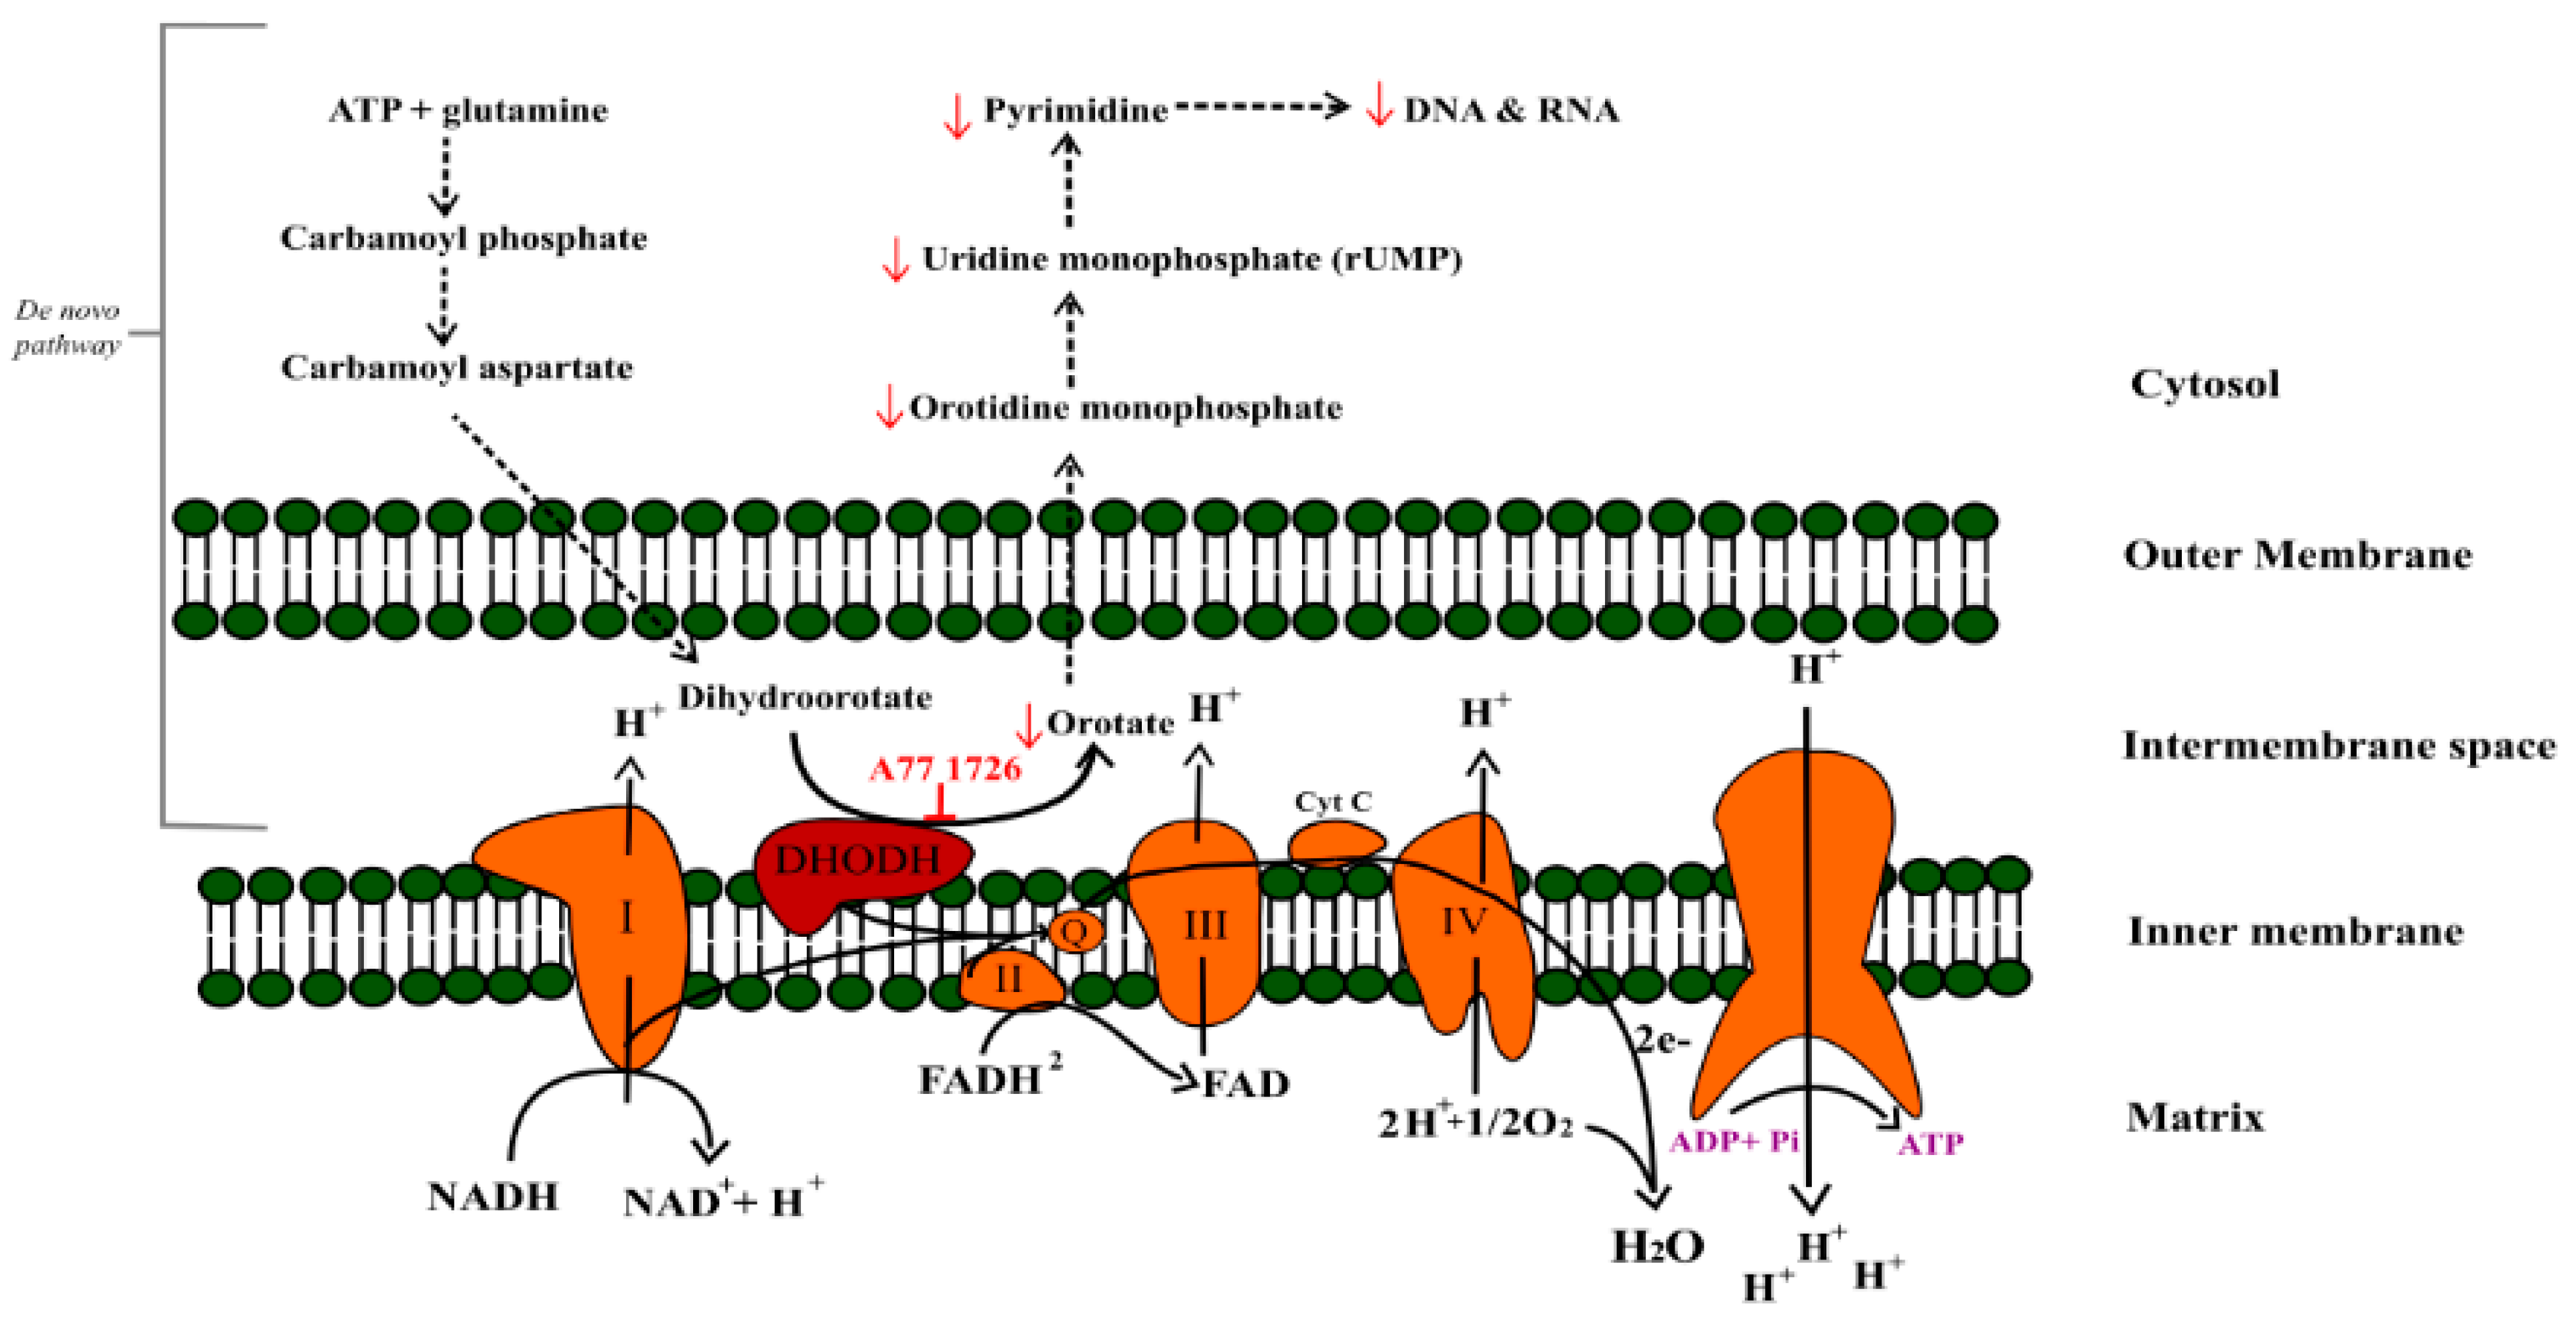
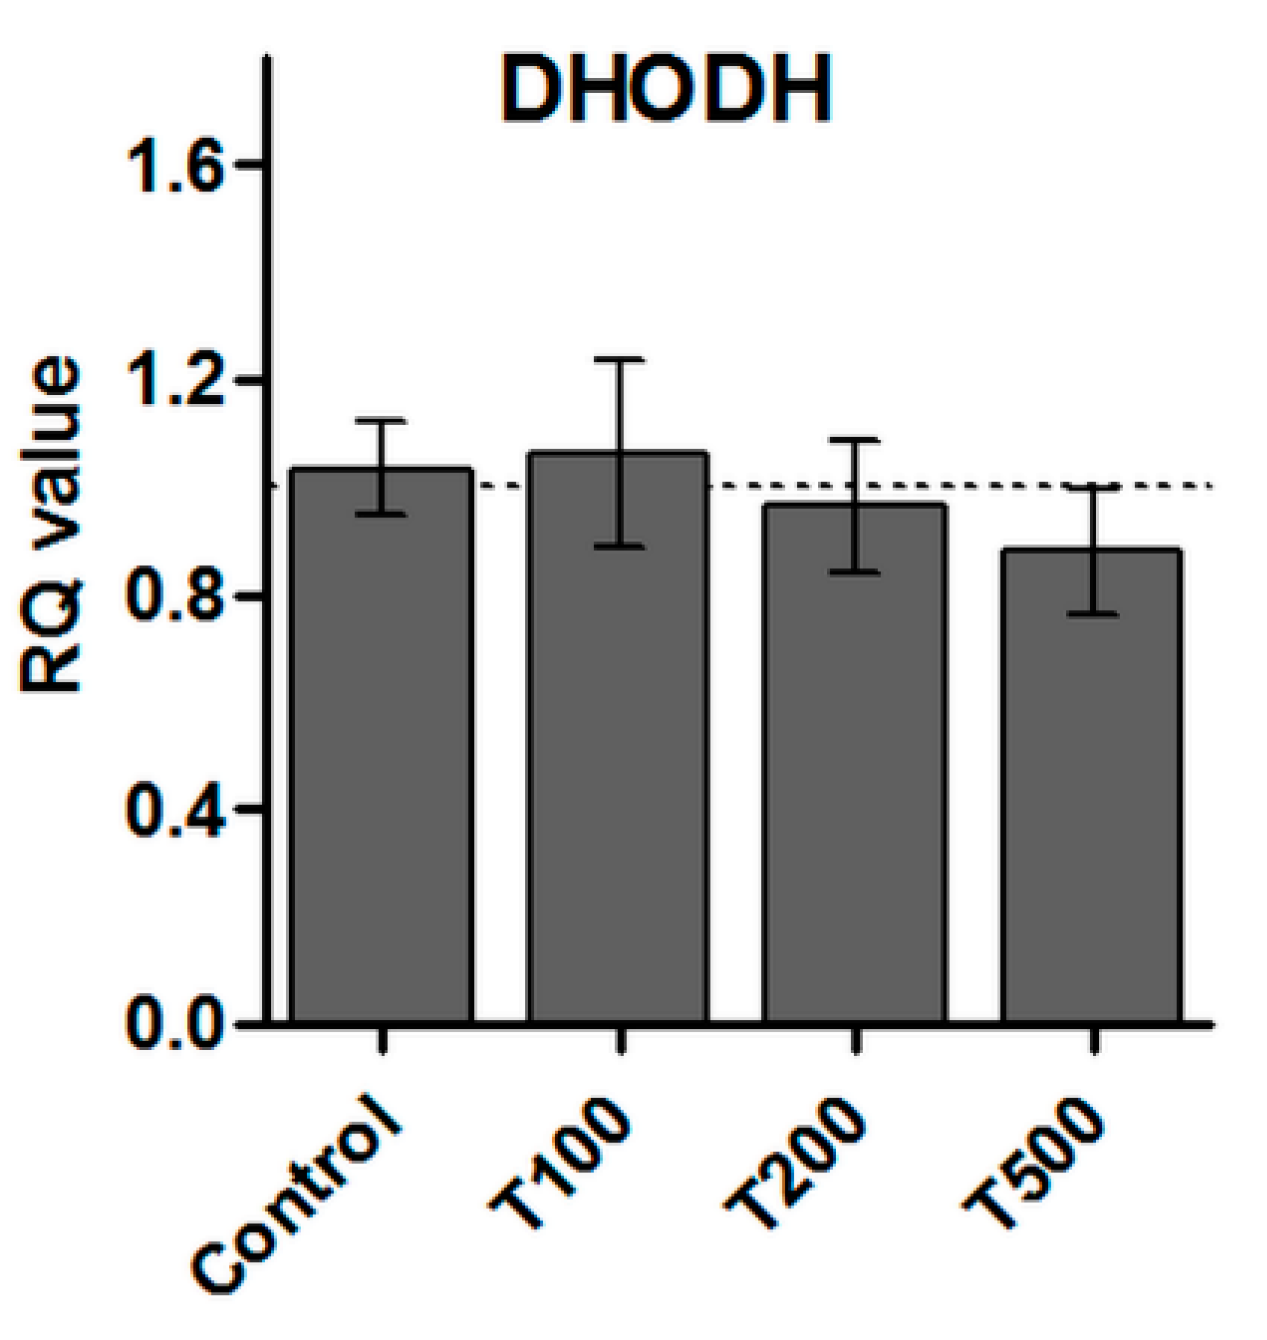
2.7. No Effect of Teriflunomide on the DHODH Gene Expression
2.8. Accumulation of Teriflunomide in RPMI 8226 Cells
3. Discussion
4. Materials and Methods
4.1. Cell Culture and Treatment
4.2. Cytotoxicity Evaluation
4.3. Analysis of Cell Cycle
4.4. Apoptosis Detection
4.5. The Research of Oxidative Stress by the Level of Cellular Thiols
4.6. Analysis of the Mitochondrial Membrane Potential
4.7. Activity of Protein Tyrosine Kinases
4.8. Quantitative Real-Time PCR Analysis (qRT-PCR)
4.9. Statistical Analysis
4.10. HPLC Analysis
4.10.1. Reagents and Chemicals
4.10.2. Chromatographic Conditions
4.10.3. Standard Solution Preparation
4.10.4. Sample Preparation
5. Conclusions
Supplementary Materials
Author Contributions
Funding
Data Availability Statement
Conflicts of Interest
Sample Availability
References
- Li, E.K.; Tam, L.S.; Tomlinson, B. Leflunomide in the treatment of rheumatoid arthritis. Clin. Ther. 2004, 26, 447–459. [Google Scholar] [CrossRef]
- Gossec, L.; Smolen, J.S.; Gaujoux-Viala, C.; Ash, Z.; Marzo-Ortega, H.; van der Heijde, D.; FitzGerald, O.; Aletaha, D.; Balint, P.; Boumpas, D.; et al. European League Against Rheumatism recommendations for the management of psoriatic arthritis with pharmacological therapies. Ann. Rheum. Dis. 2012, 71, 4–12. [Google Scholar] [CrossRef]
- Hopkins, A.M.; Wiese, M.D.; Proudman, S.M.; O’Doherty, C.E.; Foster, D.; Upton, R.N. Semiphysiologically Based Pharmacokinetic Model of Leflunomide Disposition in Rheumatoid Arthritis Patients. CPT Pharmacomet. Syst. Pharmacol. 2015, 4, 362–371. [Google Scholar] [CrossRef] [Green Version]
- Breedveld, F.C.; Dayer, J.M. Leflunomide: Mode of action in the treatment of rheumatoid arthritis. Ann. Rheum. Dis. 2000, 59, 841–849. [Google Scholar] [CrossRef]
- Fox, R.I.; Herrmann, M.L.; Frangou, C.G.; Wahl, G.M.; Morris, R.E.; Strand, V.; Kirschbaum, B.J. Mechanism of action for leflunomide in rheumatoid arthritis. Clin. Immunol. 1999, 3, 198–208. [Google Scholar] [CrossRef]
- Xu, X.; Shen, J.; Mall, J.W.; Myers, J.A.; Huang, W.; Blinder, L.; Saclarides, T.J.; Williams, J.W.; Chong, A.S. In vitro and in vivo antitumor activity of a novel immunomodulatory drug, leflunomide: Mechanisms of action. Biochem. Pharmacol. 1999, 58, 1405–1413. [Google Scholar] [CrossRef]
- Xuan, J.; Ren, Z.; Qing, T.; Couch, L.; Shi, L.; Tolleson, W.H.; Guo, L. Mitochondrial dysfunction induced by leflunomide and its active metabolite. Toxicology 2018, 396, 33–45. [Google Scholar] [CrossRef] [PubMed] [Green Version]
- Zhou, Y.; Tao, L.; Zhou, X.; Zuo, Z.; Gong, J.; Liu, X.; Zhou, Y.; Liu, C.; Sang, N.; Liu, H.; et al. DHODH and cancer: Promising prospects to be explored. Cancer Metab. 2021, 9, 22. [Google Scholar] [CrossRef]
- Hail, N.; Chen, P.; Kepa, J.J.; Bushman, L.R.; Shearn, C. Dihydroorotate dehydrogenase is required for N-(4-hydroxyphenyl)retinamide-induced reactive oxygen species production and apoptosis. Free Radic. Biol. Med. 2010, 49, 109–116. [Google Scholar] [CrossRef] [PubMed] [Green Version]
- Mohamad Fairus, A.K.; Choudhary, B.; Hosahalli, S.; Kavitha, N.; Shatrah, O. Dihydroorotate dehydrogenase (DHODH) inhibitors affect ATP depletion, endogenous ROS and mediate S-phase arrest in breast cancer cells. Biochimie 2017, 135, 154–163. [Google Scholar] [CrossRef]
- González-Alvaro, I.; Ortiz, A.M.; Domínguez-Jiménez, C.; Aragón-Bodi, A.; Díaz Sánchez, B.; Sánchez-Madrid, F. Inhibition of tumour necrosis factor and IL-17 production by leflunomide involves the JAK/STAT pathway. Ann. Rheum. Dis. 2009, 68, 1644–1650. [Google Scholar] [CrossRef] [Green Version]
- Wang, J.; Sun, J.; Hu, J.; Wang, C.; Prinz, R.A.; Peng, D.; Liu, X.; Xu, X. A77 1726, the active metabolite of the anti-rheumatoid arthritis drug leflunomide, inhibits influenza A virus replication in vitro and in vivo by inhibiting the activity of Janus kinases. FASEB J. 2020, 34, 10132–10145. [Google Scholar] [CrossRef] [PubMed]
- Cheng, L.; Wang, H.; Wang, Z.; Huang, H.; Zhuo, D.; Lin, J. Leflunomide Inhibits Proliferation and Induces Apoptosis via Suppressing Autophagy and PI3K/Akt Signaling Pathway in Human Bladder Cancer Cells. Drug Des. Dev. Ther. 2020, 14, 1897–1908. [Google Scholar] [CrossRef] [PubMed]
- Ren, A.; Fu, G.; Qiu, Y.; Cui, H. Leflunomide inhibits proliferation and tumorigenesis of oral squamous cell carcinoma. Mol. Med. Rep. 2017, 16, 9125–9130. [Google Scholar] [CrossRef] [PubMed] [Green Version]
- White, R.M.; Cech, J.; Ratanasirintrawoot, S.; Lin, C.Y.; Rahl, P.B.; Burke, C.J.; Langdon, E.; Tomlinson, M.L.; Mosher, J.; Kaufman, C. DHODH modulates transcriptional elongation in the neural crest and melanoma. Nature 2011, 471, 518–522. [Google Scholar] [CrossRef] [Green Version]
- Dietrich, S.; Krämer, O.H.; Hahn, E.; Schäfer, C.; Giese, T.; Hess, M.; Tretter, T.; Rieger, M.; Hüllein, J.; Zenz, T.; et al. Leflunomide induces apoptosis in fludarabine-resistant and clinically refractory CLL cells. Clin. Cancer Res. 2012, 18, 417–431. [Google Scholar] [CrossRef] [PubMed] [Green Version]
- Ringshausen, I.; Oelsner, M.; Bogner, C.; Peschel, C.; Decker, T. The immunomodulatory drug Leflunomide inhibits cell cycle progression of B-CLL cells. Leukemia 2008, 22, 635–638. [Google Scholar] [CrossRef] [PubMed] [Green Version]
- Alhefdhi, A.; Burke, J.F.; Redlich, A.; Kunnimalaiyaan, M.; Chen, H. Leflunomide suppresses growth in human medullary thyroid cancer cells. J. Surg. Res. 2013, 185, 212–216. [Google Scholar] [CrossRef] [Green Version]
- Rosenzweig, M.; Palmer, J.; Tsai, N.C.; Synold, T.; Wu, X.; Tao, S.; Hammond, S.N.; Buettner, R.; Duarte, L.; Htut, M.; et al. Repurposing leflunomide for relapsed/refractory multiple myeloma: A phase 1 study. Leuk. Lymphoma 2020, 7, 1669–1677. [Google Scholar] [CrossRef]
- Firth, J. Haematology: Multiple myeloma. Clin. Med. 2019, 19, 58–60. [Google Scholar]
- Luengo, A.; Gui, D.Y.; Heiden, M.G.V. Targeting Metabolism for Cancer Therapy. Cell Chem. Biol. 2017, 24, 1161–1180. [Google Scholar] [CrossRef] [Green Version]
- Robinson, A.D.; Eich, M.L.; Varambally, S. Dysregulation of de novo nucleotide biosynthetic pathway enzymes in cancer and targeting opportunities. Cancer Lett. 2020, 470, 134–140. [Google Scholar] [CrossRef] [PubMed]
- Baumann, P.; Mandl-Weber, S.; Völkl, A.; Adam, C.; Bumeder, I.; Oduncu, F.; Schmidmaier, R. Dihydroorotate dehydrogenase inhibitor A771726 (leflunomide) induces apoptosis and diminishes proliferation of multiple myeloma cells. Mol. Cancer Ther. 2009, 8, 366–375. [Google Scholar] [CrossRef] [PubMed] [Green Version]
- Hail, N., Jr.; Chen, P.; Bushman, L.R. Teriflunomide (leflunomide) promotes cytostatic, antioxidant, and apoptotic effects in transformed prostate epithelial cells: Evidence supporting a role for teriflunomide in prostate cancer chemoprevention. Neoplasia 2010, 12, 464–475. [Google Scholar] [CrossRef] [PubMed] [Green Version]
- Li, L.; Liu, J.; Delohery, T.; Zhang, D.; Arendt, C.; Jones, C. The effects of teriflunomide on lymphocyte subpopulations in human peripheral blood mononuclear cells. J. Neuroimmunol. 2013, 265, 82–90. [Google Scholar] [CrossRef]
- Sawamukai, N.; Saito, K.; Yamaoka, K.; Nakayamada, S.; Ra, C.; Tanaka, Y. Leflunomide inhibits PDK1/Akt pathway and induces apoptosis of human mast cells. J. Immunol. 2007, 179, 6479–6484. [Google Scholar] [CrossRef] [PubMed] [Green Version]
- Xu, X.; Williams, J.W.; Gong, H.; Finnegan, A.; Chong, A.S. Two activities of the immunosuppressive metabolite of leflunomide, A77 1726. Inhibition of pyrimidine nucleotide synthesis and protein tyrosine phosphorylation. Biochem. Pharmacol. 1996, 52, 526–534. [Google Scholar] [CrossRef]
- Arnould, S.; Rodier, G.; Matar, G.; Vincent, C.; Pirot, N.; Delorme, Y.; Berthet, C.; Buscail, Y.; Noël, J.Y.; Lachambre, S.; et al. Checkpoint kinase 1 inhibition sensitises transformed cells to dihydroorotate dehydrogenase inhibition. Oncotarget 2017, 8, 95206–95222. [Google Scholar] [CrossRef] [Green Version]
- Wang, C.; Youle, R.J. The role of mitochondria in apoptosis. Annu. Rev. Genet. 2009, 43, 95–118. [Google Scholar] [CrossRef] [Green Version]
- Giorgi, C.; Baldassari, F.; Bononi, A.; Bonora, M.; De Marchi, E.; Marchi, S.; Missiroli, S.; Patergnani, S.; Rimessi, A.; Suski, J.M.; et al. Mitochondrial Ca(2+) and apoptosis. Cell Calcium 2012, 52, 36–43. [Google Scholar] [CrossRef] [Green Version]
- Circu, M.L.; Aw, T.Y. Reactive oxygen species, cellular redox systems, and apoptosis. Free Radic. Biol. Med. 2010, 48, 749–762. [Google Scholar] [CrossRef] [Green Version]
- Redza-Dutordoir, M.; Averill-Bates, D.A. Activation of apoptosis signalling pathways by reactive oxygen species. Biochim. Biophys. Acta 2016, 1863, 2977–2992. [Google Scholar] [CrossRef]
- Fang, J.; Uchiumi, T.; Yagi, M.; Matsumoto, S.; Amamoto, R.; Takazaki, S.; Yamaza, H.; Nonaka, K.; Kang, D. Dihydroorotate dehydrogenase is physically associated with the respiratory complex and its loss leads to mitochondrial dysfunction. Biosci. Rep. 2013, 33, e00021. [Google Scholar] [CrossRef] [PubMed]
- Shrestha, A.K.; Menon, R.T.; Shivanna, B. Leflunomide attenuates oxidative stress in fetal human lung endothelial cells via superoxide dismutase 2 and catalase. Biochem. Biophys. Res. Commun. 2018, 503, 2009–2014. [Google Scholar] [CrossRef]
- Malla, B.; Cotton, S.; Ulshoefer, R.; Paul, F.; Hauser, A.E.; Niesner, R.; Bros, H.; Infante-Duarte, C. Teriflunomide preserves peripheral nerve mitochondria from oxidative stress-mediated alterations. Ther. Adv. Chronic Dis. 2020, 11, 2040622320944773. [Google Scholar] [CrossRef] [PubMed]
- Paul, M.K.; Mukhopadhyay, A.K. Tyrosine kinase—Role and significance in Cancer. Int. J. Med. Sci. 2004, 1, 101–115. [Google Scholar] [CrossRef] [PubMed] [Green Version]
- Xu, X.; Williams, J.W.; Bremer, E.G.; Finnegan, A.; Chong, A.S. Inhibition of protein tyrosine phosphorylation in T cells by a novel immunosuppressive agent, leflunomide. J. Biol. Chem. 1995, 270, 12398–12403. [Google Scholar] [CrossRef] [Green Version]
- Shawver, L.K.; Schwartz, D.P.; Mann, E.; Chen, H.; Tsai, J.; Chu, L.; Taylorson, L.; Longhi, M.; Meredith, S.; Germain, L.; et al. Inhibition of platelet-derived growth factor-mediated signal transduction and tumor growth by N-[4-(trifluoromethyl)-phenyl]5-methylisoxazole-4-carboxamide. Clin. Cancer R. 1997, 3, 1167–1177. [Google Scholar]
- Hoskin, D.W.; Taylor, R.M.; Makrigiannis, A.P.; James, H.; Lee, T.D. Dose-dependent enhancing and inhibitory effects of A77 1726 (leflunomide) on cytotoxic T lymphocyte induction. Int. J. Immunopharmacol. 1998, 20, 505–513. [Google Scholar] [CrossRef]
- Manna, S.K.; Aggarwal, B.B. Immunosuppressive Leflunomide Metabolite (A77 1726) Blocks TNF-Dependent Nuclear Factor-kB Activation and Gene Expression. J. Immunol. 1999, 162, 2095–2102. [Google Scholar] [PubMed]
- Manna, S.K.; Mukhopadhyay, A.; Aggarwal, B.B. Leflunomide suppresses TNF-induced cellular responses: Effects on NF-kappa B, activator protein-1, c-Jun N-terminal protein kinase, and apoptosis. J. Immunol. 2000, 165, 5962–5969. [Google Scholar] [CrossRef] [Green Version]
- Mattar, T.; Kochhar, K.; Bartlett, R.; Bremer, E.G.; Finnegan, A. Inhibition of the epidermal growth factor receptor tyrosine kinase activity by leflunomide. FEBS Lett. 1993, 334, 161–164. [Google Scholar] [CrossRef] [Green Version]
- Buettner, R.; Morales, C.; Caserta, E.; Troadec, E.; Gunes, E.G.; Viola, D.; Khalife, J.; Li, H.; Keats, J.J.; Christofferson, A.; et al. Leflunomide regulates c-Myc expression in myeloma cells through PIM targeting. Blood Adv. 2019, 3, 1027–1032. [Google Scholar] [CrossRef] [PubMed]
- Chomczynski, P.; Sacchi, N. Single-step method of RNA isolation by acid guanidinium thiocyanate-phenol-chloroform extraction. Anal. Biochem. 1987, 162, 156–159. [Google Scholar] [CrossRef]


| Concentration (µg/mL) | ||||
|---|---|---|---|---|
| RPMI-1640 Culture Medium | Cytoplasm Fraction | Nuclear Fraction | Mitochondrial Fraction | |
| Teriflunomide | 17.157 | 2.104 | 1.975 | peak not detected |
Publisher’s Note: MDPI stays neutral with regard to jurisdictional claims in published maps and institutional affiliations. |
© 2021 by the authors. Licensee MDPI, Basel, Switzerland. This article is an open access article distributed under the terms and conditions of the Creative Commons Attribution (CC BY) license (https://creativecommons.org/licenses/by/4.0/).
Share and Cite
Adamczuk, G.; Humeniuk, E.; Iwan, M.; Natorska-Chomicka, D.; Adamczuk, K.; Korga-Plewko, A. The Mitochondria-Independent Cytotoxic Effect of Leflunomide on RPMI-8226 Multiple Myeloma Cell Line. Molecules 2021, 26, 5653. https://doi.org/10.3390/molecules26185653
Adamczuk G, Humeniuk E, Iwan M, Natorska-Chomicka D, Adamczuk K, Korga-Plewko A. The Mitochondria-Independent Cytotoxic Effect of Leflunomide on RPMI-8226 Multiple Myeloma Cell Line. Molecules. 2021; 26(18):5653. https://doi.org/10.3390/molecules26185653
Chicago/Turabian StyleAdamczuk, Grzegorz, Ewelina Humeniuk, Magdalena Iwan, Dorota Natorska-Chomicka, Kamila Adamczuk, and Agnieszka Korga-Plewko. 2021. "The Mitochondria-Independent Cytotoxic Effect of Leflunomide on RPMI-8226 Multiple Myeloma Cell Line" Molecules 26, no. 18: 5653. https://doi.org/10.3390/molecules26185653