
Three-Dimensional Finite Element Analysis and Characterization of Quasi-Surface Acoustic Wave Resonators


Abstract
:1. Introduction
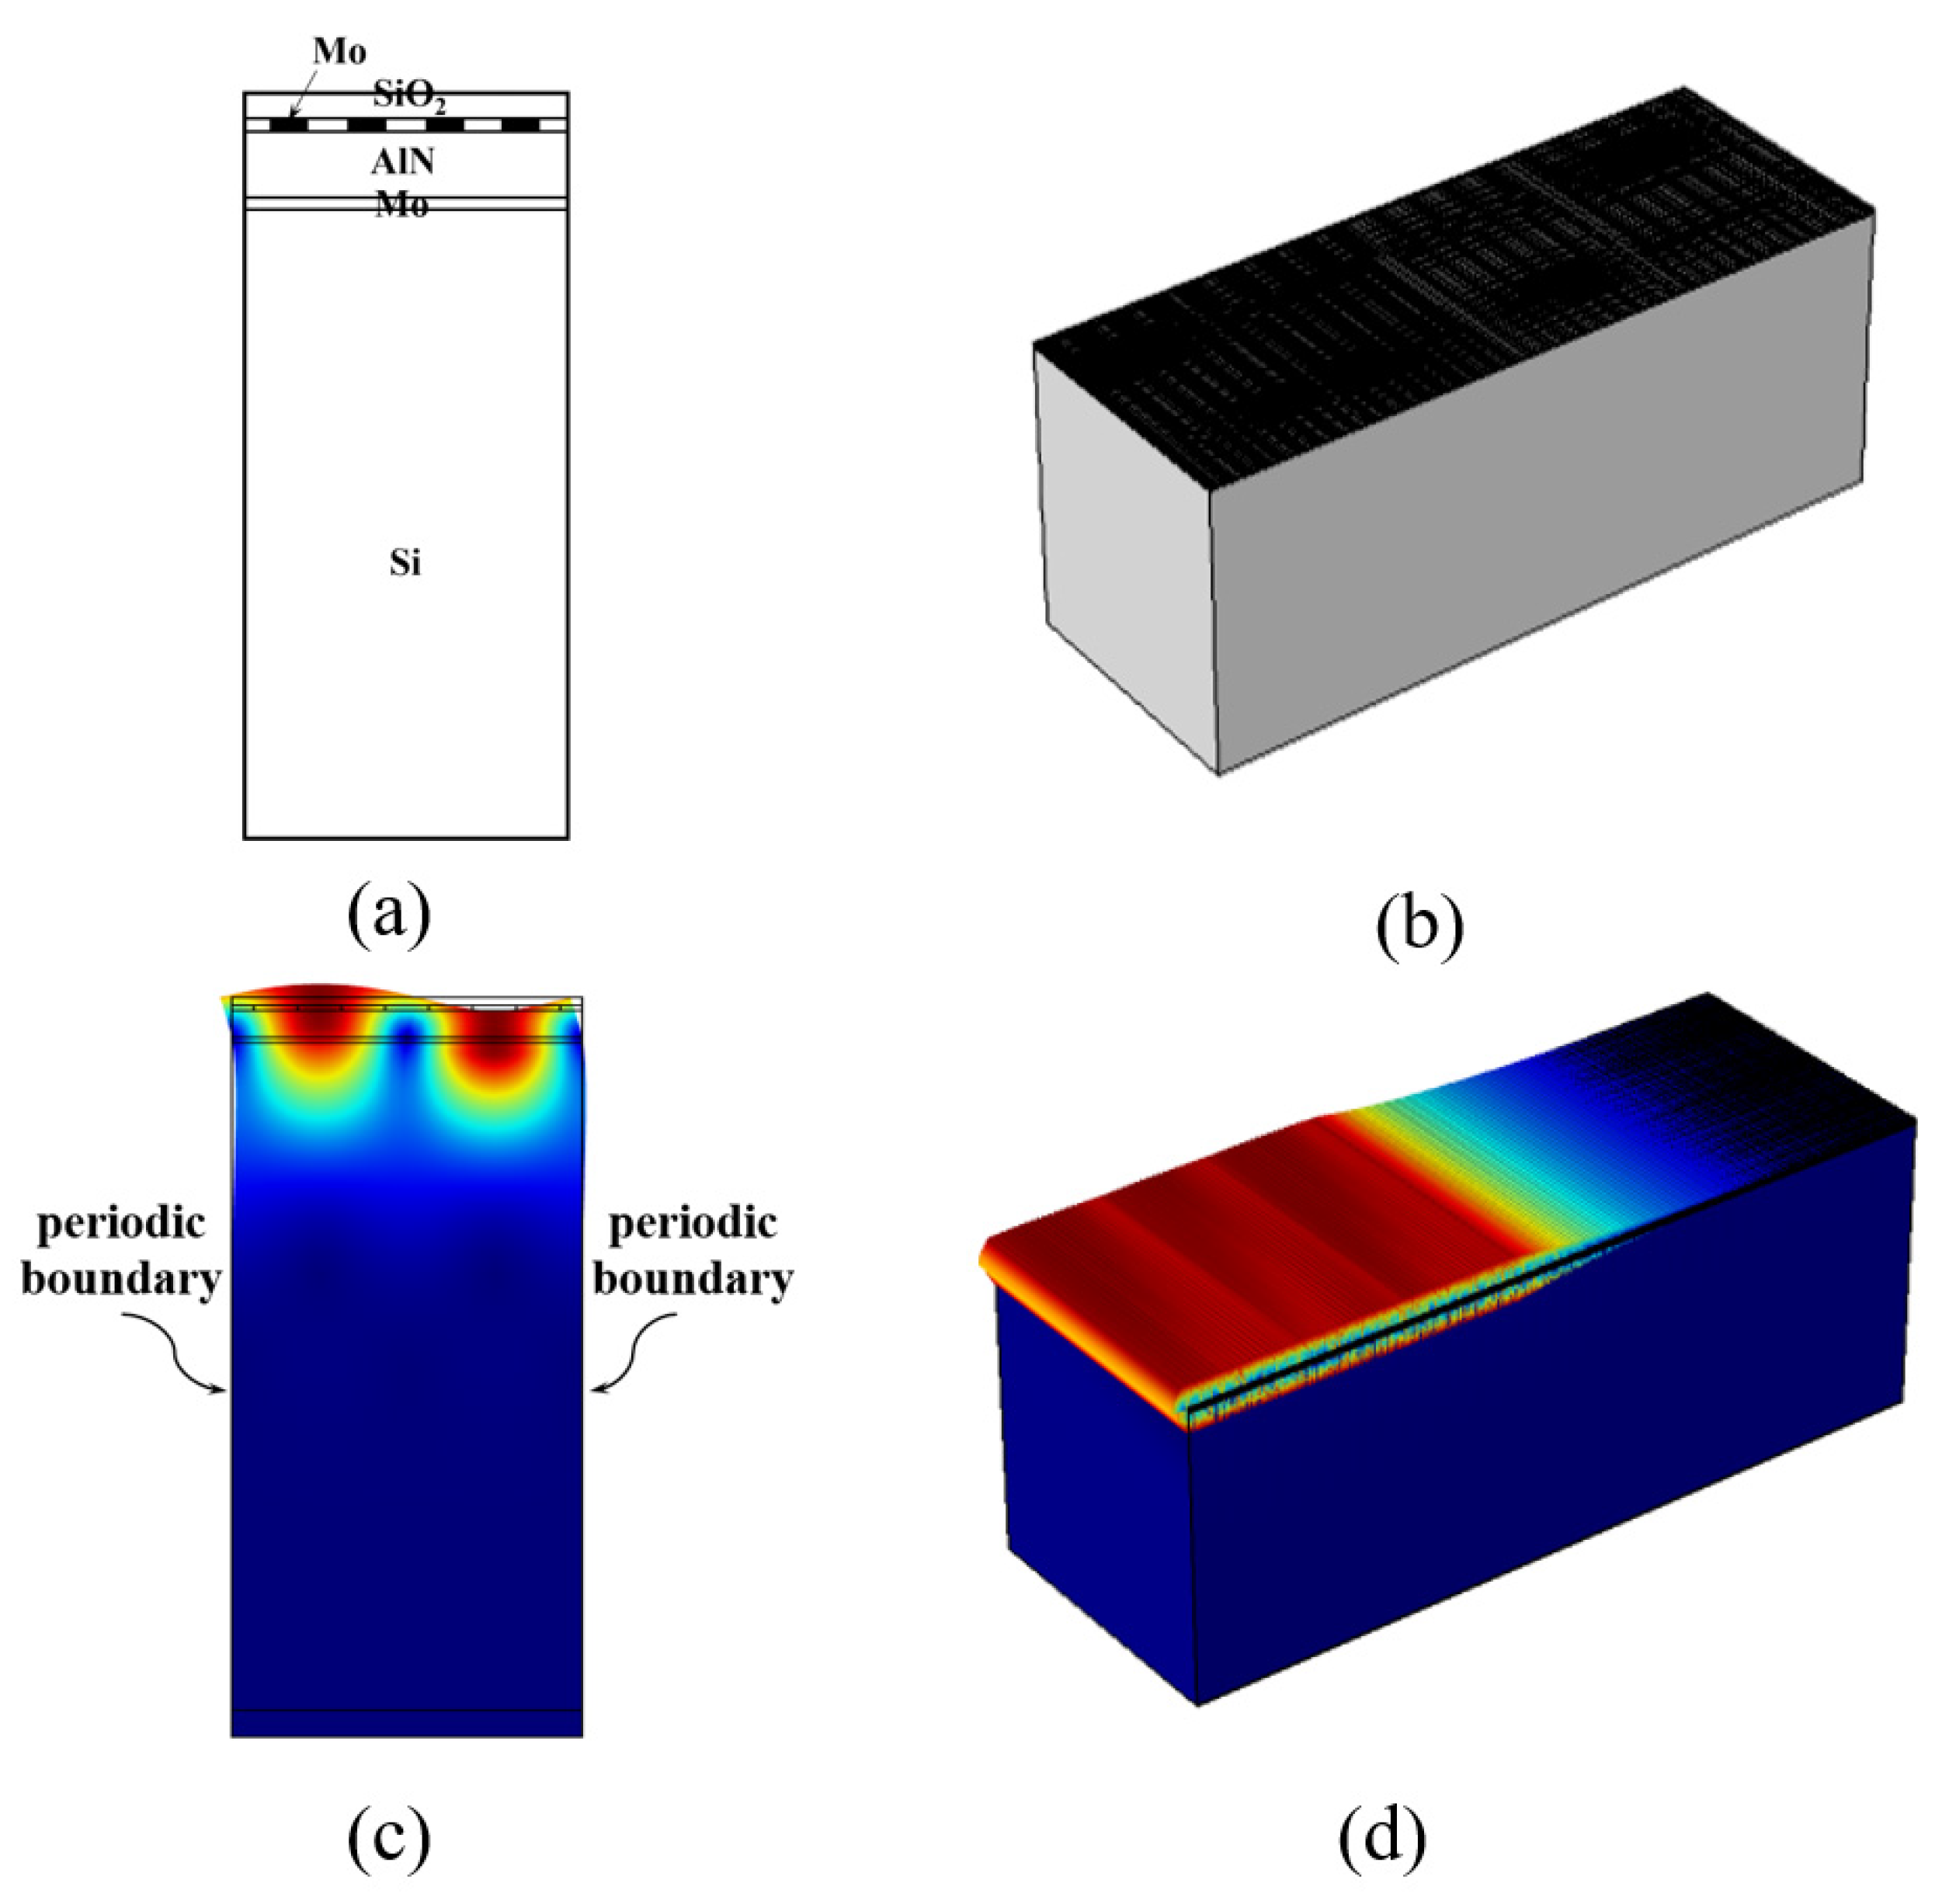
2. Device Design
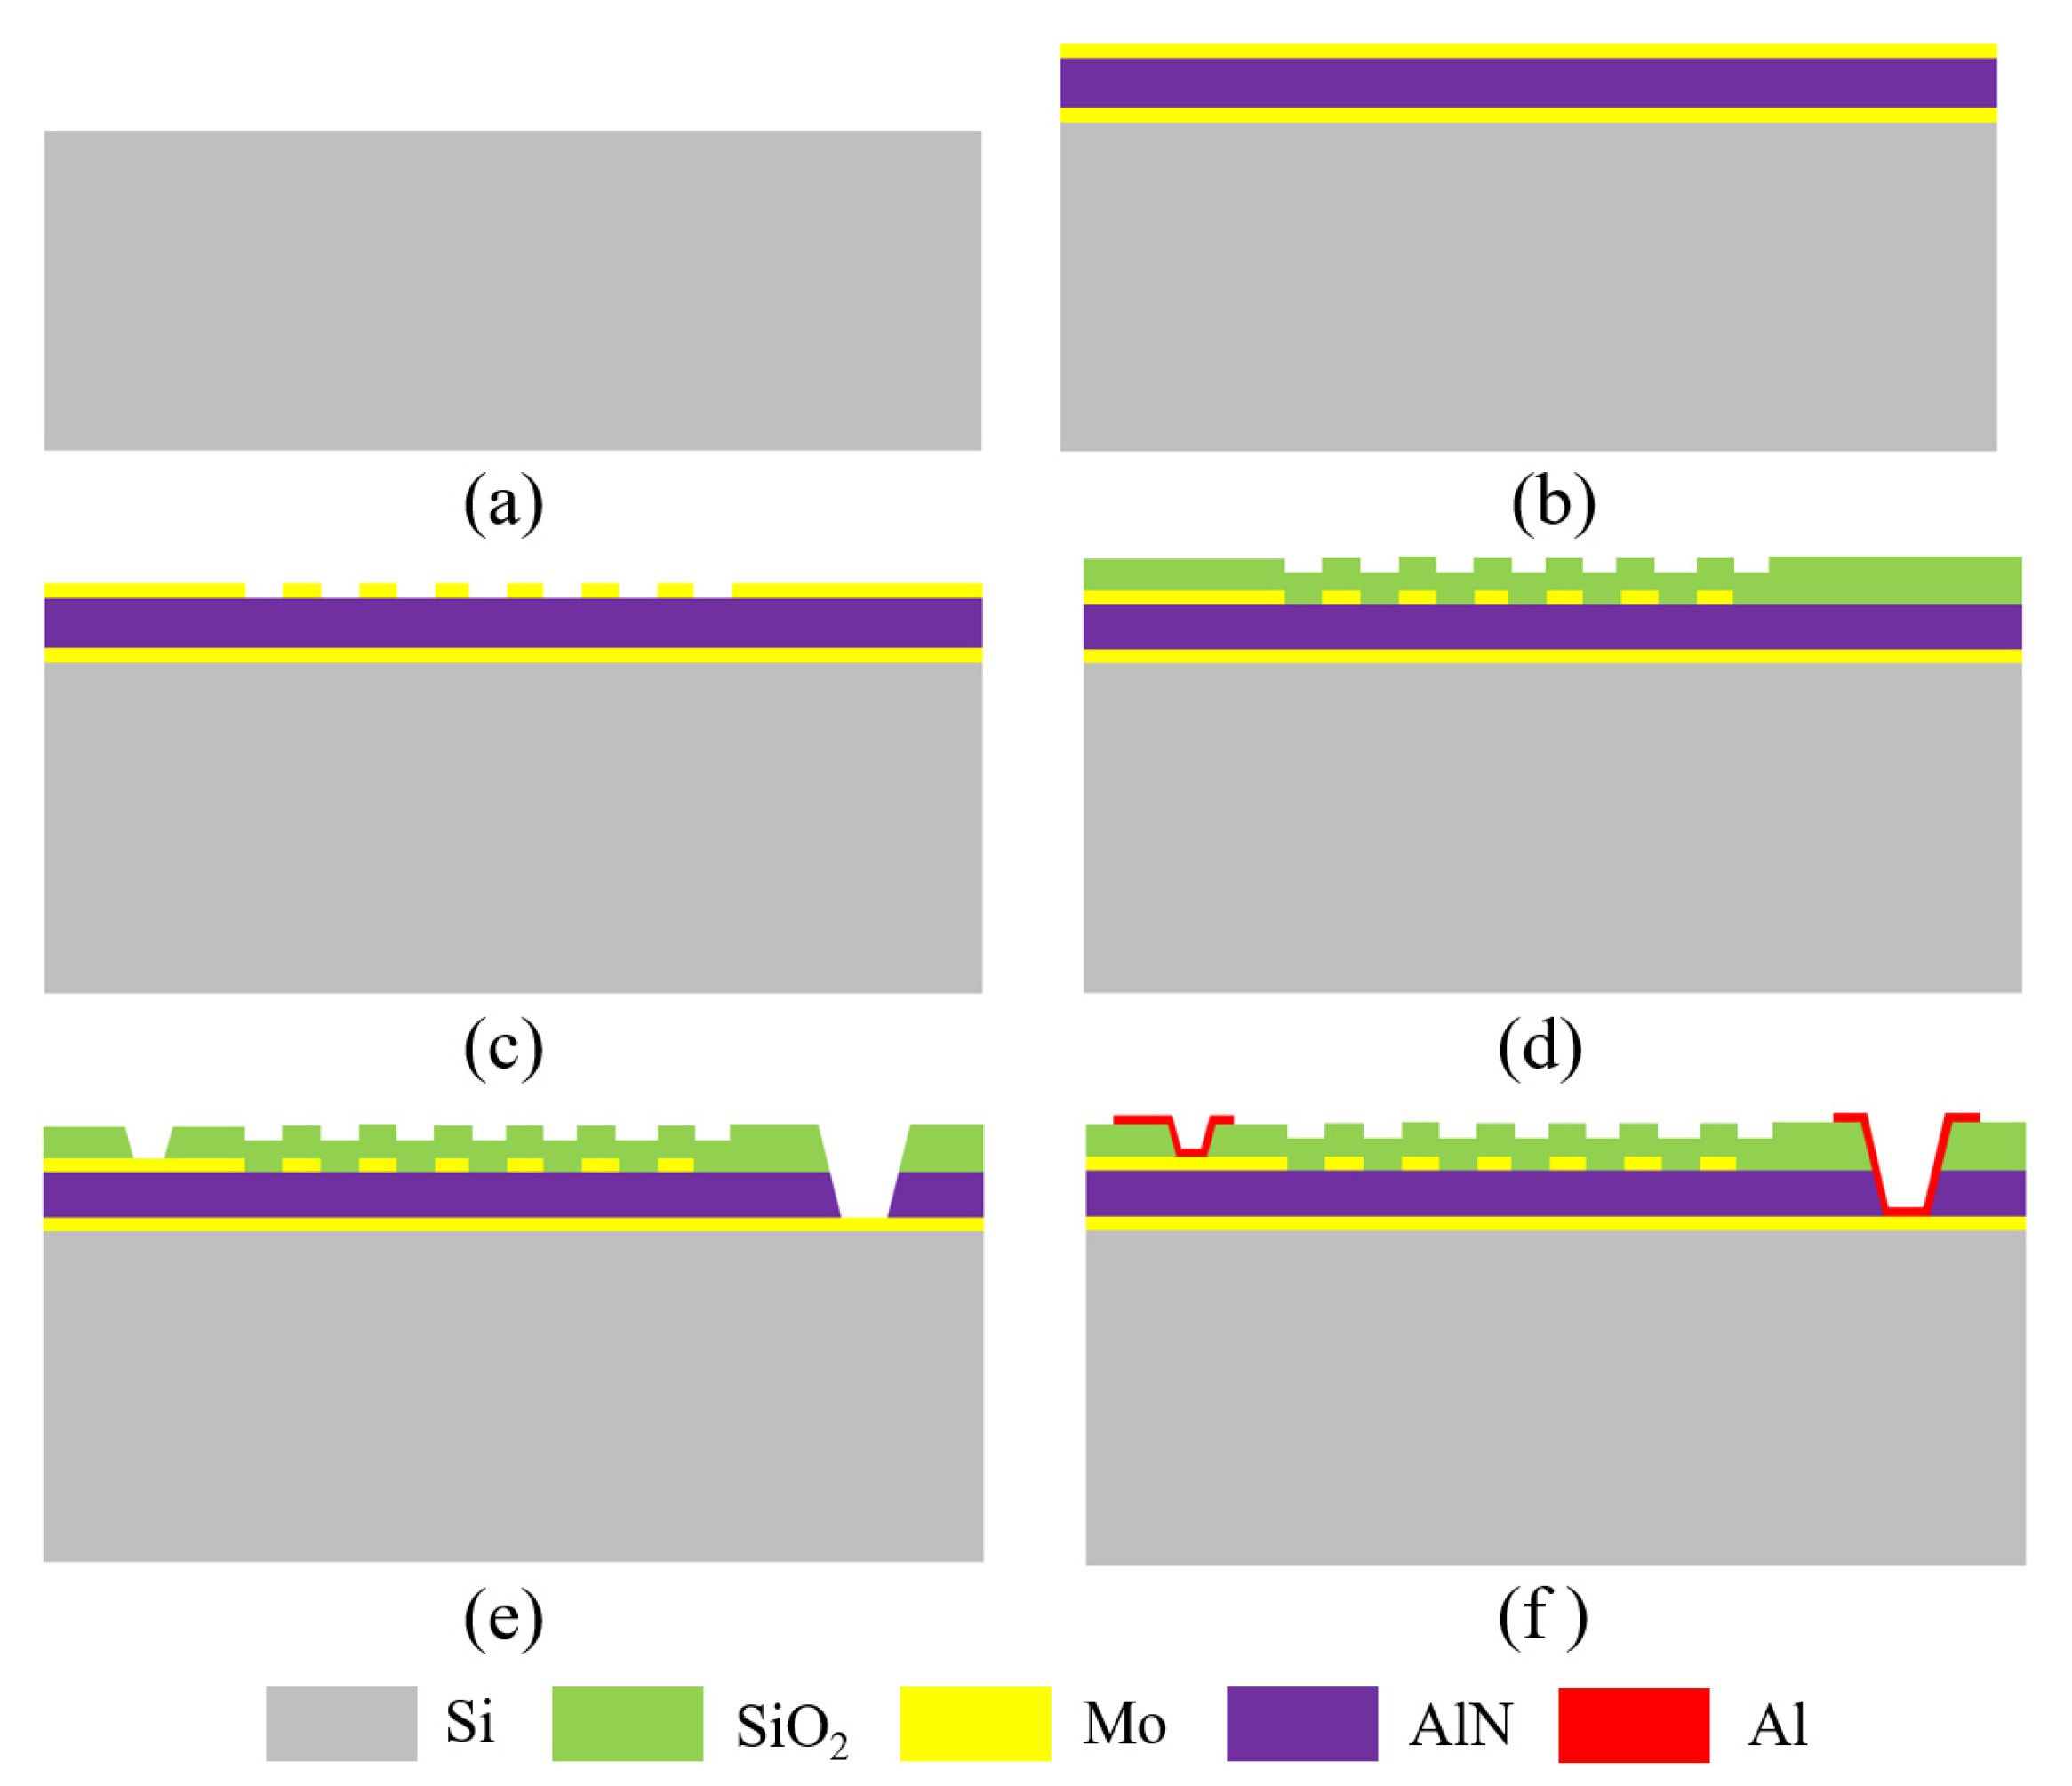
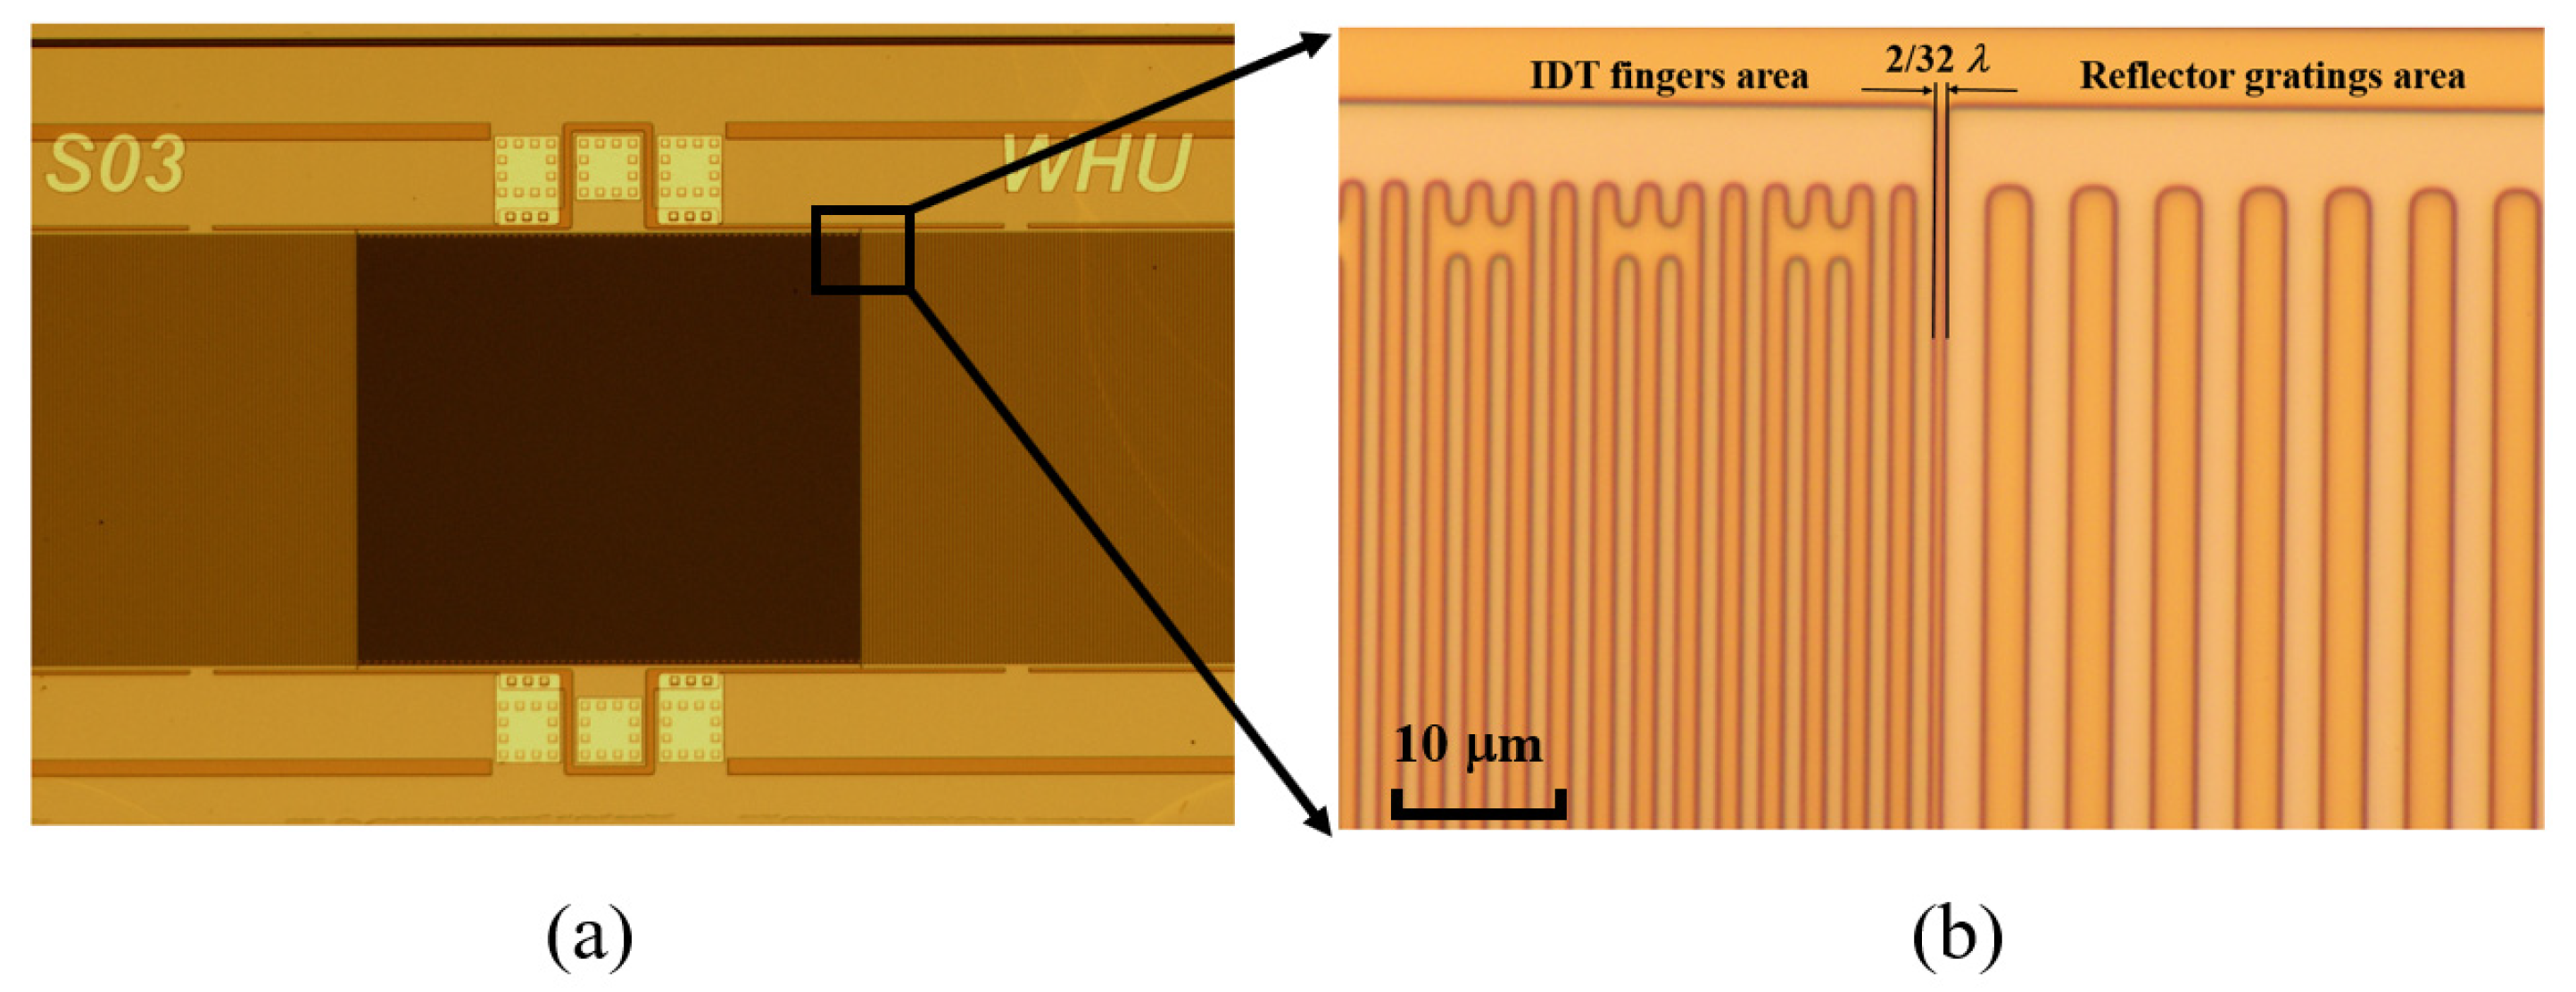
3. Device Fabrication
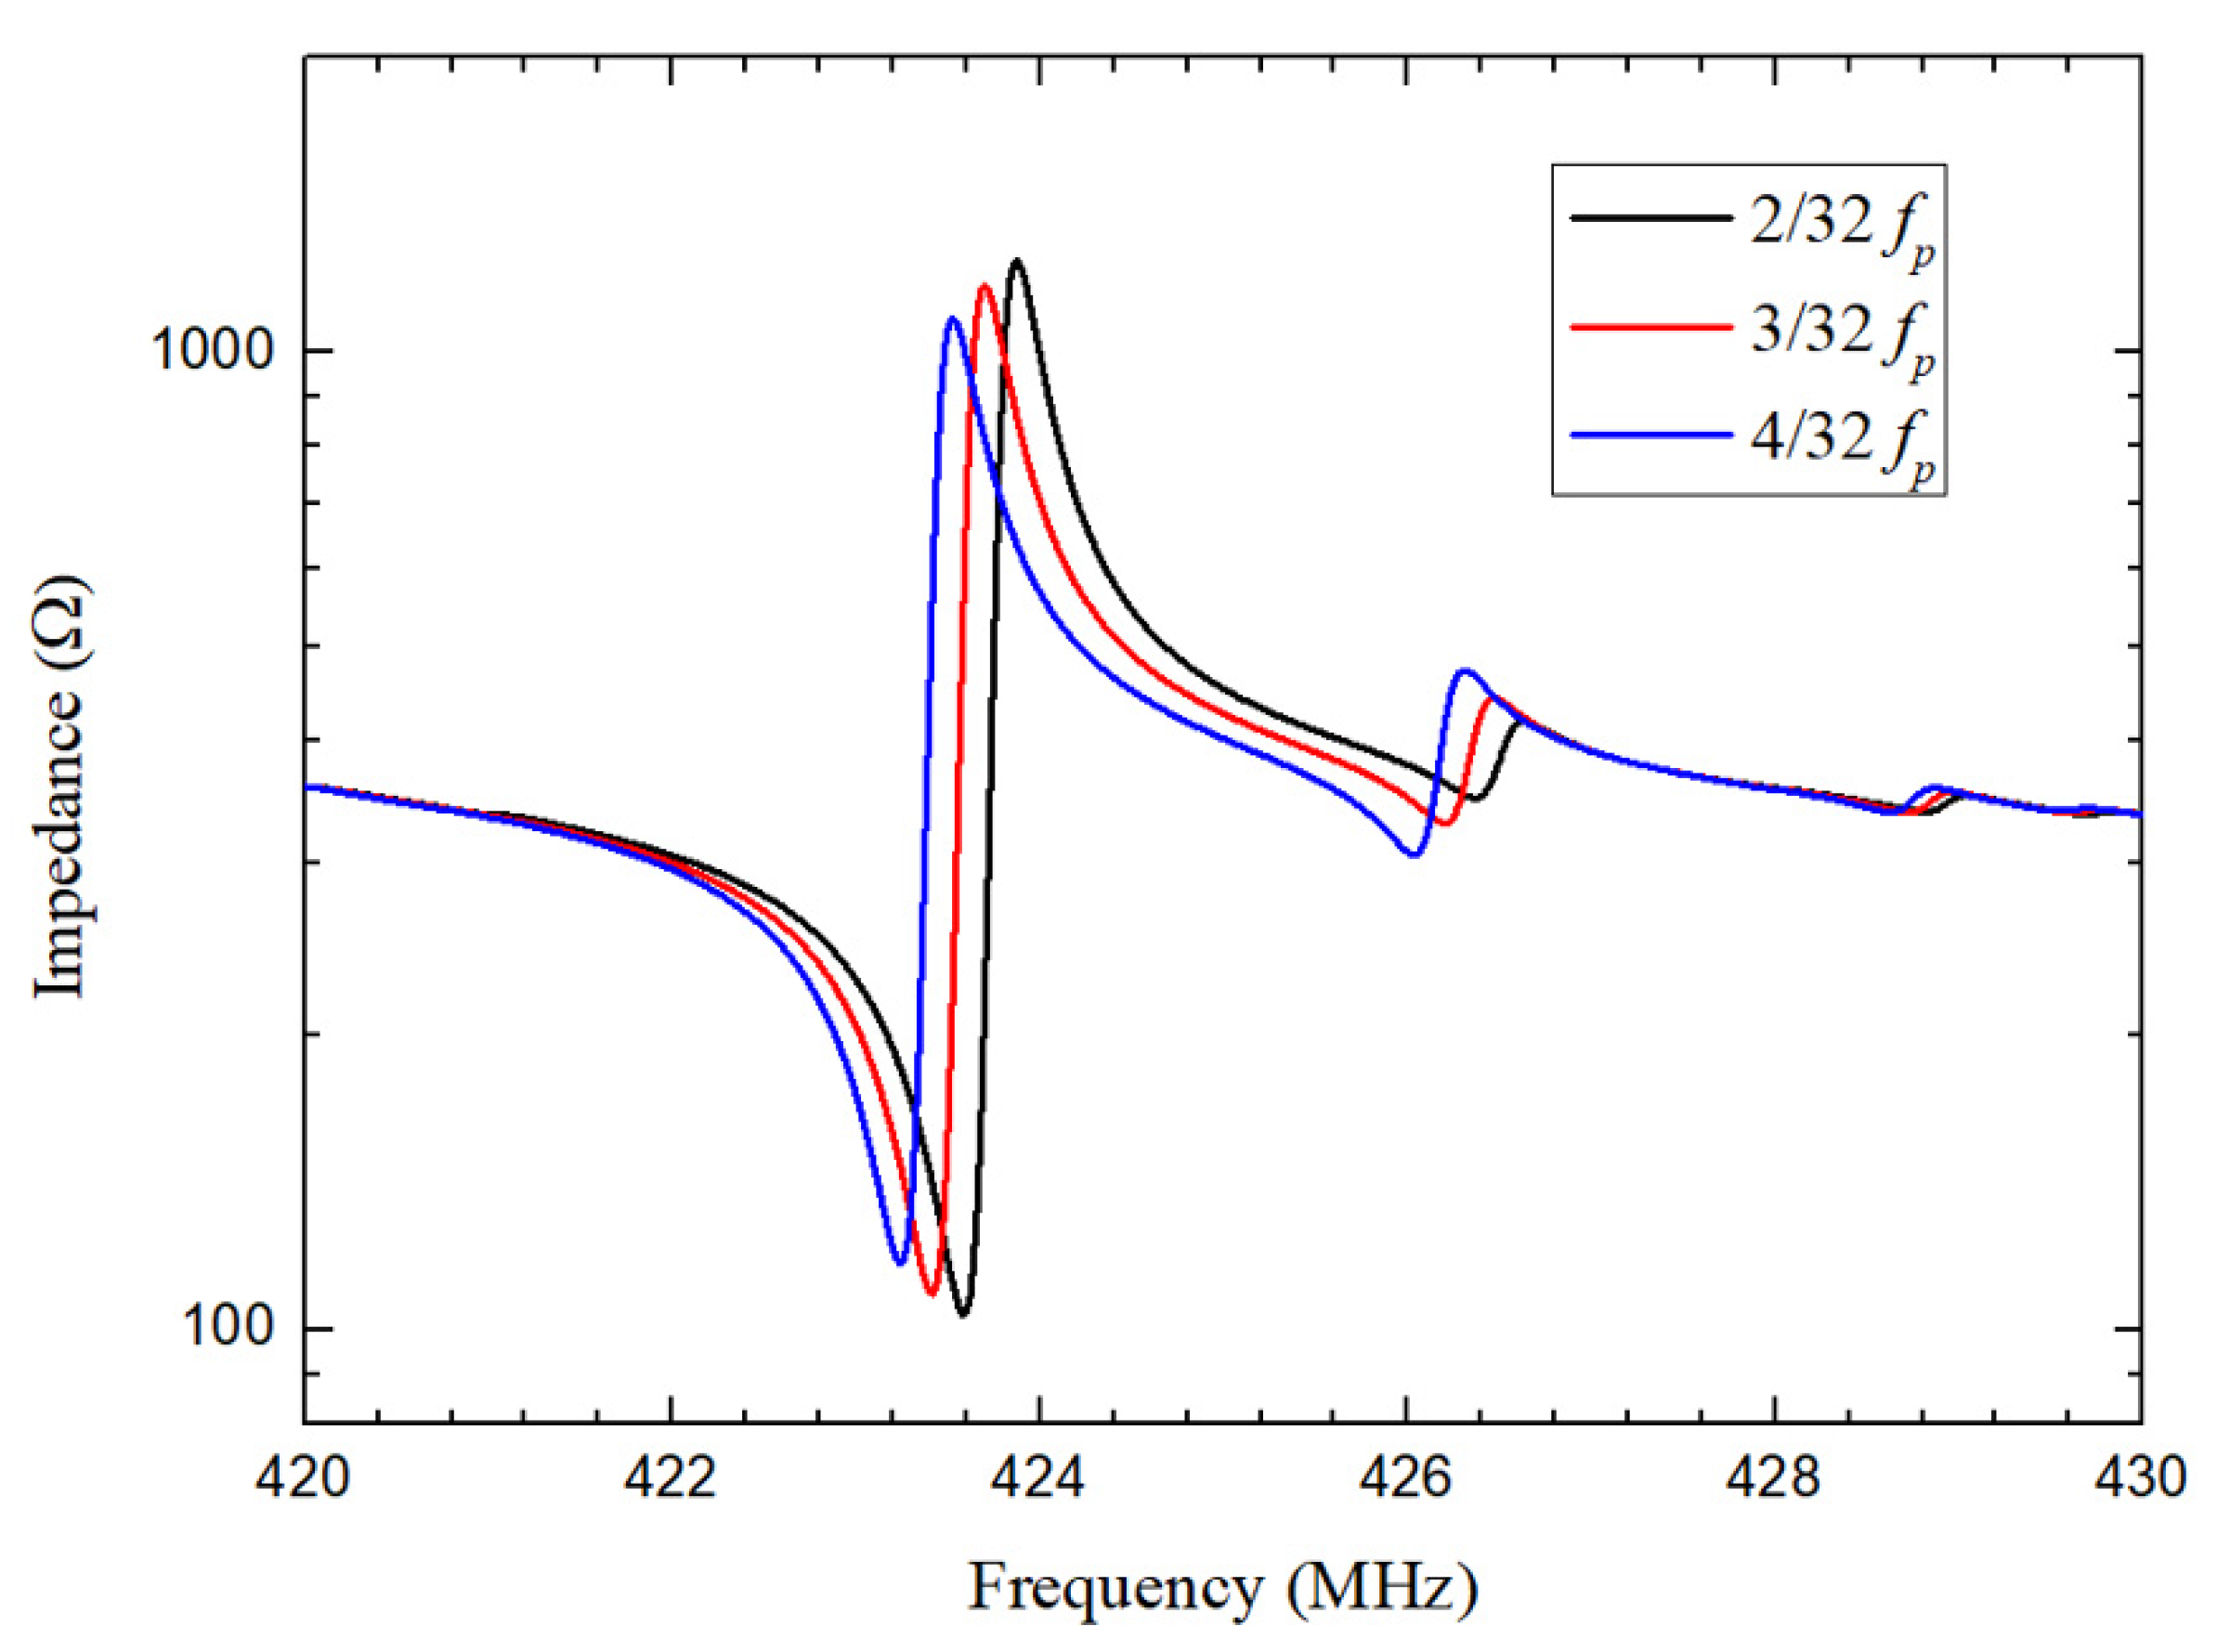
4. Results
5. Conclusions
Author Contributions
Funding
Conflicts of Interest
Abbreviations
| Q | Qulity factor, |
| Effective coupling coefficient, | |
| Wavelength, | |
| c | Elastic constant, |
| Relative permittivity, | |
| Density, | |
| e | Piezoelectric stress constant, |
| Series resonance frequency, | |
| Parallel resonance frequency |
References
- Kobayashi, F.; Goka, S.; Wada, K.; Kakio, S. Electrical characteristics of SAW filters on SiO2/Al/LiNbO3 structure for inverter multiplex transmission systems. IEEE Int. Ultrason. Symp. (IUS) 2017, 1–4. [Google Scholar] [CrossRef]
- Kajii, S.; Kong, D.; Nishio, K.; Kurosawa, M.K. Propulsion measurement of high frequency underwater SAW actuators. IEEE Int. Ultrason. Symp. (IUS) 2020, 1–4. [Google Scholar] [CrossRef]
- Devkota, J.; Ohodnicki, P.R.; Greve, D.W. SAW sensors for chemical vapors and gases. Sensors 2017, 17, 801. [Google Scholar] [CrossRef] [Green Version]
- Zhou, X.; Tan, Q.; Liang, X.; Lin, B.; Guo, T.; Gan, Y. Novel multilayer SAW temperature sensor for ultra-high temperature environments. Micromachines 2021, 12, 643. [Google Scholar] [CrossRef] [PubMed]
- Tseng, W.K.; Lin, J.L.; Sung, W.C.; Chen, S.H.; Lee, G.B. Active micro-mixers using surface acoustic waves on Y-cut 128 LiNbO3. J. Micromech. Microeng. 2006, 16, 539. [Google Scholar] [CrossRef]
- Feng, C.T.; Cheng, C.J.; Atashbar, M.Z. PMMA/64 YX-LiNbO3 guided SH-SAW based immunosensing system. IEEE Sens. 2011, 308–311. [Google Scholar] [CrossRef]
- Nakamura, H.; Nakanishi, H.; Tsurunari, T.; Matsunami, K.; Iwasaki, Y. 6E-1 A Small-Sized SAW Duplexer on a SiO2/IDT/LiNbO3 Structure for Wideband CDMA Application. IEEE Ultrason. Symp. 2007, 488–491. [Google Scholar] [CrossRef]
- Hu, B.; Zhang, S.; Zhang, H.; Lv, W.; Zhang, C.; Lv, X.; San, H. Fabrications of L-band LiNbO3-based SAW resonators for aerospace applications. Micromachines 2019, 10, 349. [Google Scholar] [CrossRef] [Green Version]
- Wu, G.; Xu, J.; Ng, E.J.; Chen, W. MEMS resonators for frequency reference and timing applications. J. Microelectromech. Syst. 2020, 29, 1137–1166. [Google Scholar] [CrossRef]
- Wu, G.; Xu, J.; Zhang, X.; Wang, N.; Yan, D.; Lim, J.L.K.; Zhu, Y.; Li, W.; Gu, Y. Wafer-level vacuum-packaged high-performance AlN-on-SOI piezoelectric resonator for Sub-100-MHz oscillator applications. IEEE Trans. Ind. Electron. 2017, 65, 3576–3584. [Google Scholar] [CrossRef]
- Powell, D.A.; Kalantar-zadeh, K.; Wlodarski, W. Numerical calculation of SAW sensitivity: Application to ZnO/LiTaO3 transducers. Sens. Actuators A Phys. 2004, 115, 456–461. [Google Scholar] [CrossRef]
- Didenko, I.S.; Hickernell, F.S.; Naumenko, N.F. The experimental and theoretical characterization of the SAW propagation properties for zinc oxide films on silicon carbide. IEEE Trans. Ultrason. Ferroelectr. Freq. Control 2000, 47, 179–187. [Google Scholar] [CrossRef] [PubMed]
- Hartmann, C.S. A fast accurate method for calculating the SAW and bulk wave radiation admittance of a SAW transducer. IEEE Ultrason. Symp. 1988, 39–46. [Google Scholar] [CrossRef]
- Peng, D.; Yu, F. A novel FEA simulation model for RFID SAW tag. IEEE Trans. Ultrason. Ferroelectr. Freq. Control 2009, 56, 1753–1760. [Google Scholar] [CrossRef] [PubMed]
- Koskela, J.; Maniadis, P.; Willemsen, B.A.; Turner, P.J.; Hammond, R.B.; Fenzi, N.O.; Plessky, V. Hierarchical cascading in 2D FEM simulation of finite SAW devices with periodic block structure. IEEE Int. Ultrason. Symp. (IUS) 2016, 1–4. [Google Scholar] [CrossRef]
- Kaletta, U.C.; Wipf, C.; Fraschke, M.; Wolansky, D.; Schubert, M.A.; Schroeder, T.; Wenger, C. AlN/SiO2/Si3N4/Si(100)-based CMOS compatible surface acoustic wave filter with 12.8 dB minimum insertion loss. IEEE Trans. Electron Devices 2015, 62, 764–768. [Google Scholar] [CrossRef]
- Manner, O.; Machui, J.; Ali-Hackl, M.; Ruile, W. 2D simulation of diffraction and reflection improves Z-path SAW filters for mobile communications. Proc. IEEE Ultrason. Symp. 1995, 1, 277–280. [Google Scholar] [CrossRef]
- Qamar, A.; Jafari, M.; Rais-Zadeh, M. Solidly mounted anti-symmetric Lamb-wave delay lines as an alternate to SAW devices. IEEE Electron Device Lett. 2018, 39, 1916–1919. [Google Scholar] [CrossRef]
- Oh, H.; Lee, K.; Eun, K.; Choa, S.; Yang, S.S. Development of a high-sensitivity strain measurement system based on a SH SAW sensor. J. Micromech. Microeng. 2012, 22, 025002. [Google Scholar] [CrossRef]
- Jia, L.; Shi, L.; Liu, C.; Sun, C.; Wu, G. Enhancement of transmitting sensitivity of piezoelectric micromachined ultrasonic transducers by electrode design. IEEE Trans. Ultrason. Ferroelectr. Freq. Control 2021. [Google Scholar] [CrossRef]
- Jia, L.; Shi, L.; Liu, C.; Yao, Y.; Sun, C.; Wu, G. Design and characterization of an aluminum nitride-Based MEMS hydrophone with biologically honeycomb architecture. IEEE Trans. Electron Devices 2021, 68, 4656–4663. [Google Scholar] [CrossRef]
- Chen, Q.; Wang, Q.M. The effective electromechanical coupling coefficient of piezoelectric thin-film resonators. Appl. Phys. Lett. 2005, 86, 022904. [Google Scholar] [CrossRef]


| IDT fingers number | 60 pairs |
| Reflector gratings number | 80 pairs |
| Wavelength () | 10.4 m |
| 10 m | |
| 9.6 m | |
| 9.2 m | |
| Space | 2/32 |
| Aperture length | 50 |
| AlN | Si | SiO2 | Mo | ||
|---|---|---|---|---|---|
| Elastic constants, (GPa) | 410.06 | 165.6 | 70 | 329 | |
| 100.69 | 63.9 | ||||
| 83.82 | |||||
| 386.24 | |||||
| 100.58 | 79.5 | ||||
| 154.70 | |||||
| Relative permittivity, | 9 | 4.2 | |||
| 11 | 4.2 | ||||
| Density, (kg/m3) | 3260 | 2329 | 2200 | 10,200 | |
| Piezoelectric stress constants, | −0.48 | ||||
| (C/m2) | −0.58 | ||||
| 1.55 |
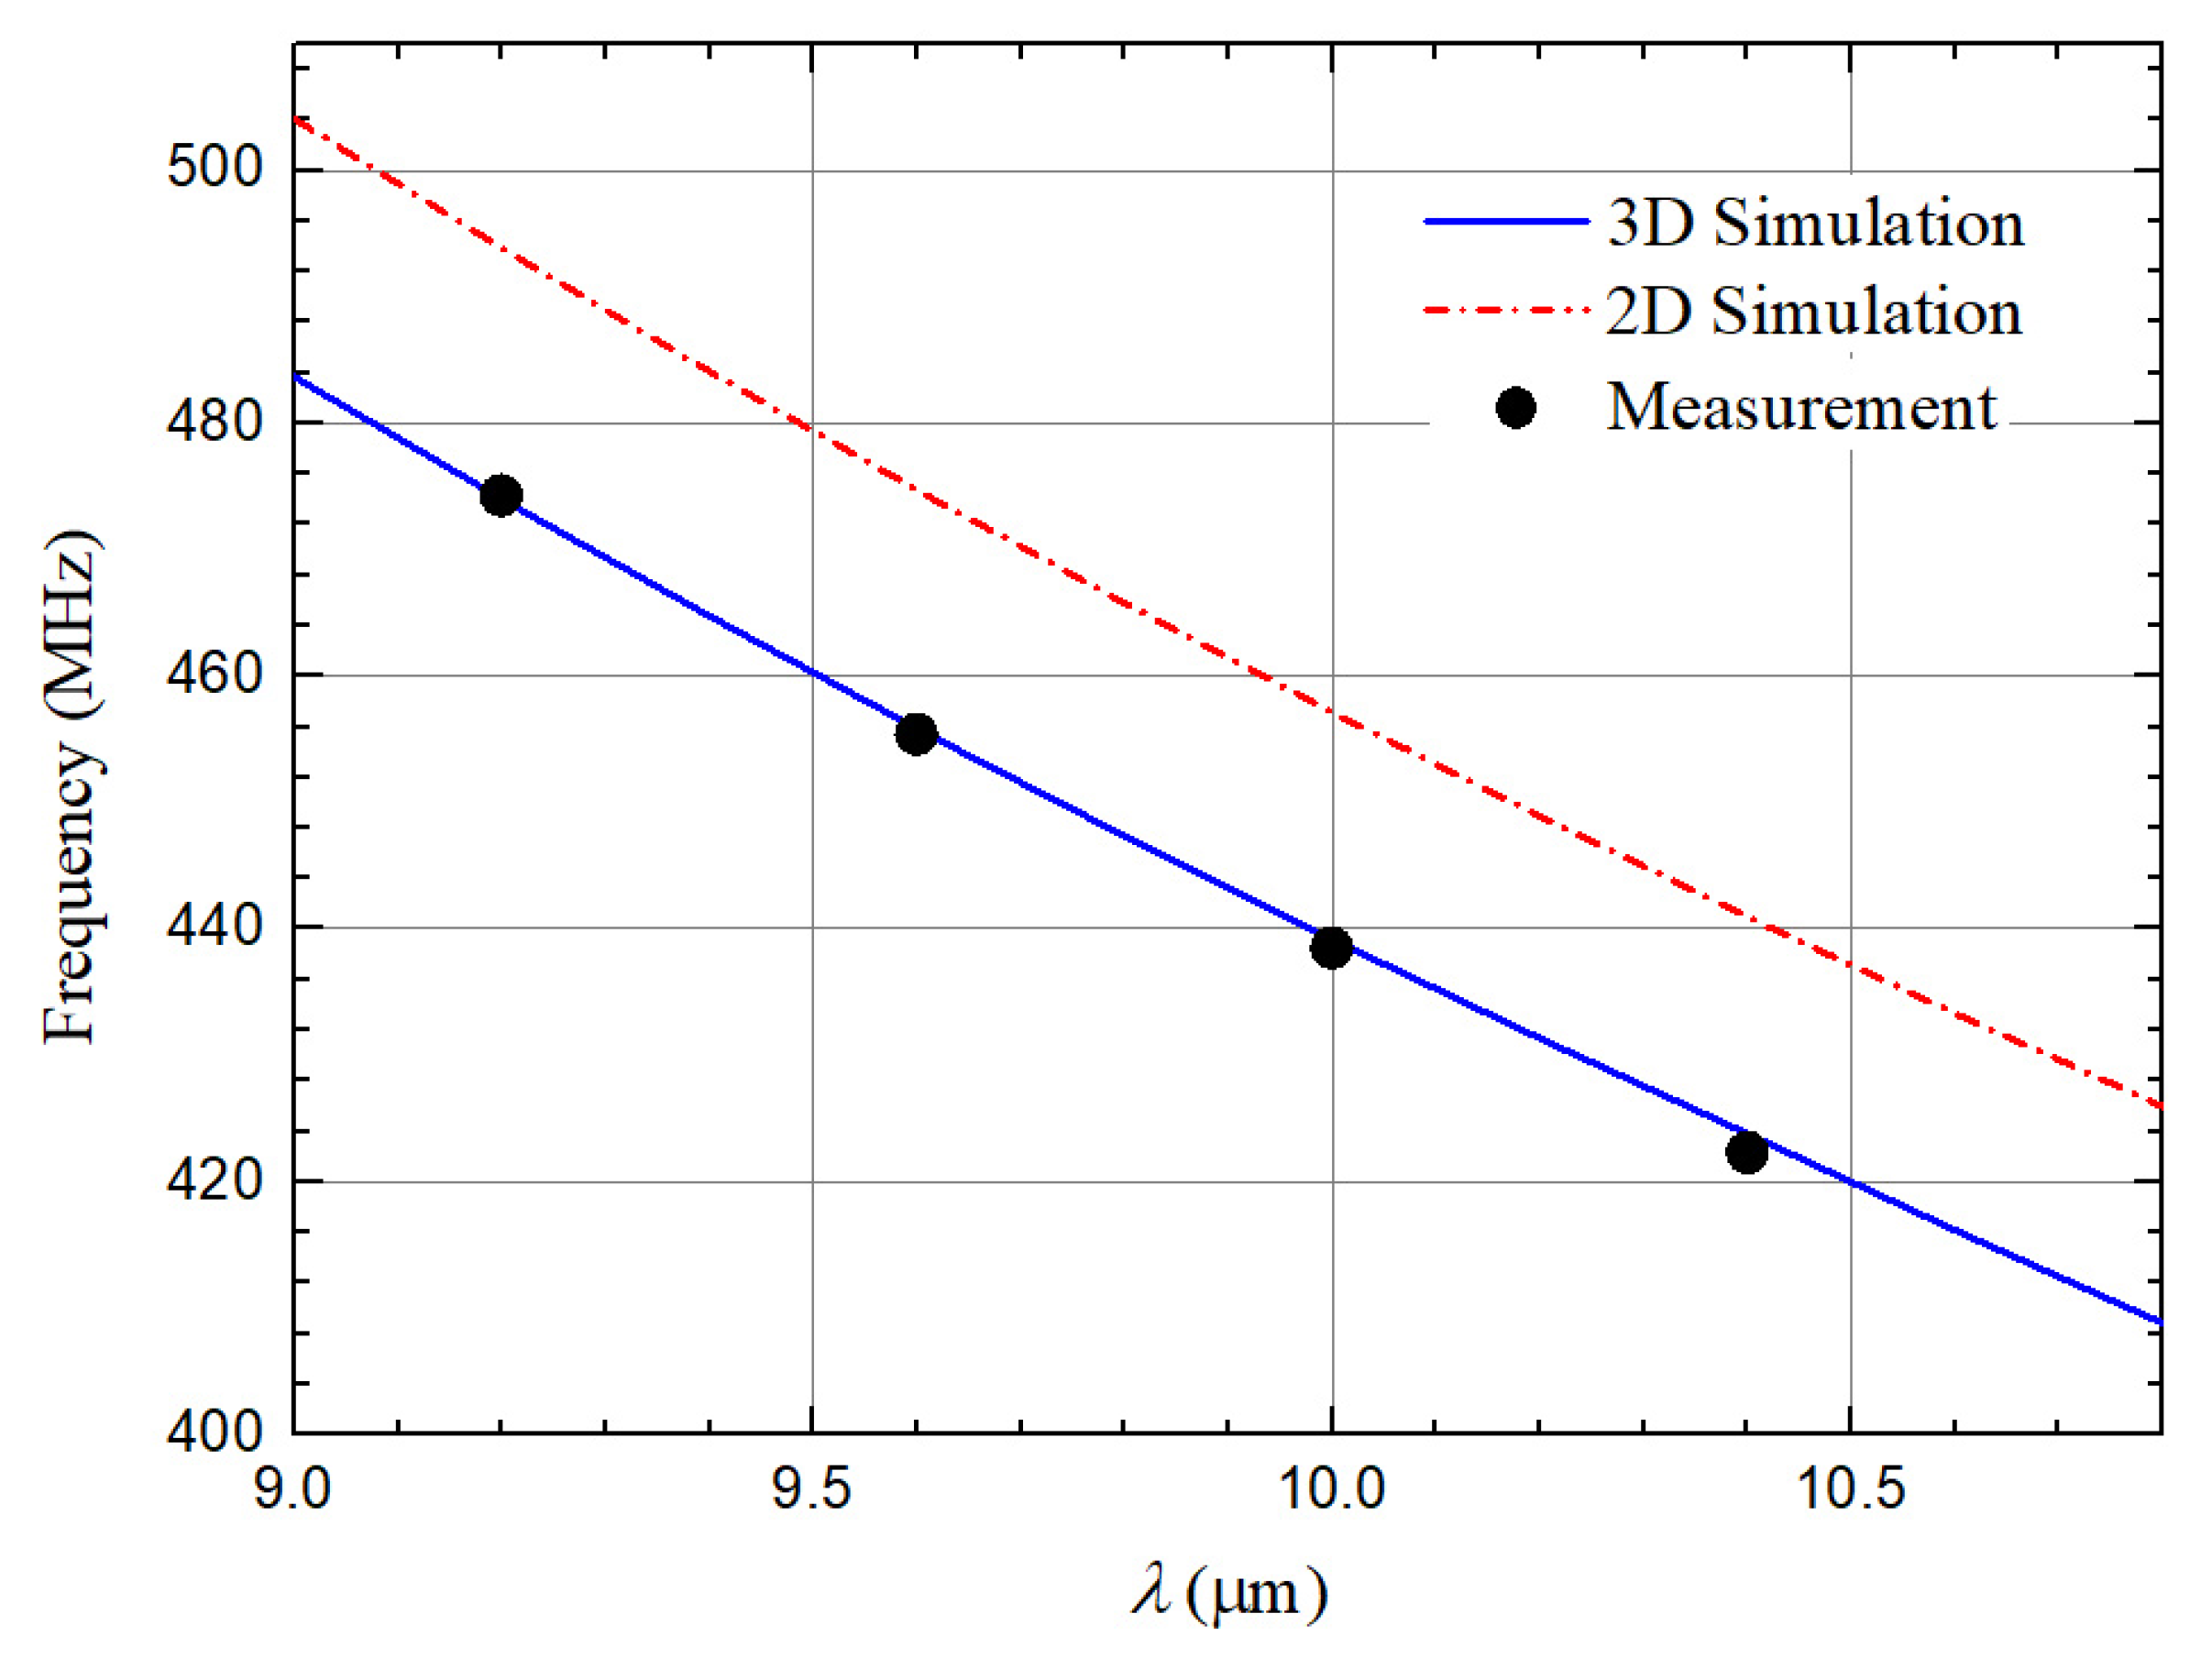
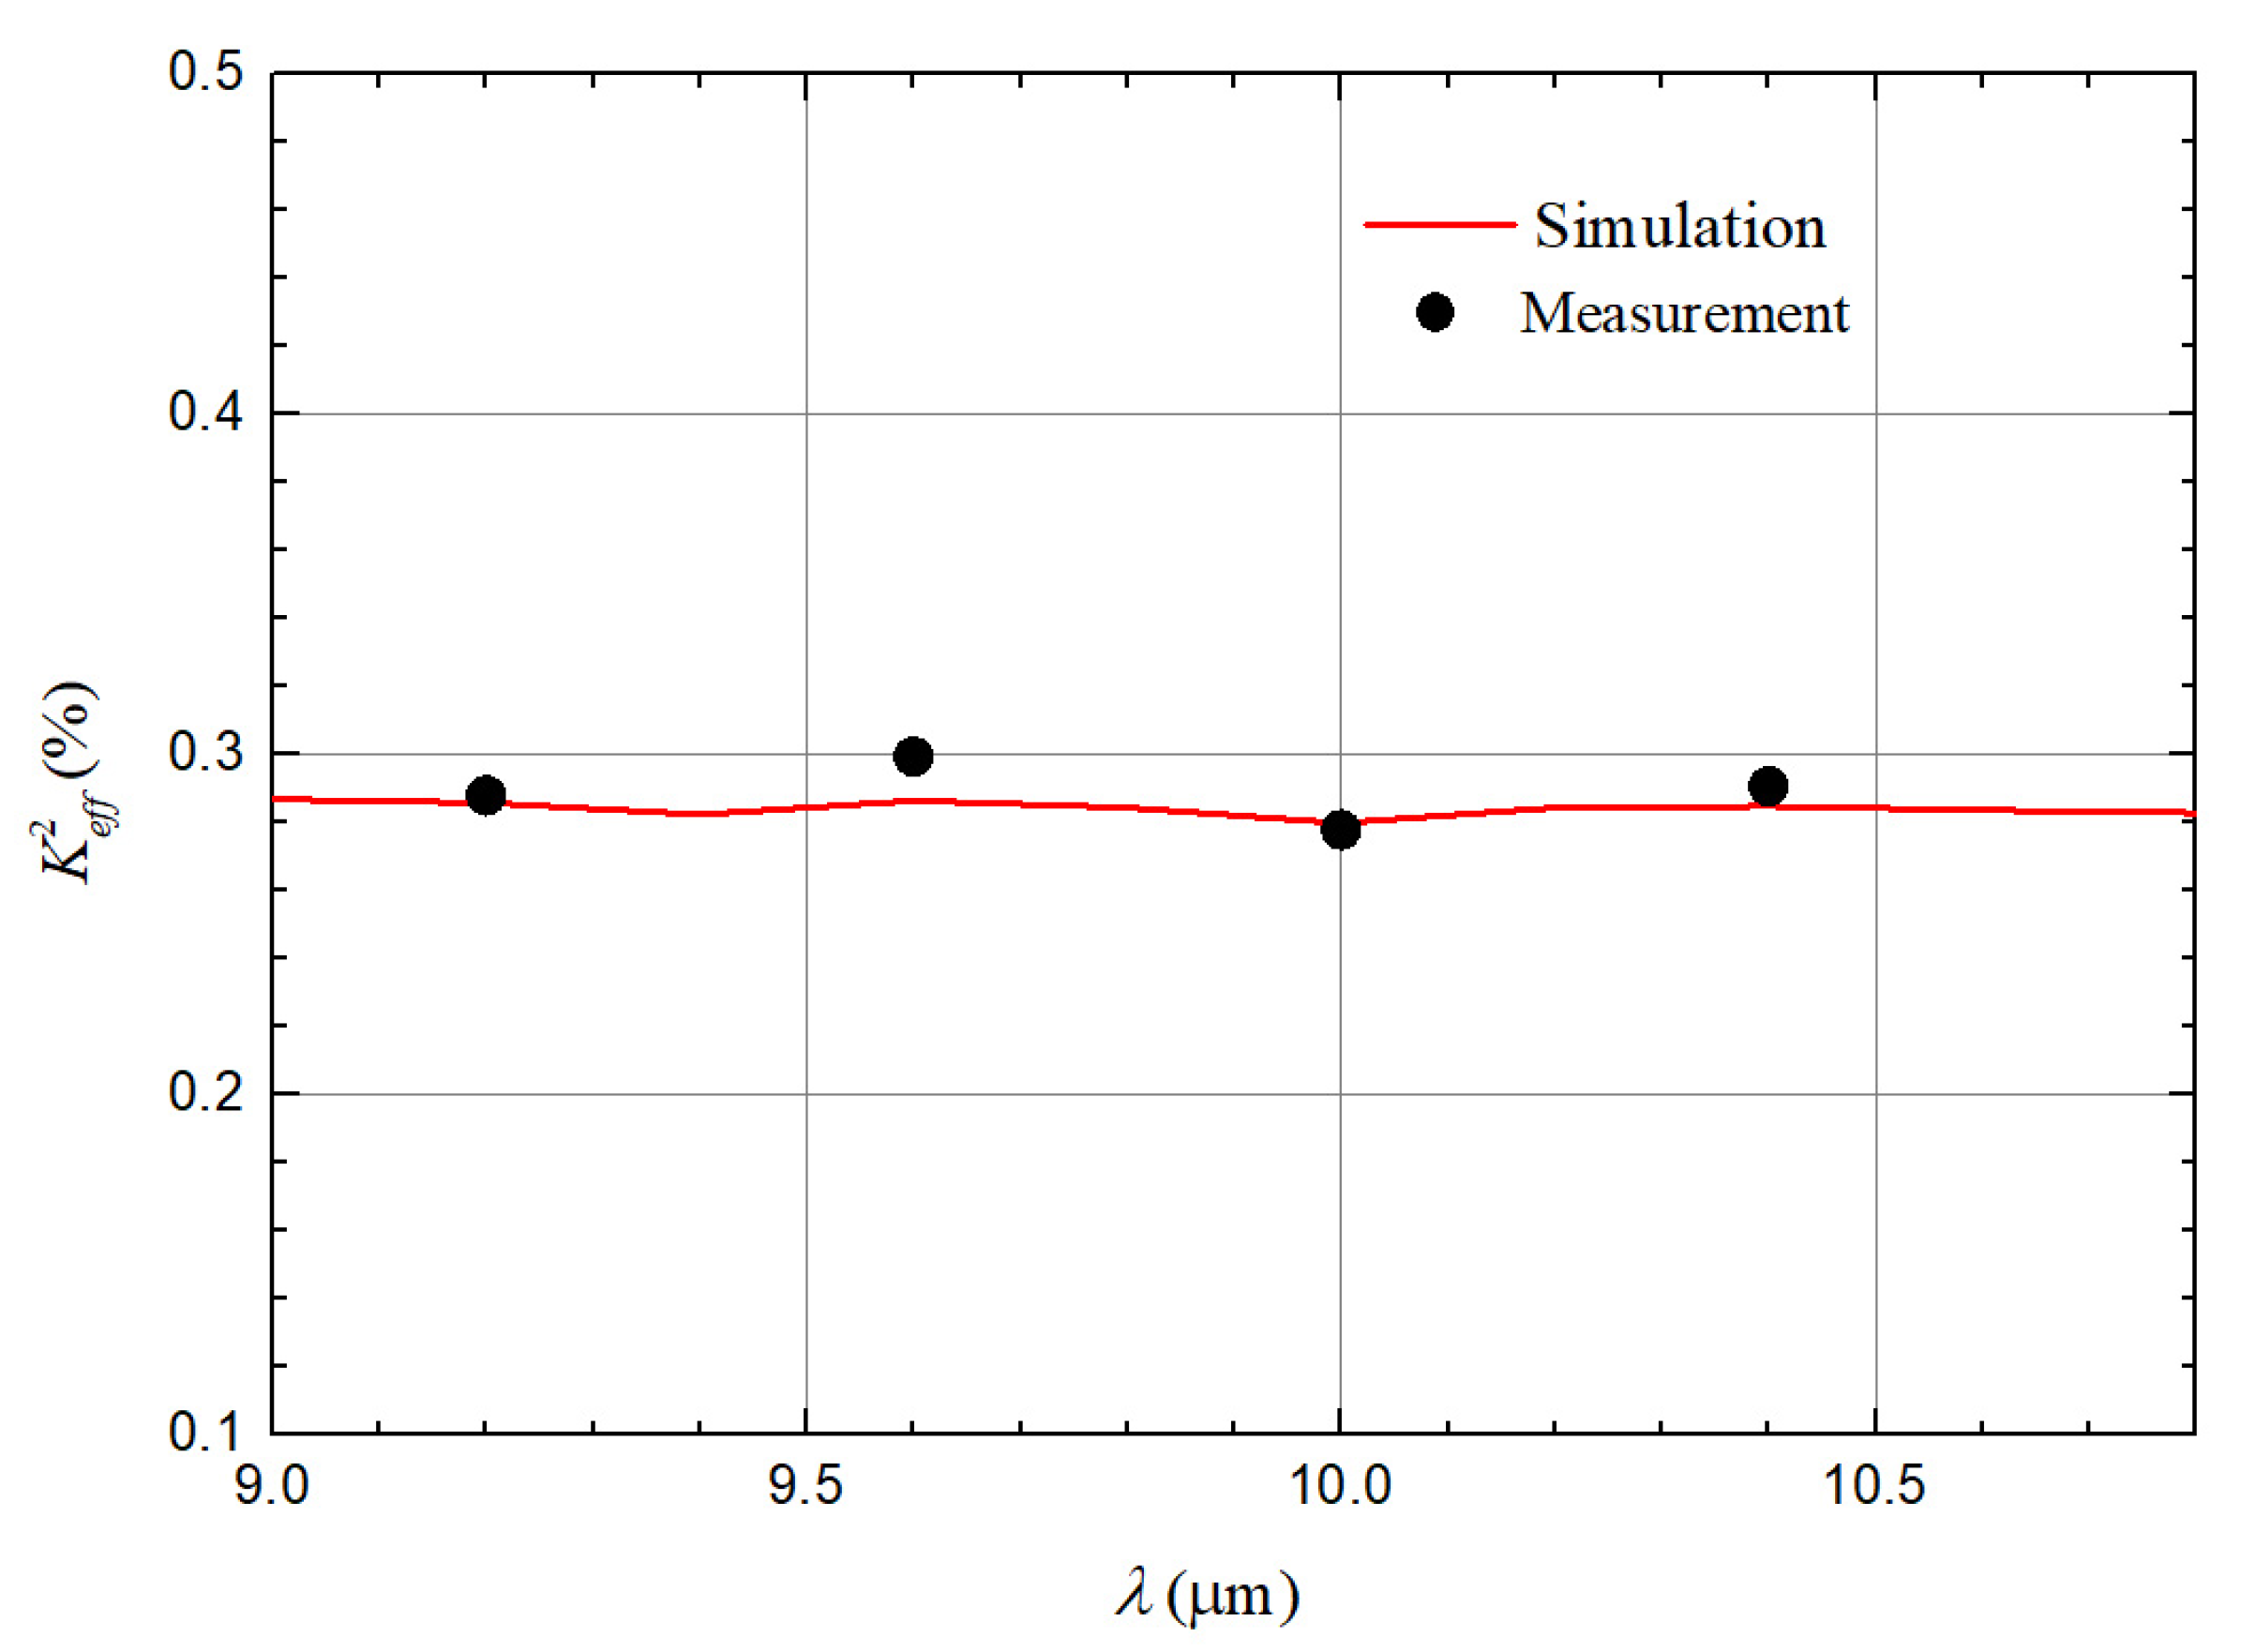
| (m) | 10.4 | 10 | 9.6 | 9.2 | |
|---|---|---|---|---|---|
| Frequency | Simulation | 423.18 | 439.17 | 455.84 | 473.99 |
| (MHz) | Measurement | 422.50 | 438.68 | 455.39 | 474.27 |
| Error | 0.16% | 0.112% | 0.098% | 0.059% | |
| Simulation | 0.285% | 0.280% | 0.286% | 0.286% | |
| Measurement | 0.291% | 0.278% | 0.299% | 0.288% | |
| Error | 1.99% | 0.732% | 4.42% | 0.743% | |
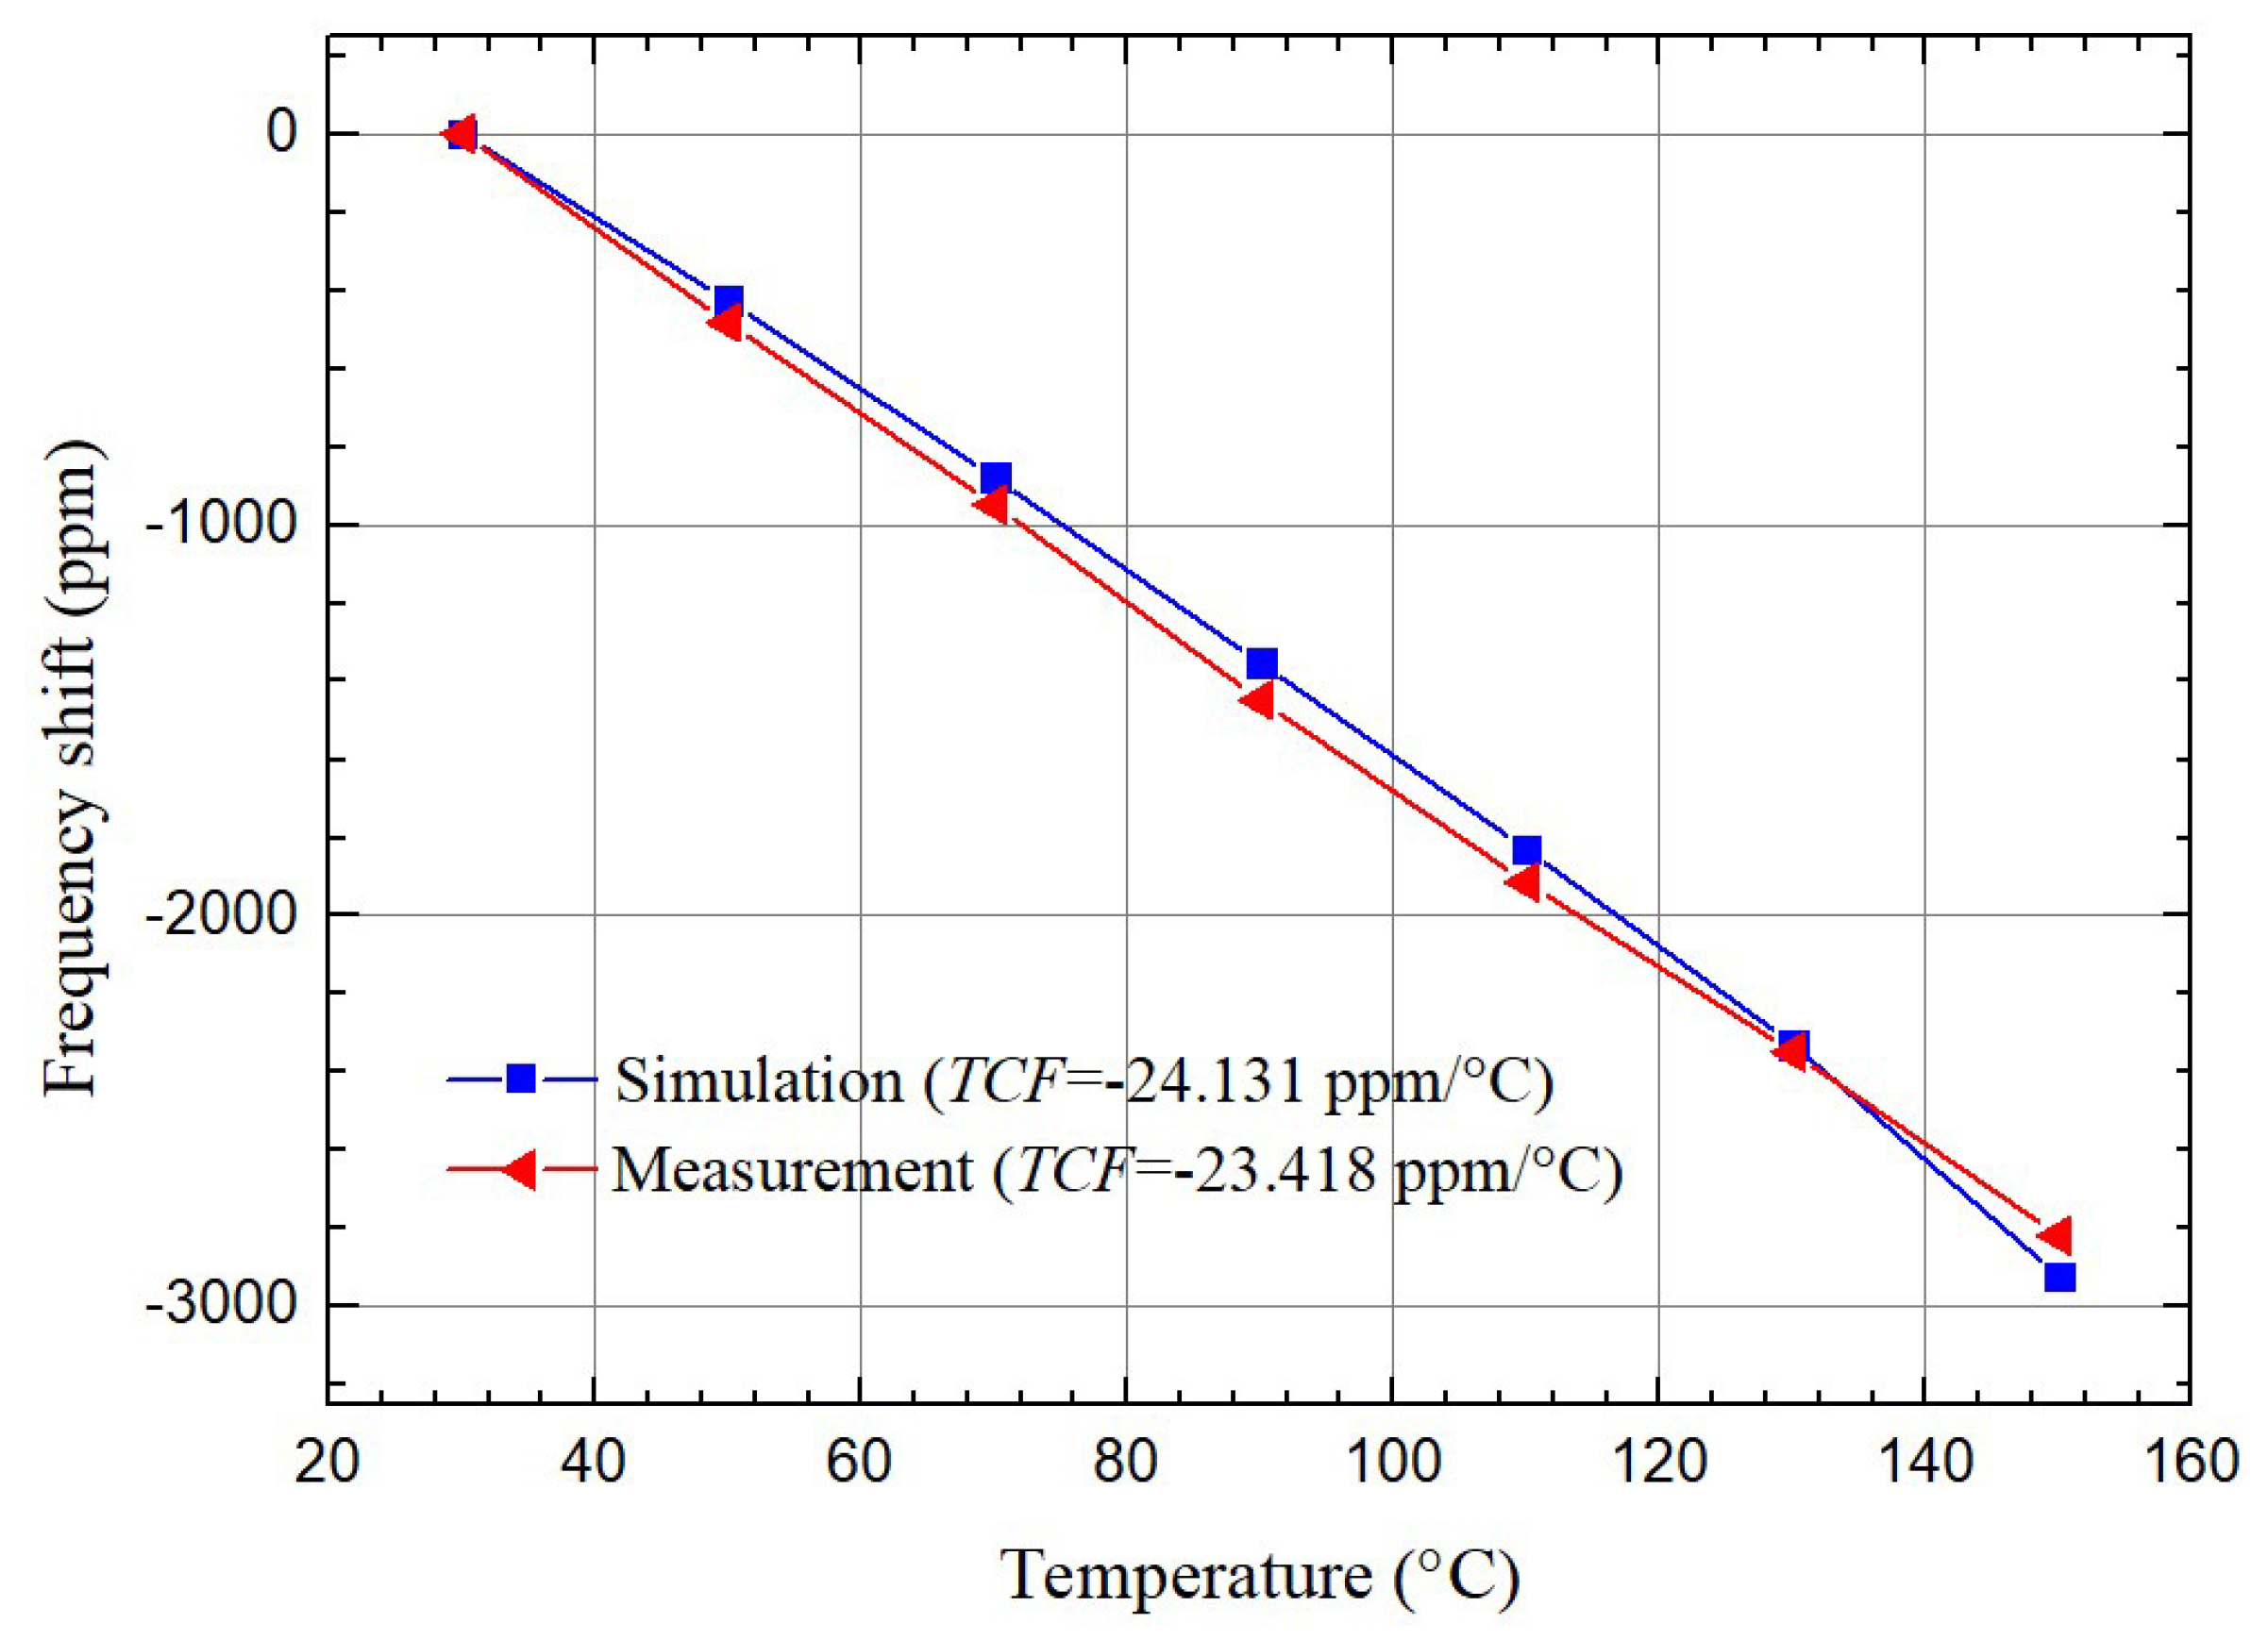
| Simulation | −24.131 | −24.616 | −25.088 | −25.094 | |
| (ppm/°C) | Measurement | −23.418 | −25.102 | −26.117 | −28.056 |
| Error | 2.69% | 1.97% | 4.10% | 11.804% | |
Publisher’s Note: MDPI stays neutral with regard to jurisdictional claims in published maps and institutional affiliations. |
© 2021 by the authors. Licensee MDPI, Basel, Switzerland. This article is an open access article distributed under the terms and conditions of the Creative Commons Attribution (CC BY) license (https://creativecommons.org/licenses/by/4.0/).
Share and Cite
Chen, W.; Zhang, L.; Yang, S.; Jia, W.; Zhang, S.; Gu, Y.; Lou, L.; Wu, G. Three-Dimensional Finite Element Analysis and Characterization of Quasi-Surface Acoustic Wave Resonators. Micromachines 2021, 12, 1118. https://doi.org/10.3390/mi12091118
Chen W, Zhang L, Yang S, Jia W, Zhang S, Gu Y, Lou L, Wu G. Three-Dimensional Finite Element Analysis and Characterization of Quasi-Surface Acoustic Wave Resonators. Micromachines. 2021; 12(9):1118. https://doi.org/10.3390/mi12091118
Chicago/Turabian StyleChen, Wen, Linwei Zhang, Shangshu Yang, Wenhan Jia, Songsong Zhang, Yuandong Gu, Liang Lou, and Guoqiang Wu. 2021. "Three-Dimensional Finite Element Analysis and Characterization of Quasi-Surface Acoustic Wave Resonators" Micromachines 12, no. 9: 1118. https://doi.org/10.3390/mi12091118