
Total and Merchantable Volume Equations for 25 Commercial Tree Species Grown in Canada and the Northeastern United States

Ontario Forest Research Institute, Ministry of Northern Development, Mines, Natural Resources and Forestry, 1235 Queen St. East, Sault Ste. Marie, ON P6A 2E5, Canada
Forests 2021, 12(9), 1270; https://doi.org/10.3390/f12091270
Submission received: 16 August 2021
/
Revised: 14 September 2021
/
Accepted: 15 September 2021
/
Published: 17 September 2021
(This article belongs to the Section Forest Inventory, Modeling and Remote Sensing)
Abstract
:Accurate estimates of tree bole volume are fundamental to sustainable forest management. Total inside and outside bark and merchantable volume equations were developed for 25 major commercial tree species grown in natural stands in eastern and central Canada and the northeastern United States. Data used to develop these equations was collected from 9647 trees sampled from natural stands across the study area. The number of trees sampled varied among species. Jack pine (Pinus banksiana Lamb.) had the most observations (1648 trees) and American basswood (Tilia americana) and red oak (Quercus rubra L.) had the fewest (28 trees each). Two mathematically consistent volume equations (dimensionally compatible and combined variable) were fitted to inside and outside bark and merchantable tree volume data from these tree species. The final volume equation was selected based on fit statistics, predictive accuracy, and logical consistency. Its predictive accuracy was compared with a volume equation previously developed by Honer. Both (total and merchantable) volume equations were fitted using a nonlinear mixed-effects modelling approach. However, random effects were significant for total volumes for only four tree species. A weight (power function) was used to address heteroscedasticity in the data. The modified form of the dimensionally compatible volume equation outperformed the combined variable volume equation in terms of fit statistics and predictive accuracy and was selected as the total inside and outside bark and merchantable volume equations for all tree species. This equation produced logically consistent estimates of total and merchantable volumes and was more accurate than that previously developed by Honer to estimate volumes for most of the tree species used in this study. This new equation can be used to estimate total inside and outside bark and merchantable volumes of major commercial tree species in eastern and central Canada and the northeastern United States.
1. Introduction
Accurate information about tree volume is vital in timber cruising, calculating sustainable wood supply, and developing forest management plans. The volume of a tree can be estimated using a taper or volume equation. Although both equations are driven by diameter at breast height (DBH) and total height, taper equations provide more information about tree shape [1,2,3] and can be used to estimate volume for any section of a tree stem. However, if the volume of an entire tree stem is of interest, volume equations are much simpler to use. Total tree volume is estimated with or without bark, depending on purpose. Volumes are generally referred to as outside and inside bark to refer to with and without bark volumes, respectively. Separate equations can be developed to estimate merchantable volumes to a specified upper diameter or height limit. Merchantable volumes are usually estimated as inside bark only.
Plot/stand volumes can be calculated by summing volume estimates of all individual trees in the area of interest. These volumes can be converted into per unit area (e.g., hectare) estimates and used to document plot/stand changes over time. Accuracy of estimated tree and stand biomass and carbon stocks also depends on the accuracy of tree and stand volume estimates [4,5]. Tree biomass is expressed in terms of tree volume and wood density, but the amount of carbon contained in a tree is a fraction of its biomass [6].
The volume of a tree depends on its form/shape, which is affected by tree species, stand origin (planted vs. natural), and stand density. For a given species and stand density, trees grown in plantations taper more than those in natural stands. Similarly, for a given stand origin, trees taper more when widely spaced [7,8]. Therefore, for a given DBH and total height, a tree grown in a natural stand may contain more volume than one in a plantation at the same stand density. As a result, stand origin-specific volume equations are needed for timber cruising, calculating continuous wood supply, and making informed forest management decisions [9,10,11,12].
Honer [13] developed total and merchantable volume equations for most of the commercial tree species grown in natural stands of central and eastern Canada. Originally, these equations were in imperial units but Honer et al. [14] adjusted them to metric. These equations use total height and DBH information to produce total tree volumes but calculating merchantable volumes requires an additional piece of information: merchantable limit (diameter or height). These equations are widely used throughout eastern Canada and the northeastern United States and are generally sufficiently accurate to estimate total volumes of most commercial tree species in eastern Canada [15]. However, concerns have been raised about the applicability of these equations to some stands growing in specific stand conditions/environments [16]. For example, McGrath et al. [17] reported that they overestimated the volumes of pre-commercial thinned balsam fir stands in Nova Scotia, Canada.
Models developed by Honer [13] are purely empirical. Empirical models are usually unbiased only in the range of data applied. However, models developed by incorporating theoretical information about the underlying relationships between dependent and independent variables are generally well specified and better reflect the fundamental biological and physical relationships exhibited by the system. These models can yield consistent results even when applied beyond the range of the data used to develop them [18]. Additionally, statistical techniques for fitting and evaluating mathematical and statistical models have advanced rapidly in recent years. For example, nonlinear mixed-effects (NLME) models are more efficient and flexible than traditional least-squares models as they address the problems associated with the dataset structure (which is hierarchical).
The objective of this study was to develop improved total inside and outside bark and merchantable tree volume equations for 25 commercial tree species grown in natural stands in eastern and central Canada and the northeastern United States.
2. Methods
2.1. Data
The data used in this study were obtained from the Stem Data Management System (SDMS) established to develop taper models for major commercial tree species in the Great Lakes region of Canada and the United States. These data were collected via stem analysis on trees sampled from various locations across Canada and the northeastern United States. Data collected by Honer [13] to develop volume equations for 20 tree species was included in the dataset. A detailed description of this dataset (locations, collecting agencies, sampling methods, etc.) was provided by Zakrzewski and Schnekenburger [19]. In total, 43 tree species were represented in the dataset but 18 of them had fewer than 25 trees and were not included in this study. Data from the remaining 25 species were analyzed and used to develop total and merchantable volume equations.
Tree species/groups included in this study were jack pine (Pinus banksiana Lamb.), eastern white pine (Pinus strobus L.), red pine (Pinus resinosa Ait.), lodgepole pine (Pinus contorta), black spruce (Picea mariana (Miller) B.S.P), white spruce (Picea glauca (Moench) Voss.), red spruce (Picea rubens Sarg.), Engelmann spruce (Picea engelmannii), balsam fir (Abies balsamea L.), paper birch (Betula papyrifera Marsh.), yellow birch (Betula alleghaniensis Britton), sugar maple (Acer saccharum Marsh.), poplar species (Populus spp.), balsam poplar (Populus balsamifera L.), trembling aspen (Populus tremuloides Michx.), large-tooth aspen (Populus grandidentata), white ash (Fraxinus americana L.), eastern white cedar (Thuja occidentalis), cedar species (Cedar spp.), western larch (Larix occidentalis), European larch (Larix decidua), black cherry (Prunus serotina Ehrh.), American beech (Fagus grandifolia Ehrh.), American basswood (Tilia americana), and red oak (Quercus rubra L.).
The original dataset contained height and diameter measurements in imperial units. For this study, all measurements were converted to metric units. Since DBH was measured at 1.37 m (4.5 ft) and the current Canadian standard is 1.3 m, outside bark diameter had to be estimated at 1.3 m to ensure the volume equations developed were compatible. This estimate was obtained using the taper equation developed by Sharma and Parton [3].
In general, taper equations are used to estimate diameters along the bole of trees in terms of their DBH (measured at 1.3 m) and total height. However, not all equations provide DBH estimates given other diameters along the bole. The Sharma and Parton [3] taper equation allows the use any diameter along the bole as a reference diameter (surrogate for DBH) to estimate diameter at any height. Therefore, this equation was fit to outside bark diameter-height pairs of each species. The outside bark diameters at 1.3 m were then estimated for each tree for each species. This estimated value of outside bark diameter was used as DBH for all trees for all species. Summary statistics for DBH and total height of the trees used in this study are displayed in Table 1.
Smalian’s formula [20] was used to calculate inside and outside bark volumes of each section between two consecutive disks. In calculating these volumes, the tree sections below the butt (first disk) and above the last disk (top) were assumed to be a cylinder and a cone, respectively. Section volumes were summed to obtain total inside and outside bark volumes for each tree. Merchantable volumes were calculated by adding the inside bark section volumes from the stump (30 cm) to 7 cm inside bark diameters. No allowances were made for defect, trim, or breakage.
2.2. Volume Equations
Since the diameter used to estimate tree volume is measured at breast height (1.3 m), some amount of inside and outside bark volume is accumulated by a tree before it reaches breast height. As a result, even if DBH is zero, estimates for both inside and outside bark volumes should be positive and greater than zero. Similarly, the inside bark tree volume estimates should always be smaller than those for outside bark regardless of tree size. These properties are very important for a logically consistent tree volume equation. Equations developed by incorporating theoretical information usually result in logically consistent estimates [18]. Therefore, the volume equation developed using the dimensional analysis approach [18] was considered in this study. The mathematical form of this equation is:
where V = total volume (inside or outside bark, m3) of a tree
- D = diameter at breast height (DBH; m)
- H = total tree height (m)
- β and γ are parameters to be estimated, and ε is the error term.
Equation (1) was developed by assuming V = 0 when D = 0. Therefore, this equation can be used to estimate volume above breast height only. Forest managers, however, would like to estimate total volumes. Sharma [1] added a constant (parameter), α, to the right-hand side of Equation (1) to ensure that V equals the volume acquired before the tree reaches breast height, i.e.,
In mathematics, the volume of a circular base solid with base diameter D and height H is expressed as:
where β = π/4, π/8, π/12, and π/16 for a cylinder, paraboloid, cone, and neiloid, respectively. Therefore, the volume of a tree can be expressed as:
where α is again the volume acquired by a tree before it reaches breast height as the diameter is not measured at the tree base. Since the actual shape of a tree is unknown, β is also unknown and must be estimated using the data.
In fact, Equation (4) is widely used in forestry to estimate the volume of a tree and known as the combined variable volume equation [21]. To ensure logical consistency, the intercept in both volume equations (Equations (2) and (4)) should be greater than zero (α > 0) for both inside and outside bark volumes. For merchantable volume, the intercept should be negative as the volume of a stem that is less than the merchantable diameter limit is not included. Therefore, the estimated value of the intercept in this case should, on average, be equal to the accumulated inside bark volume of a tree until it reaches the merchantable limit (7 cm inside bark butt diameter).
Data used in developing volume equations usually contain measurements from multiple trees from a given sample plot. Multiple sample plots are located on a site. Therefore, the data have a three-level hierarchical structure. In this study, however, the site and plot information were not available. Stem volumes were calculated at individual tree scale. As a result, site and plot scale random effects parameters could not be introduced in fitting these volume equations. Consequently, random effects parameters were introduced only at tree scale. Volume equations with random effects at tree scale can be written as:
where Vi is the stem volume of tree i with dbh and total height as Di and Hi, respectively. Random effects, bji (j = 0, 1, and 2) are normally distributed with mean zero and variances σα2, σβ2, and σγ2, respectively (i.e., b0i~N(0, σα2), b1i~N(0, σβ2) and b2i~N(0, σγ2)). Similarly, εi is normally distributed with mean zero and variance σe2 (i.e., εi~N(0, σe2)). In the presence of heteroscedasticity, σe2 will be multiplied by a variance function. Other variables are as defined earlier.
Equations (5) and (6) were fitted to the dataset using a mixed-effects modelling approach in SAS [22]. Parameters and fit statistics (MSE, AIC [23], and −2 log likelihood) for these models were estimated and examined for logical consistencies mentioned earlier. Heteroscedasticity was examined by estimating volumes using these equations and calculating residuals (observed−predicted) for each tree for each species. These residuals were plotted against predicted volumes. If present, the heteroscedasticity problem was addressed by specifying a variance function [24] in each model. Two variance functions (power and exponential) were analyzed and the function resulting in a smaller value of AIC was selected as the variance function to address heteroscedasticity in the dataset. The final model was selected based on fit statistics (lowest MSE, AIC, and −2 log likelihood) and logical consistency. To ensure outside bark tree volume is always higher than the inside bark volume for all trees, estimated outside bark volume was divided by inside bark volume for each tree for all tree species and plotted against inside bark volumes.
Finally, the volume equations developed here were evaluated by comparing them with Honer et al.’s [14] volume equations, which were developed with a subset of the data used in this study. For this comparison, bias, absolute bias, and root mean square errors (RMSE) in estimating inside bark volumes were calculated using the equations developed by Honer et al. [14] and in this study for all trees for all species. The bias, absolute bias, and RMSE were calculated as follows:
where yi and ŷi are the observed and predicted volumes, respectively, and n is the number of observations for a particular tree species.
3. Results and Discussion
Equations (2) and (4) were fitted to the data using NLMIXED procedure in SAS without any random effects. To be dimensionally consistent, both DBH and total height were expressed in m and all volumes (inside and outside bark and merchantable) were in m3. All three fit statistics (MSE, AIC, and −2 log likelihood) were slightly smaller for Equation (2) than for Equation (4) for all species. These equations were then fit to the data by including random effects one at a time. Equations (2) and (4) with random effects are expressed as Equations (5) and (6), respectively.
Random effect b0i was included first in both equations. However, it was not significant for inside or outside bark volumes for any species (i.e., inclusion of random effect did not significantly improve fit statistics). Thereafter, b1i was included in the models but also was not significant for both inside and outside bark volumes for all species. Finally, b2i was included in fitting Equation (5) (as this effect does not exist in Equation (6)). It was significant for a few tree species, i.e., American basswood, yellow birch, jack pine, and white pine, for both inside and outside bark volumes. The AIC value was reduced by including b2i for both inside and outside bark volumes for these species. Random effects b2i is associated with γ that determines the shape/form of the tree. This result indicated that for these tree species, shape varied significantly among trees within a species.
Estimates for parameters were logically consistent for both equations (Equations (5) and (6)) for both inside and outside bark volumes for all species. However, all fit statics (MSE, AIC, and −2 log likelihood) were consistently smaller for Equation (5) than for Equation (6). Therefore, Equation (5) was selected as the inside and outside bark volume equation for all tree species.
Residuals were calculated for Equation (5) and plotted against predicted volumes. The plots indicated some heteroscedasticity in the dataset (not shown here) for all tree species. Therefore, Equation (5) with random effect b2i (when significant) was fit to the data with an exponential and power variance function for all tree species separately. For both inside and outside bark volume equations for all species, the function with a power to DBH resulted in smaller values of fit statistics (smaller MSE and AIC values) than the exponential function. Therefore, the power function was selected as the variance function for all species. The final model with random effects (bi) associated with γ for both inside and outside bark volumes and the variance as a power function of DBH is expressed as:
where Vi is the volume (inside or outside bark) of the ith tree with dbh Di and total height Hi, and random effects parameter bi is normally distributed with mean zero and variance σb2 (i.e., bi~N(0, σb2)). Similarly, εi is normally distributed with mean zero and variance σe2φ(i.e., ~N(0, σe2φ)) and φ is a parameter to be estimated. Other parameters are as defined earlier. Equation (10) was fit to four tree species (listed above) where the presence of random effect significantly reduced fit statistics. For all other species, Equation (10) was fit without random effects (bi).
Estimated values of parameters and their fit statistics for Equation (10) are listed for inside bark volume equations in Table 2, for outside bark volumes in Table 3, and for merchantable volumes in Table 4. As mentioned, a volume equation is logically consistent if the intercept for both inside and outside bark volumes is significant and greater than zero. This was exactly the case here. The estimates for intercept () were positive and significantly different from zero for both inside and outside volumes for all species. Estimates for other parameters were consistent in terms of sign and magnitude across species and volume equations (inside and outside bark). The weight (power of DBH) was positive for both inside and outside bark tree volume equations for all species.
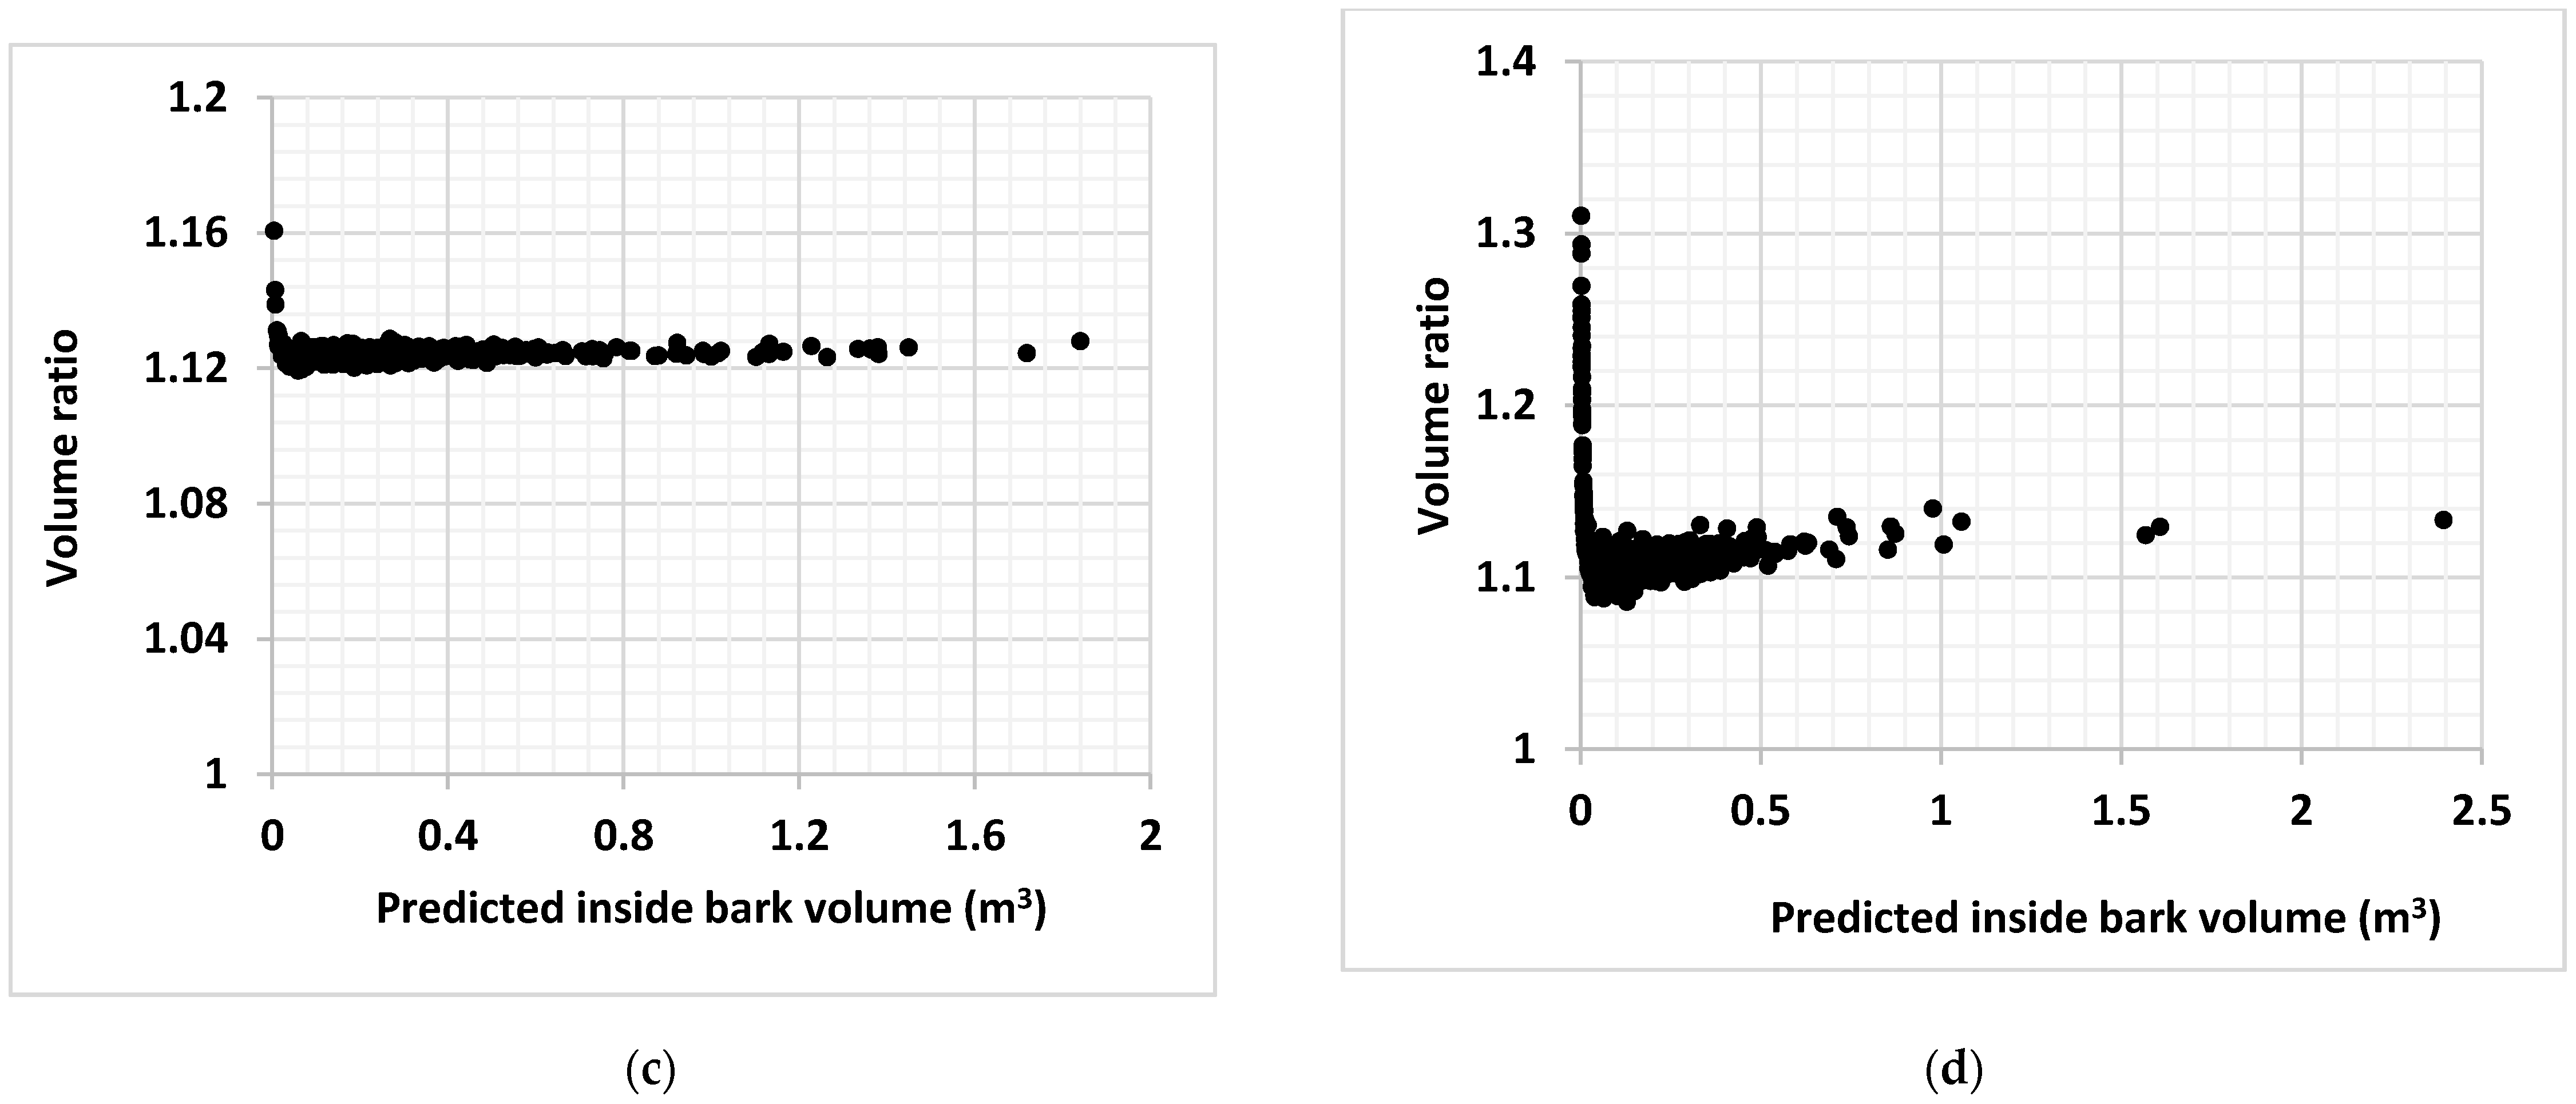
The AIC values were significantly reduced by including the weight in both volume equations for all species. Ratio of estimated outside to inside bark volumes plotted against estimated inside bark volumes confirmed that the estimated outside bark volume is always greater than the inside bark volume for all trees for all species (Figure 1). These plots are shown for jack pine, black spruce, balsam fir, and sugar maple (representing pine, spruce, fir, and other hardwood species, respectively). Balsam fir had the thickest bark followed by jack pine, sugar maple, and black spruce.
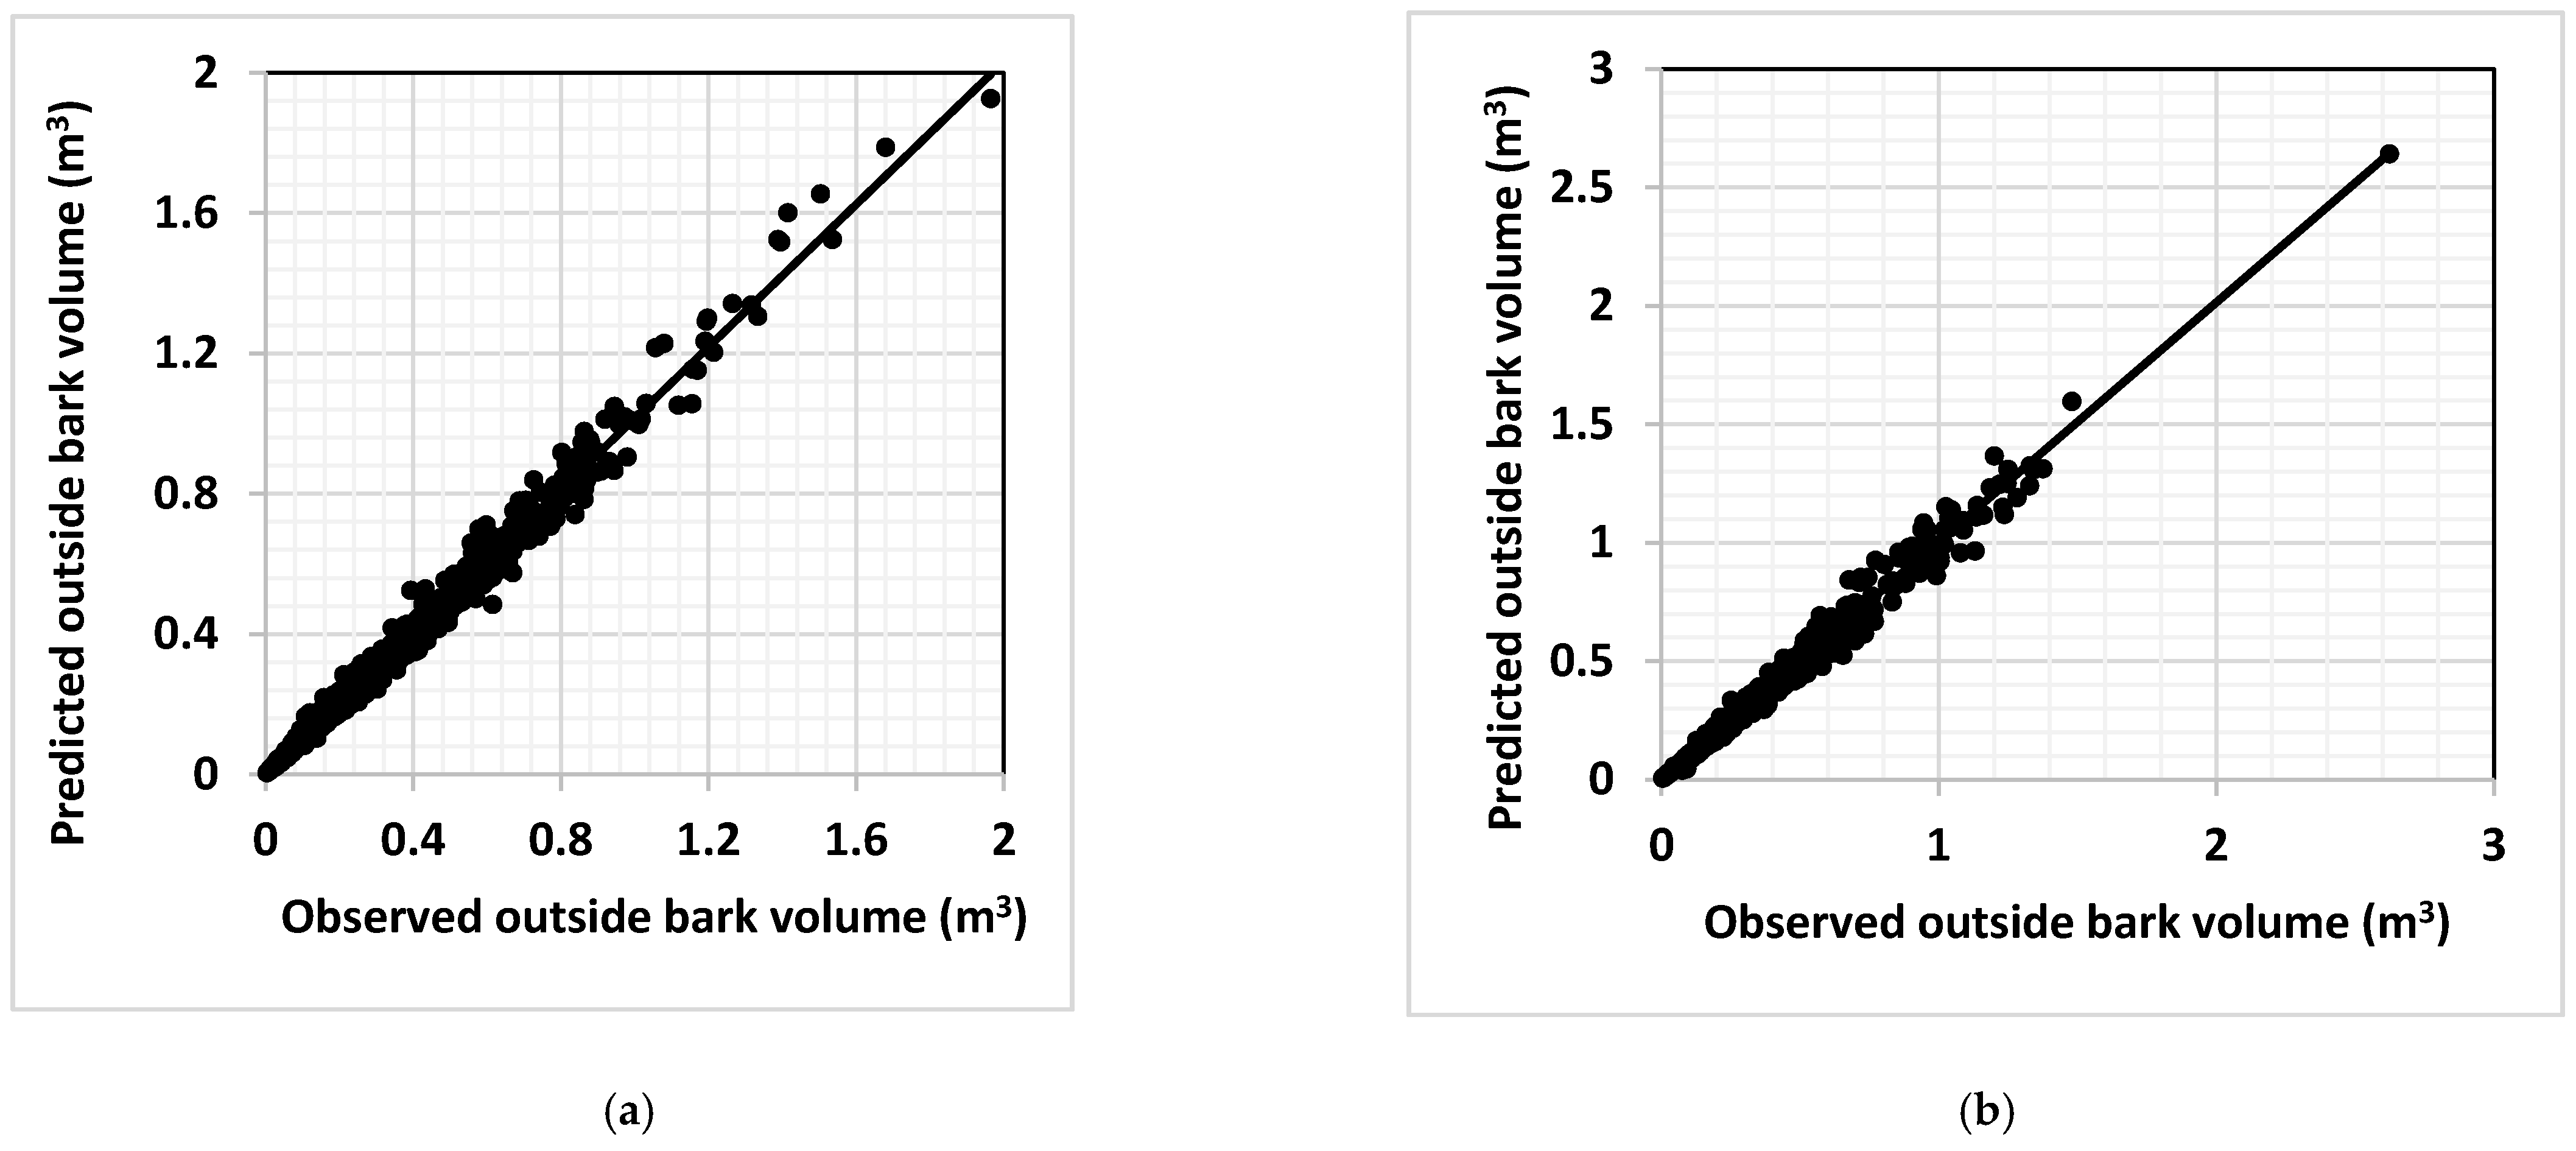
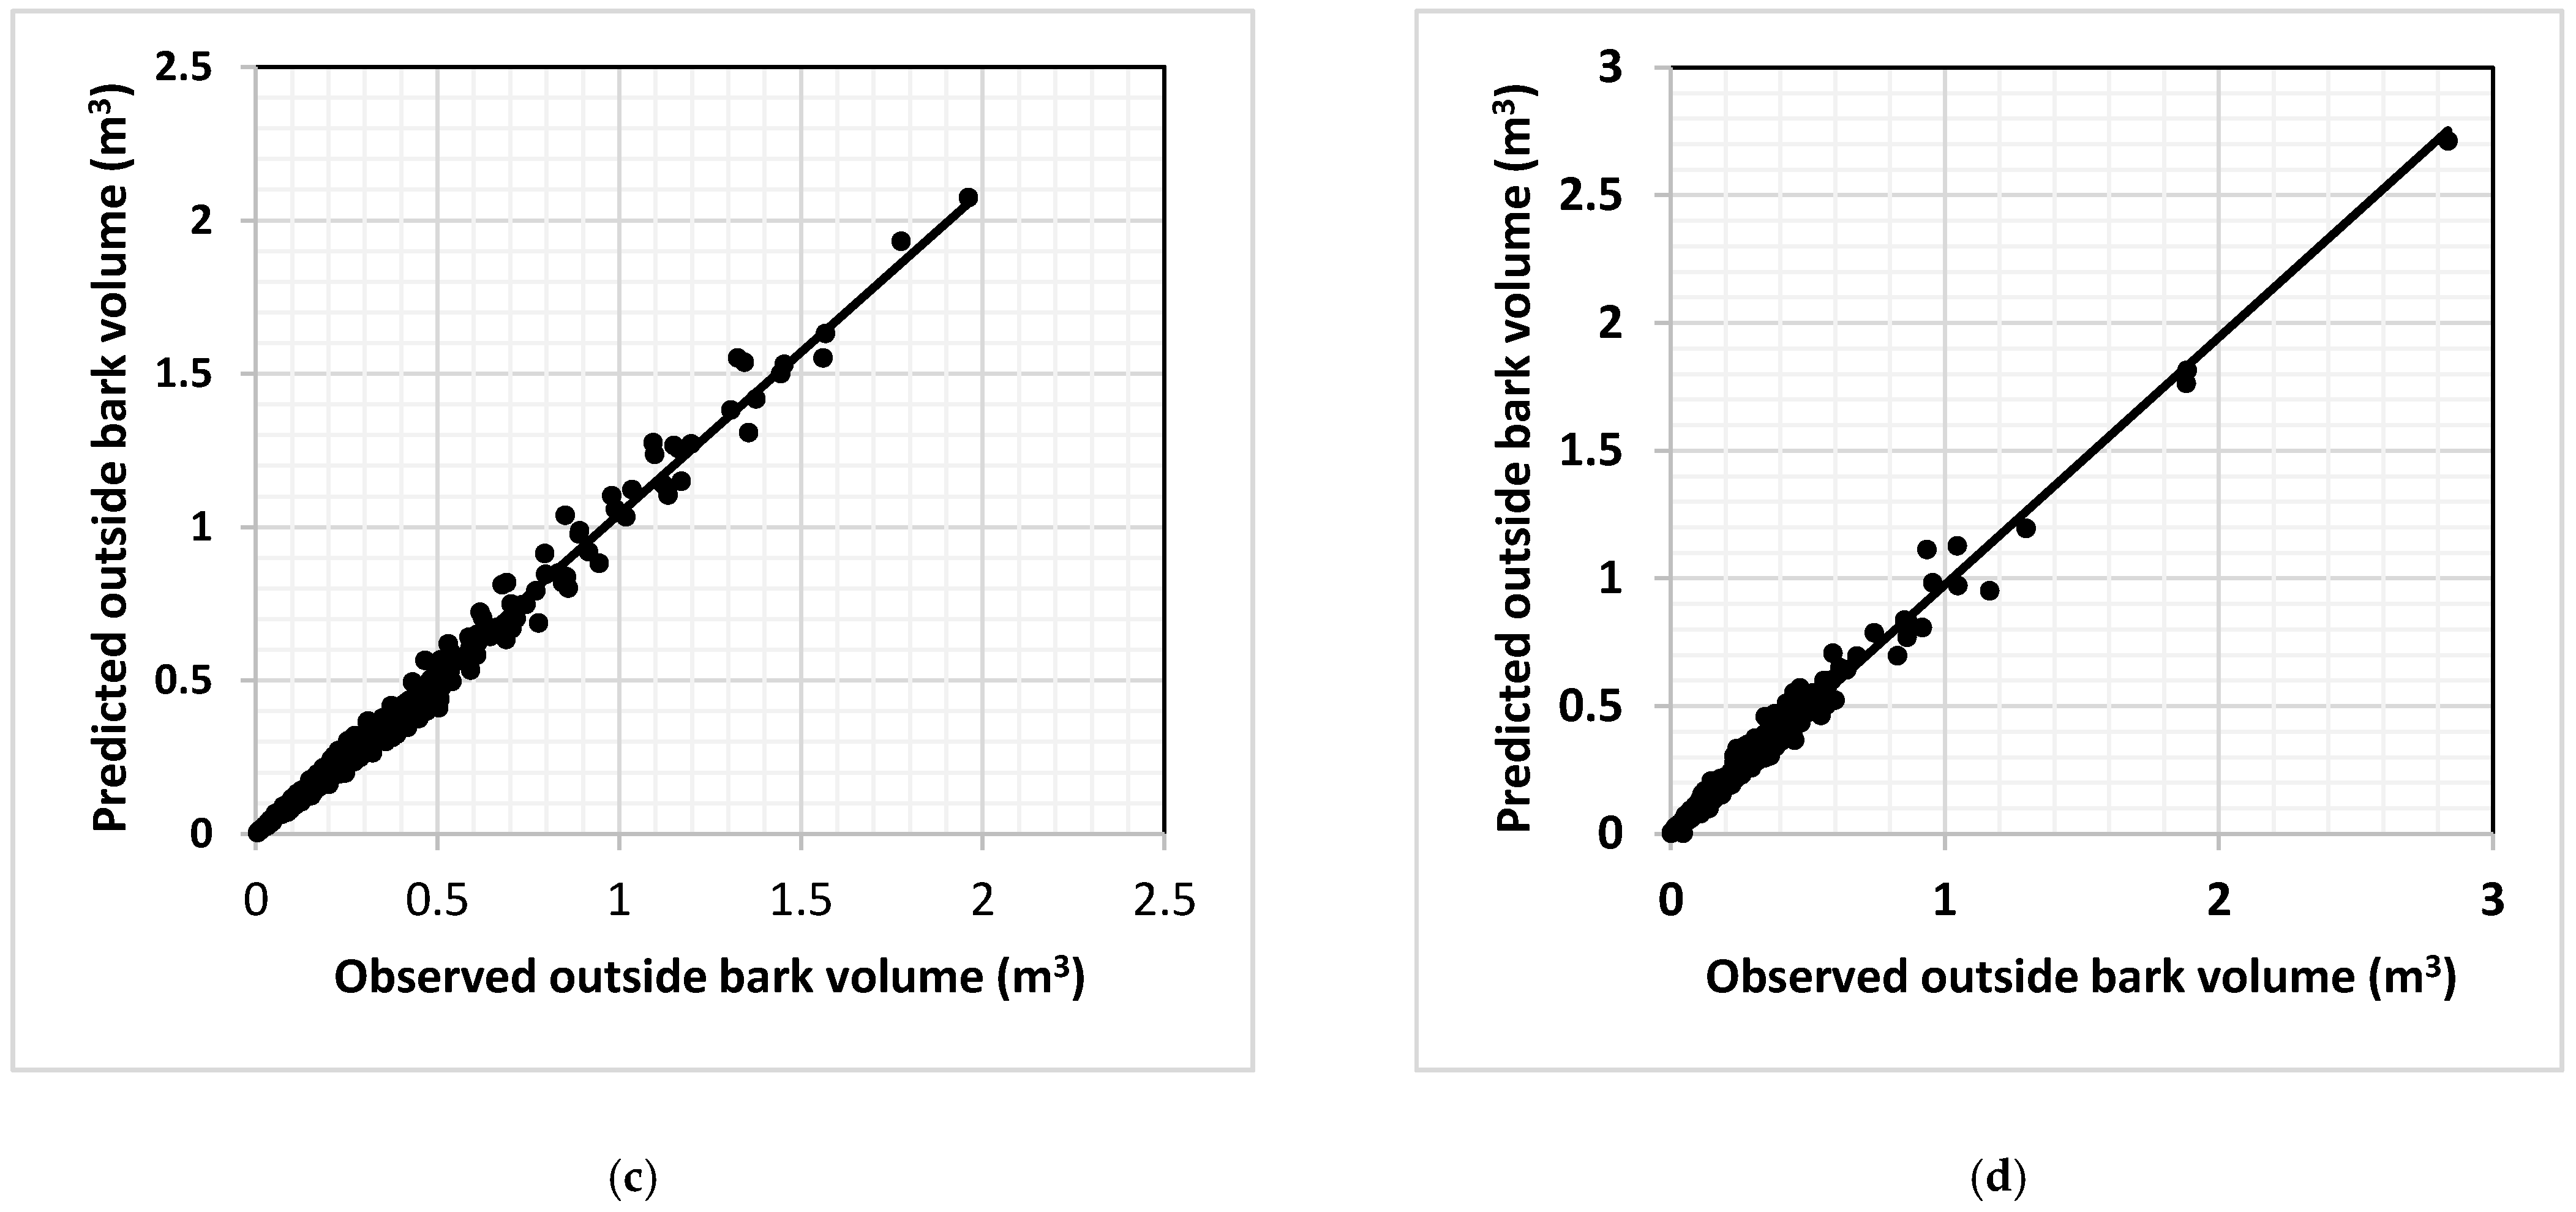
Estimated inside and outside bark volumes were also plotted against their observed counterparts for all tree species. Estimated volumes were randomly clustered around the 1:1 line for both inside (Figure 2) and outside bark (Figure 3) volumes for all tree species. Example plots are included for jack pine, black spruce, balsam fir, and sugar maple representing pine, spruce, fir, and other hardwood species, respectively.
As mentioned, accuracy of Equation (10) was verified by comparing bias, absolute bias, and RMSE in estimating inside bark volumes that resulted from this equation with those obtained using Honer et al.’s [14] equation (Table 5). For four tree species fit with random effect, the random effect was included in calculating bias and RMSE. Except for lodgepole pine and American basswood, bias was substantially lower for Equation (10) than for Honer et al.’s equation. Similarly, absolute bias was smaller for Equation (10) than for Honer et al.’s equation for all species. In addition, RMSE was smaller for Equation (10) than for Honer et al.’s equation for all species except red spruce, trembling aspen, and eastern white cedar.
Bias, absolute bias, and RMSE were also calculated for outside bark and merchantable volumes using Equation (10) for all tree species (Table 6). These numbers for outside bark and merchantable volumes were very small and similar to those for inside bark volumes. Finally, percent bias in estimating inside and outside bark and merchantable volumes was calculated for Equation (10) for all tree species (Table 7). Sugar maple had the largest percent bias for all inside bark (−6.99%), outside bark (−7.17%), and merchantable (−5.34%) volumes. The bias for five species was between 1.0 and 2.5% and for the remaining 19 species was less than 1%. The lowest percent biases were 0.15% for white spruce, −0.04% for black spruce, and −0.03% for red spruce for inside bark, outside bark, and merchantable volumes, respectively.
Overall, the volume equation (Equation (10)) presented here is more accurate than Honer et al.’s equation for estimating inside bark volumes for major commercial tree species in central and eastern Canada and the northeastern United States. Since Equation (10) was developed by incorporating theoretical information about the underlying relationships between dependent and independent variables, this equation should yield consistent results even for the tree species where the sample size used to fit the model was small (especially American beech, basswood and red oak).
Equation (10) was originally derived using a dimensional analysis technique [18] and did not contain an intercept. Therefore, it was dimensionally compatible and was applicable to any system of unit (imperial or metric) without changing the values of all estimated parameters. However, for logically consistent estimates of inside and outside bark and merchantable tree volumes, the intercept was needed as the diameters used to calculate volumes are measured at breast height (1.3 m) but not at the base (butt) of trees. If the diameters were measured at the base, the intercept for the inside and outside bark volumes would have been zero.
The intercept was significant in the regression and was positive for both total inside and outside bark volumes for all tree species. It was also significant but negative for merchantable volumes for all tree species. Therefore, Equation (10) is applicable to another system of measurement units by converting the value of the intercept accordingly. Similarly, all the variables used in the equation should be in the same derived units. As a result, if volume is in cubic feet, DBH and height should both be in feet. As an example, jack pine has the estimated value of the intercept for inside bark volume as 0.00675 (m3) in the metric system. Since the volume of a tree in the imperial system is expressed in cubic feet, Equation (10) can be applied to that system by converting the intercept value (0.00675) to its equivalent in cubic feet (0.238374). Both height and DBH should then be in feet (not inches). The values of the estimates for other parameters will remain the same regardless of the system of units.
Additionally revealed by this study is that the shape of the trees is not a solid described by a cylinder, paraboloid, cone, or neiloid. If the shape were described by one of the solids, the value of β in Equations (3) and (4) would have been close to π/4 (cylinder), π/8 (paraboloid), π/12 (cone), or π/16 (neiloid). Similarly, the exponents of DBH and height would have been close to 2 and 1, respectively, for all solids. The estimated values of β and γ in Equation (10) varied by species.
The minimum and maximum estimates for β were 0.09378 and 0.9485 for balsam poplar and eastern white cedar, respectively, for inside bark and 0.1003 and 1.0823 for Engelmann spruce and European larch, respectively, for outside bark volumes. These numbers are beyond the range of the solids described earlier. However, for most of the tree species, the estimated value of β was within the range between π/4 and π/16 for both inside and outside bark volume equations but was not specific to a particular solid for each species. For example, the 95% confidence interval for β was very wide covering the range between π/8 and π/16 for American basswood and western larch. For European beech, large-tooth aspen, and red spruce, the interval included π/12 and π/16. For the rest of the species, the interval included one of the four values for both inside and outside bark volume equations.
Similarly, the 95% confidence interval for the estimated value of γ was greater than 2 for eastern white cedar and European larch. This interval included 2 for American basswood, balsam fir, paper birch, western larch, balsam poplar, large-tooth aspen, and populus species. For the rest of the species the interval was less than 2 for both inside and outside bark volumes. However, for a mathematically consistent volume equation, the sum of the exponents of DBH and height should always be 3 [18]. Therefore, the estimated value of the exponent for height is 3-. This implies that the exact shape of a tree is unknown and can only be approximated using the data.
4. Conclusions
Two mathematically consistent volume equations (dimensionally compatible and combined variable) were evaluated for 25 commercial tree species grown in natural stands of Canada and northeastern United States. The dimensionally compatible volume equation was superior to the combined variable volume equation in terms of fit statistics (lowest MSE, AIC, and −2 log likelihood) and predictive ability. Therefore, the dimensionally compatible volume equation was selected as the volume equation for these tree species. A nonlinear mixed-effects modelling approach was used to fit the equation for all total inside and outside bark and merchantable volumes.
Random effects and two variance functions (power and exponential) were added to these models, but random effects were significant (introducing the random effects significantly reduced fit statistics) only for four species for total inside and outside bark volumes. A power to DBH resulted in smaller values of fit statistics than an exponential function. Therefore, the power function was used as the variance function for all inside and outside bark and merchantable volumes to address heteroscedasticity in the data for all trees for all species.
Dimensionally compatible volume equation was then compared to Honer et al.’s [14] volume equation for its predictive accuracy in estimating inside bark volumes of all tree species. The dimensionally compatible volume equation resulted in smaller bias than Honer et al.’s equation for most of the tree species used here. This equation is logically consistent as the estimated inside and outside bark tree volumes are greater than zero even for DBH value as zero. Similarly, the estimated value of inside bark volume was smaller than outside bark volume for all trees for all species. As expected, the intercept for merchantable volume was negative for all species. This equation can be used to estimate total inside and outside bark and merchantable volumes of major commercial tree species in central and eastern Canada and northeastern United States. Volume equations resulting in the bias more than ±10% are not recommended to be used in forest management planning.
Funding
This research received no external funding.
Institutional Review Board Statement
Not applicable.
Informed Consent Statement
Not applicable.
Data Availability Statement
Data compiled by Zakrzewski and Schnekenburger [19] was used in this study.
Acknowledgments
This study was supported by the Ontario Ministry of Natural Resources and Forestry. The author is grateful to Lisa Buse (OFRI) for editing an earlier version of the manuscript.
Conflicts of Interest
The author declare no conflict of interest.
References
- Sharma, M. Inside and outside bark volume models for jack pine (Pinus banksiana) and black spruce (Picea mariana) plantations in Ontario, Canada. For. Chron. 2019, 95, 50–57. [Google Scholar] [CrossRef]
- Sharma, M. Increasing volumetric prediction accuracy-An essential prerequisite for end-product forecasting in red pine. Forests 2020, 11, 1050. [Google Scholar] [CrossRef]
- Burkhart, H.E.; Tome, M. Modeling Forest Trees and Stands; Springer: Dordrecht, NL, USA, 2012; 457p. [Google Scholar]
- Temesgen, H.; Affleck, D.; Poudel, K.; Gray, A.; Sessions, J. A review of the challenges and opportunities in estimating above ground forest biomass using tree-level models. Scand. J. For. Res. 2015, 30, 326–335. [Google Scholar] [CrossRef]
- Poudel, K.P.; Temesgen, H. Methods for estimating aboveground biomass and its components for Douglas-fir and lodgepole pine trees. Can. J. For. Res. 2015, 46, 77–87. [Google Scholar] [CrossRef] [Green Version]
- Schlesinger, W.H. Biogeochemistry, an Analysis of Global Change; Academic Press: New York, NY, USA, 1991; p. 688. [Google Scholar]
- Sharma, M.; Parton, J. Modeling stand density effects on taper for jack pine and black spruce plantations using dimensional analysis. For. Sci. 2009, 55, 268–282. [Google Scholar]
- Garber, S.M.; Maguire, D.A. Modeling stem taper of three central Oregon species using nonlinear mixed effects models and autoregressive error structures. For. Ecol. Manag. 2003, 179, 507–522. [Google Scholar] [CrossRef]
- Bluhm, A.A.; Garber, S.M.; Hibbs, D.F. Taper Equation and Volume Tables for Plantation-Grown Red Alder; General Technical Report. PNW-GTR-735; U.S. Department of Agriculture, Forest Service, Pacific Northwest Research Station: Portland, OR, USA, 2007; 74p. [Google Scholar]
- Hilt, D.E.; Dale, M.E. Stem Form Changes in Upland Oaks after Thinning; Res. Pap. NE-433; U.S. Department of Agriculture, Forest Service, Northeastern Forest Experiment Station: Broomall, PA, USA, 1979; 7p. [Google Scholar]
- Larson, P.R. Stem form development of forest trees. For. Sci. Monogr. 1963, 5, 41. [Google Scholar] [CrossRef]
- Valenti, M.A.; Cao, Q.V. A comparison of the effects of one-step and twostep pruning on loblolly pine stem form. South. J. Appl. For. 1986, 10, 251–253. [Google Scholar] [CrossRef] [Green Version]
- Honer, T.G. Standard Volume Tables and Merchantable Conversion Factors for the Commercial Tree Species of Central and Eastern Canada; Info. Rep. FMR-X-5; Forest Management Research and Services Institute: Ottawa, ON, Canada, 1967. [Google Scholar]
- Honer, T.G.; Ker, M.F.; Alemdag, I.S. Metric Timber Tables for the Commercial Tree Species of Central and Eastern Canada; Info. Rep. M-X-140; Canadian Forest Service, Maritimes Forest Research Centre: Fredericton, NB, Canada, 1983. [Google Scholar]
- Shailer, S.; Kershaw, J.A.; Zundel, P. Comparison of Total Volume Equations for Use in Southwestern New Brunswick; Research Report Prepared for Georgia Pacific (The Timber Company): St. Croix, NB, Canada, 1998. [Google Scholar]
- Neily, P.; Quigley, E.; Benjamin, L.; Stewart, B.; Duke, T. Ecological Land Classification for Nova Scotia; Nova Scotia Department of Natural Resources, Renewable Resources Branch: Truro, NS, Canada, 2005; p. 72. [Google Scholar]
- McGrath, T.; Murray, B.; O’Keefe, R. Accuracy of Honer Volume Equations for Balsam Fir in Nova Scotia: Influence of Geographic Location and Pre-Commercial Thinning; Report for 2016-3, No. 97; Nova Scotia Department of Natural Resourses Forest Division: Truro, NS, Canada, 2016. [Google Scholar]
- Sharma, M.; Oderwald, R.G. Dimensionally compatible volume and taper models. Can. J. For. Res. 2001, 31, 797–803. [Google Scholar] [CrossRef]
- Zakrzewski, W.T.; Schnekenburger, F. Stem Data Management System for the Great Lakes Stem Profile Modelling Project; Version 2.0; Forest Research Note No. 57; Ontario Ministry of Natural Resources, Ontario Forest Research Institute: Sault Ste. Marie, ON, Canada, 2006. [Google Scholar]
- Avery, T.E.; Burkhart, H.E. Forest Measurements; McGraw-Hill: New York, NY, USA, 2002; p. 456. [Google Scholar]
- Spurr, S. Forest Inventory; The Ronald Press Company: New York, NY, USA, 1952; p. 476. [Google Scholar]
- SAS Institute Inc. SAS Institute Inc.: Cary, NC, USA, 2015.
- Akaike, H. A Bayesian analysis of the minimum AIC procedure. Ann. Inst. Stat. Math. 1978, 30, 9–14. [Google Scholar] [CrossRef]
- Pinheiro, J.C.; Bates, D.M. Mixed-Effects Models in S and S-PLUS; Springer: New York, NY, USA, 2000; p. 528. [Google Scholar]
Figure 1.
Scatterplots of the ratio of outside bark to inside bark volumes estimated using Equation (10) against inside bark volumes for (a) jack pine, (b) black spruce, (c) balsam fir, and (d) sugar maple.
Figure 1.
Scatterplots of the ratio of outside bark to inside bark volumes estimated using Equation (10) against inside bark volumes for (a) jack pine, (b) black spruce, (c) balsam fir, and (d) sugar maple.


Figure 2.
Predicted inside bark volumes plotted against observed volumes for (a) jack pine, (b) black spruce, (c) balsam fir, and (d) sugar maple trees. The solid line represents the 1:1 line for these tree species.
Figure 2.
Predicted inside bark volumes plotted against observed volumes for (a) jack pine, (b) black spruce, (c) balsam fir, and (d) sugar maple trees. The solid line represents the 1:1 line for these tree species.


Figure 3.
Predicted outside bark volumes plotted against observed volumes for (a) jack pine, (b) black spruce, (c) balsam fir, and (d) sugar maple trees. The solid line represents the 1:1 line for these tree species.
Figure 3.
Predicted outside bark volumes plotted against observed volumes for (a) jack pine, (b) black spruce, (c) balsam fir, and (d) sugar maple trees. The solid line represents the 1:1 line for these tree species.


Table 1.
Summary statistics for diameter at breast height (DBH) and total height of the trees used to develop volume equations in this study (n = number of sampled trees).
Table 1.
Summary statistics for diameter at breast height (DBH) and total height of the trees used to develop volume equations in this study (n = number of sampled trees).
| Species | n | DBH (cm) | Total Height (m) | ||||
|---|---|---|---|---|---|---|---|
| Mean | Minimum | Maximum | Mean | Minimum | Maximum | ||
| Jack pine | 1648 | 16.99 | 3.74 | 43.41 | 14.78 | 5.30 | 28.70 |
| White pine | 1209 | 29.90 | 4.03 | 79.97 | 19.97 | 5.70 | 37.20 |
| Red pine | 1156 | 29.67 | 5.36 | 65.33 | 20.07 | 4.90 | 35.10 |
| Lodgepole pine | 633 | 23.01 | 6.27 | 48.08 | 19.08 | 7.80 | 30.90 |
| Black spruce | 741 | 20.38 | 5.26 | 54.48 | 15.52 | 4.10 | 25.00 |
| White spruce | 734 | 27.17 | 2.86 | 69.04 | 18.91 | 4.50 | 35.80 |
| Red spruce | 220 | 19.95 | 4.52 | 41.40 | 13.24 | 5.90 | 21.50 |
| Engelmann spruce | 205 | 30.21 | 4.98 | 70.50 | 24.11 | 5.90 | 46.80 |
| Balsam fir | 522 | 20.48 | 4.40 | 49.17 | 15.33 | 3.50 | 28.80 |
| Paper birch | 382 | 19.93 | 5.69 | 45.93 | 14.70 | 8.80 | 27.80 |
| Yellow birch | 316 | 25.42 | 3.85 | 77.85 | 14.75 | 8.50 | 26.70 |
| Sugar maple | 503 | 14.51 | 1.12 | 53.85 | 15.62 | 3.35 | 28.80 |
| Populus species | 625 | 24.07 | 8.90 | 47.50 | 20.94 | 8.60 | 30.20 |
| Balsam poplar | 120 | 10.54 | 8.40 | 15.20 | 11.17 | 8.30 | 17.10 |
| Trembling aspen | 105 | 17.60 | 5.78 | 34.24 | 17.86 | 9.60 | 27.40 |
| Large-tooth aspen | 65 | 22.59 | 5.19 | 37.17 | 19.55 | 9.30 | 26.40 |
| White ash | 71 | 14.65 | 3.81 | 44.70 | 15.38 | 6.16 | 23.59 |
| Eastern white cedar | 67 | 23.85 | 18.76 | 30.36 | 13.10 | 10.50 | 16.20 |
| Cedar species | 63 | 15.44 | 5.29 | 36.69 | 10.23 | 5.20 | 17.40 |
| Western larch | 83 | 18.89 | 9.21 | 32.32 | 19.24 | 9.90 | 26.70 |
| European larch | 35 | 24.18 | 13.57 | 42.18 | 20.99 | 13.01 | 28.47 |
| Black cherry | 53 | 16.80 | 5.59 | 31.24 | 16.66 | 9.14 | 23.23 |
| American beech | 35 | 14.77 | 5.33 | 33.53 | 15.66 | 7.68 | 21.61 |
| American basswood | 28 | 19.36 | 3.30 | 62.74 | 15.37 | 6.31 | 31.42 |
| Red oak | 28 | 23.25 | 8.64 | 35.81 | 20.65 | 12.04 | 25.79 |
Table 2.
Parameter estimates (standard error) and fit statistics (MSE (σe2), variance of b (σb2), and AIC (Akaike’s Information Criterion)) of Equation (10) fitted to inside bark volume data using NLMIXED procedure in SAS for 25 tree species used in this study.
Table 2.
Parameter estimates (standard error) and fit statistics (MSE (σe2), variance of b (σb2), and AIC (Akaike’s Information Criterion)) of Equation (10) fitted to inside bark volume data using NLMIXED procedure in SAS for 25 tree species used in this study.
| Species | Parameters | ||||||
|---|---|---|---|---|---|---|---|
| α | β | γ | φ * | σe2 | σb2 | AIC | |
| Jack pine | 0.00675 (0.00009) | 0.1972 (0.0097) | 1.8654 (0.0011) | 5.6033 (0.2101) | 1.4648 | 0.00020 | −10258.0 |
| White pine | 0.00024 (0.00011) | 0.2056 (0.0099) | 1.8864 (0.0112) | 5.7062 (0.1758) | 1.6284 | 0.00016 | −4532.0 |
| Red pine | 0.000506 (0.00025) | 0.1760 (0.0066) | 1.8340 (0.0089) | 1.8906 (0.0367) | 0.00079 | -- | −4284.0 |
| Lodgepole pine | 0.000238 (0.000026) | 0.2293 (0.0136) | 1.8952 (0.0133) | 5.2728 (0.1538) | 1.9901 | -- | −2860.0 |
| Black spruce | 0.00097 (0.00019) | 0.2699 (0.0155) | 1.9431 (0.0131) | 5.1064 (0.1297) | 1.0221 | -- | −4189.0 |
| White spruce | 0.000367 (0.00014) | 0.1890 (0.0136) | 1.8619 (0.0166) | 4.9711 (0.1495) | 1.1377 | -- | −2912.0 |
| Red spruce | 0.00014 (0.000011) | 0.2430 (0.0269) | 1.8974 (0.0260) | 1.8336 (0.1083) | 0.0006 | -- | −1315.0 |
| Engelmann spruce | 0.000378 (0.000035) | 0.1240 (0.0241) | 1.7773 (0.0442) | 1.9353 (0.0824) | 0.0009 | -- | −637.0 |
| Balsam fir | 0.001305 (0.00016) | 0.3532 (0.0305) | 2.0050 (0.0199) | 1.9936 (0.0735) | 0.0007 | -- | −2852.0 |
| Paper birch | 0.00203 (0.00099) | 0.2772 (0.0294) | 1.9611 (0.0249) | 4.5170 (0.2322) | 0.7862 | -- | −1906.0 |
| Yellow birch | 0.00686 (0.00072) | 0.1765 (0.0242) | 1.8754 (0.0337) | 4.7059 (0.2693) | 0.6886 | 0.00032 | −1275.0 |
| Sugar maple | 0.00207 (0.00073) | 0.2390 (0.0216) | 1.9451 (0.0208) | 0.5934 (0.0226) | 0.0006 | -- | −2686.0 |
| Populus species | 0.00010 (0.00001) | 0.3175 (0.0247) | 1.9817 (0.0172) | 5.1072 (0.1272) | 1.6622 | -- | −2817.0 |
| Balsam poplar | 0.00015 (0.000011) | 0.09378 (0.0292) | 1.7360 (0.0666) | 3.6593 (1.1823) | 0.0424 | -- | −1022.0 |
| Trembling aspen | 0.00038 (0.000024) | 0.1685 (0.0413) | 1.8649 (0.0530) | 2.4636 (0.1382) | 0.0009 | -- | −625.8 |
| Large-tooth aspen | 0.00020 (0.00010) | 0.3047 (0.0513) | 1.9938 (0.0365) | 2.4937 (0.2123) | 0.0007 | -- | −303.1 |
| White ash | 0.00089 (0.00019) | 0.1634 (0.0401) | 1.8784 (0.0518) | 2.2544 (0.1397) | 0.0012 | -- | −474.7 |
| Eastern white cedar | 0.01518 (0.00686) | 0.9485 (0.4499) | 2.2870 (0.1349) | 3.0772 (0.5833) | 0.0007 | -- | −345.3 |
| Cedar species | 0.001838 (0.00021) | 0.1316 (0.0281) | 1.7820 (0.0502) | 5.8382 (0.3416) | 1.9182 | -- | −503.3 |
| Western larch | 0.005468 (0.00131) | 0.3545 (0.0870) | 2.0540 (0.0529) | 2.1526 (0.2508) | 0.0007 | -- | −436.5 |
| European larch | 0.02890 (0.00504) | 0.7331 (0.3287) | 2.2227 (0.1023) | 1.2994 (0.4486) | 0.0003 | -- | −160.9 |
| Black cherry | 0.00271 (0.000207) | 0.1257 (0.0448) | 1.8044 (0.0838) | 0.1758 (0.1871) | 0.0003 | -- | −272.6 |
| American beech | 0.00020 (0.000011) | 0.1572 (0.0547) | 1.8422 (0.0736) | 4.3307 (0.5605) | 0.6370 | -- | −214.4 |
| American basswood | 0.00029 (0.00012) | 0.2710 (0.1125) | 1.9887 (0.0894) | 5.8579 (0.2693) | 10.9818 | 0.00033 | −150.1 |
| Red oak | 0.002617 (0.00125) | 0.1119 (0.0438) | 1.7637 (0.0898) | 3.2168 (0.7669) | 0.0675 | -- | −124.9 |
* Weight (power of DBH (m)). Note: Before using these estimates, covert DBH to m.
Table 3.
Parameter estimates (standard error) and fit statistics (MSE (σe2), variance of b (σb2), and AIC (Akaike’s Information Criterion)) of Equation (10) fitted to outside bark volume data using NLMIXED procedure in SAS for 25 tree species used in this study.
Table 3.
Parameter estimates (standard error) and fit statistics (MSE (σe2), variance of b (σb2), and AIC (Akaike’s Information Criterion)) of Equation (10) fitted to outside bark volume data using NLMIXED procedure in SAS for 25 tree species used in this study.
| Species | Parameters | ||||||
|---|---|---|---|---|---|---|---|
| α | β | γ | φ * | σe2 | σb2 | AIC | |
| Jack pine | 0.00145 (0.00014) | 0.2047 (0.0041) | 1.8529 (0.0046) | 4.4525 (0.0001) | 0.00001 | 0.00073 | −9587.0 |
| White pine | 0.00429 (0.00001) | 0.3801 (0.0099) | 2.0166 (0.0112) | 5.0449 (0.1758) | 0.00001 | 0.00058 | −4212.0 |
| Red pine | 0.002002 (0.00032) | 0.2133 (0.0077) | 1.8505 (0.0086) | 1.7698 (0.0345) | 0.00093 | -- | −4134.0 |
| Lodgepole pine | 0.001438 (0.00050) | 0.2651 (0.0166) | 1.9095 (0.0140) | 5.4547 (0.1634) | 3.5581 | -- | −2668.0 |
| Black spruce | 0.002755 (0.00039) | 0.2691 (0.0165) | 1.9174 (0.0143) | 4.1445 (0.1192) | 0.3226 | -- | −3853.0 |
| White spruce | 0.001078 (0.00023) | 0.1792 (0.0123) | 1.8261 (0.0159) | 4.6454 (0.1500) | 0.8569 | -- | −2786.0 |
| Red spruce | 0.000479 (0.00020) | 0.3119 (0.0379) | 1.9279 (0.0290) | 1.9562 (0.1071) | 0.0009 | -- | −1270.0 |
| Engelmann spruce | 0.001463 (0.00040) | 0.1003 (0.0191) | 1.7093 (0.0432) | 1.9030 (0.0892) | 0.0010 | -- | −612.8 |
| Balsam fir | 0.001619 (0.00016) | 0.4148 (0.0346) | 2.0152 (0.0192) | 2.0515 (0.0722) | 0.0009 | -- | −2752.0 |
| Paper birch | 0.00288 (0.00099) | 0.3306 (0.0322) | 1.9756 (0.0229) | 4.6274 (0.2304) | 0.9907 | -- | −1888.0 |
| Yellow birch | 0.00846 (0.00069) | 0.2568 (0.0332) | 1.9386 (0.0317) | 4.8721 (0.2696) | 1.0349 | 0.00028 | −1275 |
| Sugar maple | 0.00285 (0.00081) | 0.3176 (0.0294) | 1.9853 (0.0213) | 0.6112 (0.0222) | 0.0008 | -- | −2565.0 |
| Populus species | 0.00104 (0.00050) | 0.3117 (0.0328) | 1.9477 (0.0238) | 4.9836 (0.1233) | 1.3612 | -- | −2821.0 |
| Balsam poplar | 0.001095 (0.00013) | 0.1740 (0.0541) | 1.8287 (0.0687) | 3.86173 (1.1505) | 0.2266 | -- | −989.0 |
| Trembling aspen | 0.00039 (0.00002) | 0.1731 (0.0381) | 1.8408 (0.0471) | 6.4200 (0.2283) | 17.8453 | -- | −613.5 |
| Large-tooth aspen | 0.000952 (0.00044) | 0.2466 (0.0672) | 1.9154 (0.0610) | 2.2766 (0.2301) | 0.0010 | -- | −273.6 |
| White ash | 0.00142 (0.00036) | 0.2157 (0.0542) | 1.9032 (0.0531) | 5.1083 (0.3269) | 2.5381 | -- | −452.8 |
| Eastern white cedar | 0.02196 (0.00707) | 0.6797 (0.3188) | 2.1667 (0.1199) | 3.7882 (0.6199) | 0.0011 | -- | −335.2 |
| Cedar species | 0.002455 (0.00025) | 0.2188 (0.0475) | 1.8734 (0.0510) | 5.8241 (0.3519) | 2.4155 | -- | −486.1 |
| Western larch | 0.01454 (0.00129) | 0.1481 (0.0390) | 1.8363 (0.0613) | 2.2982 (0.2046) | 0.0011 | -- | −221.9 |
| European larch | 0.04685 (0.00584) | 1.0823 (0.6490) | 2.2723 (0.1337) | 1.7556 (0.5374) | 0.0005 | -- | −146.1 |
| Black cherry | 0.00221 (0.00027) | 0.1396 (0.0495) | 1.8018 (0.0834) | 0.4692 (0.4579) | 0.0008 | -- | −260.8 |
| American beech | 0.00020 (0.00001) | 0.1519 (0.0539) | 1.8200 (0.0747) | 4.4480 (0.5630) | 0.9685 | -- | −208.0 |
| American basswood | 0.00075 (0.00036) | 0.3202 (0.1341) | 1.9868 (0.0926) | 9.1932 (2.5532) | 24.7618 | 0.00053 | −143.7 |
| Red oak | 0.004630 (0.00221) | 0.1049 (0.0438) | 1.7239 (0.0956) | 3.4654 (0.7458) | 0.1359 | -- | −124.9 |
* Weight (power of DBH (m)). Note: Before using these estimates, covert DBH to m.
Table 4.
Parameter estimates (standard error) and fit statistics (MSE (σe2) and AIC (Akaike’s Information Criterion)) of Equation (10) fitted to merchantable volume data using NLMIXED procedure in SAS for 25 tree species used in this study.
Table 4.
Parameter estimates (standard error) and fit statistics (MSE (σe2) and AIC (Akaike’s Information Criterion)) of Equation (10) fitted to merchantable volume data using NLMIXED procedure in SAS for 25 tree species used in this study.
| Species | Parameters | |||||
|---|---|---|---|---|---|---|
| α | β | γ | φ * | σe2 | AIC | |
| Jack pine | −0.00592 (0.0002) | 0.2015 (0.01105) | 1.8737 (0.0124) | 1.4828 (0.0277) | 0.0007 | −9665.0 |
| White pine | −0.00689 (0.0003) | 0.1727 (0.0106) | 1.8525 (0.0146) | 1.6042 (0.0261) | 0.0014 | −4017.0 |
| Red pine | −0.00838 (0.0004) | 0.1603 (0.0068) | 1.8159 (0.0101) | 1.5847 (0.0291) | 0.0010 | −4085.0 |
| Lodgepole pine | −0.01230 (0.0009) | 0.2046 (0.0156) | 1.8712 (0.0174) | 4.1662 (0.1453) | 0.5132 | −2647.0 |
| Black spruce | −0.00650 (0.0004) | 0.26621 (0.0175) | 1.9458 (0.0153) | 3.8646 (0.1075) | 0.1910 | −3895.0 |
| White spruce | −0.00274 (0.0003) | 0.1848 (0.0139) | 1.8664 (0.0177) | 4.0182 (0.0983) | 0.3434 | −2813.0 |
| Red spruce | −0.00648 (0.0006) | 0.2382 (0.0347) | 1.9009 (0.0355) | 1.2973 (0.0906) | 0.0006 | −1219.0 |
| Engelmann spruce | −0.00610 (0.0005) | 0.1198 (0.0250) | 1.7751 (0.0477) | 1.7295 (0.0674) | 0.0011 | −605.5 |
| Balsam fir | −0.00529 (0.0006) | 0.3135 (0.0368) | 1.9876 (0.0276) | 1.2835 (0.0540) | 0.0007 | −2664.0 |
| Paper birch | −0.00718 (0.0013) | 0.1821 (0.02115) | 1.8754 (0.0276) | 3.8797 (0.2192) | 0.3155 | −1844.0 |
| Yellow birch | −0.00418 (0.0012) | 0.1151 (0.0178) | 1.7836 (0.0387) | 1.7338 (0.0758) | 0.0019 | −1209.0 |
| Sugar maple | −0.00519 (0.00076) | 0.2702 (0.0263) | 1.9821 (0.0225) | 0.6019 (0.0245) | 0.0007 | −2661.0 |
| Populus species | −0.01060 (0.0005) | 0.2599 (0.0331) | 1.9387 (0.0288) | 4.7496 (0.1227) | 1.0729 | −2745.0 |
| Balsam poplar | −0.01312 (0.0013) | 0.1608 (0.0703) | 1.8351 (0.0962) | 2.7787 (1.5131) | 0.0084 | −989.0 |
| Trembling aspen | −0.01339 (0.0009) | 0.1301 (0.0375) | 1.8067 (0.0626) | 4.8477 (0.2925) | 1.2805 | −590.4 |
| Large-tooth aspen | −0.00885 (0.0011) | 0.2334 (0.0419) | 1.9377 (0.0483) | 1.7908 (0. 3626) | 0.0008 | −283.1 |
| White ash | −0.00835 (0.0014) | 0.1951 (0.05428) | 1.9277 (0.0531) | 2.2796 (0.3269) | 0.0123 | −426.4 |
| Eastern white cedar | −0.00021 (0.00009) | 0.5431 (0.2497) | 2.1441 (0.1142) | 2.7498 (0.6252) | 0.0006 | −354.4 |
| Cedar species | −0.00538 (0.0003) | 0.2055 (0.0696) | 1.9006 (0.0813) | 1.9552 (0.1355) | 0.1101 | −455.3 |
| Western larch | −0.00101 (0.00017) | 0.6226 (0.2117) | 2.1812 (0.0732) | 1.7970 (0.2614) | 0.0008 | −413.2 |
| European larch | −0.00019 (0.00002) | 0.3479 (0.0900) | 2.0431 (0.0590) | 0.3302 (0.4049) | 0.0005 | −154.8 |
| Black cherry | −0.01272 (0.0025) | 0.0992 (0.0328) | 1.7514 (0.0752) | 0.9577 (0.2244) | 0.0004 | −295.5 |
| American beech | -0.01211 (0.0018) | 0.1114 (0.0500) | 1.7662 (0.0993) | 3.6768 (0.6997) | 0.2099 | −205.1 |
| American basswood | −0.00127 (0.0004) | 5.2555 (0.5402) | 2.7049 (0.2339) | 5.3493 (0.4157) | 11.7260 | −121.7 |
| Red oak | −0.00858 (0.00055) | 0.07959 (0.0419) | 1.6952 (0.1209) | 3.2073 (0.7366) | 0.1096 | −111.0 |
* Weight (power of DBH (m)). Note: Before using these estimates, convert DBH to m.
Table 5.
Mean bias (observed−predicted), absolute bias (AB), and root mean square error (RMSE) of the residuals from inside bark volume equation (Equation (10)) and Honer et al.’s [14] model for 25 tree species used in this study.
Table 5.
Mean bias (observed−predicted), absolute bias (AB), and root mean square error (RMSE) of the residuals from inside bark volume equation (Equation (10)) and Honer et al.’s [14] model for 25 tree species used in this study.
| Species | n | Equation (10) | Honer’s Model | ||||
|---|---|---|---|---|---|---|---|
| Bias (m) | AB (m) | RMSE | Bias (m) | AB (m) | RMSE | ||
| Jack pine | 1648 | −0.00069 | 0.01334 | 0.02353 | −0.00091 | 0.01552 | 0.02647 |
| White pine | 1209 | −0.02593 | 0.06321 | 0.11587 | −0.02663 | 0.06363 | 0.11400 |
| Red pine | 1156 | 0.00278 | 0.04857 | 0.08415 | 0.00166 | 0.05817 | 0.09464 |
| Lodgepole pine | 633 | −0.00597 | 0.02904 | 0.04869 | 0.00226 | 0.02903 | 0.04522 |
| Black spruce | 741 | −0.00208 | 0.01808 | 0.03075 | 0.01394 | 0.02091 | 0.03535 |
| White spruce | 734 | 0.01296 | 0.04372 | 0.07802 | 0.02735 | 0.05067 | 0.09008 |
| Red spruce | 220 | −0.00409 | 0.01471 | 0.02342 | −0.00433 | 0.01486 | 0.02264 |
| Engelmann spruce | 205 | 0.00558 | 0.07140 | 0.13619 | -- | -- | -- |
| Balsam fir | 522 | −0.00618 | 0.01854 | 0.03419 | 0.01117 | 0.02060 | 0.03723 |
| Paper birch | 382 | −0.00486 | 0.02304 | 0.03849 | −0.01962 | 0.02677 | 0.04536 |
| Yellow birch | 316 | 0.01052 | 0.04163 | 0.07691 | −0.08459 | 0.08795 | 0.16338 |
| Sugar maple | 503 | −0.00064 | 0.01279 | 0.02426 | −0.01744 | 0.02101 | 0.03251 |
| Populus species | 625 | 0.00179 | 0.03322 | 0.05157 | 0.01175 | 0.03886 | 0.05821 |
| Balsam poplar | 120 | 0.00001 | 0.00268 | 0.00348 | −0.00469 | 0.00502 | 0.00636 |
| Trembling aspen | 105 | −0.00127 | 0.01937 | 0.03368 | −0.01436 | 0.02161 | 0.00787 |
| Large-tooth aspen | 65 | −0.00008 | 0.02999 | 0.04450 | -- | -- | -- |
| White ash | 71 | 0.00357 | 0.01281 | 0.04449 | -- | -- | -- |
| Eastern white cedar | 67 | −0.00138 | 0.01448 | 0.02129 | −0.01026 | 0.01499 | 0.01978 |
| Cedar species | 63 | 0.00122 | 0.00940 | 0.01881 | -- | -- | -- |
| Western larch | 83 | −0.00394 | 0.01814 | 0.02568 | 0.01063 | 0.06343 | 0.02820 |
| European larch | 35 | 0.00053 | 0.01898 | 0.02527 | -- | -- | -- |
| Black cherry | 53 | −0.00015 | 0.01234 | 0.01697 | −0.03726 | 0.03749 | 0.05619 |
| American beech | 35 | 0.00042 | 0.01222 | 0.01979 | −0.02471 | 0.02701 | 0.05220 |
| American basswood | 28 | 0.00921 | 0.06858 | 0.18826 | −0.00687 | 0.07288 | 0.18945 |
| Red oak | 28 | −0.00002 | 0.02236 | 0.02827 | 0.00526 | 0.02734 | 0.03582 |
Table 6.
Mean bias (observed−predicted), absolute mean bias (AB), and root mean square error (RMSE) of the residuals for outside bark and merchantable volumes using Equation (10) for 25 tree species grown in Canada and the northeastern United States.
Table 6.
Mean bias (observed−predicted), absolute mean bias (AB), and root mean square error (RMSE) of the residuals for outside bark and merchantable volumes using Equation (10) for 25 tree species grown in Canada and the northeastern United States.
| Species | n | Outside Bark Volume | Merchantable Volume | ||||
|---|---|---|---|---|---|---|---|
| Bias (m) | AB (m) | RMSE | Bias (m) | AB (m) | RMSE | ||
| Jack pine | 1648 | −0.00209 | 0.01305 | 0.02336 | −0.00023 | 0.01436 | 0.02433 |
| White pine | 1209 | −0.02417 | 0.06721 | 0.12098 | 0.01724 | 0.06552 | 0.11132 |
| Red pine | 1156 | −0.00400 | 0.04879 | 0.08354 | −0.00467 | 0.04884 | 0.08485 |
| Lodgepole pine | 633 | −0.01007 | 0.03460 | 0.05857 | −0.00413 | 0.03080 | 0.05061 |
| Black spruce | 741 | 0.00136 | 0.01986 | 0.03380 | 0.00137 | 0.01921 | 0.03193 |
| White spruce | 734 | 0.01254 | 0.04484 | 0.07978 | 0.00469 | 0.04216 | 0.07246 |
| Red spruce | 220 | −0.00566 | 0.01681 | 0.02708 | −0.00118 | 0.01547 | 0.02256 |
| Engelmann spruce | 205 | −0.01111 | 0.07304 | 0.13491 | −0.00166 | 0.07278 | 0.13855 |
| Balsam fir | 522 | −0.00819 | 0.02101 | 0.04005 | 0.00137 | 0.01813 | 0.02981 |
| Paper birch | 382 | −0.00506 | 0.02371 | 0.04045 | −0.00268 | 0.02269 | 0.03629 |
| Yellow birch | 316 | 0.01050 | 0.04439 | 0.08435 | −0.00990 | 0.04208 | 0.07539 |
| Sugar maple | 503 | 0.00076 | 0.01463 | 0.02818 | 0.00115 | 0.01611 | 0.02668 |
| Populus species | 625 | 0.00041 | 0.03340 | 0.05294 | 0.00059 | 0.03471 | 0.05368 |
| Balsam poplar | 120 | −0.00002 | 0.00306 | 0.00400 | −0.00001 | 0.00311 | 0.00413 |
| Trembling aspen | 105 | 0.00442 | 0.02175 | 0.03863 | −0.00190 | 0.01897 | 0.03140 |
| Large-tooth aspen | 65 | −0.00351 | 0.03388 | 0.05180 | 0.00061 | 0.02952 | 0.04306 |
| White ash | 71 | 0.00487 | 0.01637 | 0.05636 | 0.00013 | 0.01060 | 0.01422 |
| Eastern white cedar | 67 | −0.00199 | 0.01560 | 0.02410 | −0.00314 | 0.01383 | 0.01964 |
| Cedar species | 63 | −0.00252 | 0.01058 | 0.02188 | −0.00204 | 0.01163 | 0.02113 |
| Western larch | 83 | 0.00976 | 0.02278 | 0.09583 | −0.00234 | 0.01917 | 0.02636 |
| European larch | 35 | −0.00476 | 0.02536 | 0.04073 | 0.00360 | 0.01954 | 0.02390 |
| Black cherry | 53 | 0.00029 | 0.01363 | 0.01904 | 0.00002 | 0.01280 | 0.01591 |
| American beech | 35 | −0.00029 | 0.01290 | 0.02100 | −0.00047 | 0.01285 | 0.01942 |
| American basswood | 28 | −0.00202 | 0.07277 | 0.20626 | −0.04242 | 0.11391 | 0.28087 |
| Red oak | 28 | 0.00008 | 0.02652 | 0.03469 | 0.00002 | 0.02750 | 0.03698 |
Table 7.
Percent bias (observed−predicted) of the residuals for inside bark, outside bark, and merchantable volumes using Equation (10) for 25 tree species grown in Canada and the northeastern United States.
Table 7.
Percent bias (observed−predicted) of the residuals for inside bark, outside bark, and merchantable volumes using Equation (10) for 25 tree species grown in Canada and the northeastern United States.
| Species | n | Percent Bias | ||
|---|---|---|---|---|
| Inside bark | Outside Bark | Merchantable | ||
| Jack pine | 1648 | −0.7286 | −0.3693 | −0.3782 |
| White pine | 1209 | −0.9797 | −0.2919 | 0.5099 |
| Red pine | 1156 | 0.5368 | −0.3410 | −0.0544 |
| Lodgepole pine | 633 | −0.2668 | −0.3652 | −0.6476 |
| Black spruce | 741 | −0.3217 | 0.0388 | 0.3848 |
| White spruce | 734 | 0.1469 | 0.7651 | 0.1295 |
| Red spruce | 220 | −0.3236 | −0.4522 | −0.0350 |
| Engelmann spruce | 205 | 0.7439 | −0.5964 | −0.7005 |
| Balsam fir | 522 | −0.6352 | −0.7131 | 0.4021 |
| Paper birch | 382 | −0.3479 | −0.2716 | −0.3625 |
| Yellow birch | 316 | 0.9806 | 1.0656 | −1.0302 |
| Sugar maple | 503 | −6.9949 | −7.1763 | −5.3495 |
| Populus species | 625 | 0.9117 | 0.6005 | 0.5748 |
| Balsam poplar | 120 | 1.0300 | −0.6520 | −0.5743 |
| Trembling aspen | 105 | −0.8166 | 0.8343 | −0.2798 |
| Large-tooth aspen | 65 | −0.7939 | −1.1874 | 0.7728 |
| White ash | 71 | 0.9794 | 0.7674 | 1.8667 |
| Eastern white cedar | 67 | −0.7527 | −0.8386 | −0.8030 |
| Cedar species | 63 | 0.5076 | −0.5401 | −0.3087 |
| Western larch | 83 | −1.0877 | 0.9132 | −0.4045 |
| European larch | 35 | 0.3535 | −0.2593 | 1.9135 |
| Black cherry | 53 | −1.9675 | 1.4969 | 0.4759 |
| American beech | 35 | 2.7471 | −2.4813 | −2.2827 |
| American basswood | 28 | −2.2615 | −2.4520 | −1.2664 |
| Red oak | 28 | −0.5860 | 0.5663 | 0.6632 |
Publisher’s Note: MDPI stays neutral with regard to jurisdictional claims in published maps and institutional affiliations. |
© 2021 by the author. Licensee MDPI, Basel, Switzerland. This article is an open access article distributed under the terms and conditions of the Creative Commons Attribution (CC BY) license (https://creativecommons.org/licenses/by/4.0/).
Share and Cite
MDPI and ACS Style
Sharma, M. Total and Merchantable Volume Equations for 25 Commercial Tree Species Grown in Canada and the Northeastern United States. Forests 2021, 12, 1270. https://doi.org/10.3390/f12091270
AMA Style
Sharma M. Total and Merchantable Volume Equations for 25 Commercial Tree Species Grown in Canada and the Northeastern United States. Forests. 2021; 12(9):1270. https://doi.org/10.3390/f12091270
Chicago/Turabian StyleSharma, Mahadev. 2021. "Total and Merchantable Volume Equations for 25 Commercial Tree Species Grown in Canada and the Northeastern United States" Forests 12, no. 9: 1270. https://doi.org/10.3390/f12091270
Note that from the first issue of 2016, this journal uses article numbers instead of page numbers. See further details here.