
Development of Mangrove Sediment Quality Index in Matang Mangrove Forest Reserve, Malaysia: A Synergetic Approach

 ,
,  ,
,
Abstract
:1. Introduction
2. Materials and Methods
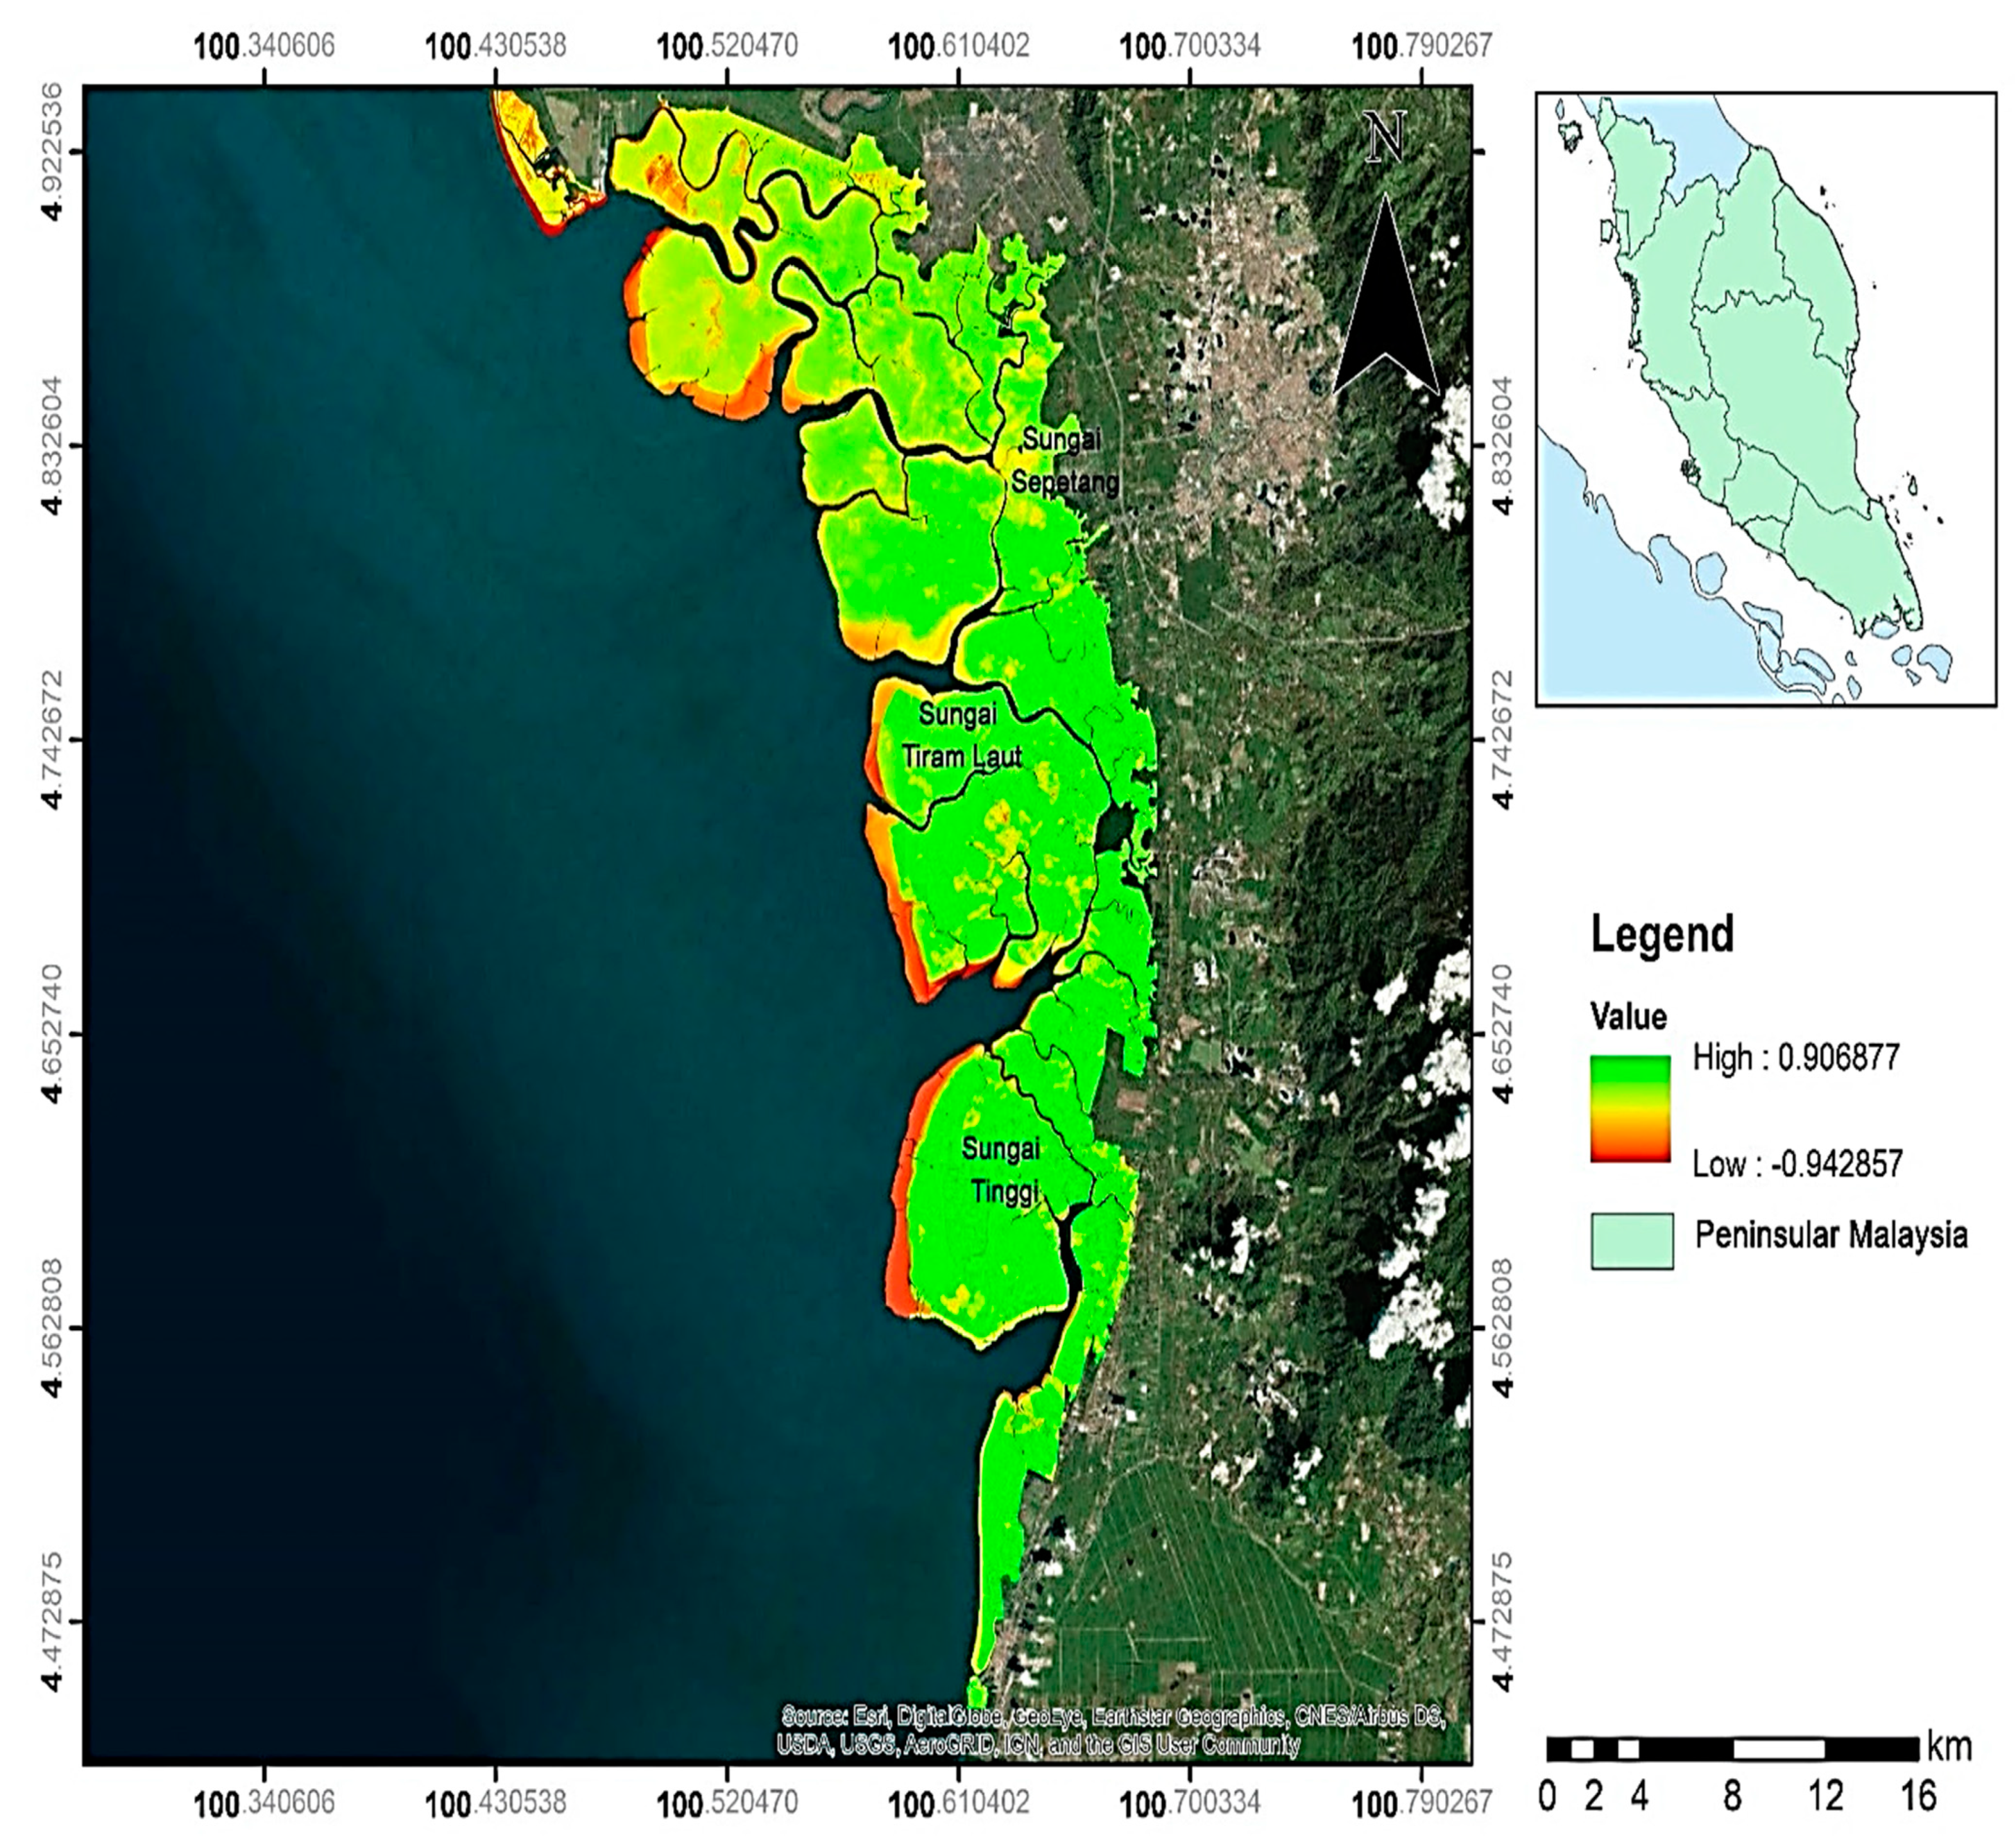
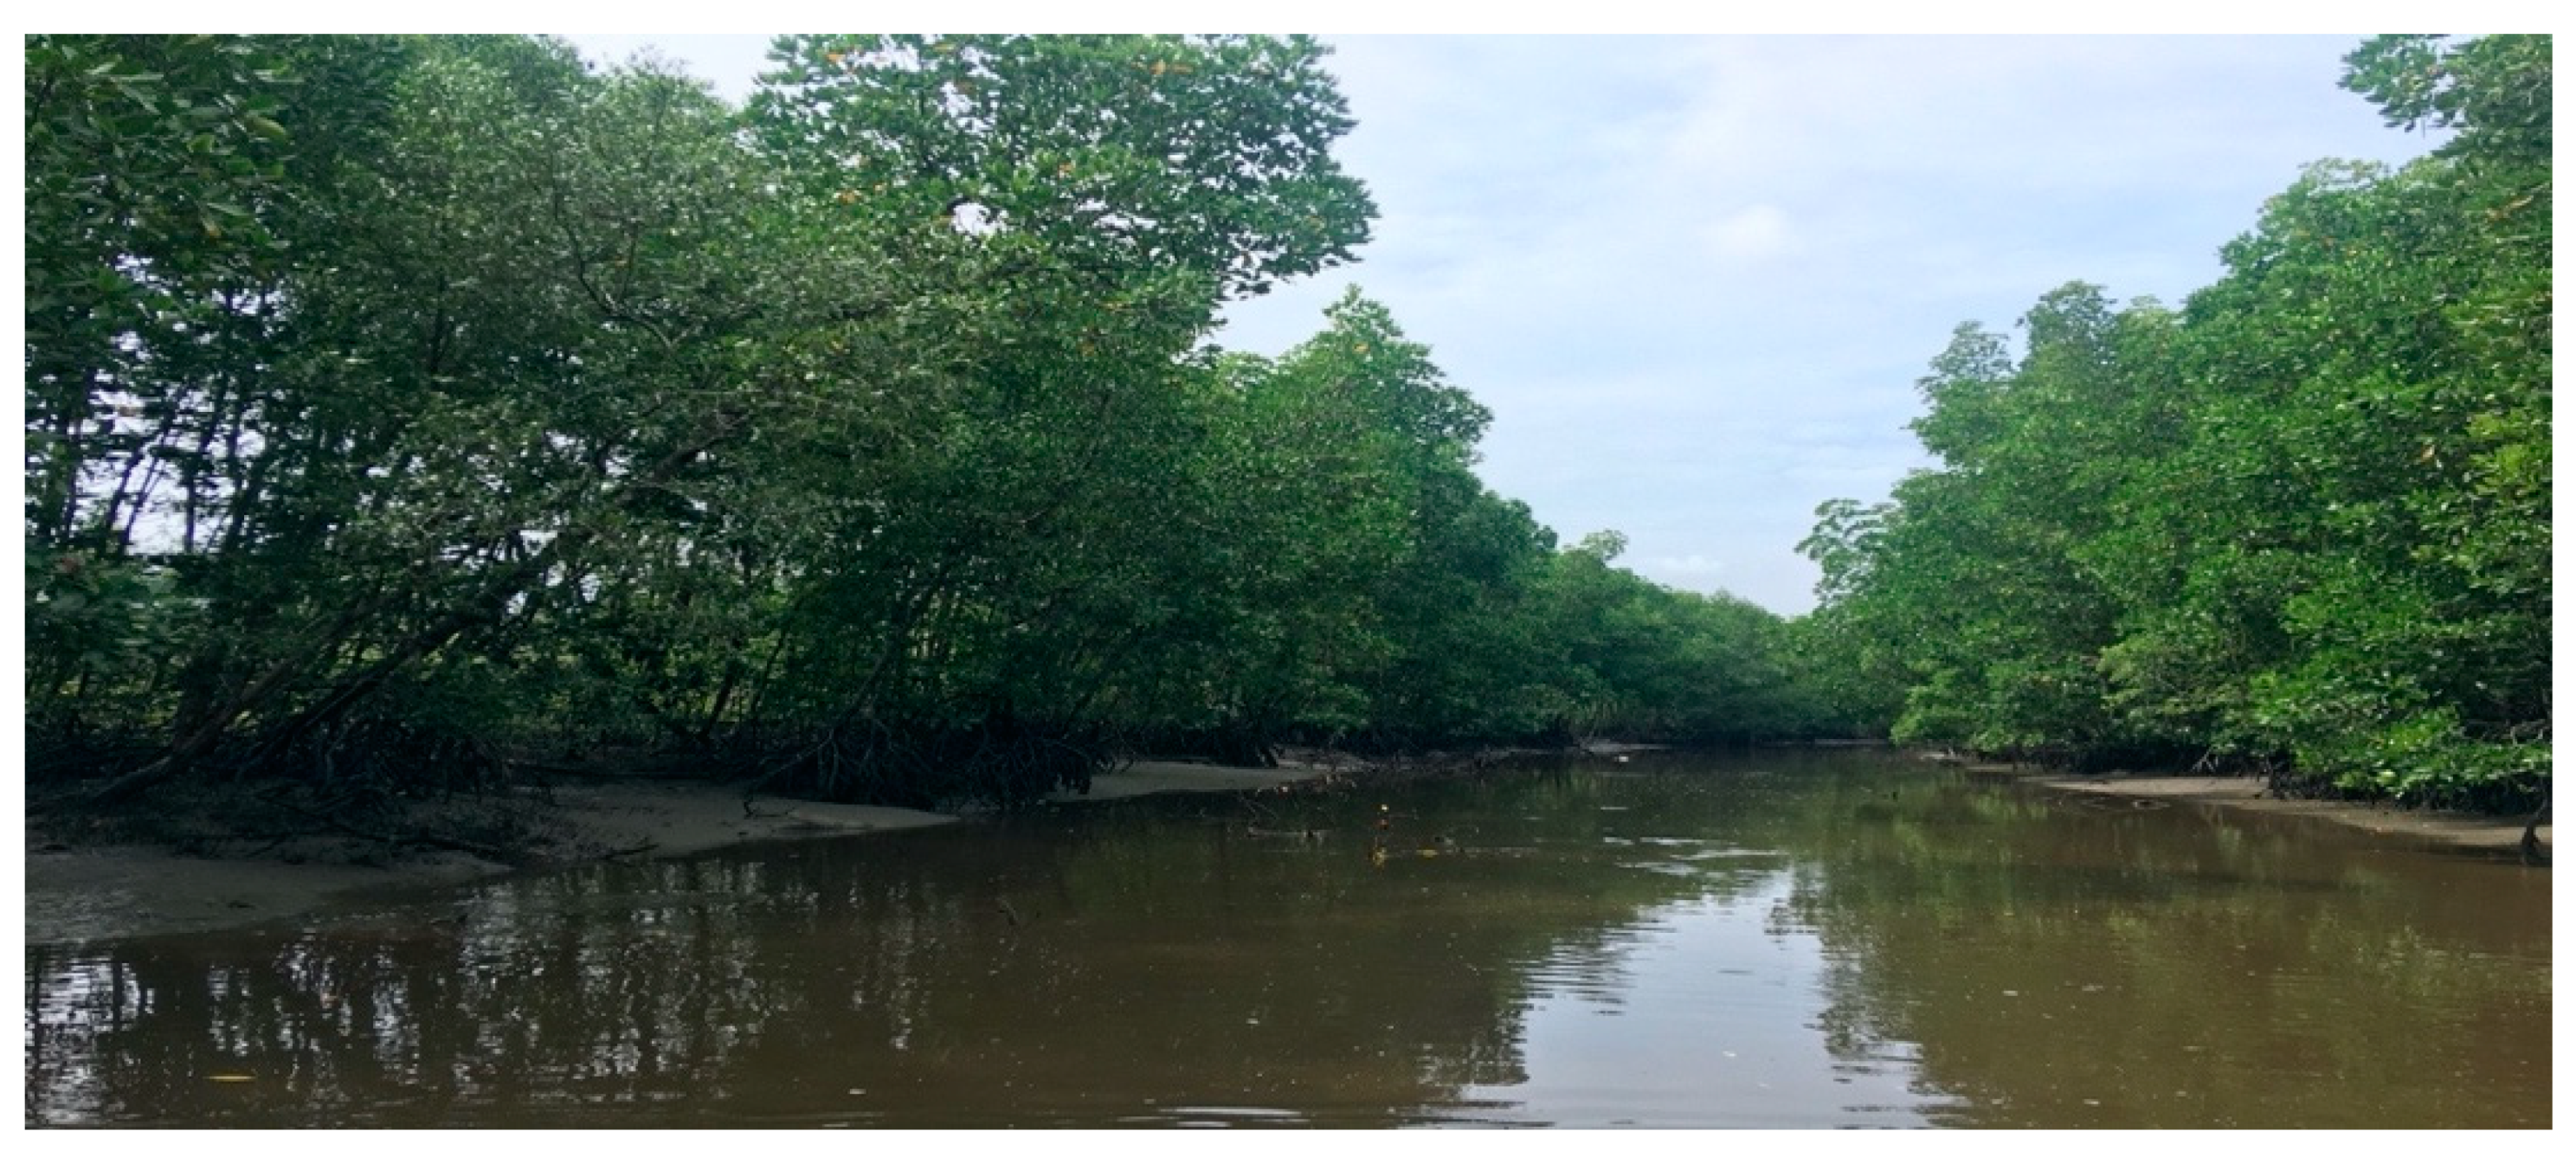
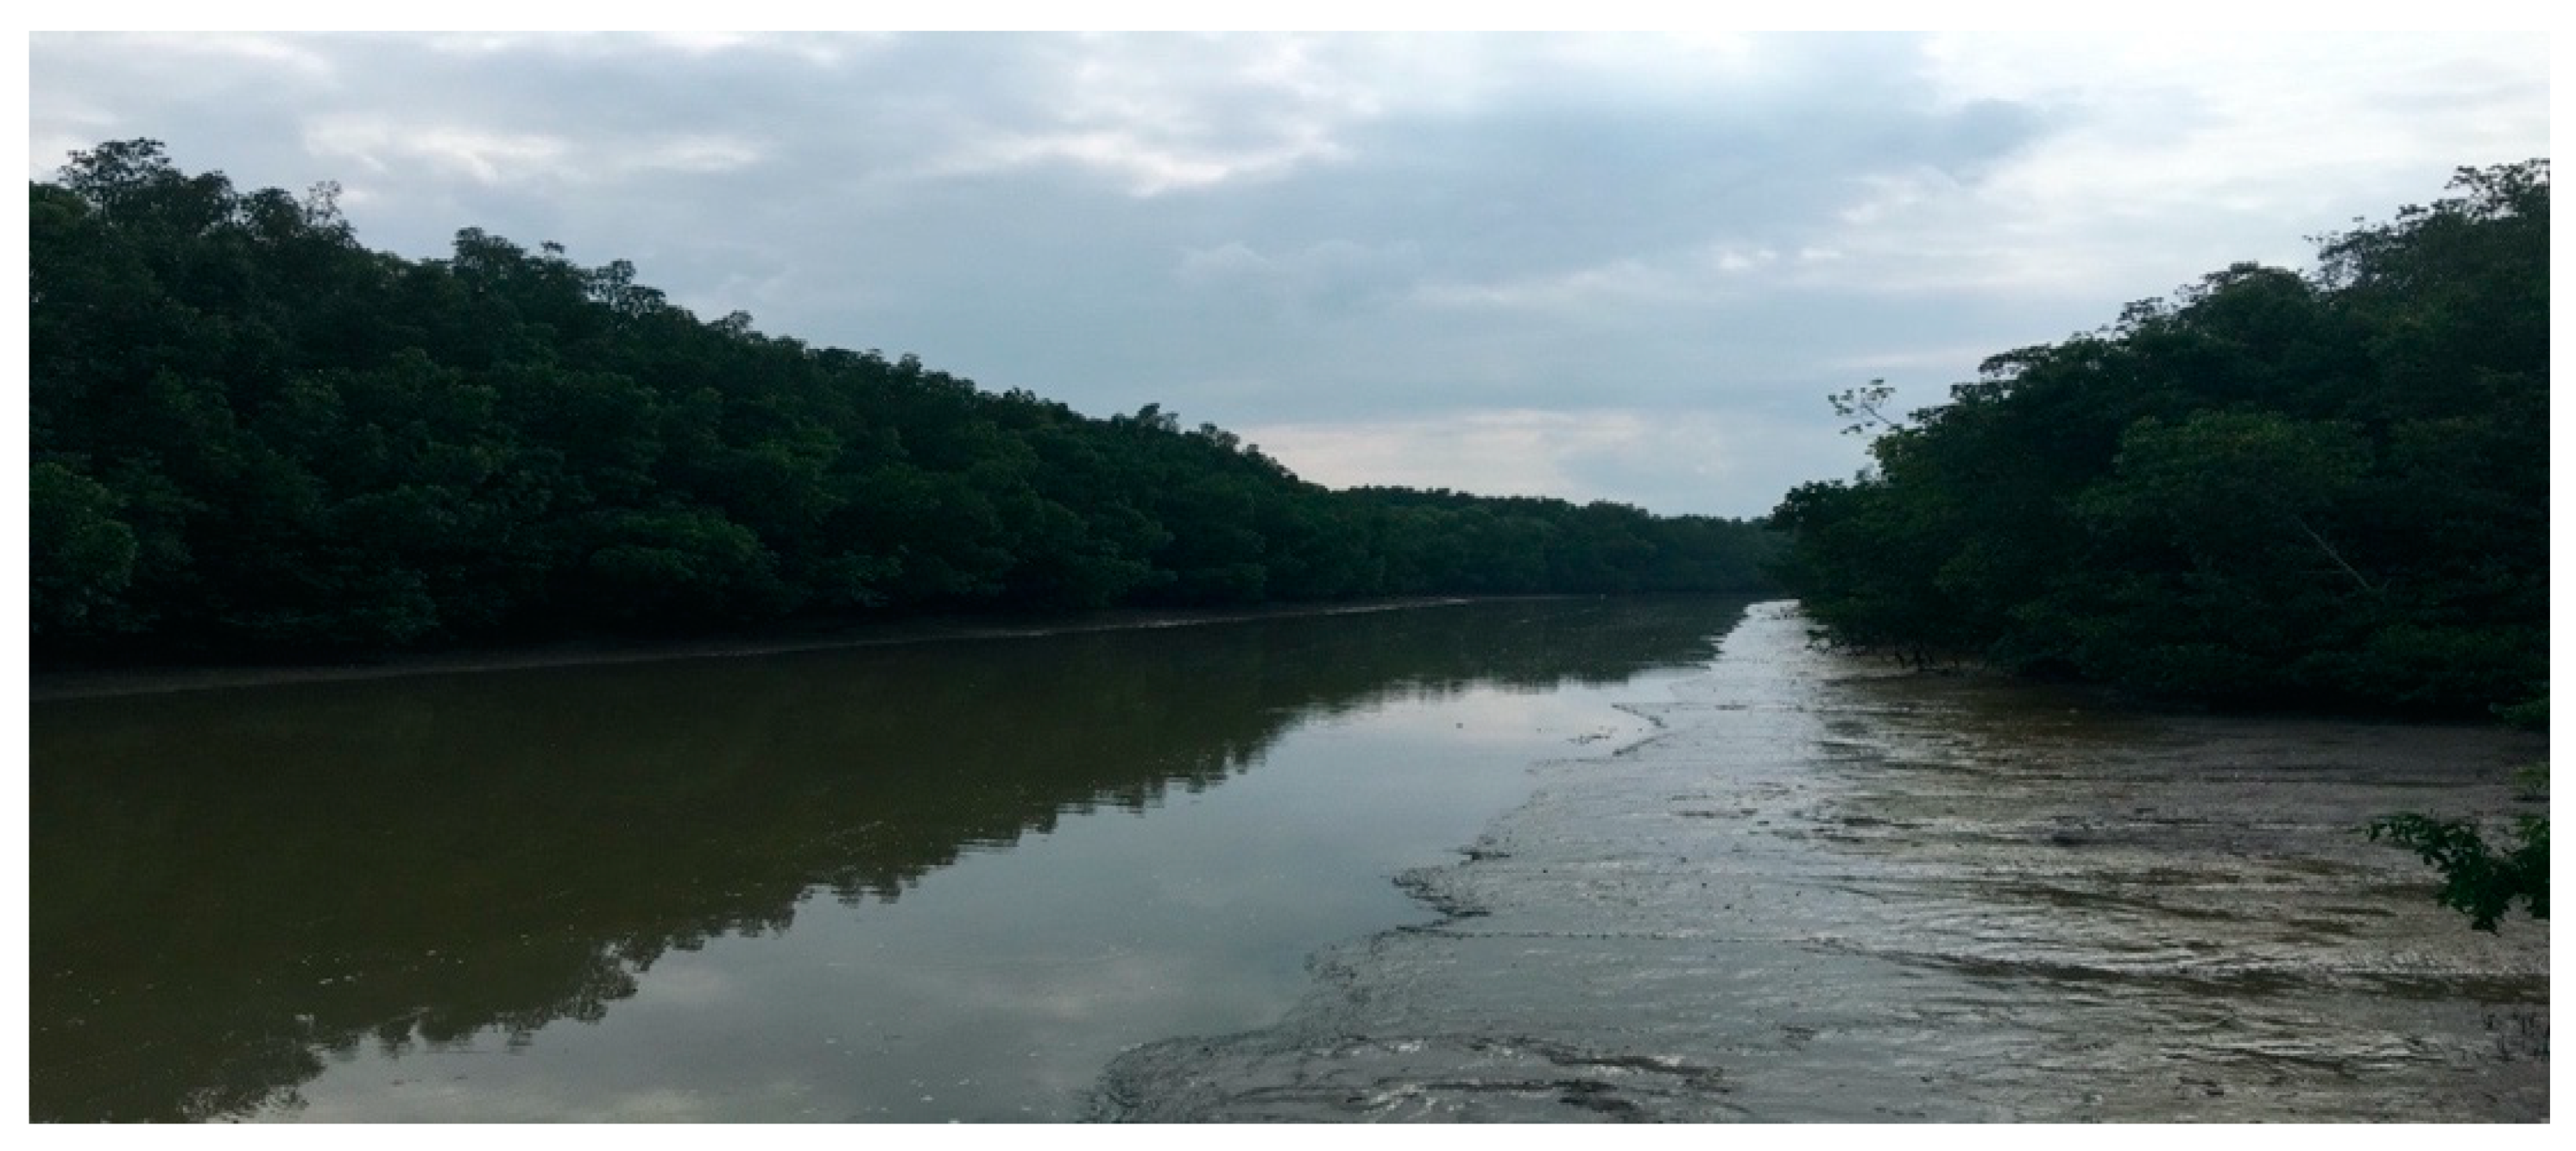
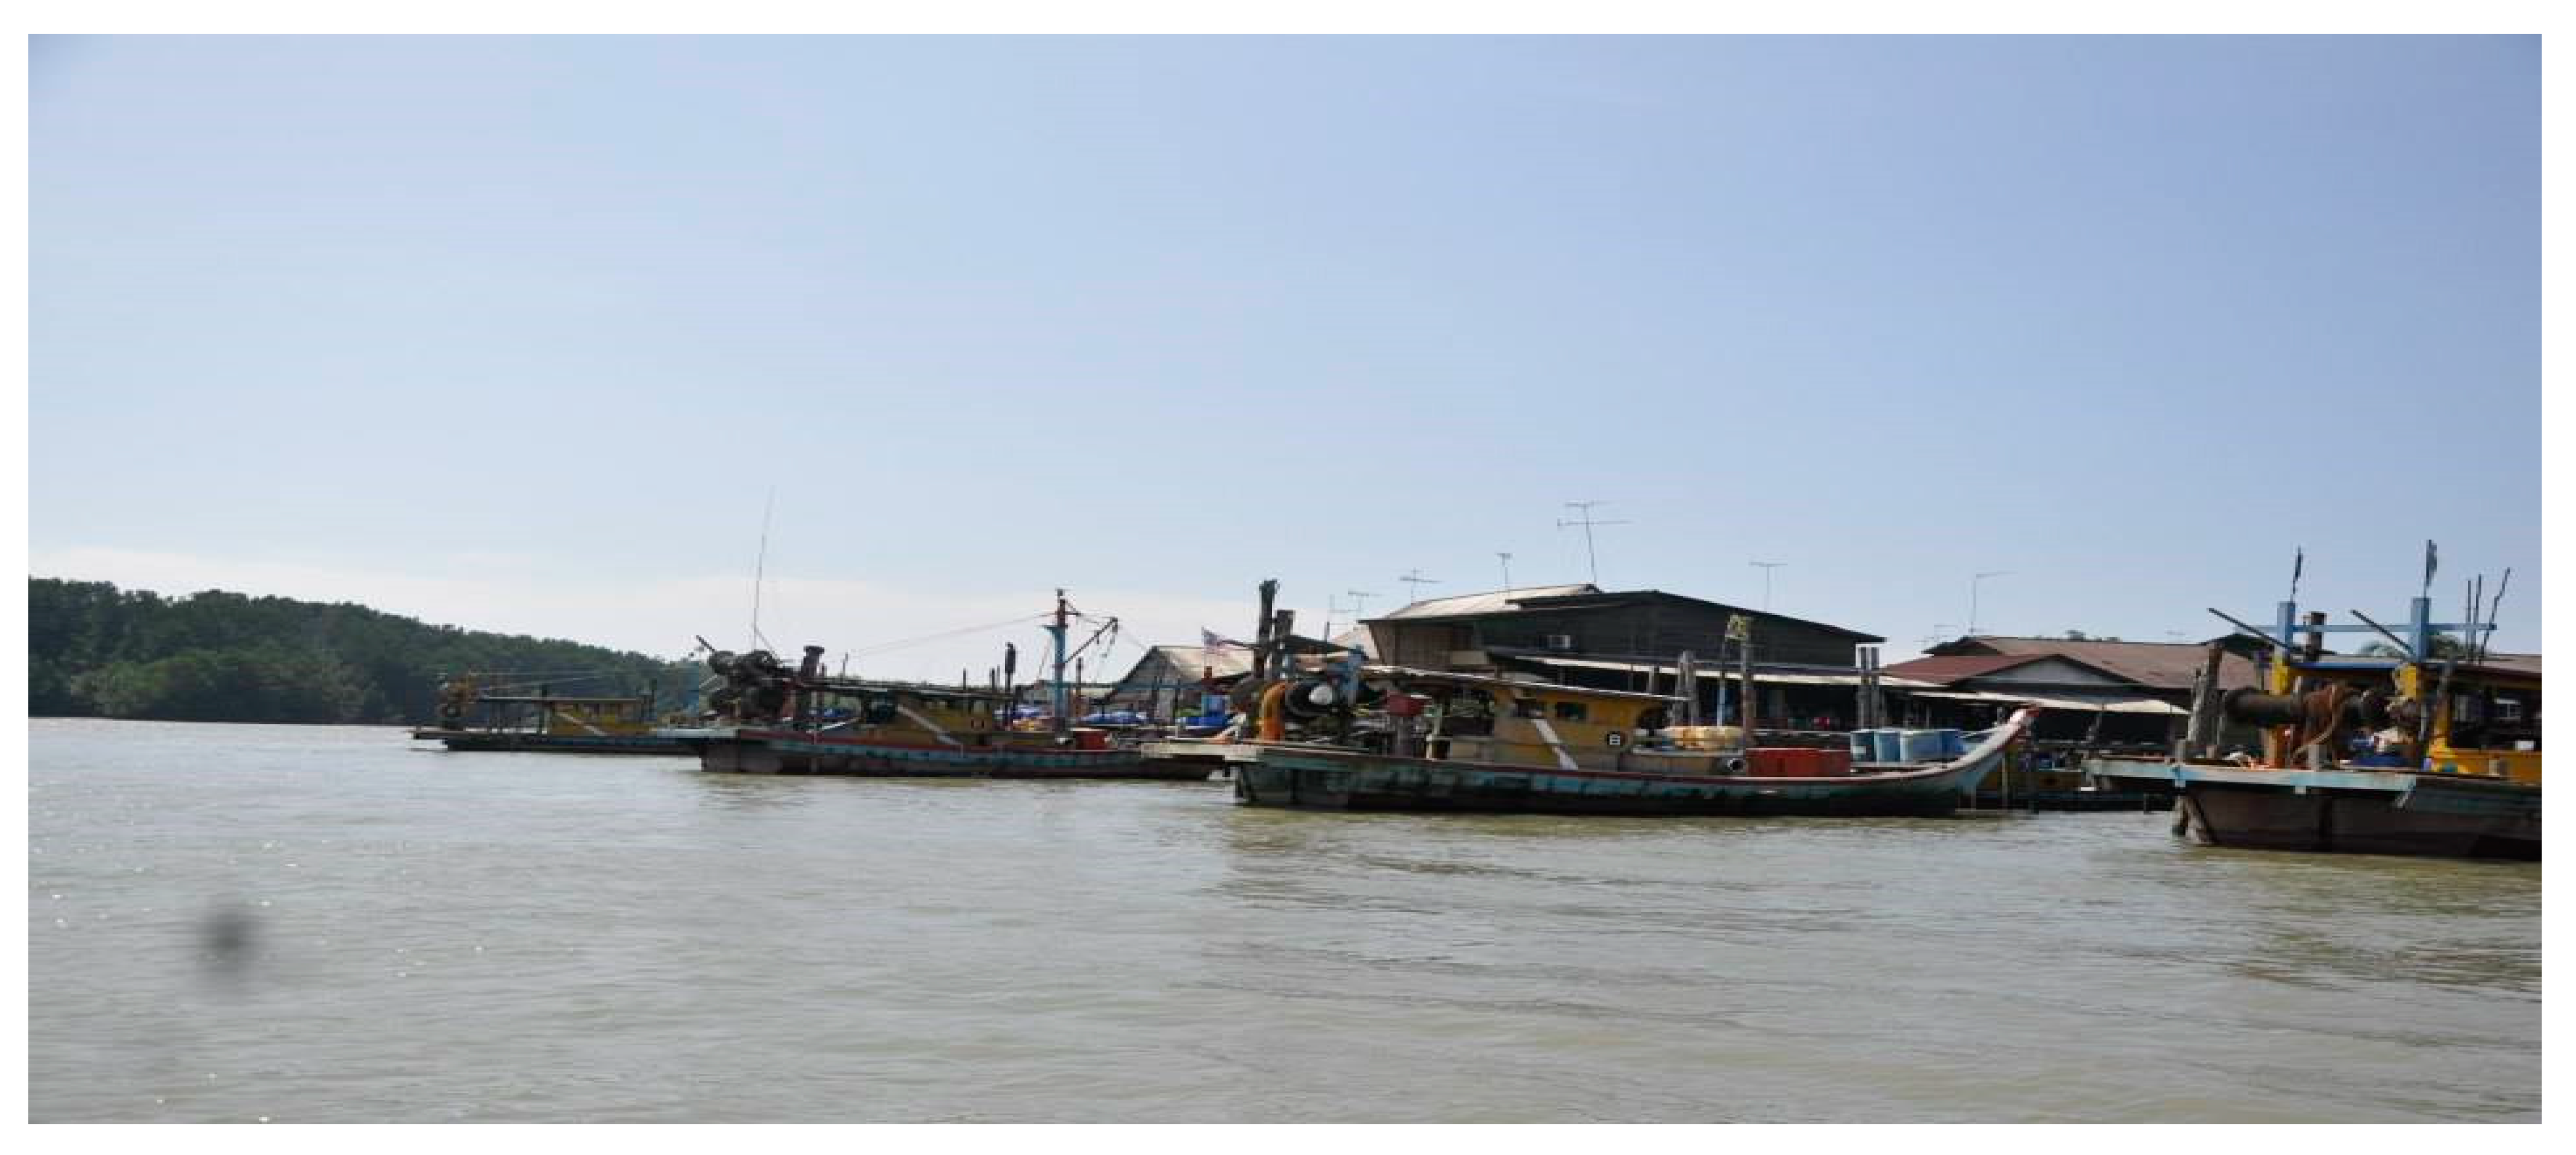
2.1. Information on the Study Areas
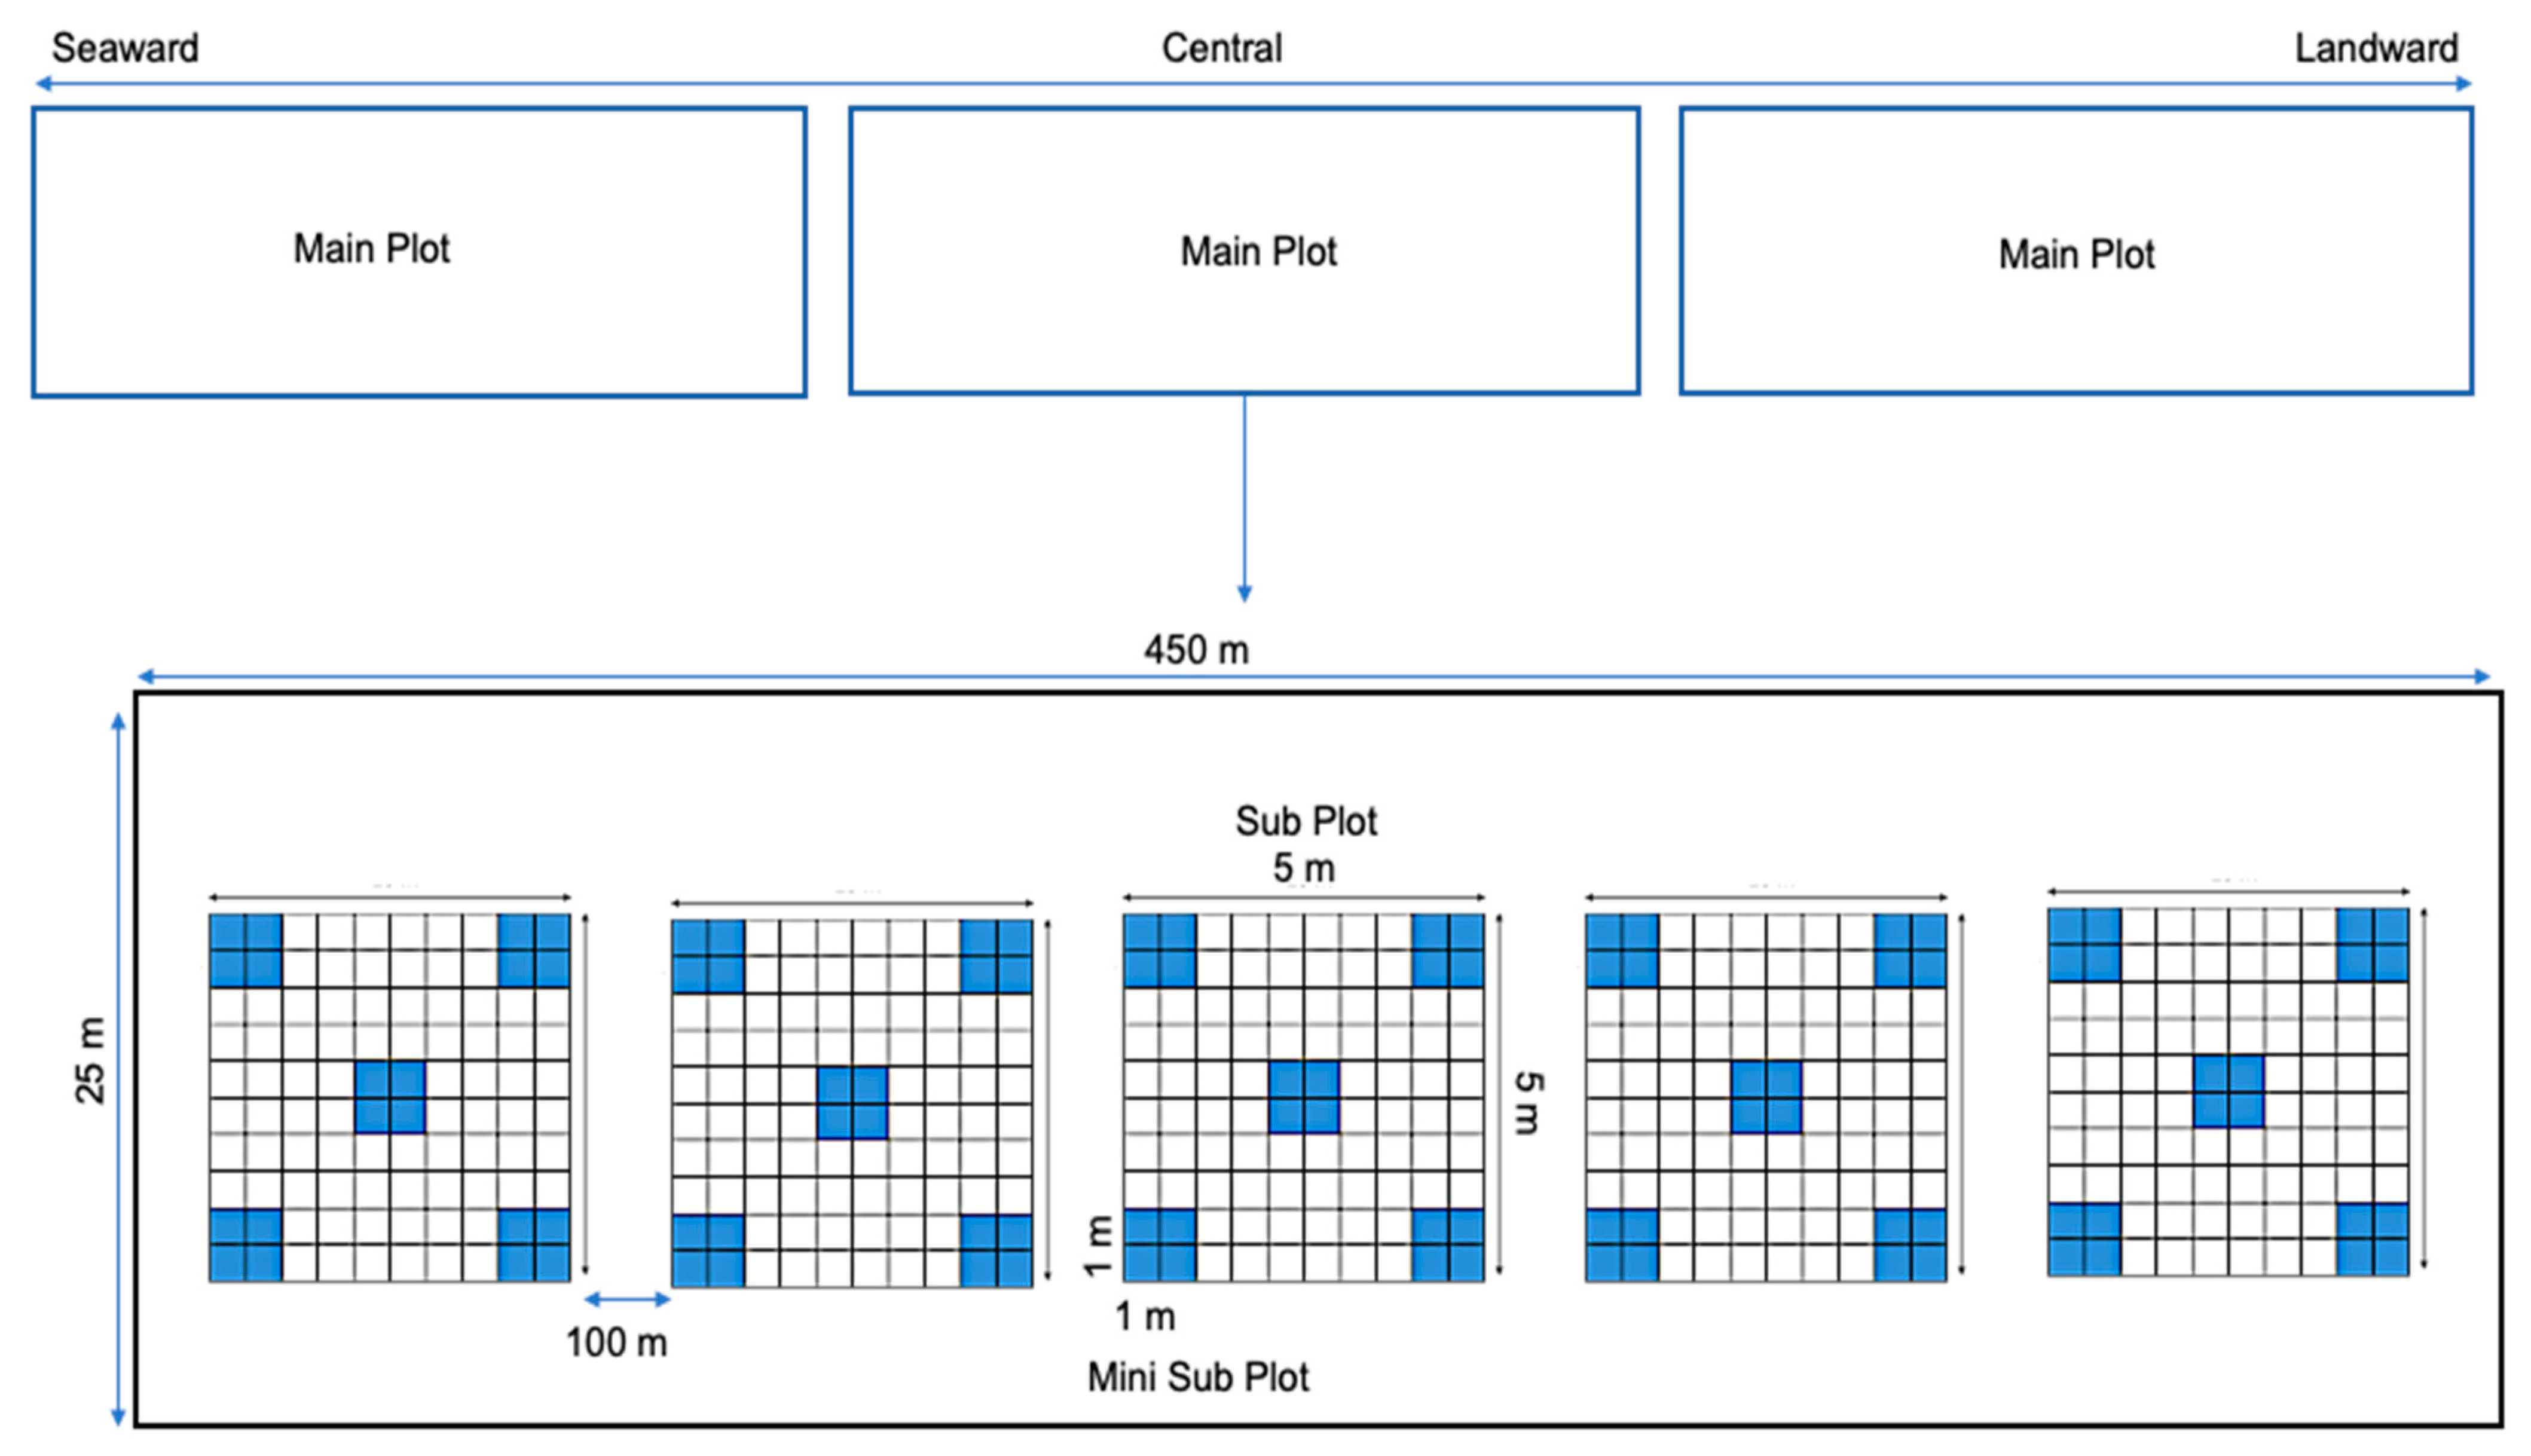
2.2. Experimental Design
2.3. Sediment Sampling and Laboratory Analysis
2.4. Statistical Analysis
2.5. Development of MSQi
- STEP 1:
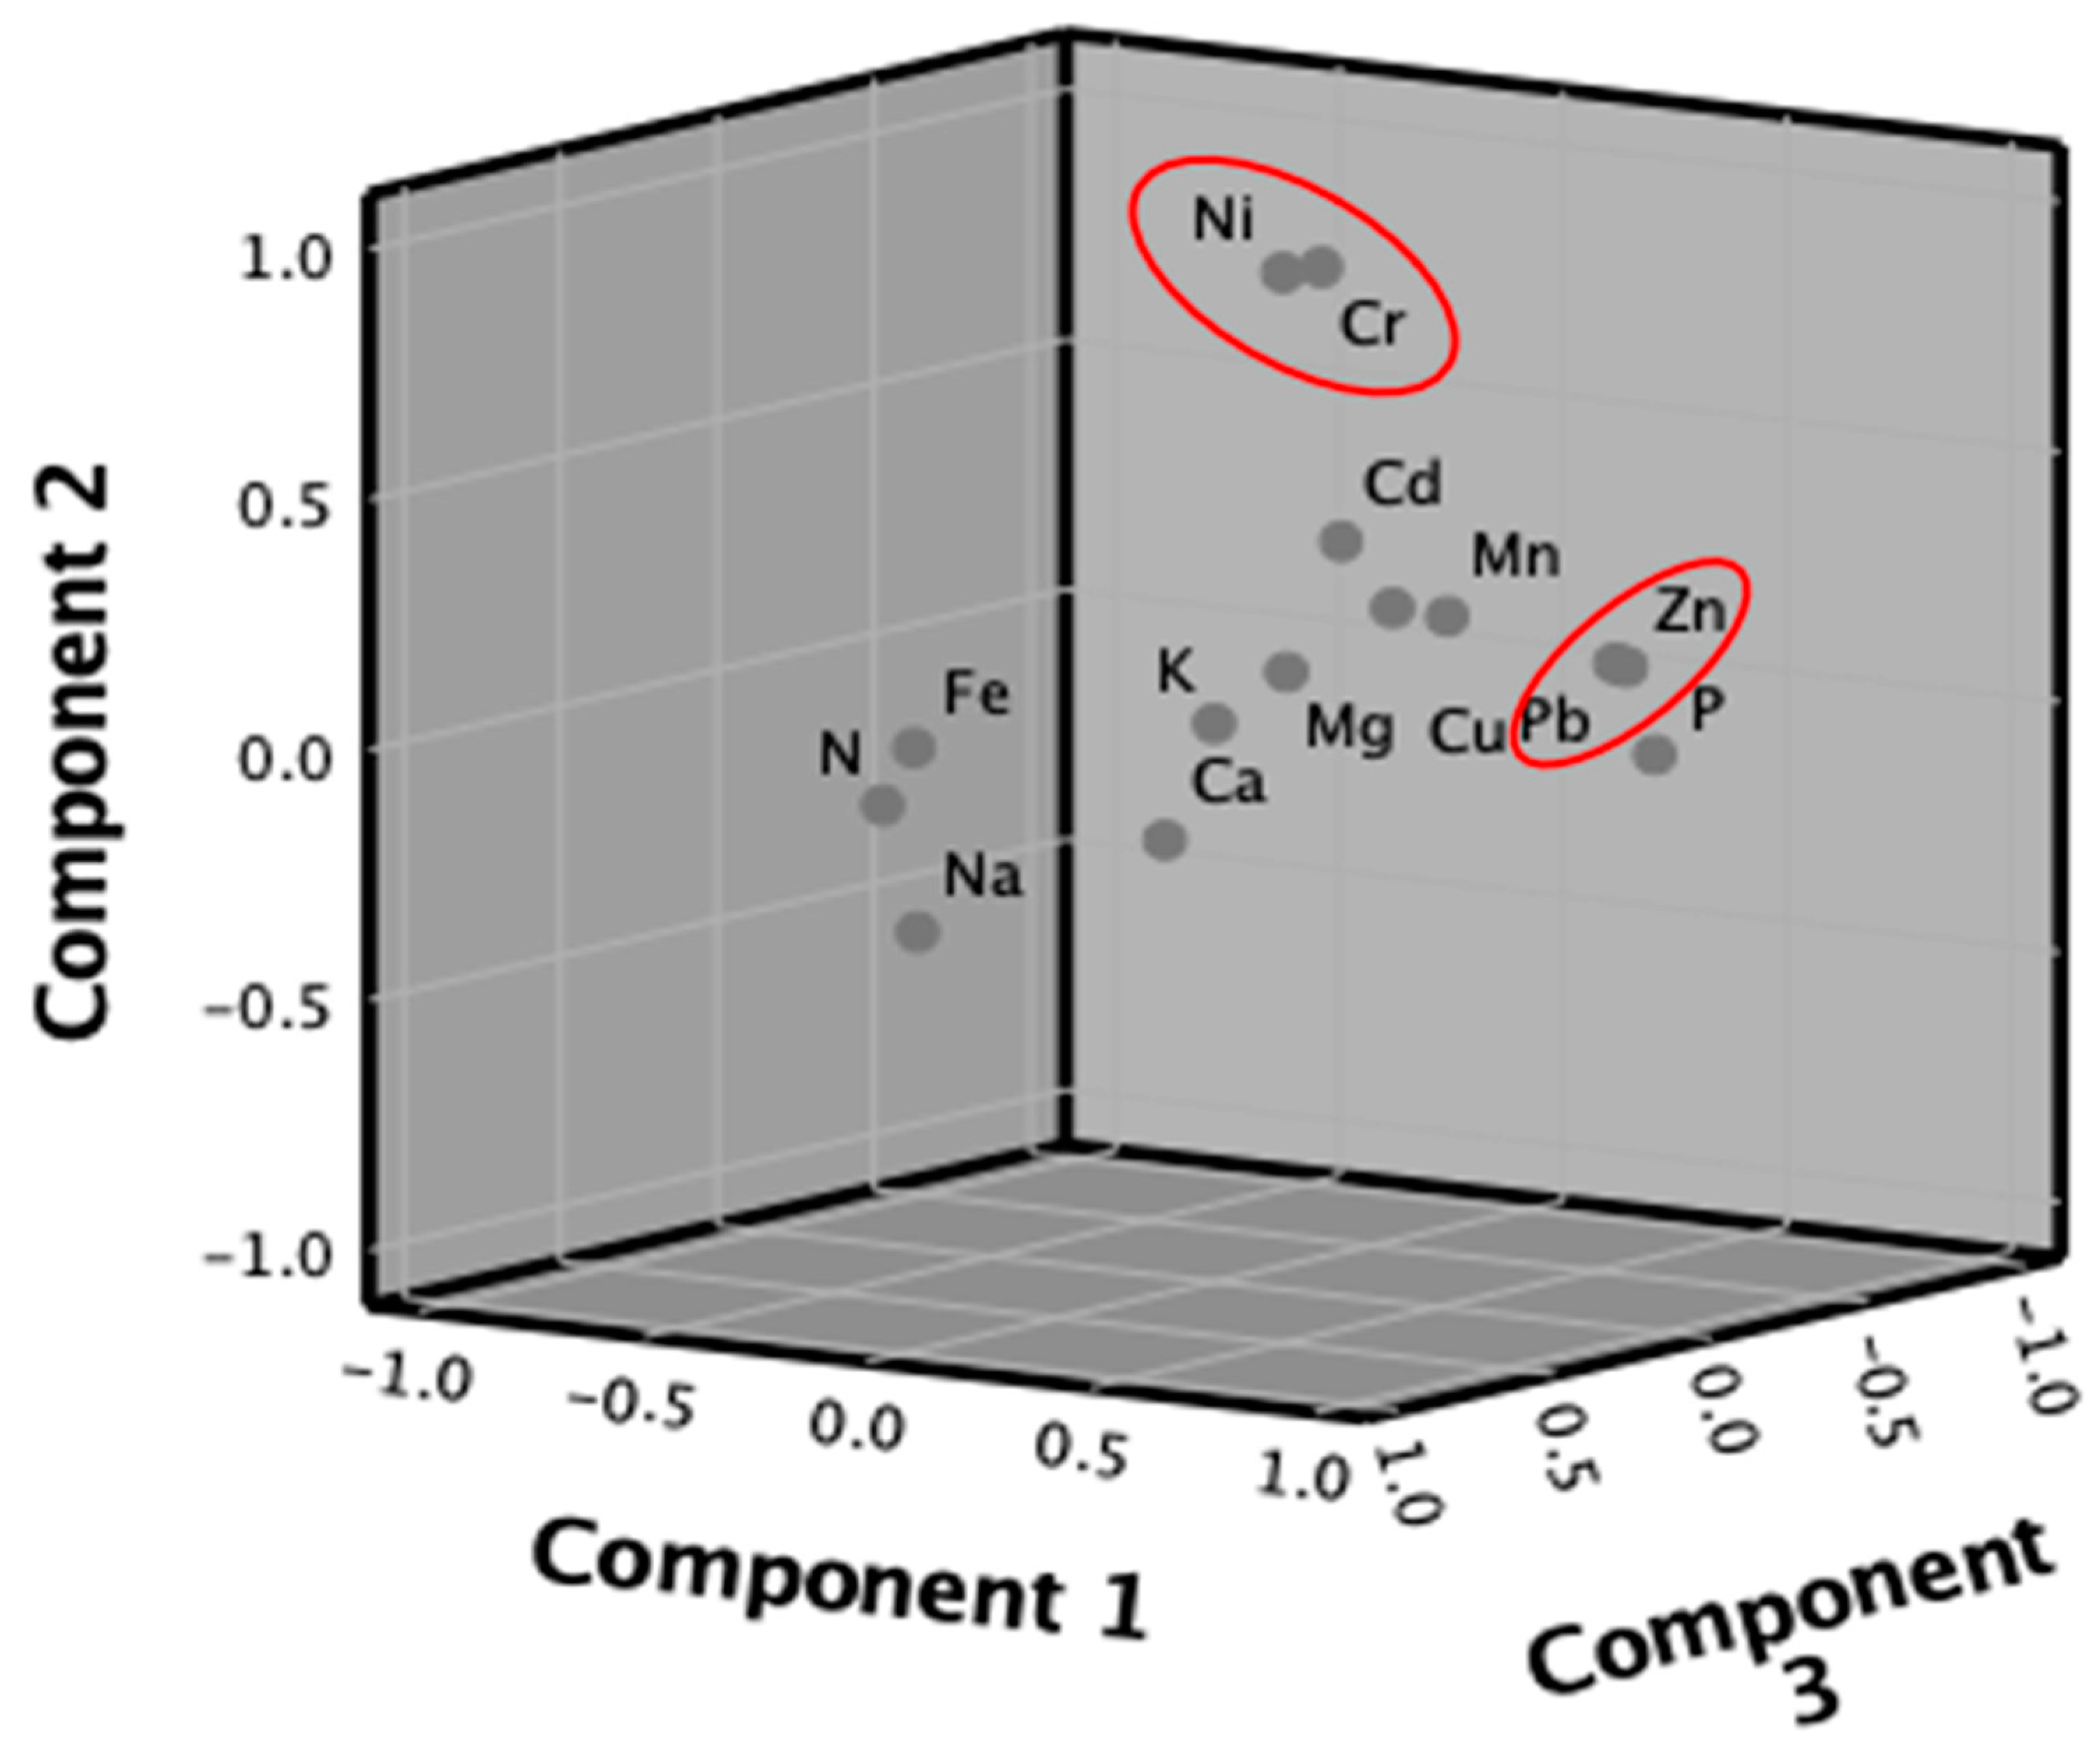
- Fourteen of the nineteen parameters were chosen for PCA analysis because they were grouped in one unit (mg/kg) to reduce bias in PCA analysis. The fourteen parameters are Nitrogen (N), Phosphorus (P), Potassium (K), Cal-cium (Ca), Magnesium (Mg), Sodium (Na), Manganese (Mn), Iron (Fe), Lead (Pb), Zinc (Zn), Copper (Cu), Cadmium (Cd), Chromium (Cr), and Nickel (Ni).
- STEP 2:
- Kaiser-Meyer-Olkin (KMO) measure of sampling adequacy with KMO value >0.600 was tested to ensure that the relationship between the data in the observation is adequate. If the KMO value < 0.600, the data are insufficient to run the PCA [40].
- STEP 3:
- Essential parameters in the component were identified, where the highest score of the PC grouped these parameters.
- STEP 4:
- In PCA, two results were obtained: component matrix and rotated component matrix. The proportion of the variability explained by each important component was identified. For example, four crucial parameter factors (PFs) were selected: P(Xi), P(Xii), P(Xiii), and P(Xiv).
- STEP 5:
- Each suggested critical PF concentration in the sediment was rated as 0 (low), 1 (medium), and 2 (high), based on the permissible limit range for soil and plant [41], as presented in Table A1 (Appendix A).
- STEP 6:
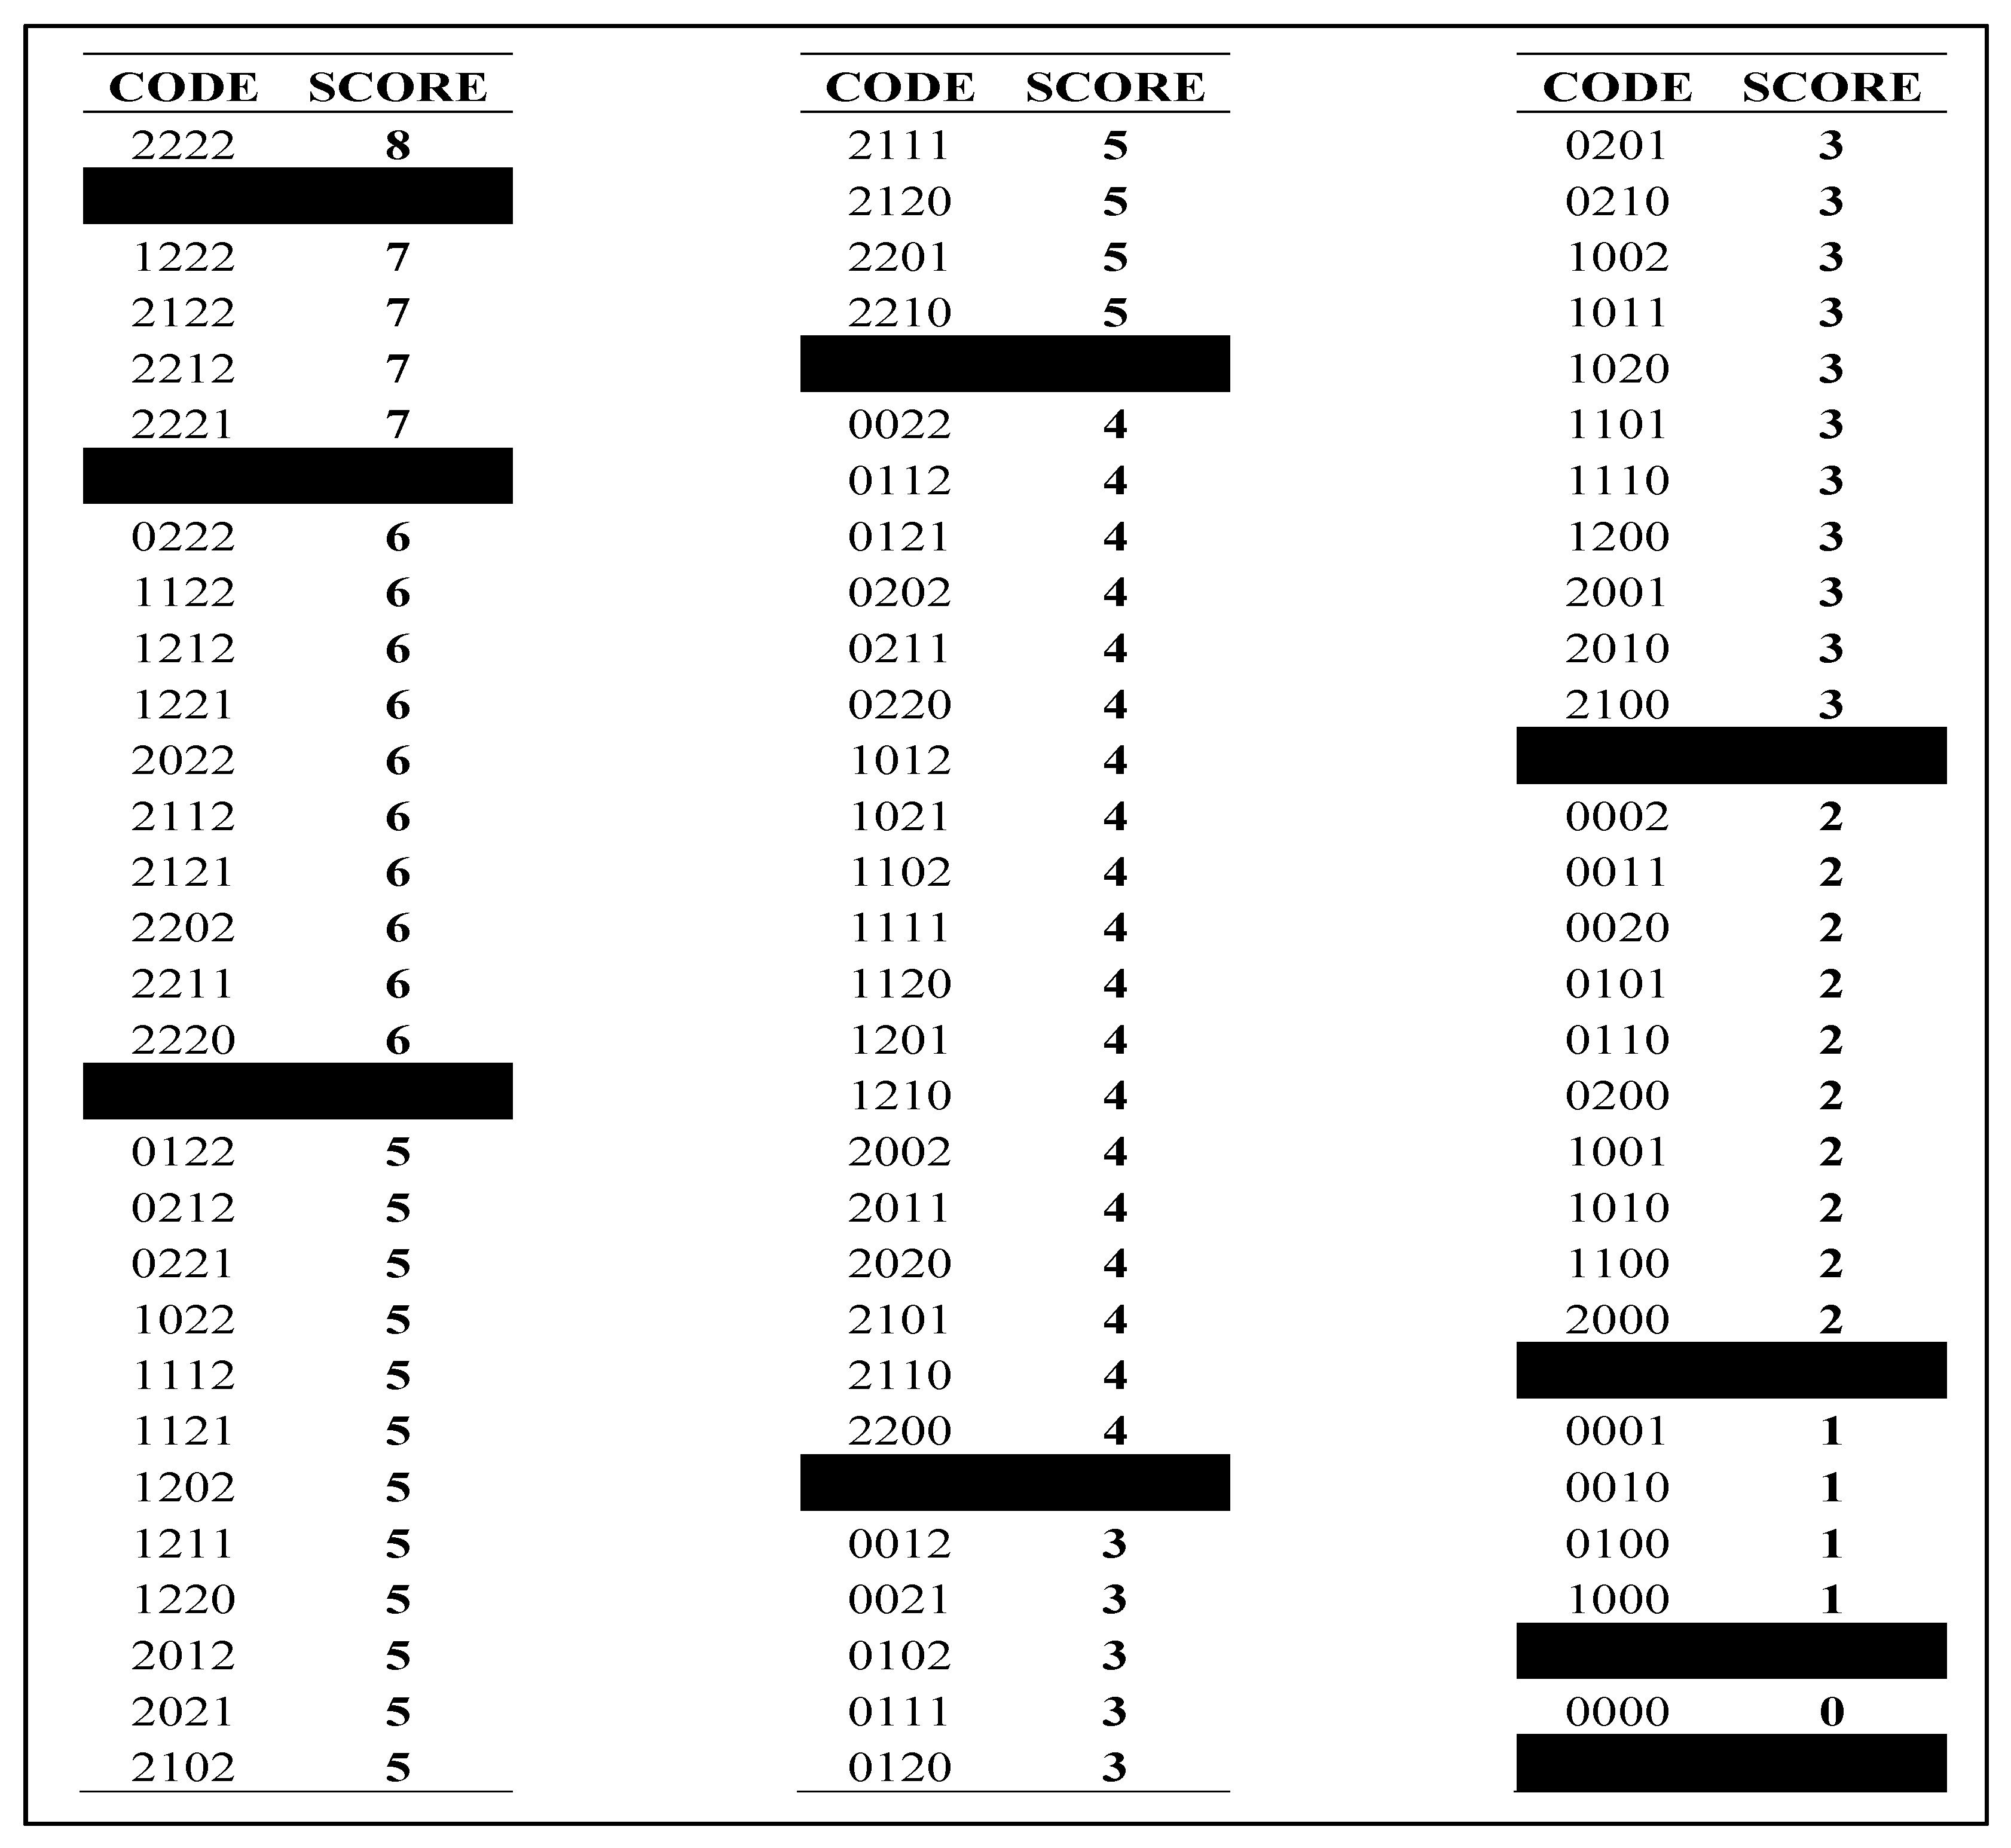
- The PFs ratings were referred to the MSDPT (see Figure A1, Appendix A).
- STEP 7:
- These MSDPT was developed by summation of these parameters. Σ MSDPT = P(Xi) + P(Xii) + P(Xiii) + P(Xiv).
- STEP 8:
- MSQi was developed by classifying MSDPT as I (very bad), II (bad), III (moderate), IV (good), and V (excellent) (see Table A2, Appendix A).
- STEP 9:
- A simplified format has been developed to facilitate MSQi modelling (see Table A3, Appendix A).
3. Results
3.1. Development of MSQi
3.2. MSQi of TLR during Dry and Wet Seasons
3.3. MSQi of TR during Dry and Wet Seasons
3.4. MSQi of SR during Dry and Wet Seasons
4. Discussion
5. Conclusions
Author Contributions
Funding
Institutional Review Board Statement
Informed Consent Statement
Data Availability Statement
Acknowledgments
Conflicts of Interest
Appendix A

| MSQi Parameter | Low (Unit) Rating 0 | Medium (Unit) Rating 1 | High (Unit) Rating 2 |
|---|---|---|---|
| P(Xi) | X ≤ P(Xi) * | P(Xi) * < X < P(Xi) ** | X ≥ P(Xi) ** |
| P(Xii) | X ≤ P(Xii) * | P(Xii) * < X < P(Xii) ** | X ≥ P(Xii) ** |
| P(Xiii) | X ≤ P(Xiii) * | P(Xiii) * < X < P(Xiii) ** | X ≥ P(Xiii) ** |
| P(Xiv) | X ≤ P(Xiv) * | P(Xiv) * < X < P(Xiv) ** | X ≥ P(Xiv) ** |

| MSDPT Range | MSQi Class | Description |
|---|---|---|
| If 7.00 ≥ X ≥ 8.00 | I | Highly Polluted |
| If 5.00 ≥ X ≥ 6.99 | II | High Polluted |
| If 4.00 ≥ X ≥ 4.99 | III | Moderately Polluted |
| If 2.00 ≥ X ≥ 3.99 | IV | Low Polluted |
| If 0.0 ≥ X ≥ 1.99 | V | Not Polluted |
| MANGROVE SEDIMENT QUALITY INDEX (MSQi). | |||||||||
|---|---|---|---|---|---|---|---|---|---|
| River | Zone | Depth (cm) | MSQi Parameter | Median | MSDPT | ∑ MSDPT SCORE | MSQi CLASS | Rating | Description |
| Tiram Laut River | Landward | 0–15 | x | x | x | x | x | x | x |
| x | x | x | |||||||
| x | x | x | |||||||
| x | x | x | |||||||
| 15–30 | x | x | x | x | x | x | x | ||
| x | x | x | |||||||
| x | x | x | |||||||
| x | x | x | |||||||
| 30–50 | x | x | x | x | x | x | x | ||
| x | x | x | |||||||
| x | x | x | |||||||
| x | x | x | |||||||
| 50–100 | x | x | x | x | x | x | x | ||
| x | x | x | |||||||
| x | x | x | |||||||
| x | x | x | |||||||
| 100–150 | x | x | x | x | x | x | x | ||
| x | x | x | |||||||
| x | x | x | |||||||
| x | x | x | |||||||
| Central | 0–15 | x | x | x | x | x | x | x | |
| x | x | x | |||||||
| x | x | x | |||||||
| x | x | x | |||||||
| 15–30 | x | x | x | x | x | x | x | ||
| x | x | x | |||||||
| x | x | x | |||||||
| x | x | x | |||||||
| 30–50 | x | x | x | x | x | x | x | ||
| x | x | x | |||||||
| x | x | x | |||||||
| x | x | x | |||||||
| 50–100 | x | x | x | x | x | x | x | ||
| x | x | x | |||||||
| x | x | x | |||||||
| x | x | x | |||||||
| 100–150 | x | x | x | x | x | x | x | ||
| x | x | x | |||||||
| x | x | x | |||||||
| x | x | x | |||||||
| Seaward | 0–15 | x | x | x | x | x | x | x | |
| x | x | x | |||||||
| x | x | x | |||||||
| x | x | x | |||||||
| 15–30 | x | x | x | x | x | x | x | ||
| x | x | x | |||||||
| x | x | x | |||||||
| x | x | x | |||||||
| 30–50 | x | x | x | x | x | x | x | ||
| x | x | x | |||||||
| x | x | x | |||||||
| x | x | x | |||||||
| 50–100 | x | x | x | x | x | x | x | ||
| x | x | x | |||||||
| x | x | x | |||||||
| x | x | x | |||||||
| 100–150 | x | x | x | x | x | x | x | ||
| x | x | x | |||||||
| x | x | x | |||||||
| x | x | x | |||||||
| MANGROVE SEDIMENT QUALITY INDEX (MSQi) | |||||||||
|---|---|---|---|---|---|---|---|---|---|
| River | Zone | Depth (cm) | MSQi Parameter | Median | MSDPT | ∑ MSDPT SCORE | MSQi CLASS | Rating | Description |
| Tiram Laut River | Landward | 0–15 | Pb | 3.836 | 1 | 3 | III | Moderate | Moderately Polluted |
| Zn | 25.310 | 1 | |||||||
| Cr | 1.915 | 1 | |||||||
| Ni | 0.982 | 0 | |||||||
| 15–30 | Pb | 1.368 | 0 | 2 | IV | Good | Low Polluted | ||
| Zn | 16.926 | 1 | |||||||
| Cr | 1.755 | 1 | |||||||
| Ni | 0.900 | 0 | |||||||
| 30–50 | Pb | 5.014 | 1 | 2 | IV | Good | Low Polluted | ||
| Zn | 22.370 | 1 | |||||||
| Cr | 0.445 | 0 | |||||||
| Ni | 2.280 | 0 | |||||||
| 50–100 | Pb | 3.418 | 1 | 2 | IV | Good | Low Polluted | ||
| Zn | 22.730 | 1 | |||||||
| Cr | 0.507 | 0 | |||||||
| Ni | 2.600 | 0 | |||||||
| 100–150 | Pb | 1.368 | 0 | 1 | IV | Good | Low Polluted | ||
| Zn | 18.984 | 1 | |||||||
| Cr | 0.577 | 0 | |||||||
| Ni | 2.960 | 0 | |||||||
| Central | 0–15 | Pb | 5.242 | 1 | 2 | IV | Good | Low Polluted | |
| Zn | 23.202 | 1 | |||||||
| Cr | 1.277 | 0 | |||||||
| Ni | 3.547 | 0 | |||||||
| 15–30 | Pb | 2.596 | 1 | 2 | IV | Good | Low Polluted | ||
| Zn | 16.406 | 1 | |||||||
| Cr | 1.170 | 0 | |||||||
| Ni | 3.000 | 0 | |||||||
| 30–50 | Pb | 2.190 | 1 | 2 | IV | Good | Low Polluted | ||
| Zn | 17.336 | 1 | |||||||
| Cr | 0.296 | 0 | |||||||
| Ni | 1.520 | 0 | |||||||
| 50–100 | Pb | 4.786 | 1 | 2 | IV | Good | Low Polluted | ||
| Zn | 25.620 | 1 | |||||||
| Cr | 0.338 | 0 | |||||||
| Ni | 1.733 | 0 | |||||||
| 100–150 | Pb | 5.014 | 1 | 2 | IV | Good | Low Polluted | ||
| Zn | 26.970 | 1 | |||||||
| Cr | 0.385 | 0 | |||||||
| Ni | 1.973 | 0 | |||||||
| Seaward | 0–15 | Pb | 5.926 | 1 | 2 | IV | Good | Low Polluted | |
| Zn | 21.750 | 1 | |||||||
| Cr | 0.957 | 0 | |||||||
| Ni | 0.910 | 0 | |||||||
| 15–30 | Pb | 6.520 | 1 | 2 | IV | Good | Low Polluted | ||
| Zn | 19.542 | 1 | |||||||
| Cr | 0.878 | 0 | |||||||
| Ni | 0.680 | 0 | |||||||
| 30–50 | Pb | 3.506 | 1 | 2 | IV | Good | Low Polluted | ||
| Zn | 16.492 | 1 | |||||||
| Cr | 0.222 | 0 | |||||||
| Ni | 1.140 | 0 | |||||||
| 50–100 | Pb | 5.014 | 1 | 2 | IV | Good | Low Polluted | ||
| Zn | 19.158 | 1 | |||||||
| Cr | 0.254 | 0 | |||||||
| Ni | 1.300 | 0 | |||||||
| 100–150 | Pb | 4.558 | 1 | 2 | IV | Good | Low Polluted | ||
| Zn | 20.708 | 1 | |||||||
| Cr | 0.289 | 0 | |||||||
| Ni | 1.480 | 0 | |||||||
| MANGROVE SEDIMENT QUALITY INDEX (MSQi) | |||||||||
|---|---|---|---|---|---|---|---|---|---|
| River | Zone | Depth (cm) | MSQi Parameter | Median | MSDPT | ∑ MSDPT SCORE | MSQi CLASS | Rating | Description |
| Tiram Laut River | Landward | 0–15 | Pb | 9.800 | 1 | 2 | IV | Good | Low Polluted |
| Zn | 24.280 | 1 | |||||||
| Cr | 1.111 | 0 | |||||||
| Ni | 1.553 | 0 | |||||||
| 15–30 | Pb | 3.290 | 1 | 2 | IV | Good | Low Polluted | ||
| Zn | 15.426 | 1 | |||||||
| Cr | 1.018 | 0 | |||||||
| Ni | 0.220 | 0 | |||||||
| 30–50 | Pb | 4.102 | 1 | 2 | IV | Good | Low Polluted | ||
| Zn | 20.498 | 1 | |||||||
| Cr | 0.258 | 0 | |||||||
| Ni | 1.322 | 0 | |||||||
| 50–100 | Pb | 6.380 | 1 | 2 | IV | Good | Low Polluted | ||
| Zn | 20.882 | 1 | |||||||
| Cr | 0.294 | 0 | |||||||
| Ni | 1.508 | 0 | |||||||
| 100–150 | Pb | 6.380 | 1 | 2 | IV | Good | Low Polluted | ||
| Zn | 19.568 | 1 | |||||||
| Cr | 0.335 | 0 | |||||||
| Ni | 1.717 | 0 | |||||||
| Central | 0–15 | Pb | 2.734 | 1 | 2 | IV | Good | Low Polluted | |
| Zn | 14.720 | 1 | |||||||
| Cr | 0.740 | 0 | |||||||
| Ni | 3.797 | 0 | |||||||
| 15–30 | Pb | 3.874 | 1 | 2 | IV | Good | Low Polluted | ||
| Zn | 19.964 | 1 | |||||||
| Cr | 0.679 | 0 | |||||||
| Ni | 3.480 | 0 | |||||||
| 30–50 | Pb | 4.646 | 1 | 2 | IV | Good | Low Polluted | ||
| Zn | 18.378 | 1 | |||||||
| Cr | 0.172 | 0 | |||||||
| Ni | 0.882 | 0 | |||||||
| 50–100 | Pb | 4.102 | 1 | 2 | IV | Good | Low Polluted | ||
| Zn | 19.282 | 1 | |||||||
| Cr | 0.196 | 0 | |||||||
| Ni | 1.005 | 0 | |||||||
| 100–150 | Pb | 1.956 | 0 | 1 | IV | Good | Low Polluted | ||
| Zn | 14.744 | 1 | |||||||
| Cr | 0.223 | 0 | |||||||
| Ni | 1.145 | 0 | |||||||
| Seaward | 0–15 | Pb | 2.878 | 1 | 2 | IV | Good | Low Polluted | |
| Zn | 14.880 | 1 | |||||||
| Cr | 0.555 | 0 | |||||||
| Ni | 2.848 | 0 | |||||||
| 15–30 | Pb | 5.014 | 1 | 2 | IV | Good | Low Polluted | ||
| Zn | 17.646 | 1 | |||||||
| Cr | 0.509 | 0 | |||||||
| Ni | 2.610 | 0 | |||||||
| 30–50 | Pb | 2.734 | 1 | 2 | IV | Good | Low Polluted | ||
| Zn | 14.856 | 1 | |||||||
| Cr | 0.129 | 0 | |||||||
| Ni | 0.661 | 0 | |||||||
| 50–100 | Pb | 2.962 | 1 | 2 | IV | Good | Low Polluted | ||
| Zn | 16.170 | 1 | |||||||
| Cr | 0.147 | 0 | |||||||
| Ni | 0.754 | 0 | |||||||
| 100–150 | Pb | 3.874 | 1 | 2 | IV | Good | Low Polluted | ||
| Zn | 14.744 | 1 | |||||||
| Cr | 0.167 | 0 | |||||||
| Ni | 0.858 | 0 | |||||||
| MANGROVE SEDIMENT QUALITY INDEX (MSQi) | |||||||||
|---|---|---|---|---|---|---|---|---|---|
| River | Zone | Depth (cm) | MSQi Parameter | Median | MSDPT | ∑ MSDPT SCORE | MSQi CLASS | Rating | Description |
| Tinggi River | Landward | 0–15 | Pb | 4.330 | 1 | 3 | III | Moderate | Moderately Polluted |
| Zn | 16.418 | 1 | |||||||
| Cr | 9.575 | 1 | |||||||
| Ni | 6.425 | 0 | |||||||
| 15–30 | Pb | 5.926 | 1 | 3 | III | Moderate | Moderately Polluted | ||
| Zn | 19.134 | 1 | |||||||
| Cr | 8.775 | 1 | |||||||
| Ni | 4.700 | 0 | |||||||
| 30–50 | Pb | 7.492 | 1 | 3 | III | Moderate | Moderately Polluted | ||
| Zn | 23.958 | 1 | |||||||
| Cr | 2.223 | 1 | |||||||
| Ni | 2.850 | 0 | |||||||
| 50–100 | Pb | 7.064 | 1 | 3 | III | Moderate | Moderately Polluted | ||
| Zn | 25.656 | 1 | |||||||
| Cr | 2.535 | 1 | |||||||
| Ni | 3.250 | 0 | |||||||
| 100–150 | Pb | 7.292 | 1 | 3 | III | Moderate | Moderately Polluted | ||
| Zn | 22.644 | 1 | |||||||
| Cr | 2.886 | 1 | |||||||
| Ni | 3.700 | 0 | |||||||
| Central | 0–15 | Pb | 6.608 | 1 | 3 | III | Moderate | Moderately Polluted | |
| Zn | 21.478 | 1 | |||||||
| Cr | 6.383 | 1 | |||||||
| Ni | 8.183 | 0 | |||||||
| 15–30 | Pb | 8.888 | 1 | 3 | III | Moderate | Moderately Polluted | ||
| Zn | 24.540 | 1 | |||||||
| Cr | 5.850 | 1 | |||||||
| Ni | 7.500 | 0 | |||||||
| 30–50 | Pb | 6.154 | 1 | 3 | III | Moderate | Moderately Polluted | ||
| Zn | 28.148 | 1 | |||||||
| Cr | 1.482 | 1 | |||||||
| Ni | 1.900 | 0 | |||||||
| 50–100 | Pb | 4.102 | 1 | 3 | III | Moderate | Moderately Polluted | ||
| Zn | 19.422 | 1 | |||||||
| Cr | 1.690 | 1 | |||||||
| Ni | 2.167 | 0 | |||||||
| 100–150 | Pb | 6.836 | 1 | 3 | III | Moderate | Moderately Polluted | ||
| Zn | 23.474 | 1 | |||||||
| Cr | 1.924 | 1 | |||||||
| Ni | 2.467 | 0 | |||||||
| Seaward | 0–15 | Pb | 9.036 | 1 | 3 | III | Moderate | Moderately Polluted | |
| Zn | 24.330 | 1 | |||||||
| Cr | 4.787 | 1 | |||||||
| Ni | 6.138 | 0 | |||||||
| 15–30 | Pb | 4.102 | 1 | 3 | III | Moderate | Moderately Polluted | ||
| Zn | 15.910 | 1 | |||||||
| Cr | 3.563 | 1 | |||||||
| Ni | 5.625 | 0 | |||||||
| 30–50 | Pb | 7.976 | 1 | 2 | IV | Good | Low Polluted | ||
| Zn | 22.606 | 1 | |||||||
| Cr | 1.112 | 0 | |||||||
| Ni | 1.425 | 0 | |||||||
| 50–100 | Pb | 4.558 | 1 | 2 | IV | Good | Low Polluted | ||
| Zn | 16.716 | 1 | |||||||
| Cr | 1.268 | 0 | |||||||
| Ni | 1.625 | 0 | |||||||
| 100–150 | Pb | 6.608 | 1 | 3 | III | Moderate | Moderately Polluted | ||
| Zn | 23.140 | 1 | |||||||
| Cr | 1.443 | 1 | |||||||
| Ni | 1.850 | 0 | |||||||
| MANGROVE SEDIMENT QUALITY INDEX (MSQi) | |||||||||
|---|---|---|---|---|---|---|---|---|---|
| River | Zone | Depth (cm) | MSQi Parameter | Median | MSDPT | ∑ MSDPT SCORE | MSQi CLASS | Rating | Description |
| Tinggi River | Landward | 0–15 | Pb | 8.592 | 1 | 3 | III | Moderate | Moderately Polluted |
| Zn | 36.726 | 1 | |||||||
| Cr | 5.553 | 1 | |||||||
| Ni | 7.120 | 0 | |||||||
| 15–30 | Pb | 7.814 | 1 | 3 | III | Moderate | Moderately Polluted | ||
| Zn | 37.780 | 1 | |||||||
| Cr | 5.108 | 1 | |||||||
| Ni | 6.525 | 0 | |||||||
| 30–50 | Pb | 8.038 | 1 | 2 | IV | Good | Low Polluted | ||
| Zn | 38.836 | 1 | |||||||
| Cr | 1.289 | 0 | |||||||
| Ni | 1.653 | 0 | |||||||
| 50–100 | Pb | 7.592 | 1 | 3 | III | Moderate | Moderately Polluted | ||
| Zn | 38.902 | 1 | |||||||
| Cr | 1.470 | 1 | |||||||
| Ni | 1.885 | 0 | |||||||
| 100–150 | Pb | 8.484 | 1 | 3 | III | Moderate | Moderately Polluted | ||
| Zn | 46.110 | 1 | |||||||
| Cr | 1.674 | 1 | |||||||
| Ni | 2.146 | 0 | |||||||
| Central | 0–15 | Pb | 6.476 | 1 | 3 | III | Moderate | Moderately Polluted | |
| Zn | 37.252 | 1 | |||||||
| Cr | 3.702 | 1 | |||||||
| Ni | 4.746 | 0 | |||||||
| 15–30 | Pb | 5.358 | 1 | 3 | III | Moderate | Moderately Polluted | ||
| Zn | 34.000 | 1 | |||||||
| Cr | 3.393 | 1 | |||||||
| Ni | 4.350 | 0 | |||||||
| 30–50 | Pb | 6.922 | 1 | 2 | IV | Good | Low Polluted | ||
| Zn | 33.934 | 1 | |||||||
| Cr | 0.860 | 0 | |||||||
| Ni | 1.102 | 0 | |||||||
| 50–100 | Pb | 7.146 | 1 | 2 | IV | Good | Low Polluted | ||
| Zn | 36.180 | 1 | |||||||
| Cr | 1.018 | 0 | |||||||
| Ni | 1.257 | 0 | |||||||
| 100–150 | Pb | 7.368 | 1 | 2 | IV | Good | Low Polluted | ||
| Zn | 34.704 | 1 | |||||||
| Cr | 1.116 | 0 | |||||||
| Ni | 1.431 | 0 | |||||||
| Seaward | 0–15 | Pb | 6.698 | 1 | 3 | III | Moderate | Moderately Polluted | |
| Zn | 32.814 | 1 | |||||||
| Cr | 2.777 | 1 | |||||||
| Ni | 3.560 | 0 | |||||||
| 15–30 | Pb | 8.484 | 1 | 3 | III | Moderate | Moderately Polluted | ||
| Zn | 34.880 | 1 | |||||||
| Cr | 2.545 | 1 | |||||||
| Ni | 3.263 | 0 | |||||||
| 30–50 | Pb | 8.494 | 1 | 2 | IV | Good | Low Polluted | ||
| Zn | 40.176 | 1 | |||||||
| Cr | 0.645 | 0 | |||||||
| Ni | 0.827 | 0 | |||||||
| 50–100 | Pb | 8.262 | 1 | 2 | IV | Good | Low Polluted | ||
| Zn | 33.956 | 1 | |||||||
| Cr | 0.735 | 0 | |||||||
| Ni | 0.943 | 0 | |||||||
| 100–150 | Pb | 7.368 | 1 | 2 | IV | Good | Low Polluted | ||
| Zn | 37.252 | 1 | |||||||
| Cr | 0.837 | 0 | |||||||
| Ni | 1.109 | 0 | |||||||
| MANGROVE SEDIMENT QUALITY INDEX (MSQi) | |||||||||
|---|---|---|---|---|---|---|---|---|---|
| River | Zone | Depth (cm) | MSQi Parameter | Median | MSDPT | ∑ MSDPT SCORE | MSQi CLASS | Rating | Description |
| Sepetang River | Landward | 0–15 | Pb | 7.592 | 1 | 3 | III | Moderate | Moderately Polluted |
| Zn | 43.516 | 1 | |||||||
| Cr | 4.596 | 1 | |||||||
| Ni | 4.910 | 0 | |||||||
| 15–30 | Pb | 8.484 | 1 | 3 | III | Moderate | Moderately Polluted | ||
| Zn | 38.506 | 1 | |||||||
| Cr | 3.280 | 1 | |||||||
| Ni | 3.500 | 0 | |||||||
| 30–50 | Pb | 5.582 | 1 | 3 | III | Moderate | Moderately Polluted | ||
| Zn | 28.462 | 1 | |||||||
| Cr | 2.668 | 1 | |||||||
| Ni | 3.420 | 0 | |||||||
| 50–100 | Pb | 3.796 | 1 | 3 | III | Moderate | Moderately Polluted | ||
| Zn | 28.418 | 1 | |||||||
| Cr | 3.042 | 1 | |||||||
| Ni | 2.900 | 0 | |||||||
| 100–150 | Pb | 6.028 | 1 | 3 | III | Moderate | Moderately Polluted | ||
| Zn | 27.054 | 1 | |||||||
| Cr | 3.463 | 1 | |||||||
| Ni | 2.440 | 0 | |||||||
| Central | 0–15 | Pb | 7.592 | 1 | 3 | III | Moderate | Moderately Polluted | |
| Zn | 34.044 | 1 | |||||||
| Cr | 3.064 | 1 | |||||||
| Ni | 3.273 | 0 | |||||||
| 15–30 | Pb | 6.476 | 1 | 3 | III | Moderate | Moderately Polluted | ||
| Zn | 34.528 | 1 | |||||||
| Cr | 2.529 | 1 | |||||||
| Ni | 3.000 | 0 | |||||||
| 30–50 | Pb | 5.805 | 1 | 3 | III | Moderate | Moderately Polluted | ||
| Zn | 31.186 | 1 | |||||||
| Cr | 1.778 | 1 | |||||||
| Ni | 2.280 | 0 | |||||||
| 50–100 | Pb | 8.038 | 1 | 3 | III | Moderate | Moderately Polluted | ||
| Zn | 37.450 | 1 | |||||||
| Cr | 2.028 | 1 | |||||||
| Ni | 2.600 | 0 | |||||||
| 100–150 | Pb | 5.806 | 1 | 3 | III | Moderate | Moderately Polluted | ||
| Zn | 30.352 | 1 | |||||||
| Cr | 2.309 | 1 | |||||||
| Ni | 2.960 | 0 | |||||||
| Seaward | 0–15 | Pb | 6.252 | 1 | 3 | III | Moderate | Moderately Polluted | |
| Zn | 38.264 | 1 | |||||||
| Cr | 5.745 | 1 | |||||||
| Ni | 4.365 | 0 | |||||||
| 15–30 | Pb | 7.592 | 1 | 3 | III | Moderate | Moderately Polluted | ||
| Zn | 46.088 | 1 | |||||||
| Cr | 5.265 | 1 | |||||||
| Ni | 3.470 | 0 | |||||||
| 30–50 | Pb | 6.476 | 1 | 3 | III | Moderate | Moderately Polluted | ||
| Zn | 36.352 | 1 | |||||||
| Cr | 1.334 | 1 | |||||||
| Ni | 1.710 | 0 | |||||||
| 50–100 | Pb | 6.476 | 1 | 3 | III | Moderate | Moderately Polluted | ||
| Zn | 34.858 | 1 | |||||||
| Cr | 1.521 | 1 | |||||||
| Ni | 1.695 | 0 | |||||||
| 100–150 | Pb | 8.262 | 1 | 3 | III | Moderate | Moderately Polluted | ||
| Zn | 43.076 | 1 | |||||||
| Cr | 1.732 | 1 | |||||||
| Ni | 2.220 | 0 | |||||||
| MANGROVE SEDIMENT QUALITY INDEX (MSQi) | |||||||||
|---|---|---|---|---|---|---|---|---|---|
| River | Zone | Depth (cm) | MSQi Parameter | Median | MSDPT | ∑ MSDPT SCORE | MSQi CLASS | Rating | Description |
| Sepetang River | Landward | 0–15 | Pb | 11.610 | 1 | 4 | III | Moderate | Moderately Polluted |
| Zn | 70.308 | 2 | |||||||
| Cr | 6.664 | 1 | |||||||
| Ni | 4.543 | 0 | |||||||
| 15–30 | Pb | 11.610 | 1 | 4 | III | Moderate | Moderately Polluted | ||
| Zn | 65.802 | 2 | |||||||
| Cr | 3.330 | 1 | |||||||
| Ni | 3.705 | 0 | |||||||
| 30–50 | Pb | 10.378 | 1 | 4 | III | Moderate | Moderately Polluted | ||
| Zn | 61.098 | 2 | |||||||
| Cr | 1.547 | 1 | |||||||
| Ni | 2.810 | 0 | |||||||
| 50–100 | Pb | 8.262 | 1 | 4 | III | Moderate | Moderately Polluted | ||
| Zn | 54.418 | 2 | |||||||
| Cr | 1.764 | 1 | |||||||
| Ni | 2.262 | 0 | |||||||
| 100–150 | Pb | 8.932 | 1 | 3 | III | Moderate | Moderately Polluted | ||
| Zn | 43.230 | 1 | |||||||
| Cr | 2.009 | 1 | |||||||
| Ni | 2.575 | 0 | |||||||
| Central | 0–15 | Pb | 11.610 | 1 | 4 | III | Moderate | Moderately Polluted | |
| Zn | 62.572 | 2 | |||||||
| Cr | 4.443 | 1 | |||||||
| Ni | 5.696 | 0 | |||||||
| 15–30 | Pb | 8.484 | 1 | 4 | III | Moderate | Moderately Polluted | ||
| Zn | 56.132 | 2 | |||||||
| Cr | 4.072 | 1 | |||||||
| Ni | 5.220 | 0 | |||||||
| 30–50 | Pb | 8.708 | 1 | 2 | IV | Good | Low Polluted | ||
| Zn | 42.748 | 1 | |||||||
| Cr | 1.031 | 0 | |||||||
| Ni | 1.322 | 0 | |||||||
| 50–100 | Pb | 8.484 | 1 | 2 | IV | Good | Low Polluted | ||
| Zn | 32.044 | 1 | |||||||
| Cr | 1.176 | 0 | |||||||
| Ni | 1.508 | 0 | |||||||
| 100–150 | Pb | 8.262 | 1 | 3 | III | Moderate | Moderately Polluted | ||
| Zn | 27.274 | 1 | |||||||
| Cr | 1.339 | 1 | |||||||
| Ni | 1.717 | 0 | |||||||
| Seaward | 0–15 | Pb | 6.698 | 1 | 3 | III | Moderate | Moderately Polluted | |
| Zn | 46.220 | 1 | |||||||
| Cr | 3.332 | 1 | |||||||
| Ni | 4.272 | 0 | |||||||
| 15–30 | Pb | 7.368 | 1 | 3 | III | Moderate | Moderately Polluted | ||
| Zn | 43.890 | 1 | |||||||
| Cr | 3.176 | 1 | |||||||
| Ni | 3.853 | 0 | |||||||
| 30–50 | Pb | 5.136 | 1 | 2 | IV | Good | Low Polluted | ||
| Zn | 34.286 | 1 | |||||||
| Cr | 0.774 | 0 | |||||||
| Ni | 2.905 | 0 | |||||||
| 50–100 | Pb | 5.358 | 1 | 2 | IV | Good | Low Polluted | ||
| Zn | 28.044 | 1 | |||||||
| Cr | 0.882 | 0 | |||||||
| Ni | 1.175 | 0 | |||||||
| 100–150 | Pb | 6.028 | 1 | 2 | IV | Good | Low Polluted | ||
| Zn | 28.056 | 1 | |||||||
| Cr | 1.004 | 0 | |||||||
| Ni | 1.288 | 0 | |||||||
References
- Faridah-Hanum, I.; Yusoff, F.M.; Fitrianto, A.; Ainuddin, N.A.; Gandaseca, S.; Zaiton, S.; Norizah, K.; Nurhidayu, S.; Roslan, M.K.; Hakeem, K.R.; et al. Development of a comprehensive mangrove quality index (MQI) in Matang Mangrove: Assessing mangrove ecosystem health. Ecol. Indic. 2019, 102, 103–117. [Google Scholar] [CrossRef]
- Mustapha, A.; Gandaseca, S.; Hanafi, A.; Nurhidayu, S. Sediment quality index in Mangrove Forest. Pertanika J. Sch. Res. Rev. 2017, 3, 41–51. [Google Scholar]
- Janaki-Raman, D.; Jonathan, M.P.; Srinivasalu, S.; Armstrong-Altrin, J.S.; Mohan, S.P.; Ram-Mohan, V. Trace metal enrichments in core sediments in Muthupet mangroves, SE coast of India: Application of acid leachable technique. Environ. Pollut. 2007, 145, 245–257. [Google Scholar] [CrossRef] [PubMed]
- Ram, R.; Pavan-Kumar, A.; Jaiswar, A.K.; Gireesh-Babu, P.; Krishna, G.; Chaudhari, A. Identification of fish and shellfish larvae from mangroves using DNA barcodes. J. Coast. Res. 2020, 36, 1106–1110. [Google Scholar] [CrossRef]
- Norman, D. A world without Mangroves? Science 2007, 317, 41–42. [Google Scholar] [CrossRef] [Green Version]
- Yan, B.; Hong, K.; Yu, Z.N. Archaeal communities in mangrove soil characterized by 16S rRNA gene clones. J. Microbiol. 2006, 44, 566–571. [Google Scholar]
- Kathiresan, K. 3. Mangrove Ecosystems 3.1. Distribution of Mangroves. Adv. Mar. Biol. 2005, 92–101. [Google Scholar]
- Hossain, M.D.; Nuruddin, A.A. Soil and mangrove: A review. J. Environ. Sci. Technol. 2016, 9, 198–207. [Google Scholar] [CrossRef] [Green Version]
- Reserve, M.M.F. Development of a Hydrological Index for Mangrove in Matang Mangrove Forest Reserve, Peninsular Malaysia. Master’s Thesis, Universiti Putra Malaysa, Selangor, Malaysia, 2017. [Google Scholar]
- Sarkar, S.K. Trace Metals in a Tropical Mangrove Wetland; Springer: Berlin/Heidelberg, Germany, 2018; ISBN 978-9811027925. [Google Scholar]
- Ding, Z.H.; Liu, J.L.; Li, L.Q.; Lin, H.N.; Wu, H.; Hu, Z.Z. Distribution and speciation of mercury in surficial sediments from main mangrove wetlands in China. Mar. Pollut. Bull. 2009, 58, 1319–1325. [Google Scholar] [CrossRef] [PubMed]
- Dong, A.; Zhai, S.; Matthias, Z.; Yu, Z.; Zhang, H.; Liu, F. Heavy metals in Changjiang estuarine and offshore sediments: Responding to human activities. Acta Oceanol. Sin. 2012, 31, 88–101. [Google Scholar] [CrossRef]
- Maiti, S.; Chowdhury, A. Effects of anthropogenic pollution on Mangrove biodiversity: A Review. J. Environ. Prot. 2013, 2013, 1428–1434. [Google Scholar] [CrossRef] [Green Version]
- Eong, O. Mangroves-a carbon source and sink. Chemosphere 1993, 27, 1097–1107. [Google Scholar] [CrossRef]
- Ashraf, M.A.; Maah, M.J.; Yusoff, I. Heavy metals accumulation in plants growing in ex tin mining catchment. Int. J. Environ. Sci. Technol. 2011, 8, 401–416. [Google Scholar] [CrossRef] [Green Version]
- FAO. The world’s mangroves 1980–2005. FAO For. Pap. 2007, 153, 89. [Google Scholar]
- Ibharim, N.A.; Mustapha, M.A.; Lihan, T.; Mazlan, A.G. Mapping mangrove changes in the Matang Mangrove forest using multi temporal satellite imageries. Ocean. Coast. Manag. 2015, 114, 64–76. [Google Scholar] [CrossRef]
- Praveena, S.M.; Radojevic, M.; Abdullah, M. The assessment of mangrove sediment quality in Mengkabong lagoon: An index analysis approach. Int. J. Environ. Sci. Educ. 2007, 2, 60–68. [Google Scholar] [CrossRef]
- Shafie, N.A.; Aris, A.Z.; Zakaria, M.P.; Haris, H.; Lim, W.Y.; Isa, N.M. Application of geoaccumulation index and enrichment factors on the assessment of heavy metal pollution in the sediments. J. Environ. Sci. Health. A Tox. Hazard. Subst. Environ. Eng. 2013, 48, 182–190. [Google Scholar] [CrossRef] [PubMed]
- El-Said, G.F.; Youssef, D.H. Ecotoxicological impact assessment of some heavy metals and their distribution in some fractions of mangrove sediments from Red Sea, Egypt. Environ. Monit. Assess. 2013, 185, 393–404. [Google Scholar] [CrossRef] [PubMed]
- Aris, A.Z.; Ahmad Puad, N.H.; Shafie, N.A.; Juen, L.L.; Praveena, S.M.; Ramli, M.F.; Yusoff, M.K. The chemometric approach as a useful tool in the identification of metal pollution sources of Nagarajan Nagarani, Arumugam Kuppusamy Kumaraguru, Velmurugan Janaki. EnvironmentAsia 2014, 7, 104–111. [Google Scholar]
- Hossain, M.S. Biological aspects of the coastal and marine environment of Bangladesh. Ocean. Coast. Manag. 2001, 44, 261–282. [Google Scholar] [CrossRef]
- Gandaseca, S.; Wahab, N.L.A.; Pazi, A.M.M.; Rosli, N.; Zaki, P.H. Comparison of water quality status of disturbed and undisturbed mangrove forest at Awat-Awat Lawas Sarawak. Open J. For. 2016, 6, 14–18. [Google Scholar] [CrossRef] [Green Version]
- Yunus, K.; Yusuf, N.M.; Shazili, N.A.M.; Chuan, O.M.; Saad, S. Heavy metal concentration in the surface sediment of Tanjung Lumpur. Sains Malasiana 2011, 40, 89–92. [Google Scholar]
- Ghaderpour, A.; Nasori, K.N.M.; Chew, L.L.; Chong, V.C.; Thong, K.L.; Chai, L.C. Detection of multiple potentially pathogenic bacteria in Matang mangrove estuaries, Malaysia. Mar. Pollut. Bull. 2014, 83, 324–330. [Google Scholar] [CrossRef]
- Carter, M.R.; Gregorich, E.G.; Pennock, D.; Yates, T.; Braidek, J. Soil Sampling and Methods of Analysis, 2nd ed.; CRC Press: Boca Raton, FL, USA, 2007; Volume 44, ISBN 978-0849335860. [Google Scholar]
- Kauffman, J.B.; Donato, D.C. Protocols for the Measurement, Monitoring and Reporting of Structure, Biomass, and Carbon Stocks in Mangrove Forests; Citeseer: Princeton, NJ, USA, 2012. [Google Scholar]
- Mustapha, A.; Pazi, M.; Rosli, N.; Hanafi, A.; Tindit, A.E.; Mohamad Pazi, A.M.; Gandaseca, S.; Rosli, N.; Hamzah, A.H.; Tindit, A.E.; et al. Soil Ph and carbon at different depth in three zones of mangrove forest in Sarawak, Malaysia. MALAYS For. 2016, 79, 164–173. [Google Scholar]
- Beretta, A.N.; Silbermann, A.V.; Paladino, L.; Torres, D.; Bassahun, D.; Musselli, R.; García-Lamohte, A. Análisis de textura del suelo con hidrómetro: Modificaciones al método de Bouyoucus. Cienc. Investig. Agrar. 2014, 41, 263–271. [Google Scholar] [CrossRef] [Green Version]
- Bouyoucos, G.J. Hydrometer method improved for making particle size analyses of soils 1. Agron. J. 1962, 54, 464–465. [Google Scholar] [CrossRef]
- Peech, M. Hydrogen-ion activity. Methods Soil Anal. Part 2 Chem. Microbiol. Prop. 1965, 9, 914–926. [Google Scholar]
- Tan, K.H. Soil Sampling, Preparation, and Analysis; CRC Press: Boca Raton, FL, USA, 1995; ISBN 908-24796756. [Google Scholar]
- Bremner, J.M. Determination of nitrogen in soil by the Kjeldahl method. J. Agric. Sci. 1960, 55, 11–33. [Google Scholar] [CrossRef]
- Murphy, J.; Riley, J.P. A modified single solution method for the determination of phosphate in natural waters. Anal. Chim. Acta 1962, 27, 31–36. [Google Scholar] [CrossRef]
- Udechukwu, B.E.; Ismail, A.; Zulkifli, S.Z.; Omar, H. Distribution, mobility, and pollution assessment of Cd, Cu, Ni, Pb, Zn, and Fe in intertidal surface sediments of Sg. Puloh mangrove estuary, Malaysia. Environ. Sci. Pollut. Res. 2015, 22, 4242–4255. [Google Scholar] [CrossRef]
- Berg, M.G.; Gardner, E.H. Method Soil Analysis Used in the Soil Testing Laboratory at Oregon State University; Special Report; Agricultural Experiment Station: Corvallis, OR, USA, 1978. [Google Scholar]
- George, D.; Mallery, P. IBM SPSS Statistics 23 Step by Step; Routledge: New York, NY, USA, 2016. [Google Scholar] [CrossRef]
- El Nemr, A.; Khaled, A.; Sikaily, A. El distribution and statistical analysis of leachable and total heavy metals in the sediments of the suez gulf. Environ. Monit. Assess. 2006, 118, 89–112. [Google Scholar] [CrossRef] [PubMed]
- Baziene, K.; Tetsman, I.; Albrektiene, R. Level of pollution on surrounding environment from landfill aftercare. Int. J. Environ. Res. Public Health 2020, 17, 2007. [Google Scholar] [CrossRef] [Green Version]
- Kaiser, M.O. Kaiser-Meyer-Olkin measure for identity correlation matrix. J. R. Stat. Soc. 1974, 52, 296–298. [Google Scholar]
- W.H.O. Permissible Limits of Heavy Metals in Soil and Plants; WHO: Geneva, Switzerland, 1996. [Google Scholar]
- Praveena, S.M.; Ahmed, A.; Radojevic, M.; Abdullah, M.H.; Aris, A.Z. Multivariate and geoaccumulation index evaluation in mangrove surface sediment of Mengkabong Lagoon, Sabah. Bull. Environ. Contam. Toxicol. 2008, 81, 52–56. [Google Scholar] [CrossRef]
- Islam, M.S.; Ahmed, M.K.; Raknuzzaman, M.; Habibullah-Al-Mamun, M.; Islam, M.K. Heavy metal pollution in surface water and sediment: A preliminary assessment of an urban river in a developing country. Ecol. Indic. 2015, 48, 282–291. [Google Scholar] [CrossRef]
- Ahmad Adnan, N.; Loneragan, N.R.; Connolly, R.M. Variability of, and the influence of environmental factors on, the recruitment of postlarval and juvenile Penaeus merguiensis in the Matang mangroves of Malaysia. Mar. Biol. 2002, 141, 241–251. [Google Scholar] [CrossRef]
- Sim, V.X.Y.; Dafforn, K.A.; Simpson, S.L.; Kelaher, B.P.; Johnston, E.L. Sediment contaminants and infauna associated with recreational boating structures in a multi-use marine park. PLoS ONE 2015, 10, e0130537. [Google Scholar] [CrossRef] [PubMed]


| KMO Measure of Sampling Adequacy | Bartlett’s Test of Sphericity | ||
|---|---|---|---|
| Approx. Chi-Square | df | Significance | |
| 0.747 | 1436.098 | 91 | <0.001 |
| Variables | Component | |||||
|---|---|---|---|---|---|---|
| 1 | 2 | 3 | 4 | 5 | 6 | |
| N | −0.414 | 0.418 | 0.100 | 0.088 | 0.553 | 0.377 |
| P | 0.670 | −0.261 | 0.294 | −0.110 | 0.189 | −0.239 |
| K | 0.265 | 0.206 | 0.484 | 0.492 | −0.212 | 0.413 |
| Ca | −0.043 | −0.353 | −0.293 | 0.721 | 0.091 | −0.198 |
| Mg | 0.159 | 0.628 | 0.212 | −0.148 | 0.121 | −0.575 |
| Na | −0.695 | −0.104 | −0.007 | −0.108 | 0.334 | 0.252 |
| Mn | 0.657 | 0.182 | 0.326 | 0.365 | −0.236 | 0.002 |
| Fe | −0.336 | 0.735 | 0.110 | 0.278 | 0.203 | −0.191 |
| Pb | 0.778 | −0.135 | 0.293 | −0.125 | 0.253 | 0.108 |
| Zn | 0.757 | −0.213 | 0.210 | −0.220 | 0.337 | 0.097 |
| Cu | 0.566 | −0.125 | −0.237 | 0.294 | 0.306 | 0.063 |
| Cd | 0.492 | 0.034 | −0.459 | 0.222 | 0.300 | −0.171 |
| Cr | 0.653 | 0.432 | −0.407 | −0.177 | −0.175 | 0.204 |
| Ni | 0.615 | 0.442 | −0.444 | −0.135 | −0.099 | 0.255 |
| Eigenvalues | 4.291 | 1.849 | 1.339 | 1.275 | 1.02 | 1.001 |
| Percent of Variance | 30.648 | 13.209 | 9.564 | 9.107 | 7.283 | 7.152 |
| Cumulative Percent | 30.648 | 43.857 | 53.421 | 62.527 | 69.81 | 76.962 |
| Parameters | Component | |||||
|---|---|---|---|---|---|---|
| 1 | 2 | 3 | 4 | 5 | 6 | |
| N | 128 | −0.045 | 0.876 | 0.038 | 0.143 | −0.052 |
| P | 0.769 | −0.024 | −0.305 | 0.067 | 0.102 | 0.097 |
| K | 0.068 | 0.026 | 0.100 | 0.887 | −0.051 | −0.030 |
| Ca | −0.189 | −0.263 | −0.111 | 0.085 | −0.147 | 0.796 |
| Mg | 0.114 | 0.110 | −0.066 | −0.028 | 0.887 | −0.121 |
| Na | −0.267 | −0.357 | 0.567 | −0.308 | −0.209 | −0.145 |
| Mn | 0.313 | 0.208 | −0.293 | 0.694 | 0.183 | 0.129 |
| Fe | −0.376 | −0.021 | 0.424 | 0.169 | 0.684 | 0.045 |
| Pb | 0.841 | 0.199 | −0.075 | 0.219 | −0.028 | 0.025 |
| Zn | 0.883 | 0.200 | −0.051 | 0.062 | −0.079 | 0.039 |
| Cu | 0.407 | 0.279 | 0.014 | 0.102 | −0.097 | 0.560 |
| Cd | 0.246 | 0.386 | −0.051 | −0.121 | 0.115 | 0.619 |
| Cr | 0.143 | 0.912 | −0.134 | 0.094 | 0.062 | 0.010 |
| Ni | 0.125 | 0.913 | −0.038 | 0.084 | 0.040 | 0.062 |
| Eigenvalues | 2.719 | 2.228 | 1.506 | 1.498 | 1.422 | 1.402 |
| Percent of Variance | 19.419 | 15.911 | 10.755 | 10.700 | 10.160 | 10.017 |
| Cumulative Percent | 19.419 | 35.33 | 46.085 | 56.785 | 66.945 | 76.962 |
| MSQi Parameter | Low (mg/kg) Rating 0 | Medium (mg/kg) Rating 1 | High (mg/kg) Rating 2 |
|---|---|---|---|
| Pb | X ≤ 2.00 | 2.00 < X < 85.00 | X ≥ 85.00 |
| Zn | X ≤ 0.60 | 0.60 < X < 50.00 | X ≥ 50.00 |
| Cr | X ≤ 1.30 | 1.30 < X < 100.00 | X ≥ 100.00 |
| Ni | X ≤ 10.0 | 10.00 < X < 35.00 | X ≥ 35.00 |
| Suggested Parameter | Rating (PFs) | MSDPT | ||
|---|---|---|---|---|
| 0 | 1 | 2 | ||
| Pb | 0 | 1 | 0 | 1 |
| Zn | 0 | 0 | 2 | 2 |
| Cr | 0 | 0 | 0 | 0 |
| Ni | 0 | 0 | 2 | 2 |
| Total Score MSHT | 5 | |||
| ∑ MSDPT | MSQi Class | Rating | Description |
|---|---|---|---|
| 0 | V | Excellent | Not Polluted |
| 1 | IV | Good | Low Polluted |
| 2 | IV | Good | Low Polluted |
| 3 | III | Moderate | Moderately Polluted |
| 4 | III | Moderate | Moderately Polluted |
| 5 | II | Bad | High Polluted |
| 6 | II | Bad | High Polluted |
| 7 | I | Very Bad | Highly Polluted |
| 8 | I | Very Bad | Highly Polluted |
Publisher’s Note: MDPI stays neutral with regard to jurisdictional claims in published maps and institutional affiliations. |
© 2021 by the authors. Licensee MDPI, Basel, Switzerland. This article is an open access article distributed under the terms and conditions of the Creative Commons Attribution (CC BY) license (https://creativecommons.org/licenses/by/4.0/).
Share and Cite
Mohamad Pazi, A.M.; Khan, W.R.; Nuruddin, A.A.; Adam, M.B.; Gandaseca, S. Development of Mangrove Sediment Quality Index in Matang Mangrove Forest Reserve, Malaysia: A Synergetic Approach. Forests 2021, 12, 1279. https://doi.org/10.3390/f12091279
Mohamad Pazi AM, Khan WR, Nuruddin AA, Adam MB, Gandaseca S. Development of Mangrove Sediment Quality Index in Matang Mangrove Forest Reserve, Malaysia: A Synergetic Approach. Forests. 2021; 12(9):1279. https://doi.org/10.3390/f12091279
Chicago/Turabian StyleMohamad Pazi, Ahmad Mustapha, Waseem Razzaq Khan, Ahmad Ainuddin Nuruddin, Mohd Bakri Adam, and Seca Gandaseca. 2021. "Development of Mangrove Sediment Quality Index in Matang Mangrove Forest Reserve, Malaysia: A Synergetic Approach" Forests 12, no. 9: 1279. https://doi.org/10.3390/f12091279