Article

Drought Variability and Characteristics in the Muda River Basin of Malaysia from 1985 to 2019

1
GeoInformatic Unit, Geography Section, School of Humanities, Universiti Sains Malaysia, Gelugor 11800, Penang, Malaysia
2
Department of Earth Sciences and Environment, Faculty of Science and Technology, Universiti Kebangsaan Malaysia, Bangi 43600, Selangor, Malaysia
3
Department of Civil Engineering, Universiti Putra Malaysia, Serdang 143400, Selangor, Malaysia
4
Department of Geography, Hong Kong Baptist University, Kowloon Tong, Hong Kong 999077, China
5
Center for Environmental Sustainability and Water Security (IPASA), Universiti Teknologi Malaysia (UTM), Skudai 81310, Johore, Malaysia
6
New Era and Development in Civil Engineering Research Group, Scientific Research Center, Al-Ayen University, Nasiriyah 64001, Thi-Qar, Iraq
7
College of Creative Design, Asia University, Taichung City 41354, Taiwan
*
Author to whom correspondence should be addressed.
Atmosphere 2021, 12(9), 1210; https://doi.org/10.3390/atmos12091210
Submission received: 22 July 2021 / Revised: 11 September 2021 / Accepted: 12 September 2021 / Published: 17 September 2021
(This article belongs to the Special Issue Extreme Hydro-Climate Events: Past, Present, and Future)

Abstract

:
This study aimed to analyze the spatiotemporal changes of historical droughts over the Muda River basin (MRB), Malaysia, from 1985 to 2019 using the Standardized Precipitation Index (SPI) and the Standardized Streamflow Index (SSI). The Mann–Kendall test and Sens’ slope were used to evaluate the trends and magnitude changes in the droughts, respectively, while Spearman’s rho was applied to understand the relationships of the droughts with large-scale atmospheric circulations, such as the El Niño Southern Oscillation (ENSO), the Indian Ocean Dipole (IOD), and the Madden–Julian Oscillation (MJO). The results show that the intense droughts in the MRB mostly occurred in 1991–1992, 1995, 1998, 2002–2003, 2005–2006, 2008, 2012–2013, and 2016. In addition, a declining SPI trend was found from May to December at most of the stations. About 80% of the stations experienced about 10 severely dry droughts, while almost all stations experienced at least 5 extremely dry events. Moreover, a higher response rate of the SSI than the SPI was found during low-rainfall months from January to May. Lastly, ENSO had a larger impact on the drought formations over the MRB compared to the IOD and MJO, especially during the dry period.

1. Introduction

Drought affects agricultural and water resources in various parts of the world [1]. The World Meteorological Organization (WMO) defines drought as a rainfall deficit compared to the normal level for a prolonged period [2,3]. Drought is a regional phenomenon, and the characteristics of drought differ from one place to another [4]. In the past three decades, droughts have affected more than 66 million people in Southeast Asia [5]. Drought is a severe threat to environmental, agricultural, and socio-economic activities due to inadequate water. Therefore, understanding droughts is important for designing better adaptation strategies to reduce the drought impact on agricultural and water resources.
Malaysia experienced numerous severe droughts that impacted the environment and social activities throughout the country; one of the most significant events occurred during the 1997/98 El Niño [
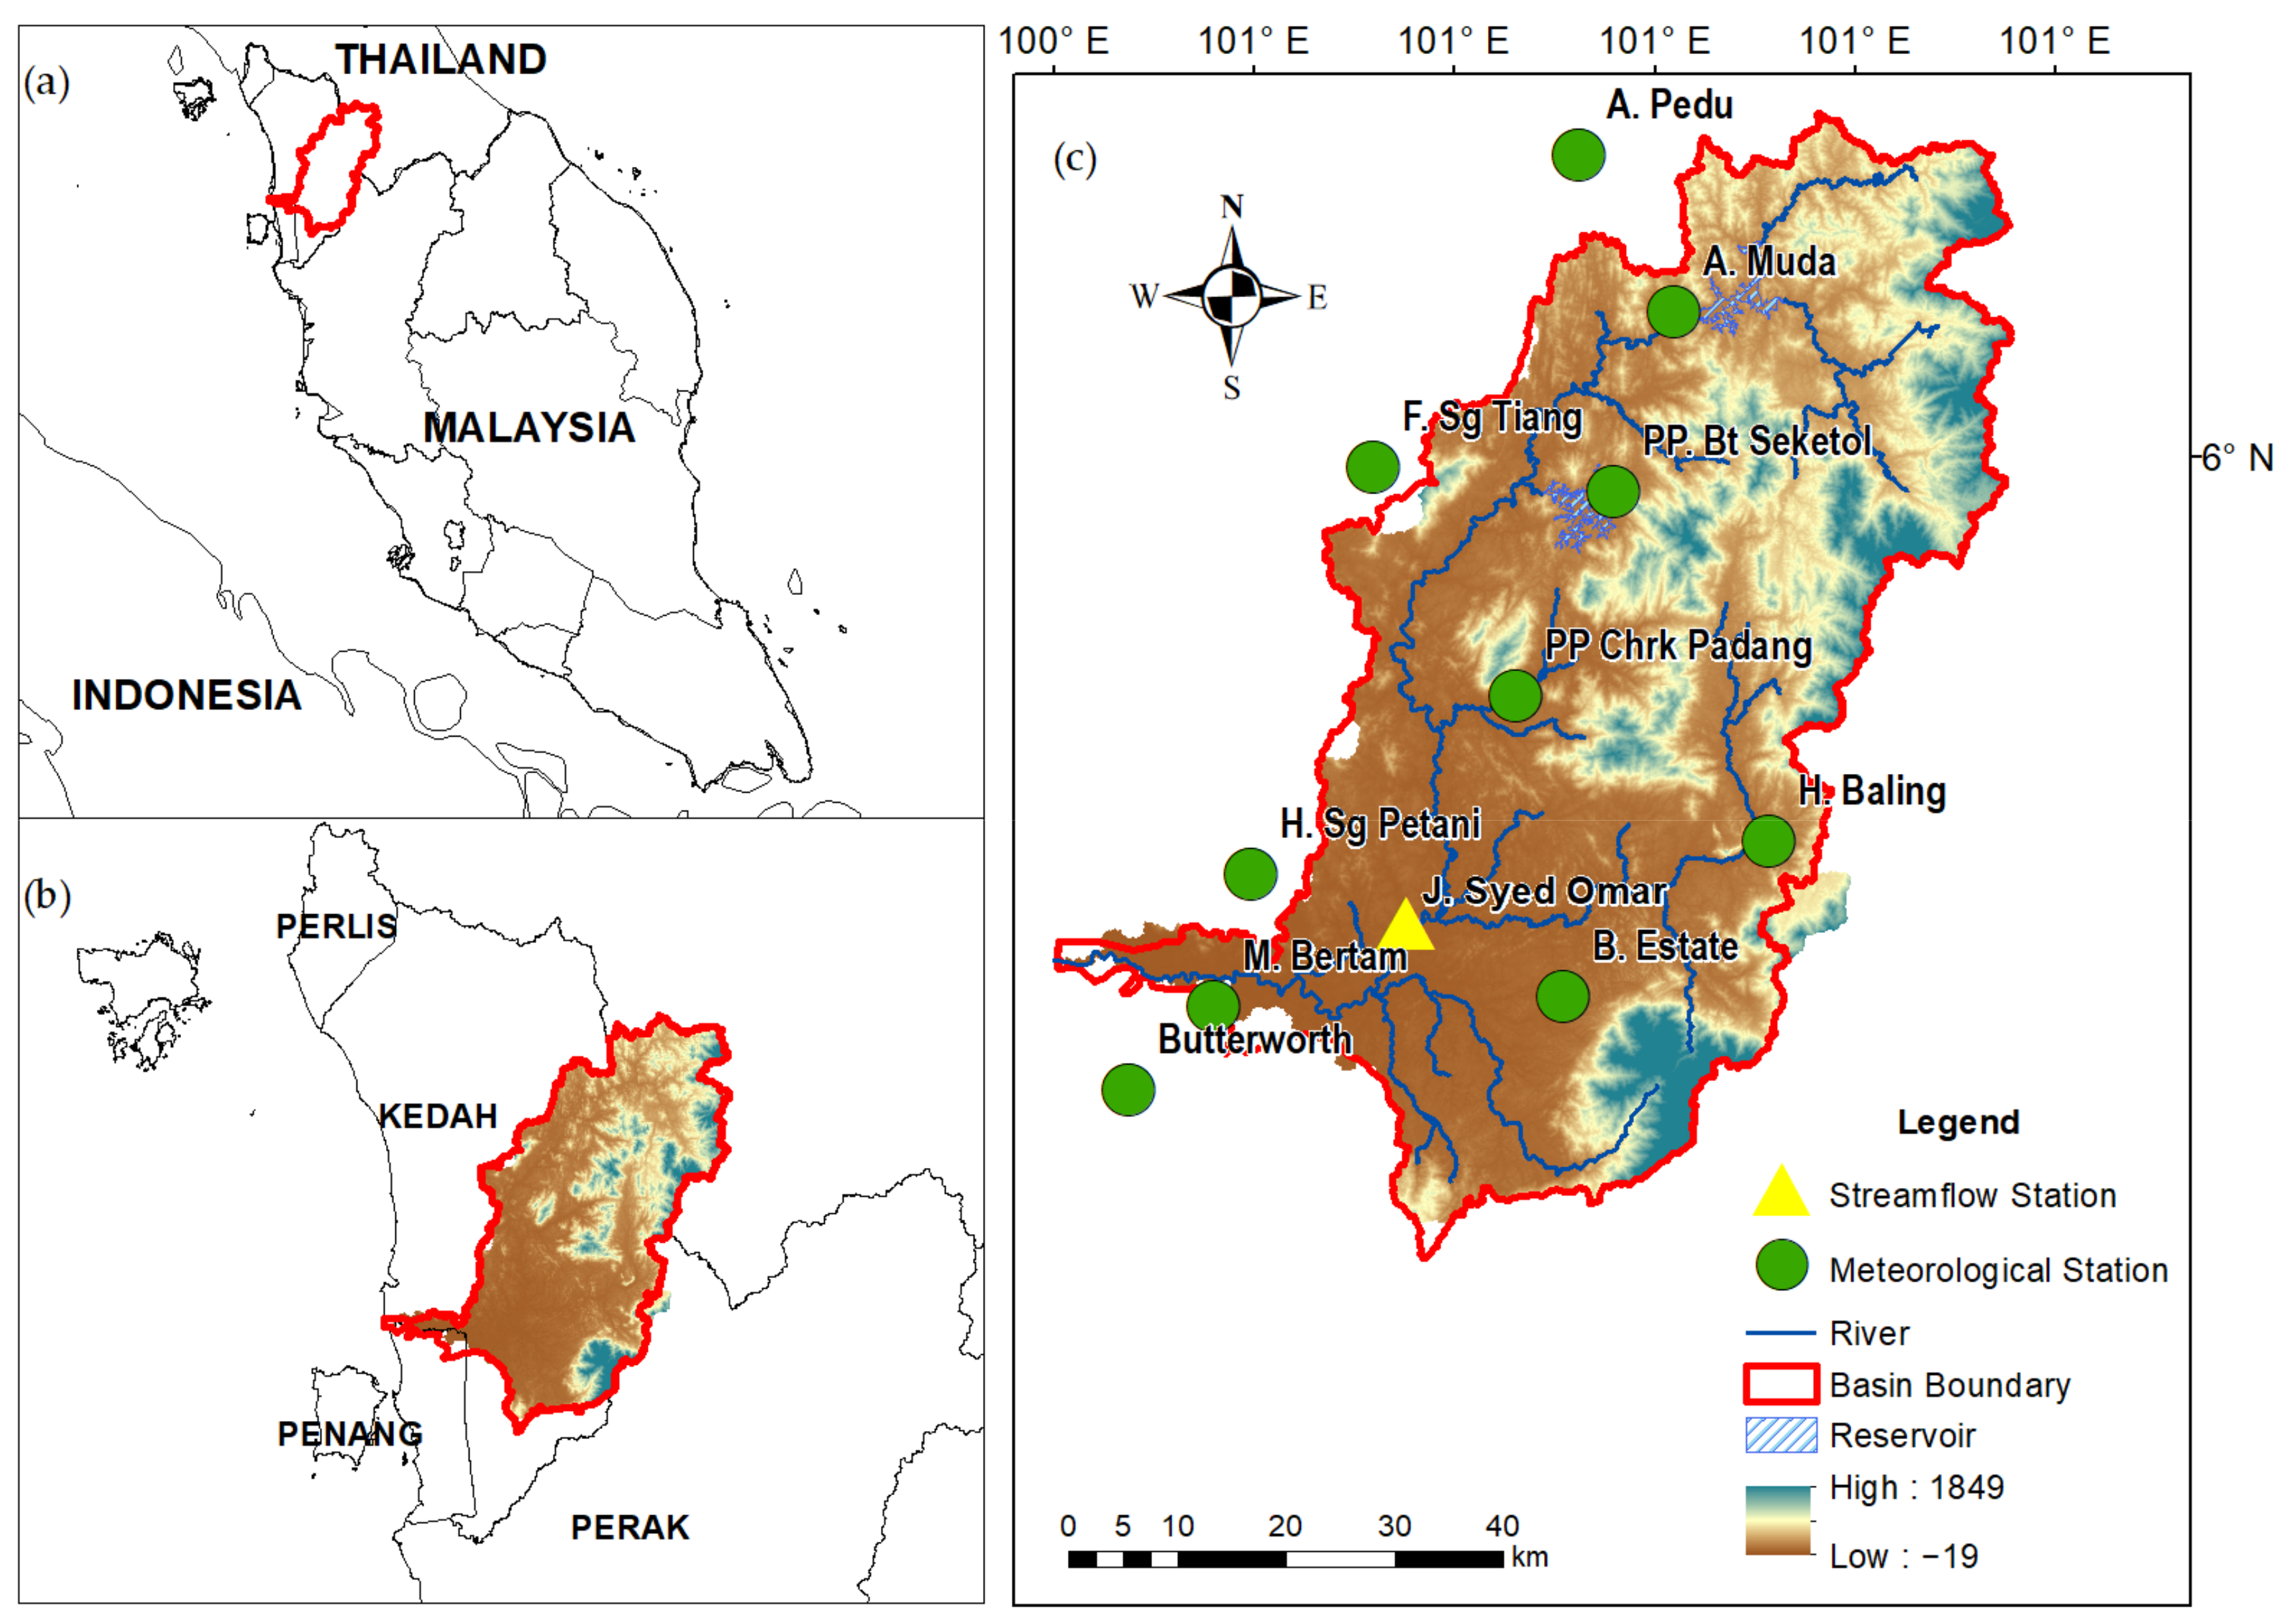
6]. The Muda River basin (MRB) is an important basin that supplies fresh water to the northern states in Peninsular Malaysia. The Muda River supplies about 80%, 96%, and 50% of fresh water to Penang, Kedah, and Perlis, respectively [7]. As home to the largest rice production, severe droughts could threaten food security in Malaysia [8]. For instance, 35 farmers from Pokok Sena Kedah were reported to have lost almost 1 million Malaysian ringgit (~USD 240,000) in January 2020, when more than 72 hectares of the paddy field was affected by drought [9].
Low rainfall normally occurs in the northern states, Perlis, Kedah, Penang, and northern Perak during the final phase of the northeast monsoon (NEM) from February to March. The total rainfall during the NEM is the lowest in northern Peninsular Malaysia, which ranges between 300 mm and 900 mm [6]. Furthermore, large-scale climate circulation plays an important role affecting the Malaysian weather [10]. The Malaysian anomalous rainfall is largely related to ENSO and local air–sea influences [11]. ENSO also has been demonstrated to affect the inter-annual variability of Malaysian temperature for the past few decades [12,13]. ENSO-related coherence shifts northward across the equator during the NEM season [11], strengthening the relationship between ENSO and rainfall. In addition, ENSO has affects droughts in the Johor River basin, which is located in southern Peninsular Malaysia and supplies fresh water to Johor and Singapore [3]. Understanding the impact of large-scale atmosphere circulation on local drought is critical to project future drought patterns [14]. However, previous studies have mainly considered only the ENSO effect, whereas the influence of other circulations such as the Indian Ocean Dipole (IOD) and the Madden–Julian Oscillation (MJO) on droughts in the MRB is still relatively rarely studied and thus needs further investigation. Nevertheless, several studies have described the effects of the MJO and IOD on the mean rainfall and extremes in Peninsular Malaysia [15,16,17].
The Standardized Precipitation Index (SPI) is widely applied to analyze drought around the world [3]. The SPI is easy to use as it only requires monthly rainfall data and it can be calculated at different timescales [18,19]. The index has been used to identify and monitor drought events in river basins of Malaysia, such as the Sarawak River basin [20], Kelantan River basin [21], and Johor River basin [22]. In recent years, there has been an increasing interest in applying both the SPI and the Standardized Precipitation Evapotranspiration Index (SPEI) for robust estimation of drought occurrence [23]. In Malaysia, the SPI and SPEI tended to show similar drought frequency and variability but different numbers of dry months [24]. These assessments are mostly limited to the regional scale, and it would be insightful to investigate the influence of different drought indices at the basin scale if the temperature data are available.
In contrast, the Standardized Streamflow Index (SSI) is frequently employed to understand hydrological droughts [25]. The SSI uses the same formula as the SPI but with monthly streamflow as data input. Tan et al. [3] evaluated the response rate of streamflow to precipitation in the Johor River basin to understand how drought affects hydrological drought conditions. They found that hydrological drought in the normal rainfall condition in the basin could possibly be attributed to human and damming activities. The construction of dams has a considerable impact on the hydrological cycle and could interfere with the natural evolution of hydrological drought [26]. A similar assessment of the response rate of streamflow to drought in the MRB is important to better understand the drought formation mechanism in the basin. Ultimately this can help improve the drought early warning system and inform new strategies for drought mitigation.
This study aims to assess the spatio-temporal changes in meteorological and hydrological droughts over the MRB from 1985 to 2019 using the SPI and SSI, respectively. The specific objectives include (1) quantifying the drought duration, peak, severity, and intensity; (2) evaluating the impact of ENSO, the IOD, and the MJO on tropical droughts; and (3) evaluating the response rate of the SSI to SPI. The findings of this study could be used in water resource management and policy formulation with the consideration of drought patterns and characteristics. This article is divided into five sections. The next section describes the study area, data, and methods used in this study. The third section presents the main findings, while the fourth section provides some discussion related to the findings. In the last section, an overall conclusion with some future study recommendations are presented.

2. Methods

2.1. Study Area

The Muda River is one of the longest rivers in Kedah, with a total length of 180 km and a basin size of 4111 km2 [27]. The MRB covers the states of Kedah and Penang located in the northwest region of Peninsular Malaysia (Figure 1). The climate system of the MRB is characterized by the NEM from November to March, the Southwest Monsoon (SWM) from May to August, and two inter-monsoons in April and October. The MRB receives more rainfall during the inter-monsoons because heavy rainfall brought by the northeast and southwest monsoons is reduced by the Titiwangsa and Sumatra mountain ranges [6,28], respectively.
The Muda dam in the upstream region was constructed for supplying water to the Kedah, Penang, and Perlis states. Meanwhile, the Beris dam is exclusively responsible for supplying water to Kedah for agriculture, industries, and domestic usage of water [7]. Table 1 lists the reported drought events in northern Peninsular Malaysia.

2.2. Observed Data

Observed monthly climate data for the period of 1985-2019 were retrieved from the Malaysian Meteorological Department (MMD), as shown in Figure 1c. Most of the stations measure only rainfall data, while only the Ampangan Muda, Pusat Pertanian Charok Padang, and Butterworth stations measure long-term temperature data. Whereas, monthly streamflow data at the Jambatan Syed Omar station were collected from the Department of Irrigation and Drainage Malaysia. Table 2 lists the locations and names of the climate and hydrological stations used in this study.

2.3. Standardized Precipitation Index

The World Meteorological Organization (WMO) recommends the use of the SPI for characterizing meteorological drought [39]. In this study, the SPI 3-month (SPI-3) timescale was measured using the SPI generator developed by the National Drought Mitigation Centre (NDMC). The 3-month SPI provides a seasonal estimation of rainfall [40]. Table 3 indicates the drought categories based on the SPI values, e.g., an SPI value smaller than −2.00 can be considered as an extremely dry condition. We defined a drought as an SPI value lower than −1 for more than 3 months continuously [3]. The SPI was selected for drought analysis in this study because the rainfall transformed into a normalized value, so the wet and dry conditions were represented in a similar way [41]. The SPI was measured using the following equation:
  SPI = x i µ   σ
where i = month, xi = rainfall in a month, µ = average rainfall, and σ = standard deviation.
Due to the limited availability of temperature data, the SPI was primarily used to analyze the temporal and spatial variabilities in the drought in the MRB. Then, the Pearson correlation coefficient (CC) was used to evaluate the relationships between the SPI and SPEI at 1-, 3-, 6-, and 12-month timescales [43] at the three stations where long-term maximum and minimum temperatures were available (refer to Section 2.2). The SPEI was calculated using the SPEI package that available in the R programming tool.

2.4. Standardized Streamflow Index

The SSI enables simple yet effective quantification of the hydrological drought conditions of a river basin [25]. Many researchers have applied the SSI to analyze drought in Malaysia [3,21,26]. For example, Tan et al. [21] applied both the SPI and the SSI to study future drought patterns in the Kelantan River basin located in north-eastern Peninsular Malaysia and found that the drought duration might be longer in the future. The only difference between the SSI and the SPI is the input of the data, where the SPI uses monthly rainfall data, while the SSI uses monthly streamflow data.

2.5. Large-Scale Atmospheric Circulation

ENSO is one of the most important ocean atmosphere phenomena affecting the climate variability of tropical and subtropical regions [3]. Niño 3.4 developed by the National Oceanic and Atmospheric Administration (NOAA) was used to represent the ENSO variability in this study. Basically, Niño 3.4 is a five-phase-averaged index, which defines El Niño or La Niña events whenever the Niño 3.4 SSTs are +/−0.4 °C for 6 months or more. The index is freely available at https://www.cpc.ncep.noaa.gov/data/indices/oni.ascii.txt (accessed on 15 June 2021).
The IOD is the Indian ocean counterpart of the Pacific El Niño and La Niña. The IOD defines the differences in the SST between the western pole (Arabian Sea) and the eastern pole (Indian Ocean). Both poles are located within the equatorial of the Indian Ocean (i.e., between 10° N and 10° S). The Dipole Mode Index (DMI) was used to represent the IOD, which is freely available at https://psl.noaa.gov/gcos_wgsp/Timeseries/DMI/ (accessed on 15 June 2021) and is hosted by NOAA. A positive DMI refers to a positive IOD phenomenon, while a negative DMI indicates a negative IOD phenomenon.
The MJO is the leading mode of intra-seasonal variability of a tropical region. In general, it moves eastward at about 4 to 8 ms−1, crossing the tropics in 30 to 90 days. Hence, intra-seasonal variability in monsoon rainfall is influenced by the MJO. The outgoing longwave radiation (OLR) MJO Index (OMI) quantifies historical and current MJO activities. The index can be accessed freely at https://psl.noaa.gov/mjo/mjoindex/ (accessed on 15 June 2021).

2.6. Trend Analysis

The Mann–Kendall test is widely used to evaluate the trend in climate and hydrological variables [44,45]. A Z absolute value of more than ±1.96 indicates a significant trend at the 95% confidence level. A positive value indicates an increasing trend in the SPI or SSI, showing decreases in the severity of drought in recent years. In contrast, a negative value indicates a decreasing trend in the SPI or SSI, which represents increases in the severity of drought [46,47]. Meanwhile, Sen’s non-parametric test was used to estimate the magnitude or average changes in the SPI and SSI. The Sen’s slope values were then mapped using ArcMap 10.8 software to evaluate the magnitude change spatially.
The Mann–Kendall Z value is calculated using Equation (2):
Z = S 1 σ 2           i f   S > 0 0                     i f   S = 0 S + 1 σ 2           i f   S < 0
where,
S = k 1 n 1 j = k + 1 n s g n x j x k     s g n x j x k   = + 1           i f   x j x k   > 0 0               i f   x j x k   = 0 1           i f   x j x k   < 0
where x j and x k   are the annual values in year j and k (j > k), respectively, and n is the length of the data series. For a sample size of more than 10, the mean variance is as given by Masroor et al. [47]:
σ 2 = ( n   n 1 2 n   + 5 p = 1 q t p   t p 1 2 t p + 5 18
where tp is the number of ties for the p-th value and q is the number of tied values. For a sample size larger than 10, the mean variance is as given by Masroor et al. [47]:
E s = 0
The non-parametric procedure introduced by Sen [48] produces slope estimates of N pairs of the data predicted, as by Sen’s estimator:
Q i = x j x k j k     i = 1 , , N
In Equation (7), for N values, Qi ranked from the smallest to the largest and x j and x k   are annual values in year j and k (j > k), respectively.
Q med = Q 2 N + 1 ,   N   is   odd 1 2 N Q / 2 + Q N + 2 / 2 ,   N   is   even

2.7. Drought Characteristics

Several drought characteristics, such as drought intensity (DI), drought severity (DS), drought peak (DP), and drought duration (DD), were defined to characterize the drought events in the MRB. DS was calculated by summing the SPI values for the particular drought event, whereas DI was measured by dividing DS by DD [39]. DP is the lowest SPI value during a drought event. The drought evaluation is similar to the studies conducted in Balochistan, Iran [39], and the Sarawak River basin, Malaysia [20].
Drought   Severity   DS = j = 1 DD SPI j
Drought   Intensity   DI =   DS DD
where j represents the month and SPI(j) is the SPI value in month j.

2.8. Response Rate Analysis

Response rate analysis was used to understand the connections between the SSI and the SPI. The response rate is defined as the percentage of the SPI correlated to the SSI [49]. If the percentage of the response rate is high, the connections between the SSI and the SPI are strong, whereas a low percentage indicates weak connections. The formula used to measure the response rate is as follows:
R r = n m × 100
where m is the number of droughts in which the SPI < 0 from 1985 to 2019, while n is the number of droughts that fulfil the criteria of SSI < 0 and SPI < 0. In addition, response rate analysis also indicates the sensitivity between drought type [49], for example, the formation of meteorological drought is faster than hydrological drought, so the delay period would be a useful signal or information for policy makers to use in decision making related to preparedness.

2.9. Correlation Analysis

Spearman’s rank correlation was used to evaluate the relationship between the SPI or SSI and large-scale atmospheric circulations (ENSO, IOD, and MJO) [50]. This method can also be used to summarize the strength and direction (+ or -) of the relationship. For instance, Jahanshahi and Shahedi [51] and Tan et al. [3] used Spearman’s rho correlation to understand the impact of large-scale atmospheric circulation in Iran and southern Peninsular Malaysia, respectively. Spearman’s rank correlation is calculated as follows:
p = 1 6 d i 2 n n 2   1  
where the p is the Spearman’s rho correlation, di is the difference between the two ranks of the object (drought indices and atmospheric circulation indices), and n is the number of observations.

3. Results

3.1. Spatio-Temporal Analysis of SPI

Figure 2 shows the temporal changes in the SPI for each evaluated station over the MRB. The Badenoch Estate station experienced the most extreme drought in January 1992, while the other stations experienced moderate or severe droughts in the same period. In 1986, most of the stations recorded extreme drought, except the Felda Sungai Tiang and Hospital Sungai Petani stations. A minimum of five extreme drought events were observed at all the meteorological stations from 1985 to 2015. Meanwhile, the Butterworth station recorded the highest number of extreme drought events, mainly in 1985, 1986, 1987, 1988, 1991, 1994, 1995, 1998, 2002, 2008, 2010, and 2016. In 2016, an extreme drought (>−2) was observed at the majority of the stations in the MRB, except the Hospital Baling station. These findings are in line with the reported drought affecting human activities and water resources in Kedah and Penang (Table 1) and also the findings reported by Fung et al. [24] and Tan et al. [3].
A significant increasing trend in SPI-3 was found at numerous stations in January, February, April, June, and August at a 95% confidence level (Figure 3). For example, the Felda Sungai Tiang station showed a significantly increasing trend in the SPI in January and February. Meanwhile, the Hospital Sungai Petani station demonstrated a significantly increasing trend in February, April, and August, with the magnitudes 0.041, 0.037, and 0.045, respectively. The Hospital Baling and Ampangan Muda stations also showed a significantly increasing trend in January, with SPI magnitude changes of 0.04. Moreover, the MARDI Bertam (0.040) and Pusat Pertanian Charok Padang (0.029) stations had a significantly increasing trend of SPI-3 in February. Most of the stations showed an increasing trend in SPI-3 from January to March. The findings are consistent with the monthly rainfall trend analysis conducted by Tan et al. [52] over the MRB, where increases in monthly rainfall were mainly found during the low-precipitation period, such as January, February, April, and December.
The Hospital Baling station had a decreasing trend in the SPI in September, October, and November, with magnitude changes of −0.028, −0.035, and −0.040, respectively. In addition, the SPI values at the Felda Sungai Tiang and Badenoch Estate stations also decreased significantly in September by −0.039 and −0.027, respectively. Most of the stations experienced a declining trend in this season, particularly the Pusat Pertanian Charok Padang, Hospital Baling, and Badenoch Estate stations. Moreover, the Badenoch Estate station faced the largest declining trend, as shown in Figure 3. Most of the drought events in the northern region of Peninsular Malaysia were found from January to April and June (Table 1), so the decreasing trend in the SPI during the wet period may not enhance drought formation in the MRB. In addition, insignificant changes in the SPI trend may be caused by the high variability in tropical rainfall; therefore, it is difficult to obtain significant results at most of the stations.

3.2. Temporal Analysis of SSI

Table 4 presents 12 hydrological drought events detected in the MRB between 1985 and 2019. More than 58% of the hydrological droughts last at least 5 months or more. The longest drought (13 months) was observed from April 1990 to May 1991 and February 2002 to March 2003. Moreover, the drought peak was similar during both events but with different severities of −2.3 in 1990/1991 and −2.37 in 2002/2003. There were five drought events with peaks of −2 or less. One of the most recent hydrological drought events occurred from October 2016 to January 2017. This is consistent with the actual drought event reported by the bulletin of the National Water Services Commission (SPAN), who found that the El Niño phenomenon affected this region seriously in 2016, where the temperature increased by 0.5 °C to 2 °C.

3.3. Drought Characteristics

To further analyze drought occurrence in the MRB, Figure 4 shows the number of drought events that occurred in the MRB, categorized into three groups based on the SPI values. About 70% of the stations in the MRB experienced more than 20 moderately dry droughts. Meanwhile, 80% of the stations experienced more than 10 severely dry droughts events, whereas all stations experienced more than five extremely dry drought events from 1985 to 2019.
Figure 5 indicates the drought characteristics, such as duration, peak, severity, and intensity, in the MRB from 1985 to 2019. The Pusat Pertanian Charok Padang station had the shortest maximum drought period, which was recorded in 2006. Several drought events occurred over more than 10 months, e.g., at the Ampangan Pedu, Butterworth, Felda Sungai Tiang, and Hospital Sungai Petani stations. Meteorological droughts in tropical basins are relatively short, lasting for 3 months [3]. Furthermore, any drought condition in Malaysia need 2 to 3 months to recover into a non-drought condition [53]. However, this study showed that extreme drought events in the MRB can still last up to 18 months. For instance, the Pusat Pertanian Batu Seketol and Pusat Pertanian Charok Padang stations had a maximum drought duration of 10 months, whereas the Felda Sungai Tiang station recorded the longest drought duration of 18 months in 2001/2003.
The highest maximum drought severity (−22.74) was detected at the Felda Sungai Tiang station, while the Pusat Pertanian Charok Padang station had the lowest maximum drought severity (−9.64), as shown in Figure 5b. The maximum drought severities were mostly recorded in 1992 at the Badenoch Estate, Pusat Pertanian Batu Seketol, and Pusat Pertanian Charok Padang stations. Figure 5c shows that the Hospital Baling station had the highest drought intensity of −2.26, followed by the Felda Sungai Tiang and Pusat Pertanian Batu Seketol stations. The Felda Sungai Tiang station recorded two different drought events with similar values of drought intensity from September 1994 to August 1995 and August 2005 to December 2005. Meanwhile, the Pusat Pertanian Batu Seketol station recorded the maximum drought intensity of −2.02. In general, most of the stations in the middle and upper parts of the MRB experienced more intense drought events than the downstream parts.
Figure 5d shows that some stations experienced a peak drought of more than −3. From January to October 1990, the Hospital Sungai Petani station experienced a peak drought of −3.01. In addition, the peak drought at the Hospital Baling station occurred from July 2012 to January 2013 with an SPI value of −3.04. The Pusat Pertanian Batu Seketol station faced a peak drought of −3.06 from April to July 2016, whereas the Felda Sungai Tiang station had the worst drought peak at −3.38 from late 1994 to August 1995. The extremely dry droughts events at all the 10 stations between 1985 and 2019 are listed in Table 5. Most of the stations have experienced more intense droughts in recent years, which is consistent with Yusof [54], who found an increase in dry spells in Peninsular Malaysia.

3.4. Response Rate Analysis

Figure 6 presents the response rate of streamflow to precipitation at seasonal and monthly scales for the 1985–2019 period. A moderate response rate was recorded in June of 55.6%, while May and October had the highest response rate recorded during these months. A moderate seasonal response rate was found in June to August (JJA) (65.5%) and September to November (SON) (69.2%). In contrast, the DJF and MAM seasons showed a stronger connection between the SSI and the SPI compared to JJA and SON. A response rate of more than 80% was found in January, March to May, and October, showing that rainfall has a larger influence on streamflow in these periods. As the drought in the MRB normally occurs during March to May, the finding shows that rainfall plays a major role in freshwater supplies during the dry period.

3.5. Atmospheric Circulation Analysis

Table 6 shows the correlation of ENSO, IOD, and MJO indices with the SPI and SSI for the period of 1985 to 2019. Overall, ENSO had a greater impact on the hydro-meteorological drought in the MRB than the IOD and MJO. For example, ENSO correlated significantly with SPI-3 in January (−0.36), February (−0.34), March (−0.62), and April (−0.67) at a 95% confidence level. With SSI-3, ENSO had a significant relationship in April (−0.55) and May (−0.43). However, the IOD correlated significantly with SPI-3 and SSI-3 in March at a 95% confidence level, with correlation values of 0.46 and 0.44, respectively. The MJO correlated significantly with SPI-3 in February (0.41) and August (−0.35) at a 95% confidence level, showing that the phenomenon has a considerable impact on the meteorological drought formation in the final phase of the NEM.
During the NEM, the northwest part of Peninsular Malaysia can be considered as the driest region in Malaysia [55]. Cheang et al. [56] indicated that a long drought normally begins in the NEM in northern Peninsular Malaysia. The ENSO coherence shifts northward across the equator in the NEM, affecting the rainfall in Malaysia. During this season, anomalous cyclonic circulation over the ocean influences the anomalous Malaysian rainfall [11]. In addition, a higher correlation between hydrological droughts and ENSO could be found from February to May as compared to other months. The climate in Southeast Asia is periodic and closely related to the phenomenon of ENSO [57], where the sea surface temperatures (SSTs) in the tropical Pacific increase or decrease during several years of alternating warming periods (El Niño) and cooling (La Niña), respectively [58]. These changes, in turn, influence precipitation and winds in Southeast Asia and other regions.

4. Discussion

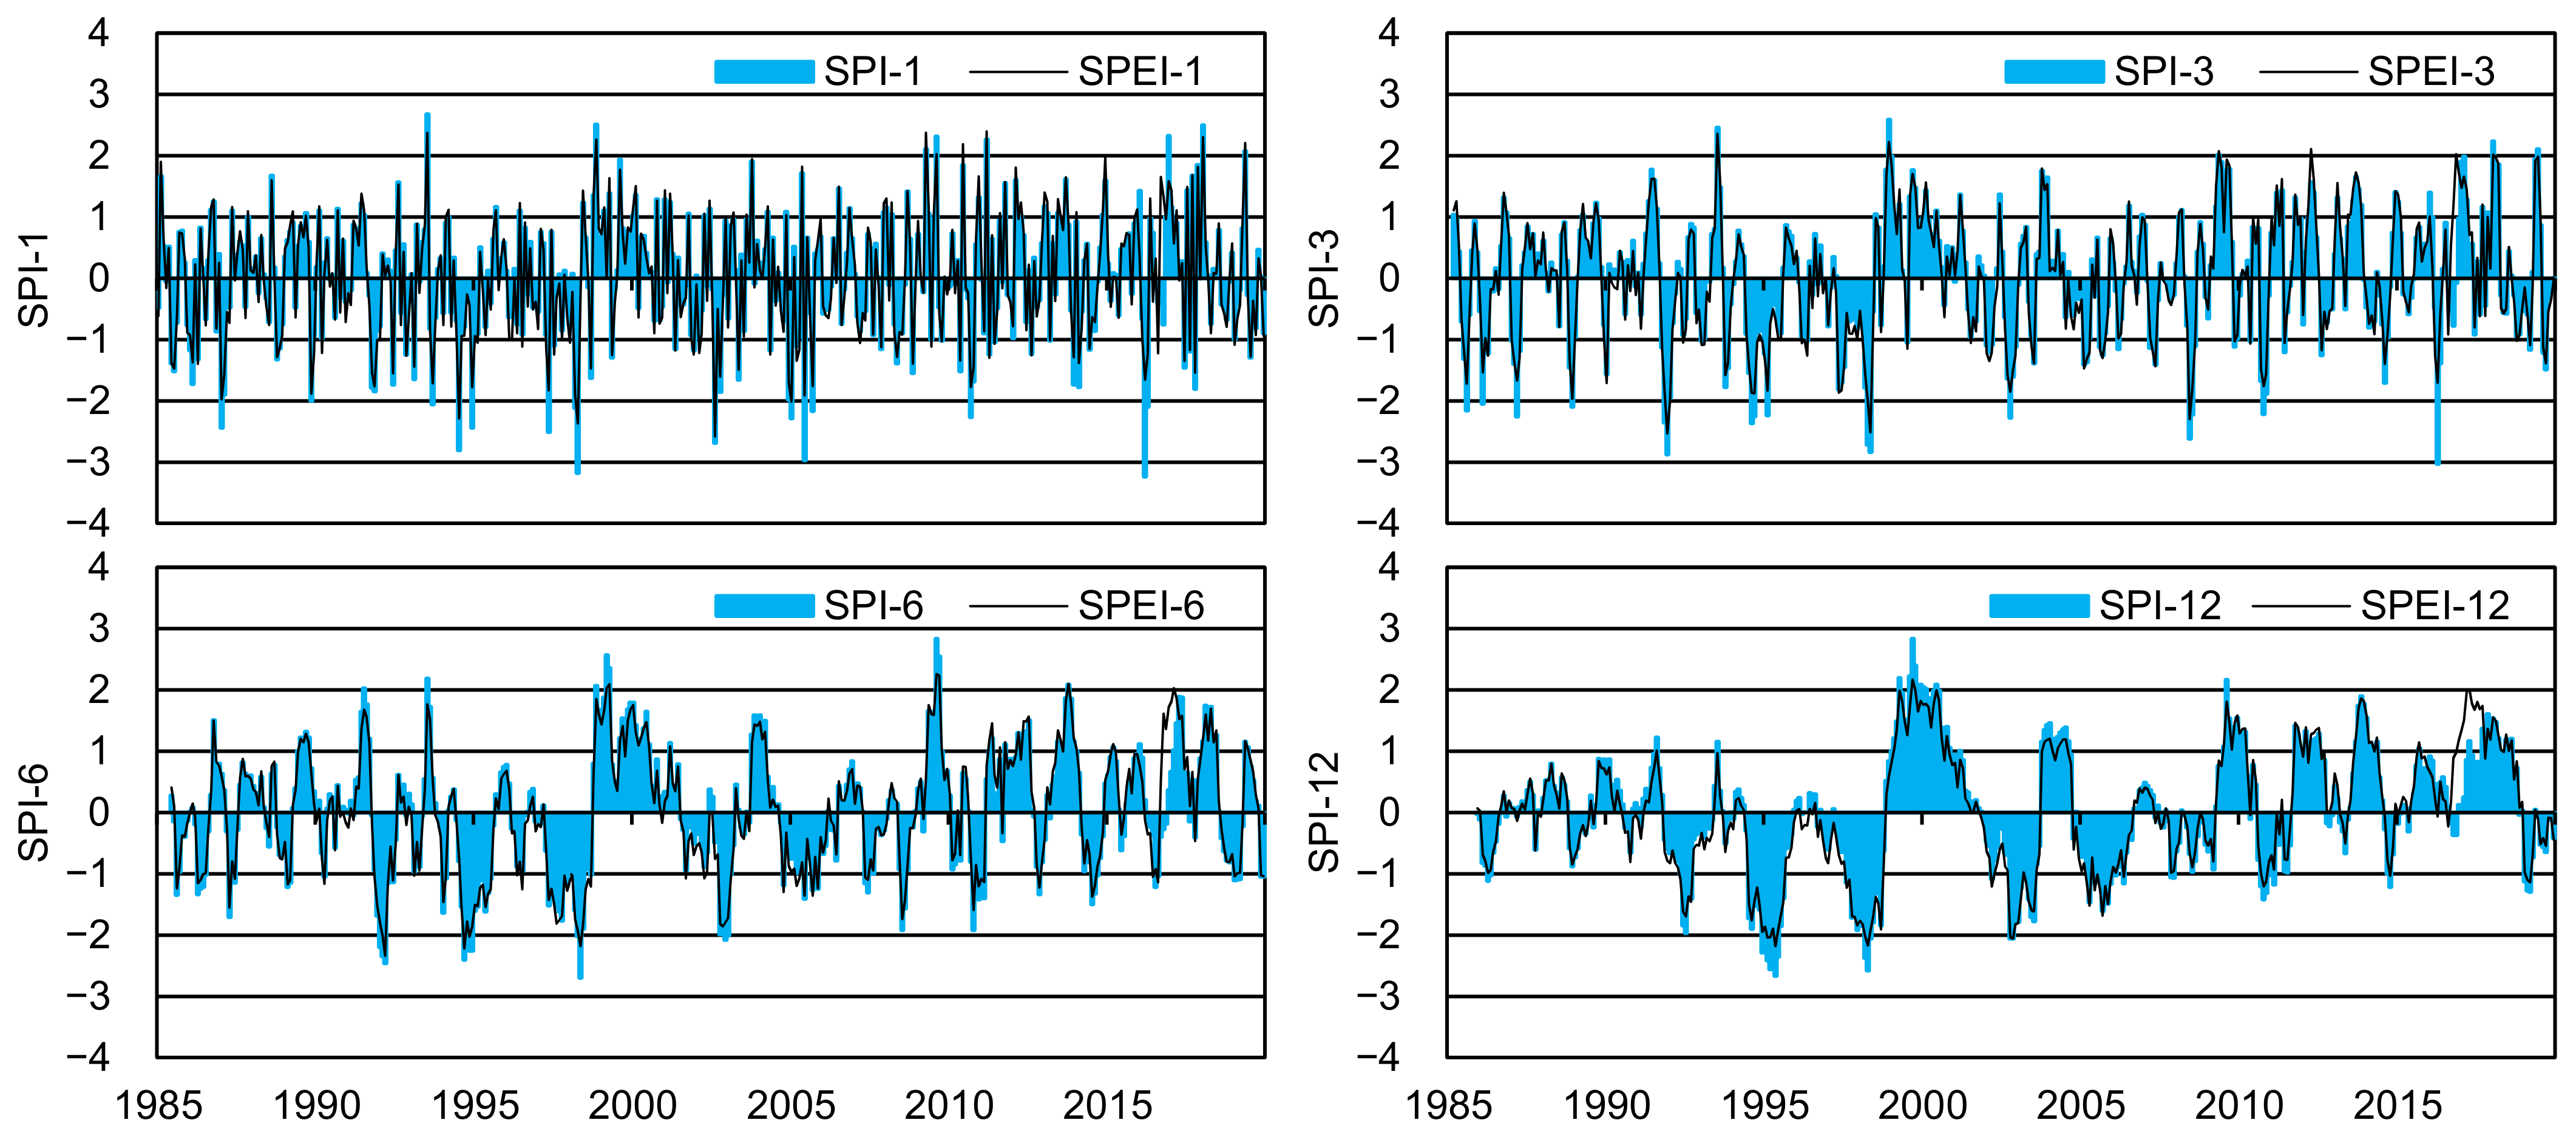
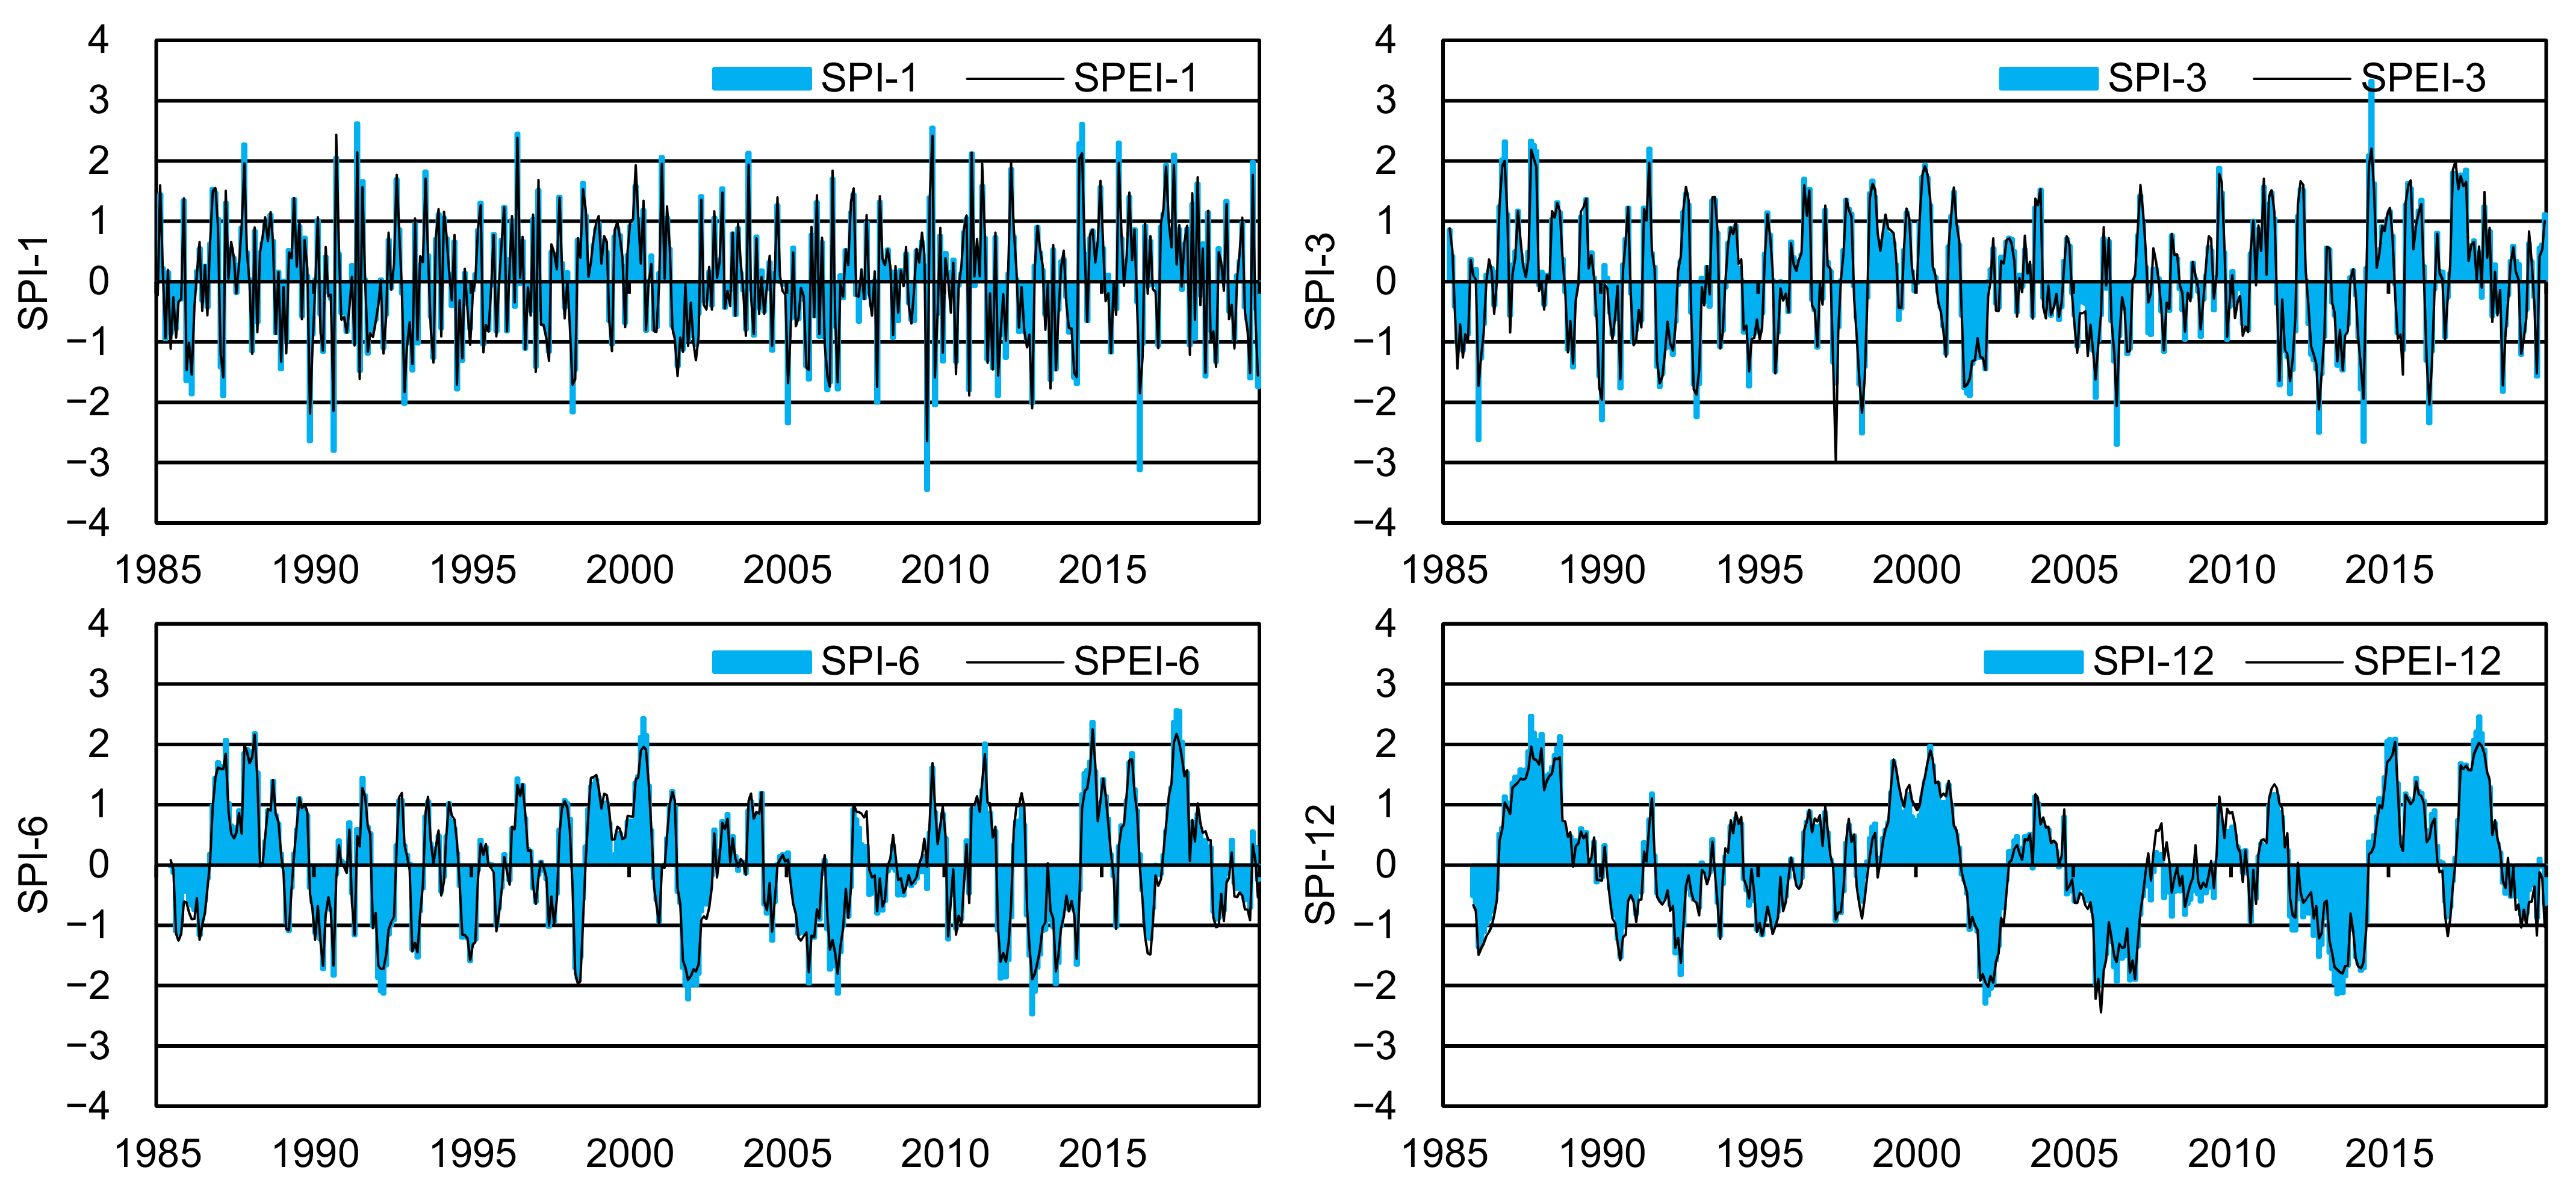
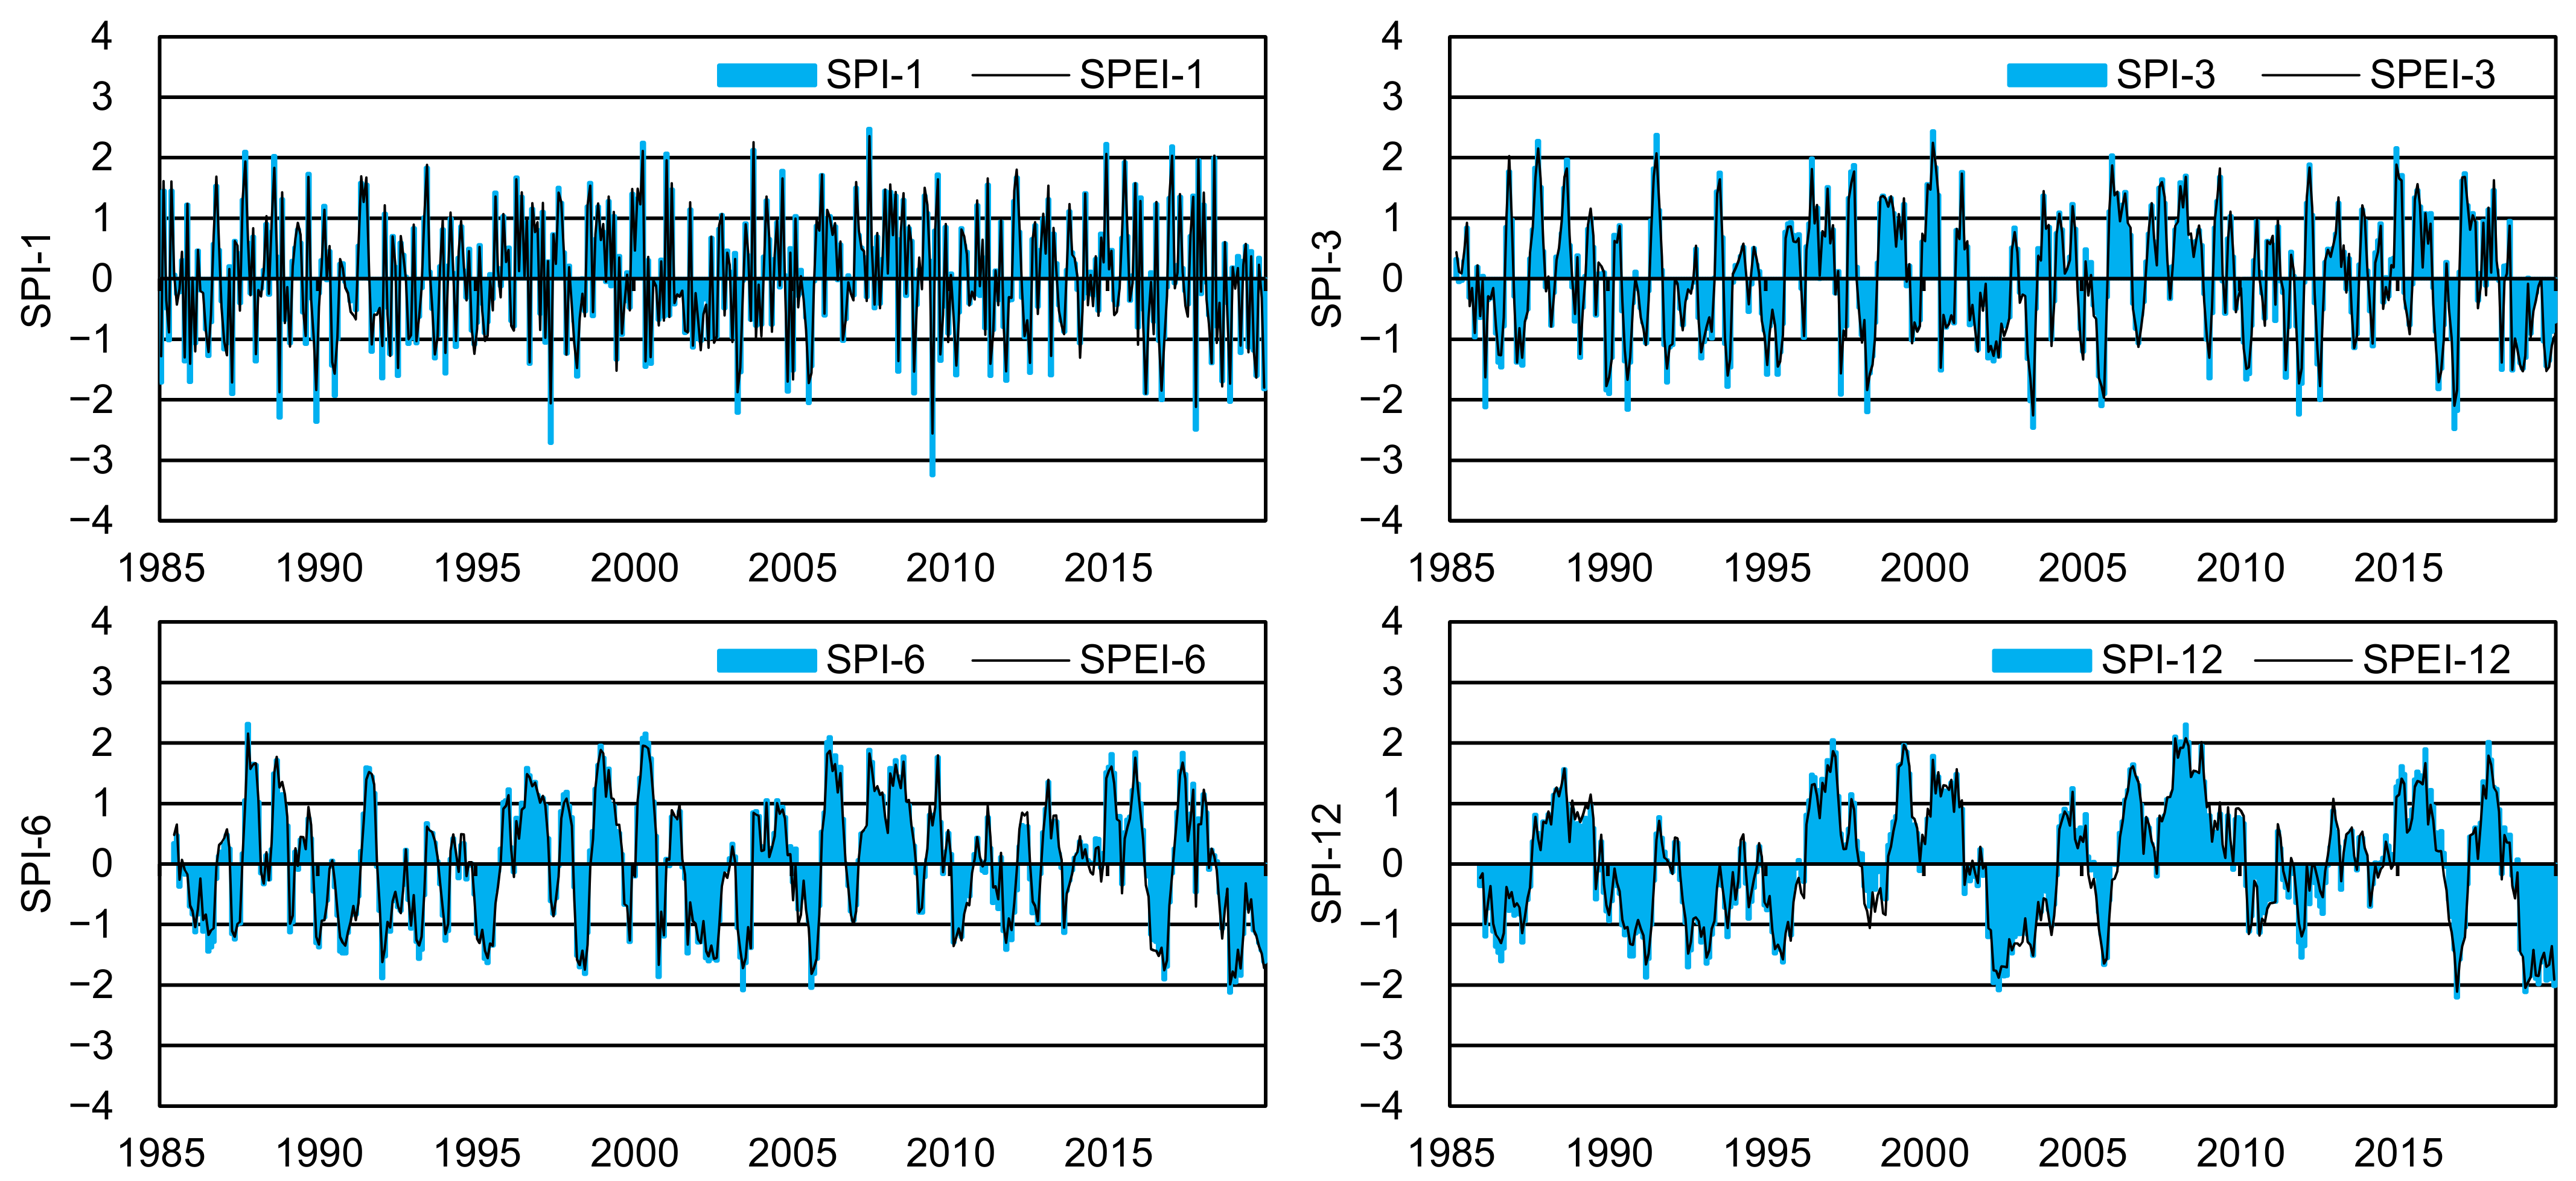
To further investigate the role of temperature in drought formation in the MRB, a comparison between the SPI and SPEI at 1-, 3-, 6-, and 12-month timescales was conducted at the Butterworth (Figure 7), Pusat Pertanian Charok Padang (Figure 8), and Ampangan Muda (Figure 9) stations, which can be used to represent the downstream, middle, and upstream parts of the MRB, respectively. The temporal variability of the SPI and SPEI matched well, with CC values of 0.97, 0.99, and 0.99 for the Butterworth, Pusat Pertanian Charok Padang, and Ampangan Muda stations, respectively. However, the average drought peak and intensity, as measured by the SPEI at different timescales, were slightly lower than the SPI (Table 7). The findings show that the drought characteristics between the SPI and the SPEI are similar, particularly at shorter timescales, e.g., 1 month and 3 months. This result may be explained by the low-temperature variations in the tropical region, and the SPI can work as effectively as the SPEI [59]. In addition, northern Peninsular Malaysia has relative lower temperatures than other regions; hence a longer period is required for drought formation [24]. This may be the reason of a lower drought peak and intensity in the SPEI as compared to the SPI in the MRB.
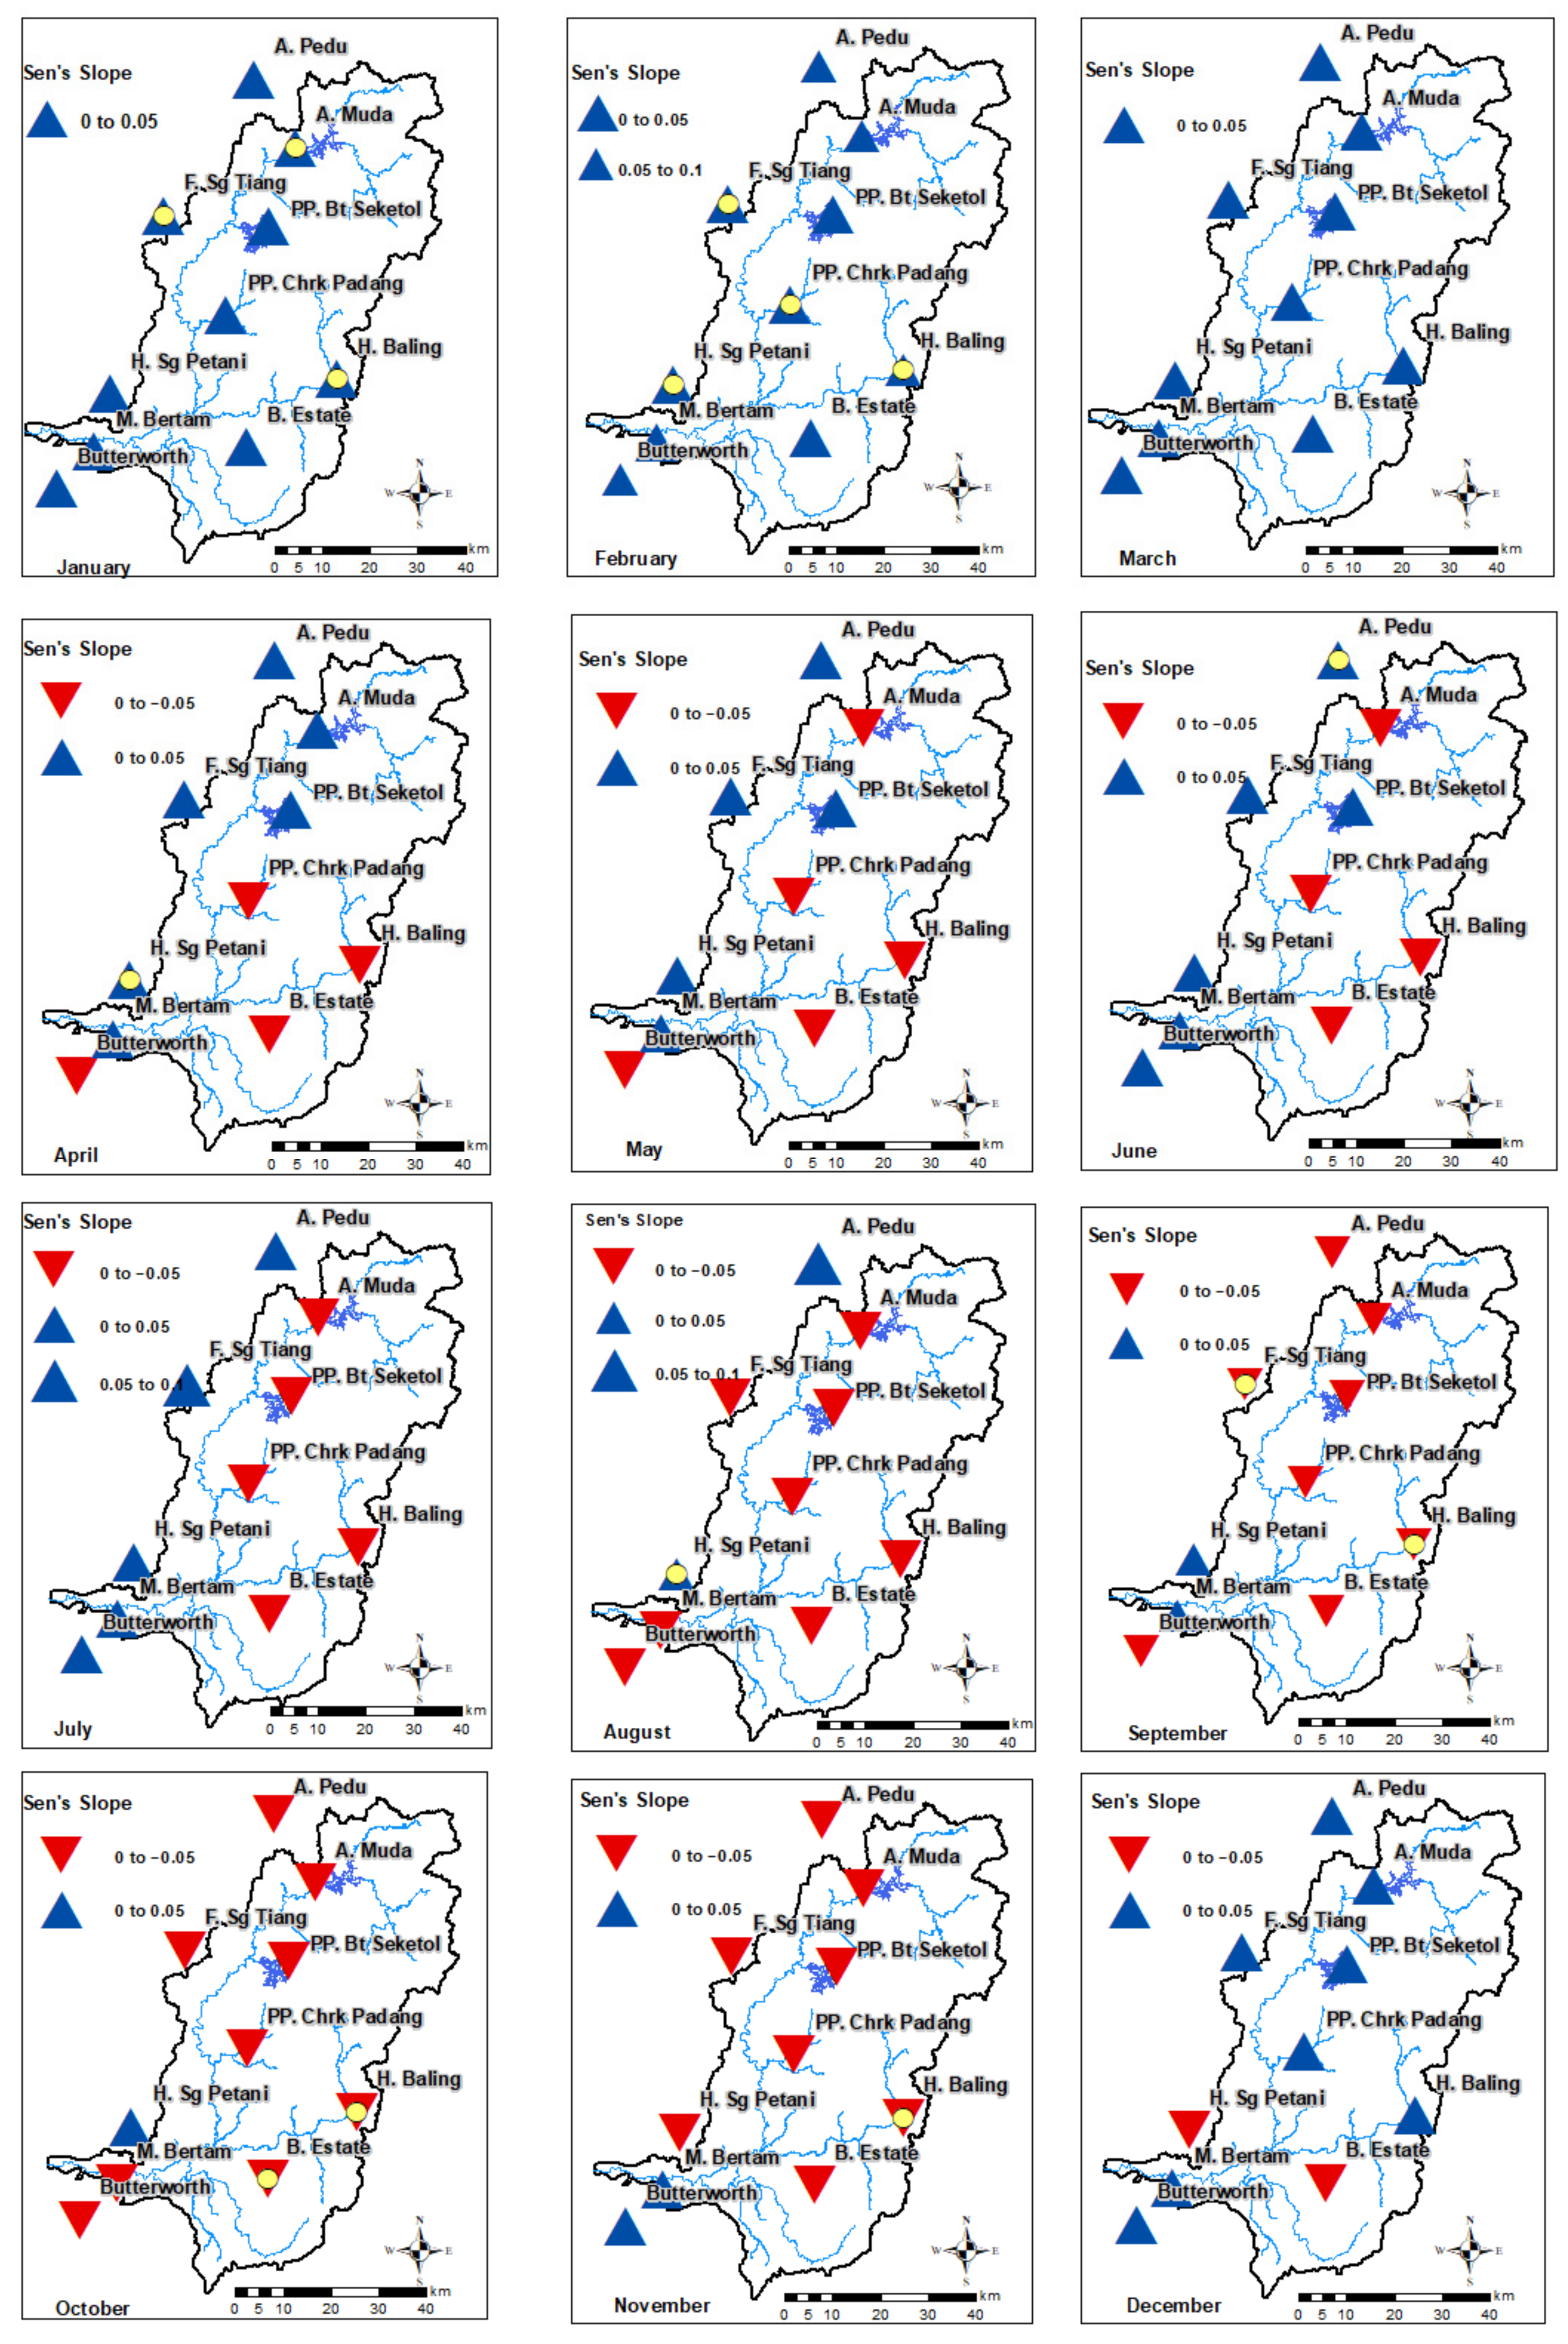
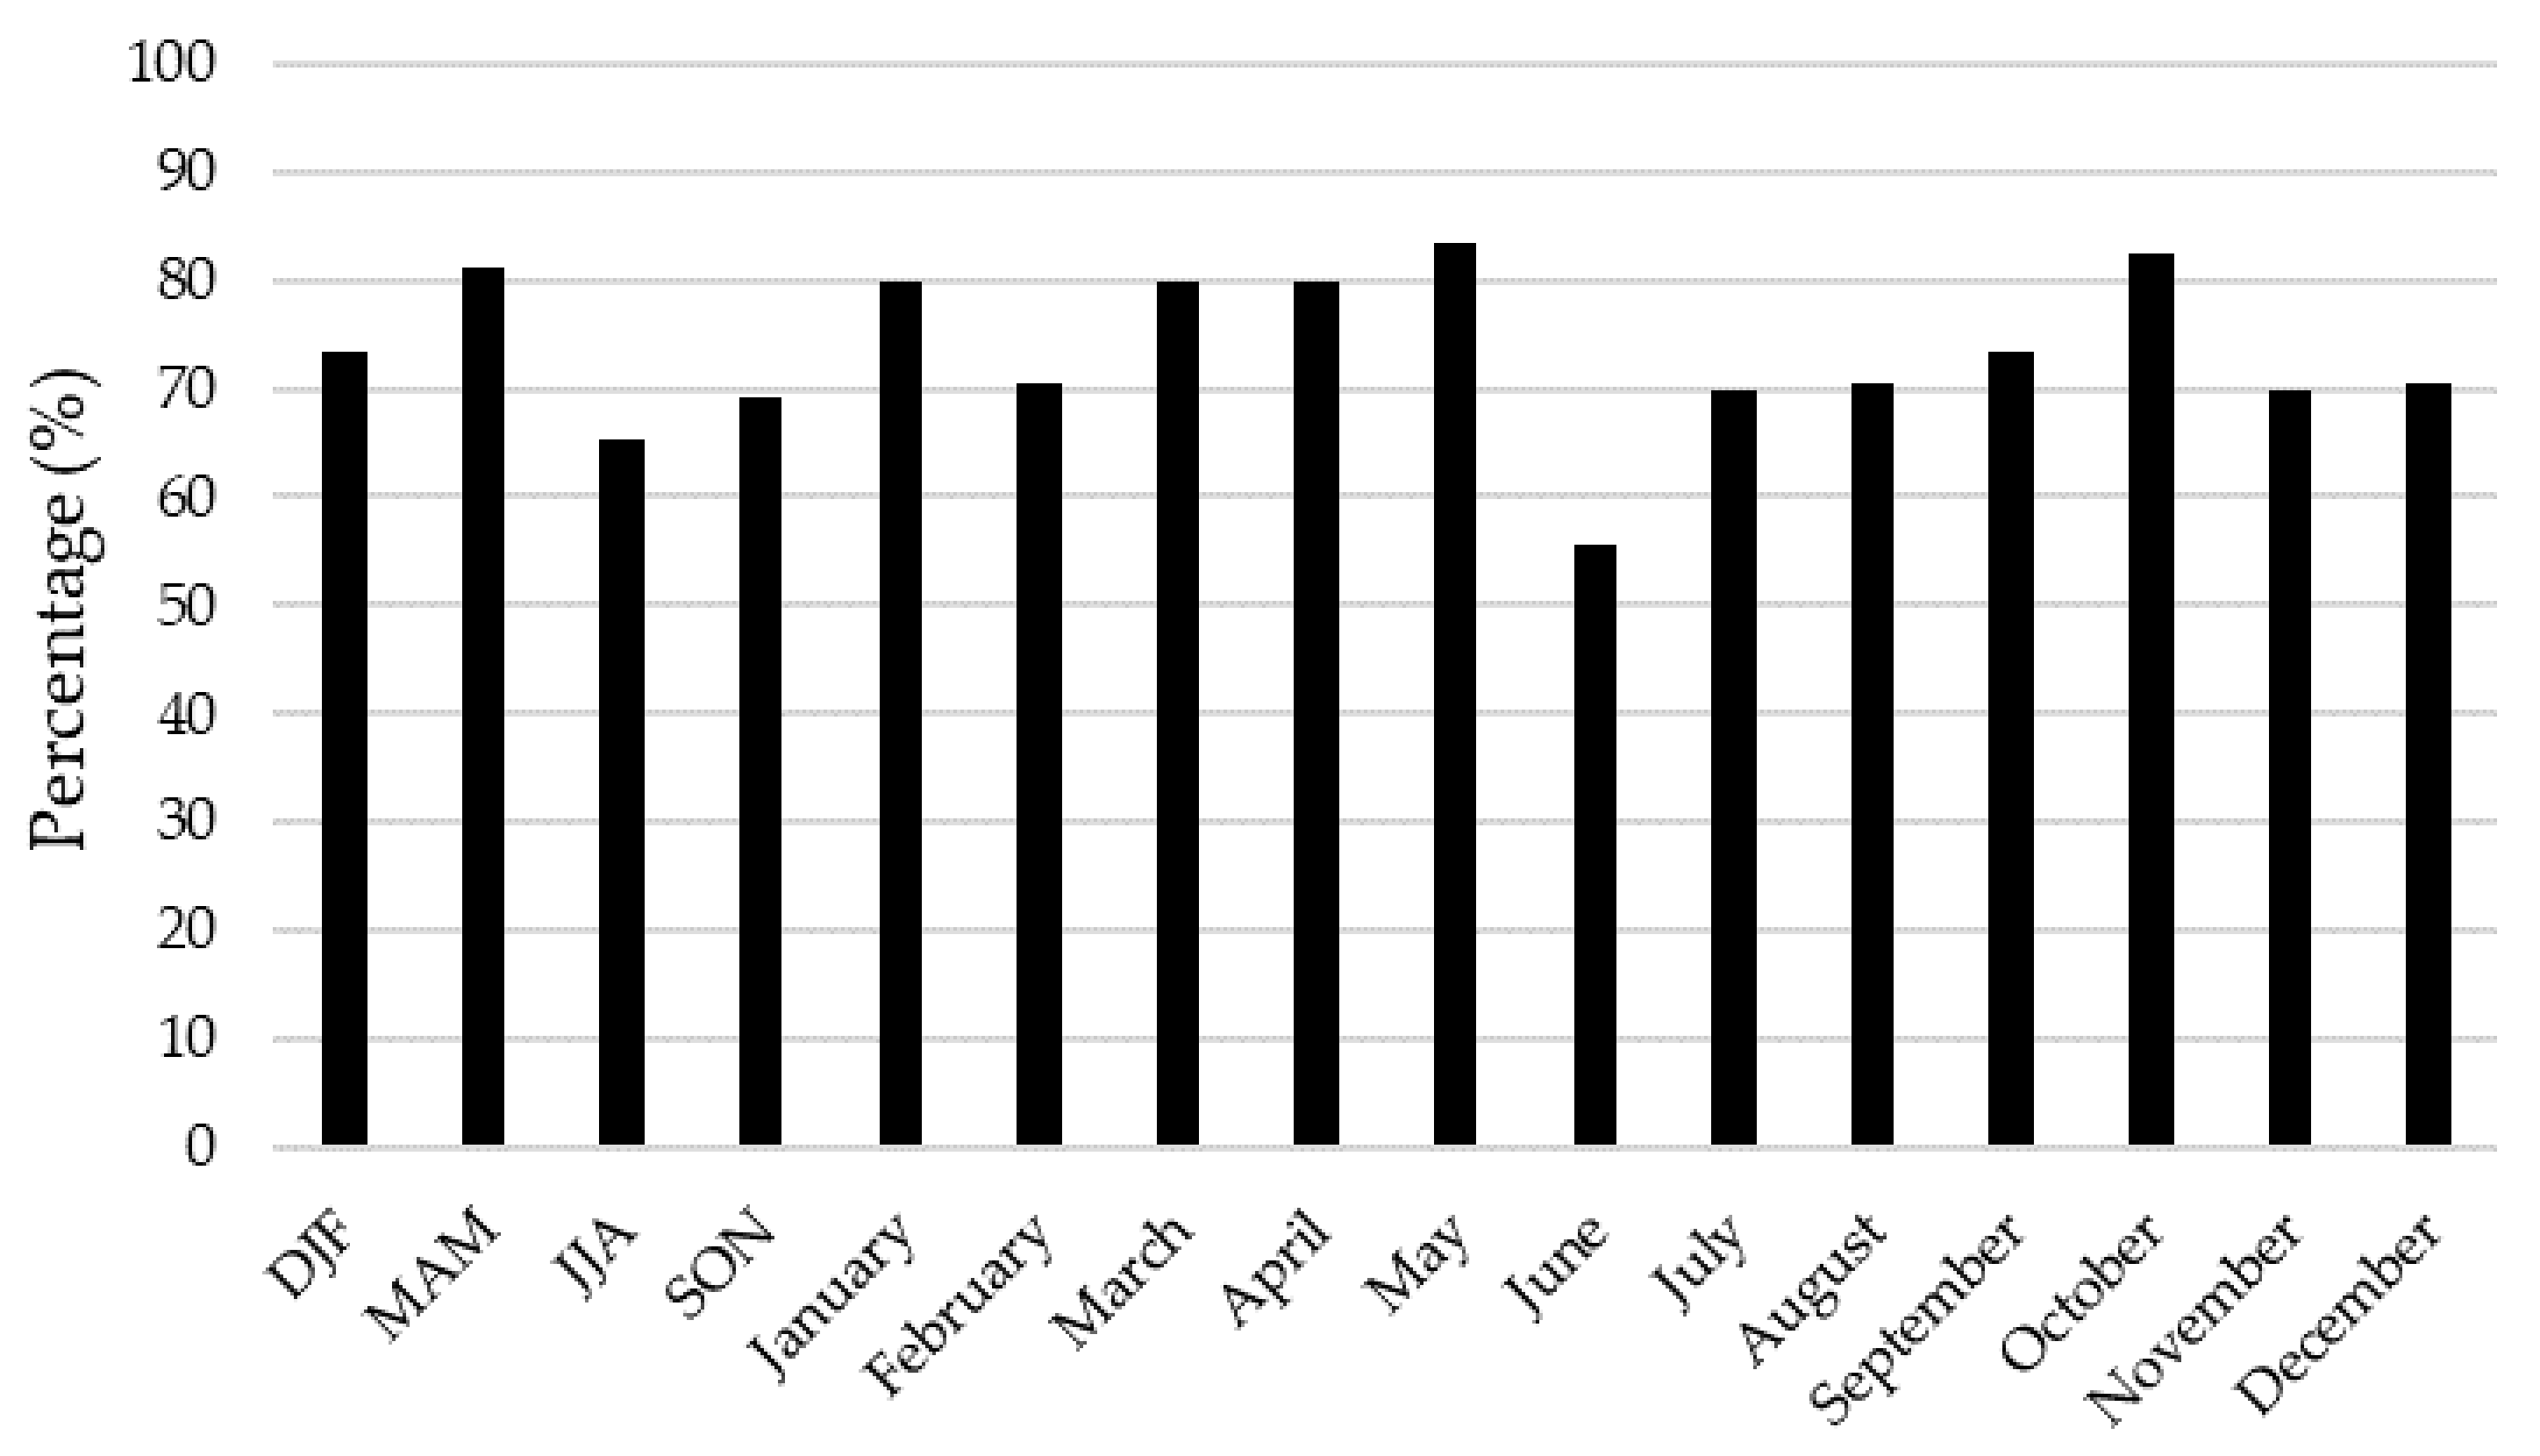
Most of the meteorological stations located within the MRB experienced decreases in SPI-3 from April to December, indicating that more intense drought has occurred in the past few years (Figure 4). In addition, the amount of rainfall within the MRB decreased in March, May to July, and September to October [52]. Table 8 indicates that rainfall and the maximum temperature have a larger impact on drought formation in the MRB, especially 1- and 3-month drought variation, as compared to the minimum temperature. Increases in the maximum temperature and decreases in precipitation during the two inter-monsoons and southwest monsoon might amplify the drought condition in the MRB. Tan et al. [52] reported that the warm temperature extreme indices increased significantly in northern Peninsular Malaysia during the period of 1985 to 2018. El Niño not only resulted in lesser precipitation but also increased the temperature in the MRB. Increasing temperature might enhance the evapotranspiration rate during the dry season, resulting in drought in the MRB. Table 7 shows that two to three more drought events were detected by SPEI-6 and SPEI-12 than by SPI-6 and SPI-12, respectively, showing that increases in temperature due to ENSO impact more long-term drought in the MRB. Further work is required to investigate the temperature impacts on long-term drought variation using satellite and/or reanalysis data that are able to capture the spatial variability of temperature changes.
The correlation analysis between large-scale atmospheric circulations and droughts showed that ENSO has higher correlation values than the IOD and MJO, especially from January to May. This indicates that drought formation in the MRB is largely affected by ENSO as compared to the IOD and MJO. In general, drought cycles are influenced to some degree by large-scale atmospheric circulation patterns, which cause changes in water vapor for precipitation formation and thus affect key components of the hydrological cycle [60]. For instance, ENSO had a significant negative relationship with SPI variability in Peninsular Malaysia from 1985–2019 [61]. The ENSO events typically last from 9 to 12 months, but the drought span in Malaysia is typically about 2 to 6 months (Table 7). As mentioned earlier, precipitation in Malaysia is not only affected by ENSO events but also by local air–sea influences that may contribute to the shorter drought period in the MRB [11]. Moreover, two precipitation peaks were normally found in April and October, where heavy precipitation brought by the local convective system to the MRB during the inter-monsoon periods [52] could also efficiently compensate the ENSO-induced droughts and decrease the drought period to less than 9 months.
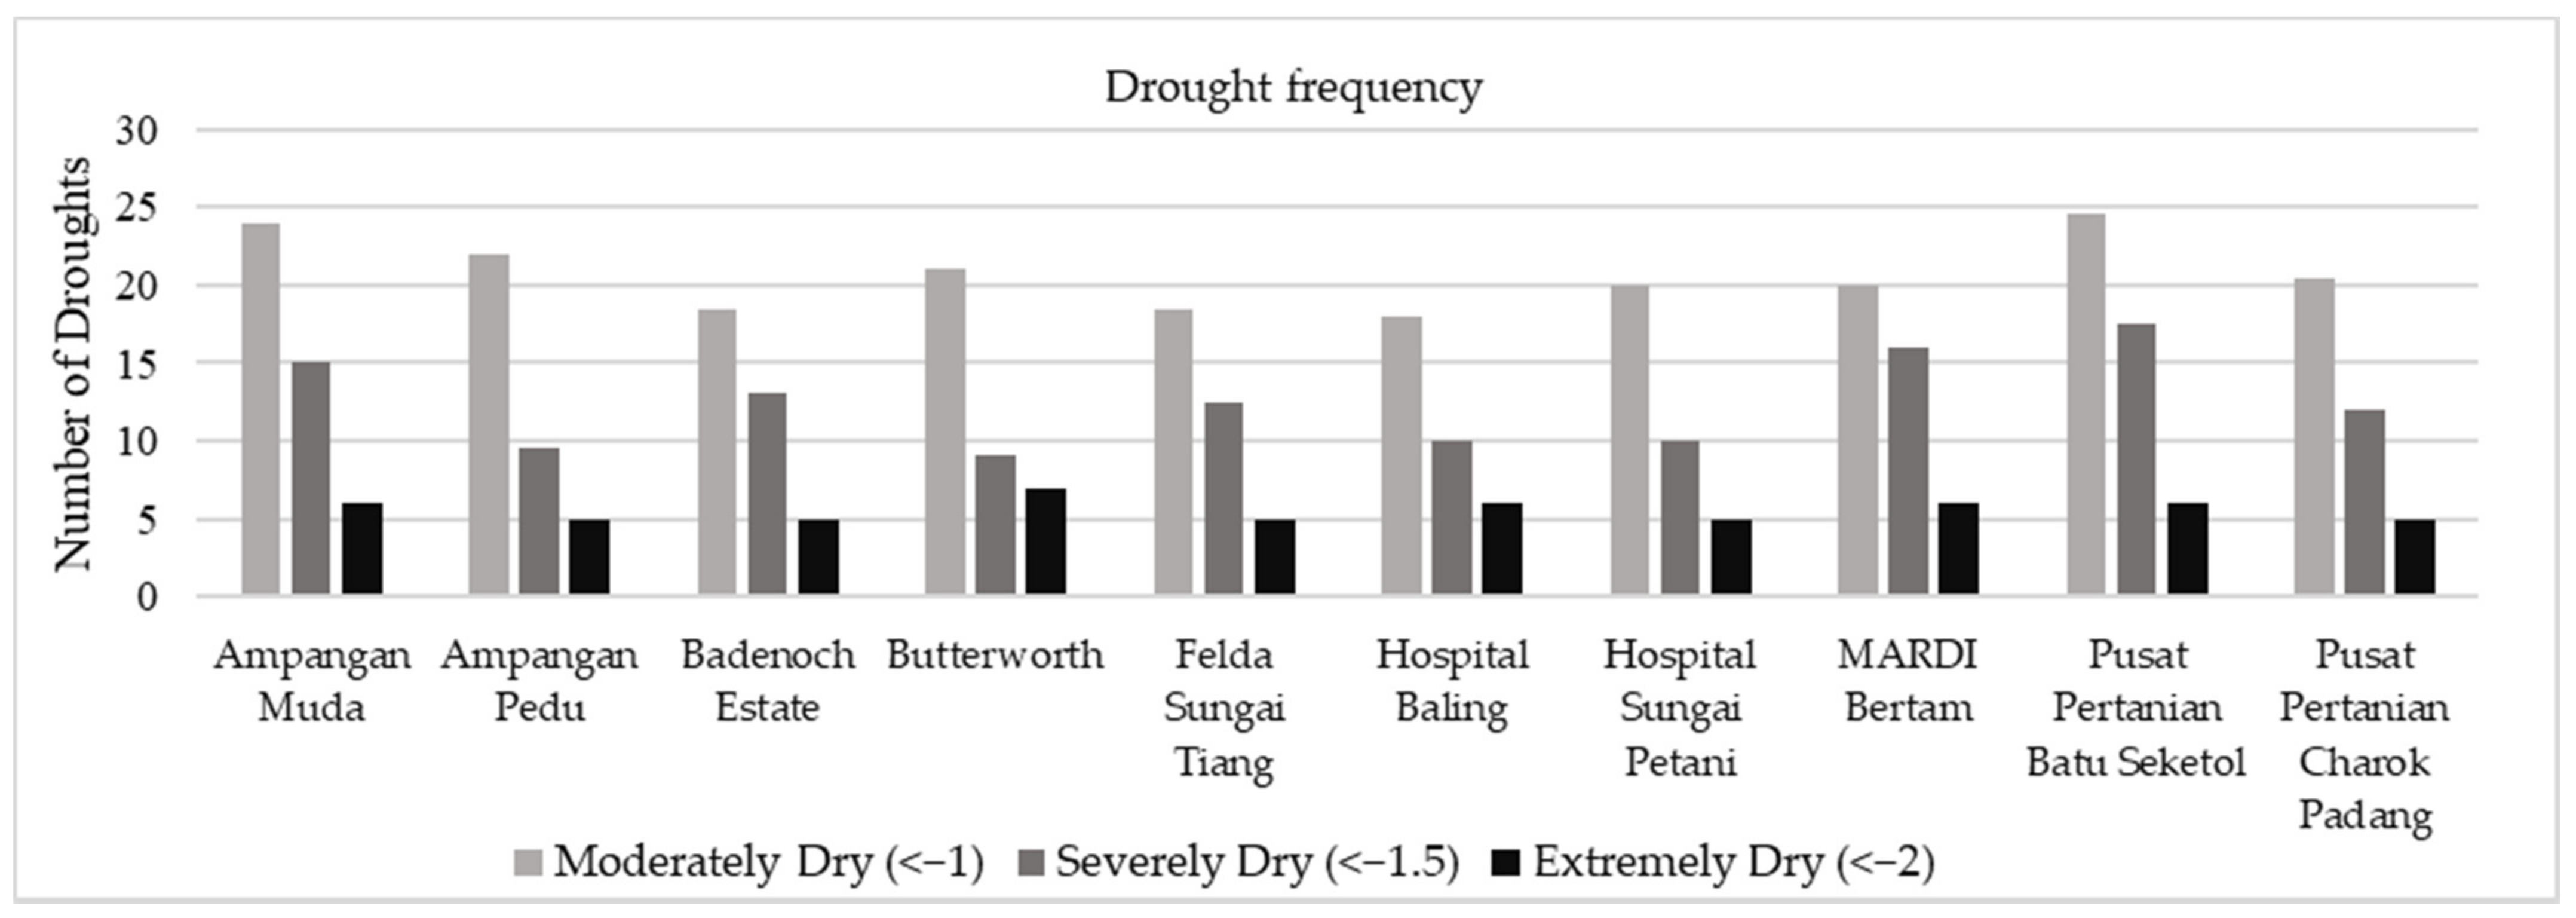
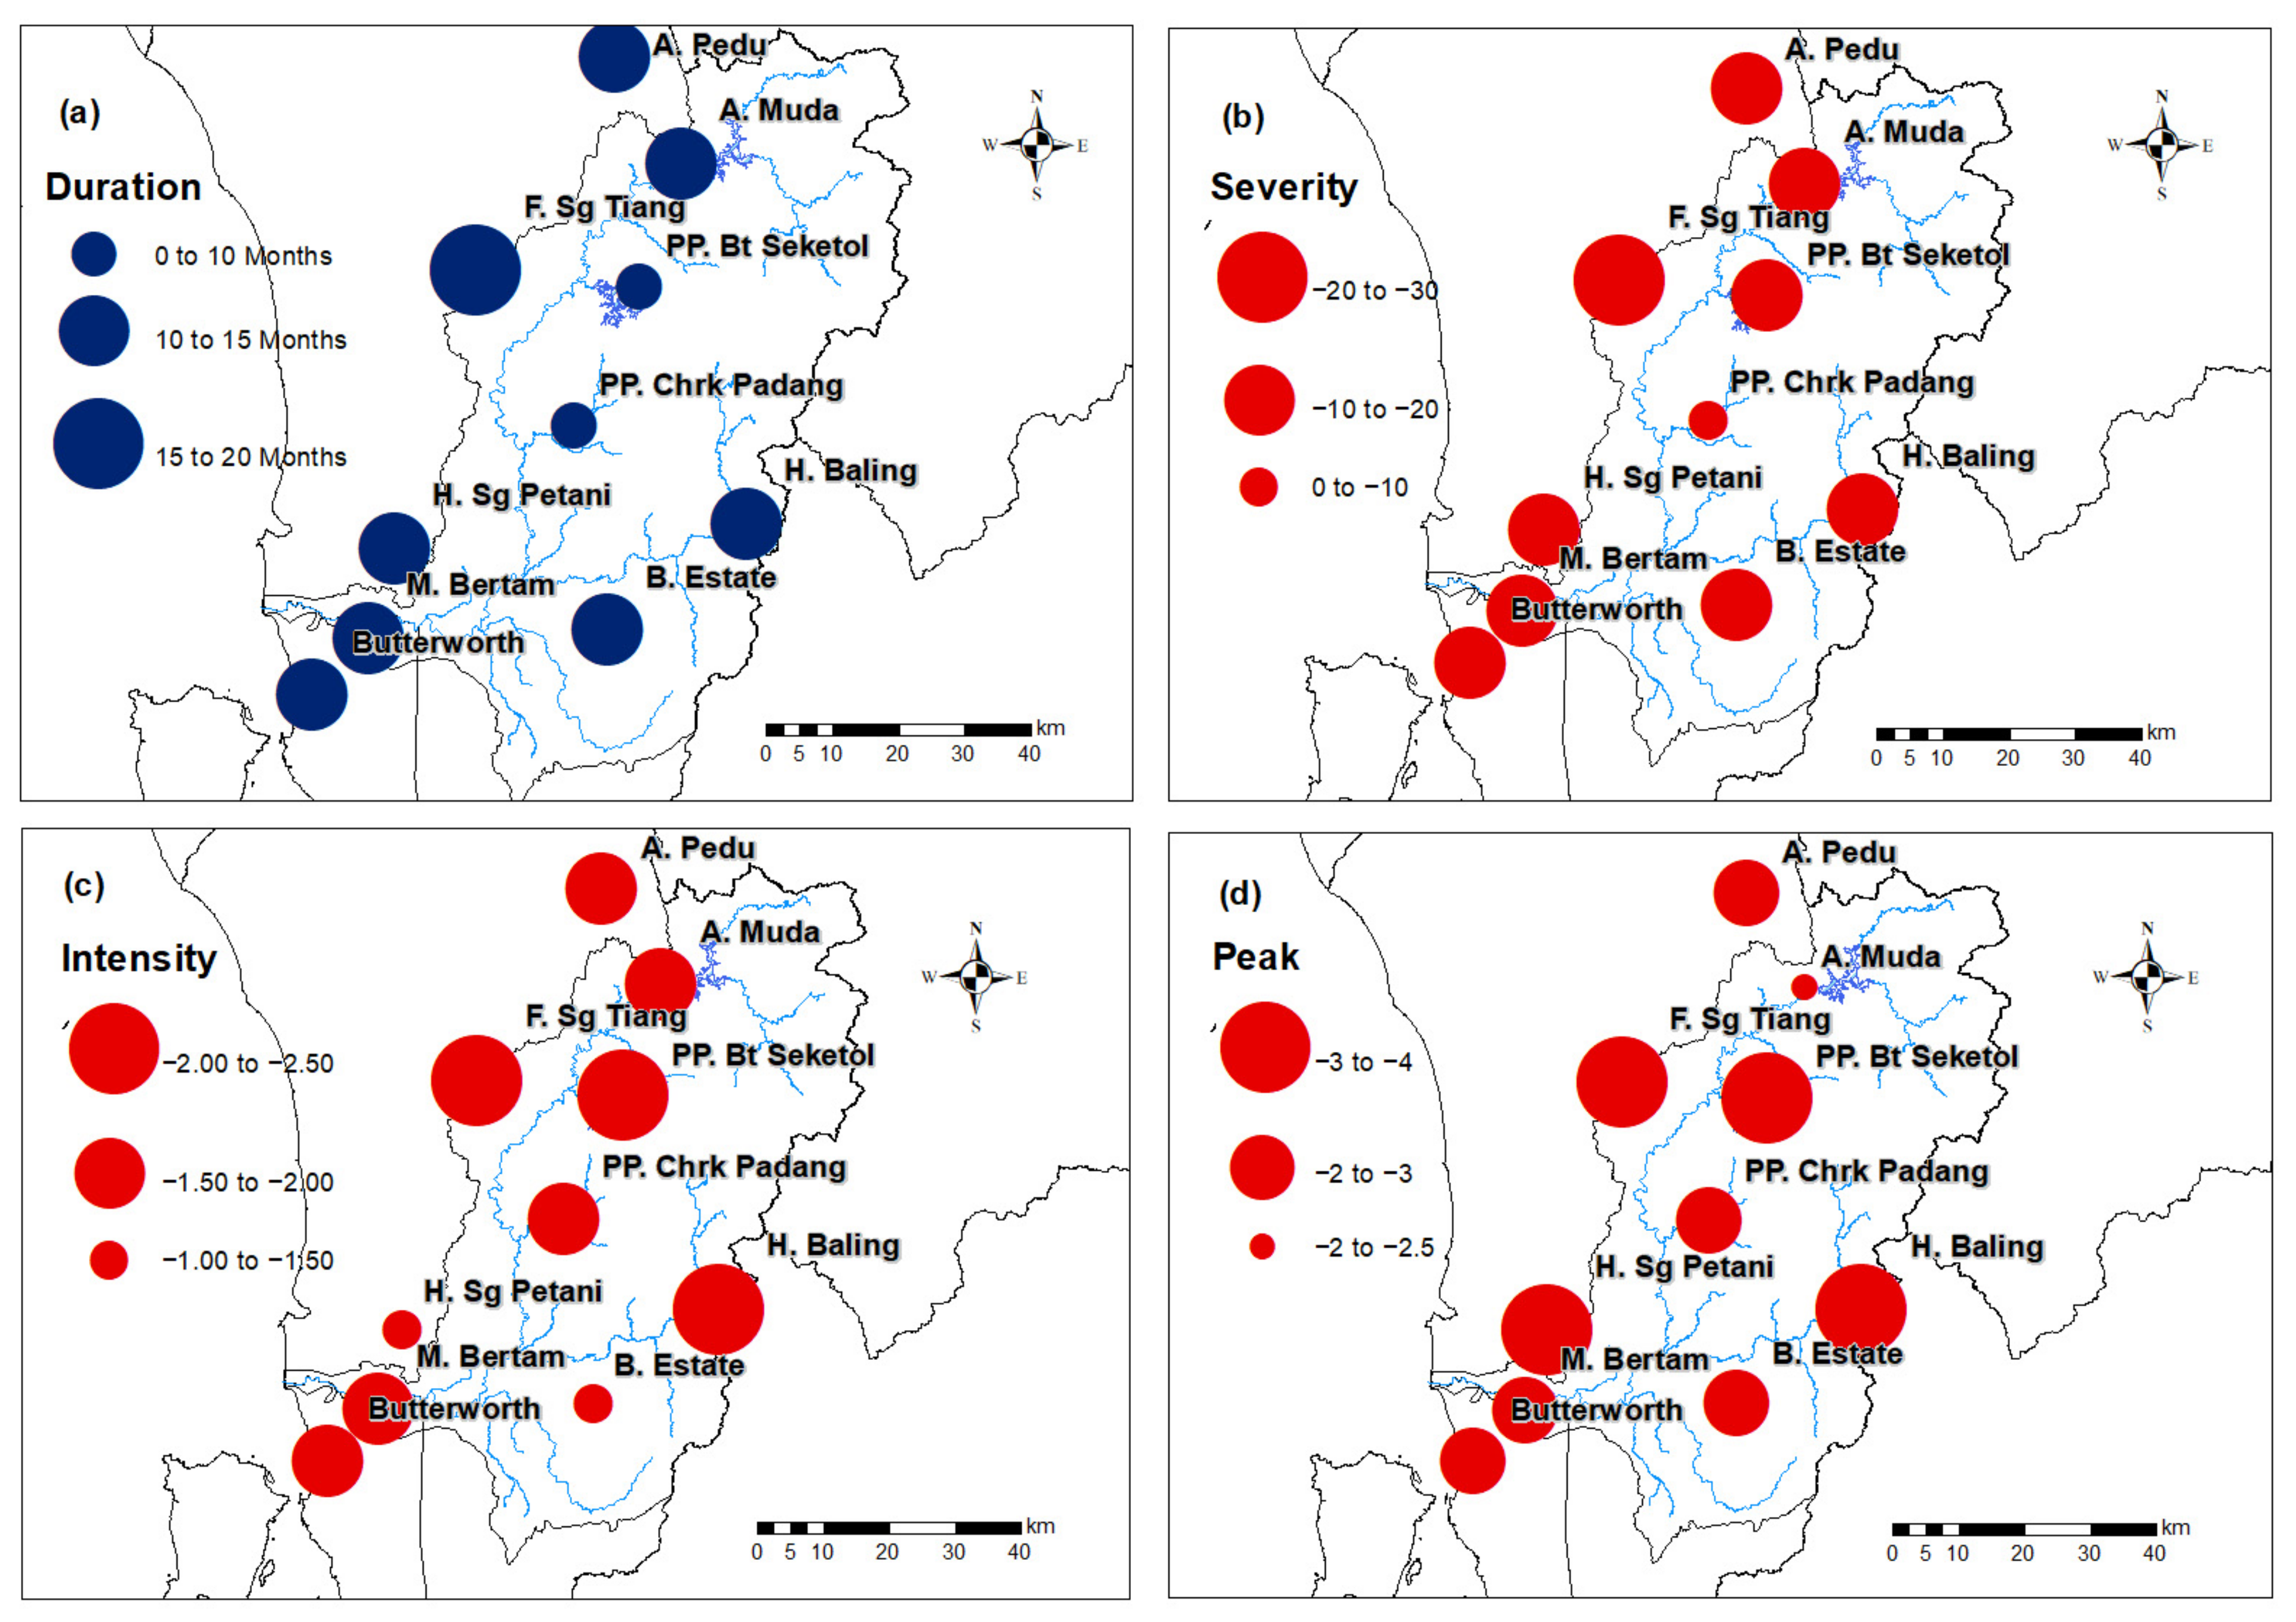
The area near the dams has been exposed to intense droughts in the past few decades. For instance, the Ampangan Muda and Pusat Pertanian Batu Seketol stations had the highest frequency of extremely dry drought. Human activities might have influenced the dry condition. For example, deforestation decreased the amount of transpiration, hence decreasing the amount of rainfall in that area [62]. All elements endangering the forest can be present where the evaporation rate is higher after deforestation, leading to longer droughts and higher temperatures These issues can lead to water shortage problems in the region, resulting in a water crisis, especially in Penang, which highly depends on the freshwater supply from the Muda River. As one of the most developed states in Malaysia, for Penang, water is extremely important to sustain industries and local households. Therefore, local authorities should promote water awareness and rainwater-harvesting activities to reduce the consumption of treated water in Penang.

5. Conclusions

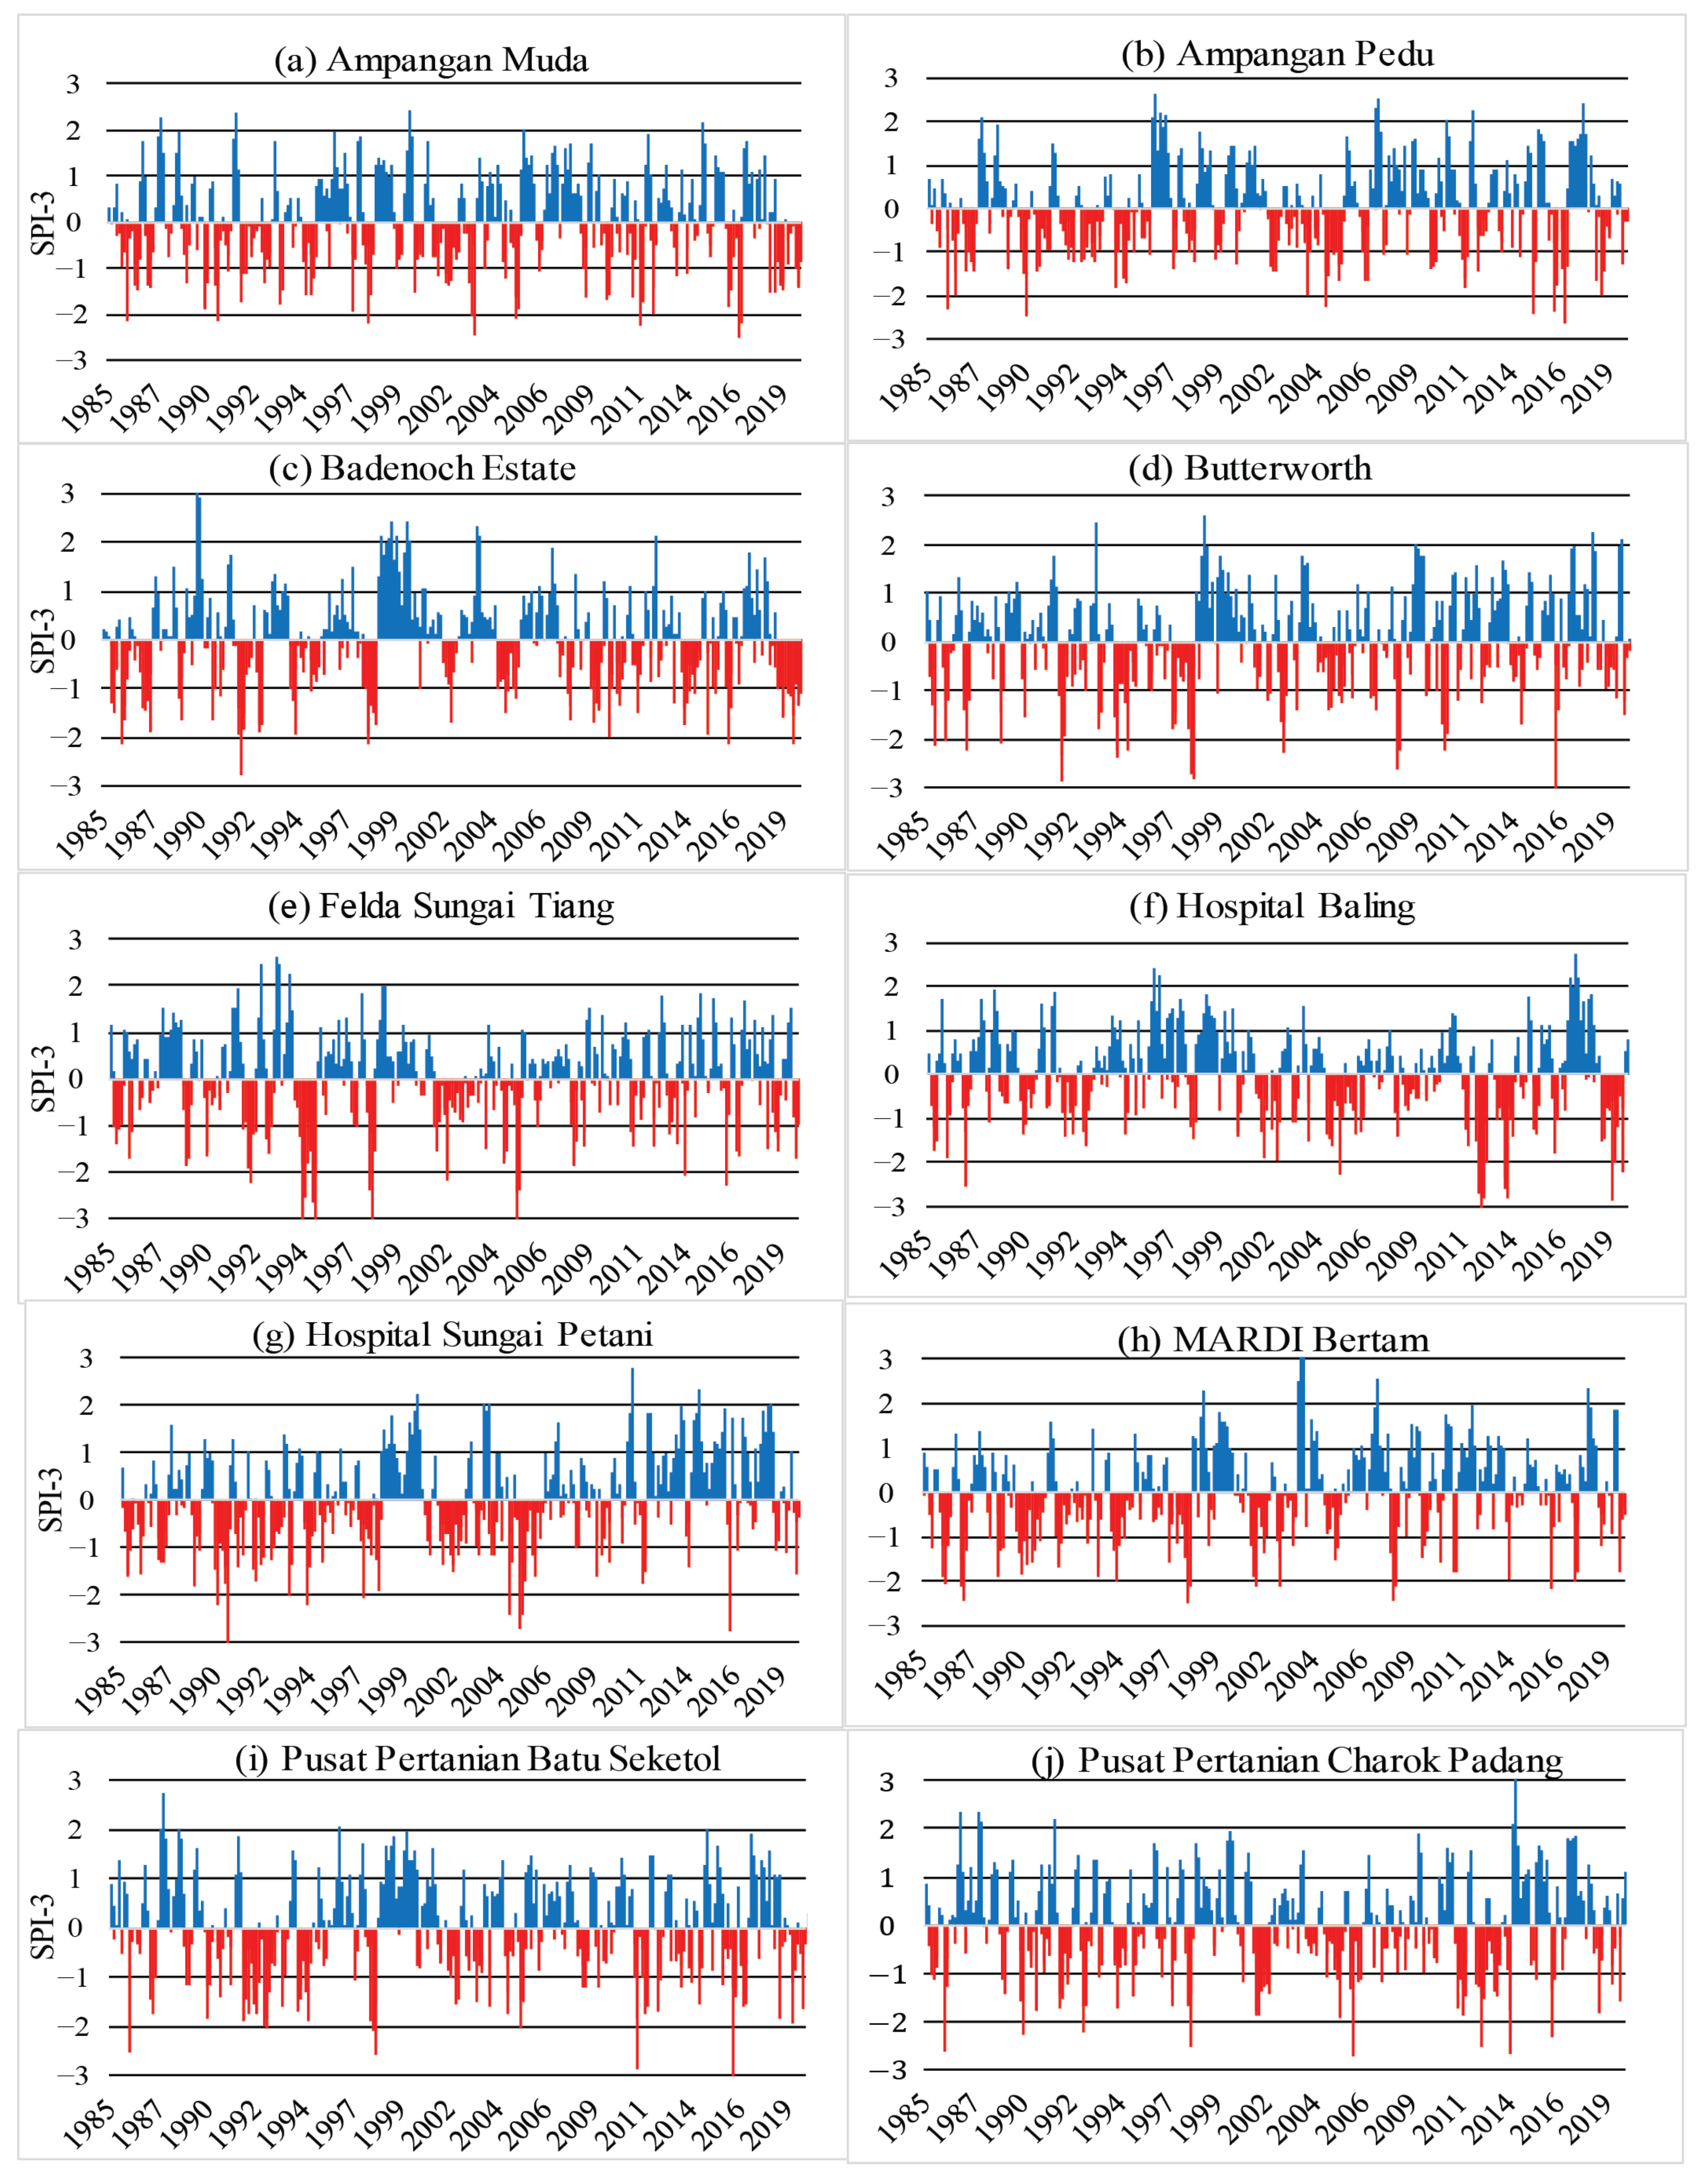
This study evaluated the historical meteorological and hydrological droughts from 1985 to 2019 in the MRB using SPI-3 and SSI-3. This study also characterized the drought events based on the frequency, duration, severity, intensity, and peak. In general, the intense hydro-meteorological droughts in the MRB mostly occurred in 1991–1992, 1995, 1998, 2002–2003, 2005–2006, 2008, 2012–2013, and 2016. In addition, there was a declining trend in the SPI in most of the stations during the SWM, inter-monsoon 2, and the early phase of the NEM in the MRB, implying a more serious drought condition from May to December in recent years.
This research discovered that the stations near the reservoirs have experienced more than five extremely dry events, which threatened the water resources for domestic, agricultural, and industrial uses. A higher correlation between hydro-meteorological droughts and ENSO was found, especially from January to May, showing that the impact of ENSO on local drought is larger than that of the IOD and MJO. The MRB is an important basin that supplies fresh water for agricultural and industrial activities in the northern part of Peninsular Malaysia. The deficit in rainfall due to droughts significantly affects the socio-economic activities of this region. Moreover, Penang highly depends on the freshwater supply from the Muda River, so potential drought changes in the future need to be investigated.
For future studies, the atmospheric circulation impact on regional drought should also include other parameters, e.g., temperature and relative humidity. More broadly, research is also needed to determine whether either decreased rainfall or increased temperature contributes more to regional drought formation.

Author Contributions

Conceptualization, M.L.T.; methodology, M.L.T. and Z.b.L.; software, M.L.T. and Z.b.L.; formal analysis, M.L.T. and Z.b.L.; data curation, M.L.T. and Z.b.L.; writing—original draft preparation, Z.b.L.; writing—review and editing, M.L.T., F.T., Z.Z., K.P.C. and Z.M.Y.; project administration, M.L.T. and F.T.; funding acquisition, M.L.T., F.T., Z.Z. and Z.Y. All authors have read and agreed to the published version of the manuscript.

Funding

This project was supported by the Ministry of Higher Education Malaysia under Long-term Research Grant Scheme Project 2 (grant no. LRGS/1/2020/UKM-USM/01/6/2), which is under the LRGS/1/2020/UKM/01/6 program.

Institutional Review Board Statement

Not applicable.

Informed Consent Statement

Not applicable.

Data Availability Statement

The data presented in this study are available on request from the corresponding authors.

Acknowledgments

Special thanks to the Malaysian Meteorological Department and the Department of Irrigation and Drainage Malaysia for providing hydro-climatic data for this project.

Conflicts of Interest

The authors declare no conflict of interest.

References

  1. Wilhite, D.A.; Svoboda, M.D.; Hayes, M.J. Understanding the complex impacts of drought: A key to enhancing drought mitigation and preparedness. Water Resour. Manag. 2007, 21, 763–774. [Google Scholar] [CrossRef] [Green Version]
  2. World Meteorological Organization (WMO). Drought Monitoring and Early Warning: Concepts, Progress and Future Challenges Weather and Climate Information for Sustainable Agricultural Development; WMO: Geneva, Switzerland, 2006. [Google Scholar]
  3. Tan, M.L.; Chua, V.P.; Li, C.; Brindha, K. Spatiotemporal analysis of hydro-meteorological drought in the Johor River Basin, Malaysia. Theor. Appl. Clim. 2018, 135, 825–837. [Google Scholar] [CrossRef]
  4. Iglesias, A.; Moneo, M.; Quiroga, S. Methods for evaluating social Vulnerability to Drought. In Coping with Drought Risk in Agriculture and Water Supply Systems; Springer: Dordrecht, The Netherlands, 2009. [Google Scholar] [CrossRef]
  5. United Nations Publiactions. Ready for the Dry Years: Building Resilience to Drought in South-East Asia; United Nations: Bangkok, Thailand, 2020; ISBN 9789211207873. [Google Scholar]
  6. Suhaila, J.; Deni, S.M.; Zawiah Zin, W.A.N.; Jemain, A.A. Trends in Peninsular Malaysia rainfall data during the southwest monsoon and northeast monsoon seasons: 1975-2004. Sains Malaysiana 2010, 39, 533–542. [Google Scholar]
  7. Ramasamy, S.V. Logging in Ulu Muda Forest Reserve: Is Penang’s Water Security under Threat. Penang Institute Issues. 2017, pp. 1–7. Available online: https://penanginstitute.org/publications/issues/1008-logging-in-ulu-muda-forest-reserve-is-penangs-water-security-under-threat/ (accessed on 20 June 2021).
  8. Hussin, F.; Mat, A.W. Socio-Economic Level of Paddy Farmers under The Management of MADA: A Case Study in The Pendang District, Kedah. J. Gov. Dev. 2013, 9, 79–92. [Google Scholar]
  9. Noorazura, A.R. My Metro. Available online: https://www.hmetro.com.my/utama/2020/01/535908/duka-padi-jadi-lalang (accessed on 20 June 2021).
  10. Kamil, N.N.; Omar, S.F. The Impact of El Niño and La Niña on Malaysian Palm Oil Industry. Oil Palm Bull. 2017, 74, 1–6. [Google Scholar]
  11. Tangang, F.; Juneng, L. Mechanisms of Malaysian Rainfall Anomalies. J. Clim. 2004, 17, 3616–3622. [Google Scholar] [CrossRef]
  12. Tangang, F.; Juneng, L.; Ahmad, S. Trend and interannual variability of temperature in Malaysia: 1961–2002. Theor. Appl. Clim. 2006, 89, 127–141. [Google Scholar] [CrossRef]
  13. Tan, M.L.; Juneng, L.; Tangang, F.T.; Chung, J.X.; Firdaus, R.B.R. Changes in temperature extremes and their relationship with ENSO in Malaysia from 1985 to 2018. Int. J. Clim. 2020, 41. [Google Scholar] [CrossRef]
  14. Tomingas, O. Relationship between atmospheric circulation indices and climate variability in Estonia. Boreal Environ. Res. 2002, 7, 463–469. [Google Scholar]
  15. Tangang, F.T.; Juneng, L.; Salimun, E.; Vinayachandran, P.N.; Seng, Y.K.; Reason, C.J.C.; Behera, S.K.; Yasunari, T. On the roles of the northeast cold surge, the Borneo vortex, the Madden-Julian Oscillation, and the Indian Ocean Dipole during the extreme 2006/2007 flood in southern Peninsular Malaysia. Geophys. Res. Lett. 2008, 35. [Google Scholar] [CrossRef]
  16. Xavier, P.; Lim, S.Y.; Bin Abdullah, M.F.A.; Bala, M.; Chenoli, S.N.; Handayani, A.S.; Marzin, C.; Permana, D.; Tangang, F.; Williams, K.D.; et al. Seasonal Dependence of Cold Surges and their Interaction with the Madden–Julian Oscillation over Southeast Asia. J. Clim. 2020, 33, 2467–2482. [Google Scholar] [CrossRef]
  17. Amirudin, A.; Salimun, E.; Tangang, F.; Juneng, L.; Zuhairi, M. Differential Influences of Teleconnections from the Indian and Pacific Oceans on Rainfall Variability in Southeast Asia. Atmosphere 2020, 11, 886. [Google Scholar] [CrossRef]
  18. Pathak, A.A.; Dodamani, B.M. Trend analysis of rainfall, rainy days and drought: A case study of Ghataprabha River Basin, India. Model. Earth Syst. Environ. 2020, 6, 1357–1372. [Google Scholar] [CrossRef]
  19. Guttman, N.B. Accepting the standardized precipitation index: A calculation algorithm1. JAWRA J. Am. Water Resour. Assoc. 1999, 35, 311–322. [Google Scholar] [CrossRef]
  20. Bong, C.H.J.; Richard, J. Drought and climate change assessment using Standardized Precipitation Index (SPI) for Sarawak River Basin. J. Water Clim. Chang. 2019, 11, 956–965. [Google Scholar] [CrossRef]
  21. Tan, M.L.; Juneng, L.; Tangang, F.T.; Samat, N.; Chan, N.W.; Yusop, Z.; Ngai, S.T. SouthEast Asia HydrO-meteorological droughT (SEA-HOT) framework: A case study in the Kelantan River Basin, Malaysia. Atmos. Res. 2020, 246, 105155. [Google Scholar] [CrossRef]
  22. Tan, M.L.; Juneng, L.; Tangang, F.; Chan, N.W.; Ngai, S.T. Future hydro-meteorological drought of the Johor River Basin, Malaysia, based on CORDEX-SEA projections. Hydrol. Sci. J. 2019, 64, 921–933. [Google Scholar] [CrossRef]
  23. Meresa, H.; Osuch, M.; Romanowicz, R. Hydro-Meteorological Drought Projections into the 21-st Century for Selected Polish Catchments. Water 2016, 8, 206. [Google Scholar] [CrossRef] [Green Version]
  24. Fung, K.F.; Huang, Y.F.; Koo, C.H. Assessing drought conditions through temporal pattern, spatial characteristic and operational accuracy indicated by SPI and SPEI: Case analysis for Peninsular Malaysia. Nat. Hazards 2020, 103, 2071–2101. [Google Scholar] [CrossRef]
  25. Shamshirband, S.; Hashemi, S.; Salimi, H.; Samadianfard, S.; Asadi, E.; Shadkani, S.; Kargar, K.; Mosavi, A.; Nabipour, N.; Chau, K.W. Predicting Standardized Streamflow index for hydrological drought using machine learning models. Eng. Appl. Comput. Fluid Mech. 2020, 14, 339–350. [Google Scholar] [CrossRef]
  26. Wu, J.; Chen, X.; Gao, L.; Yao, H.; Chen, Y.; Liu, M. Response of Hydrological Drought to Meteorological Drought under the Influence of Large Reservoir. Adv. Meteorol. 2016, 2016, 1–11. [Google Scholar] [CrossRef] [Green Version]
  27. Zhang, D.; Tan, M.L.; Dawood, S.R.S.; Samat, N.; Chang, C.K.; Roy, R.; Tew, Y.L.; Mahamud, M.A. Comparison of NCEP-CFSR and CMADS for Hydrological Modelling Using SWAT in the Muda River Basin, Malaysia. Water 2020, 12, 3288. [Google Scholar] [CrossRef]
  28. Zulkafli, Z.; Muharam, F.; Raffar, N.; Jajarmizadeh, A.; Abdi, M.; Rehan, B.; Nurulhuda, K. Contrasting Influences of Seasonal and Intra-Seasonal Hydroclimatic Variabilities on the Irrigated Rice Paddies of Northern Peninsular Malaysia for Weather Index Insurance Design. Sustainability 2021, 13, 5207. [Google Scholar] [CrossRef]
  29. Ahmad, Z.I.; Chamhuri, S.; Rospidah, G.; Basri, A.T. Climate Change and Government Intervention: Impact on Paddy Production in Muda Area, Kedah. Persidang. Kebangs. Ekon. Malaysia ke VII 2012, 1, 277–290. [Google Scholar]
  30. Sani, S.F.M.; Rindam, M. Rainfall distribution and its impact on Penang’s water resource. Malays. J. Soc. Space 2011, 7, 65–75. [Google Scholar]
  31. MyMetro. Penang Will Face Water Supply Crisis Next June. Available online: https://www.hmetro.com.my/mutakhir/2016/04/130962/pulau-pinang-bakal-hadapi-krisis-bekalan-air-jun-depan (accessed on 21 June 2021).
  32. Arudllas, S. Urgent need to Stop Sungai Muda from Drying Up | Malaysia |. Available online: https://www.malaymail.com/news/malaysia/2016/04/26/urgent-need-to-stop-sungai-muda-from-drying-up/1107279 (accessed on 20 June 2021).
  33. Planting Season in Malaysia’s “Rice Bowl” States Delayed Due to Drought. Available online: https://www.straitstimes.com/asia/se-asia/planting-season-in-malaysias-rice-bowl-states-delayed-due-to-drought (accessed on 22 June 2021).
  34. Nasaruddin MH bin M, Zaid N binti M. Peninsular Malaysia Drought Monitoring Report June 2018 (Based on Hydrological Analysis). 2018. Available online: http://infokemarau.water.gov.my/report/Drought%Report_30Jun18.pdf (accessed on 4 June 2021).
  35. Razak, A.; Loh, A. Kedah First to Feel the Heat. Available online: https://www.thestar.com.my/news/nation/2019/03/13/kedah-first-to-feel-the-heat/ (accessed on 4 June 2021).
  36. Maidinsa, J. Hot & Dry Weather Warning: Immediately Use Water Wisely in Penang. 2019. Available online: https://pba.com.my/pdf/news/2019/07032019_PBAPP_Dry_Weather_Alert_2_BM.pdf (accessed on 4 June 2021).
  37. Hilmy, I. Kedah Dams Worryingly Low. Available online: https://www.thestar.com.my/news/nation/2020/01/18/kedah-dams-worryingly-low (accessed on 4 June 2021).
  38. Nambiar, P. Drought Leaves 3,000 Taps Dry in Kedah. Available online: https://www.freemalaysiatoday.com/category/nation/2021/02/17/drought-leaves-3000-taps-dry-in-kedah/?__cf_chl_jschl_tk__=pmd_o6kAS2vcDWidyZE9.q2QKHkQ3s4NAvPxoiuY5gzzWMs-1631587621-0-gqNtZGzNAmWjcnBszQi9 (accessed on 4 June 2021).
  39. Naz, F.; Dars, G.H.; Ansari, K.; Jamro, S.; Krakauer, N.Y. Drought Trends in Balochistan. Water 2020, 12, 470. [Google Scholar] [CrossRef] [Green Version]
  40. Ji, L.; Peters, A.J. Assessing vegetation response to drought in the northern Great Plains using vegetation and drought indices. Remote Sens. Environ. 2003, 87, 85–98. [Google Scholar] [CrossRef]
  41. Mckee, T.B.; Doesken, N.J.; Kleist, J. The relationship of drought frequency and duration to time scales. In Proceedings of the Eighth Conference on Applied Climatology, Anaheim, CA, USA, 17–22 January 1993; pp. 17–22. [Google Scholar]
  42. World Meteorological Organization (WMO). Chair, Publication Board; WMO: Geneva, Switzerland, 2012. [Google Scholar]
  43. Pei, Z.; Fang, S.; Wang, L.; Yang, W. Comparative Analysis of Drought Indicated by the SPI and SPEI at Various Timescales in Inner Mongolia, China. Water 2020, 12, 1925. [Google Scholar] [CrossRef]
  44. Zhao, W.; Yu, X.; Ma, H.; Zhu, Q.; Zhang, Y.; Qin, W.; Ai, N.; Wang, Y. Analysis of Precipitation Characteristics during 1957-2012 in the Semi-Arid Loess Plateau, China. PLoS ONE 2015, 10, e0141662. [Google Scholar] [CrossRef]
  45. Partal, T.; Kahya, E. Trend analysis in Turkish precipitation data. Hydrol. Process. 2006, 20, 2011–2026. [Google Scholar] [CrossRef]
  46. Zhang, Y.; Cai, W.; Chen, Q.; Yao, Y.; Liu, K. Analysis of Changes in Precipitation and Drought in Aksu River Basin, Northwest China. Adv. Meteorol. 2015, 2015, 1–15. [Google Scholar] [CrossRef] [Green Version]
  47. Masroor, M.; Rehman, S.; Avtar, R.; Sahana, M.; Ahmed, R.; Sajjad, H. Exploring climate variability and its impact on drought occurrence: Evidence from Godavari Middle sub-basin, India. Weather Clim. Extrem. 2020, 30, 100277. [Google Scholar] [CrossRef]
  48. Sen, P.K. Estimates of the Regression Coefficient Based on Kendall's Tau. J. Am. Stat. Assoc. 1968, 63, 1379–1389. [Google Scholar] [CrossRef]
  49. Sattar, M.N.; Kim, T.W. Probabilistic characteristics of lag time between meteorological and hydrological droughts using a Bayesian model. Terr. Atmos. Ocean. Sci. 2018, 29, 709–720. [Google Scholar] [CrossRef] [Green Version]
  50. Farshadfar, E.; Mohammadi, R.; Farshadfar, M.; Dabiri, S. Relationships and repeatability of drought tolerance indices in wheat-rye disomic addition lines. Aust. J. Crop Sci. 2013, 7, 130–138. [Google Scholar]
  51. Jahanshahi, A.; Shahedi, K. Evaluation of meteorological, hydrological and groundwater resources indicators for drought monitoring and forecasting in a semi-arid climate. Desert 2018, 23, 29–43. [Google Scholar] [CrossRef]
  52. Tan, M.L.; Samat, N.; Chan, N.W.; Lee, A.J.; Li, C. Analysis of Precipitation and Temperature Extremes over the Muda River Basin, Malaysia. Water 2019, 11, 283. [Google Scholar] [CrossRef] [Green Version]
  53. Sanusi, W.; Jemain, A.A.; Zin, W.Z.W.; Zahari, M. The Drought Characteristics Using the First-Order Homogeneous Markov Chain of Monthly Rainfall Data in Peninsular Malaysia. Water Resour. Manag. 2014, 29, 1523–1539. [Google Scholar] [CrossRef]
  54. Yusof, F.; Hui–Mean, F.; Suhaila, S.; Ching-Yee, K. Trend analysis for drought event in peninsular malaysia. J. Teknol. 2012, 57. [Google Scholar] [CrossRef] [Green Version]
  55. Deni, S.M.; Suhaila, J.; Zin, W.Z.W.; Jemain, A.A. Spatial trends of dry spells over Peninsular Malaysia during monsoon seasons. Theor. Appl. Clim. 2009, 99, 357–371. [Google Scholar] [CrossRef]
  56. Cheang, B.K.; Tan, H.V.; Yong, P.W. Some Aspects of Wet and Dry Spells in Malaysia, 1951-1983. Part I: Seasonal and monthly variations of wet and dry spells. Malays. Meteorol. Dep. Res. Publ. 1986, 15. [Google Scholar] [CrossRef]
  57. Thirumalai, K.; DiNezio, P.N.; Okumura, Y.; Deser, C. Extreme temperatures in Southeast Asia caused by El Niño and worsened by global warming. Nat. Commun. 2017, 8, 15531. [Google Scholar] [CrossRef] [PubMed]
  58. Othman, M.; Ahrasan, N.; Thung, T. Report on Climate Change Impacts in Penang. Available online: https://pgc.com.my/2020/wp-content/uploads/2021/04/Climate-Change-Impacts-in-Penang.pdf (accessed on 10 June 2021).
  59. Tefera, A.S.; Ayoade, J.O.; Bello, N.J. Comparative analyses of SPI and SPEI as drought assessment tools in Tigray Region, Northern Ethiopia. SN Appl. Sci. 2019, 1, 1265. [Google Scholar] [CrossRef] [Green Version]
  60. Payus, C.; Huey, L.A.; Adnan, F.; Rimba, A.B.; Mohan, G.; Chapagain, S.K.; Roder, G.; Gasparatos, A.; Fukushi, K. Impact of Extreme Drought Climate on Water Security in North Borneo: Case Study of Sabah. Water 2020, 12, 1135. [Google Scholar] [CrossRef]
  61. He, Q.; Chun, K.P.; Tan, M.L.; Dieppois, B.; Liew, J.; Klaus, J.; Fournier, M.; Massei, N.; Yetemen, O. Tropical drought patterns and their linkages to large-scale climate variability over Peninsular Malaysia. Hydrol. Process. 2021, e14356. [Google Scholar] [CrossRef]
  62. Bennett, L. Deforestation and Climate Change; Climate Institute: New York, NY, USA, 2017. [Google Scholar]
Figure 1. (a) Peninsular Malaysia, (b) location of the MRB in the northern region of Peninsular Malaysia, and (c) the streamflow station and distribution of meteorological stations in the MRB.
Atmosphere 12 01210 g001
Figure 2. Temporal changes in SPI-3 at the (a) Ampangan Muda, (b) Ampangan Pedu, (c) Badenoch Estate, (d) Butterworth, (e) Felda Sungai Tiang, (f) Hospital Baling, (g) Hospital Sungai Petani, (h) MARDI Bertam, (i) Pusat Pertanian Charok Padang, and (j) Pusat Pertanian Batu Seketol stations from 1985 to 2019.
Atmosphere 12 01210 g002
Figure 3. Spatial distribution of Sen’s slopes for months (dotted = significant trends, positive = increase, negative = decrease).
Atmosphere 12 01210 g003
Figure 4. Drought occurrence frequency based on the intensity of drought.
Atmosphere 12 01210 g004
Figure 5. Characteristics of the (a) maximum drought duration, (b) maximum drought severity, (c) maximum drought intensity, and (d) maximum drought peak distributions in the MRB from 1985 to 2019.
Atmosphere 12 01210 g005
Figure 6. Response rate of streamflow to precipitation in the Muda River basin from 1985 to 2019.
Atmosphere 12 01210 g006
Figure 7. Comparison of the SPI and SPEI at 1-, 3-, 6-, and 12-month timescales at the Butterworth station from 1985 to 2019.
Atmosphere 12 01210 g007
Figure 8. Comparison of the SPI and SPEI at 1-, 3-, 6-, and 12-month timescales at the Pusat Pertanian Charok Padang station from 1985 to 2019.
Atmosphere 12 01210 g008
Figure 9. Comparison of the SPI and SPEI at 1-, 3-, 6-, and 12-month timescales at the Ampangan Muda station from 1985 to 2019.
Atmosphere 12 01210 g009
Table 1. Reported drought events within and surrounding the Muda River basin (MRB).
ReferenceFindingsDate
Ahmad [29]Six drought incidents were reported in the Muda area between 1977 and 1992.1977–1992
Fadzilatulhusni [30]In 2005, the rainfall distribution range recorded in Daerah Timur Laut, Penang, was 0 mm to 500 mm, which is considered a low rainfall rate. In 2004, Penang had the lowest rainfall rates, ranging from 100 to 1600 mm/year.2004–2005
My Metro [31]Continuous drought affected the water resources in Penang. The Air Itam dam was at 59.9% of the water level (expected to sustain for 59 days), which almost reached the critical level and, the Teluk Bahang dam at 61.5% (expected to sustain for 187 days).16 April 2016
Arudllas [32]The government took steps to conduct more cloud seeding in catchments areas for Beris and Muda dams in Kedah to raise the level of the Muda River. If both of the dams dry up, Penang would be affected badly because the Muda River supplies more than 80% of the water demand in Penang.26 April 2016
The Straits Times [33]Most of the farmers in Kedah and Perlis were affected by drought when they had to delay their paddy planting to March and April.18 March 2016
DID [34]At the end of June 2018, 13 meteorological stations recorded a rainfall deficit of more than 35%; 9 of the stations are located in the northern region of Peninsular Malaysia.13 June 2018
Razak [35]20,000 people in Kedah were affected by drought, and Kedah was the first state facing a water supply cut due to a lack of rain.13 March 2019
PBAPP [36]The effective capacity of the Air Itam dam decreased (31.8%) within 2 months (1 January 2019 to 6 March 2019). The Muda River also showed a decrease in the water level on 1 January 2019, and the river level was 2.35 mm compared to 6 March 2019, when it was 1.55 mm.7 March 2019
Imran [37]The effective capacity of the dams at Ahning, Pedu, Muda, and Beris on January 15 was 62.48%, 47.60%, 17.88%, and 81.25%, respectively. The dams in Kedah were at an alarmingly low level.18 January 2020
Predeep [38]Approximately 3000 households in Kedah were without water as a result of the state’s drought.17 February 2021
Table 2. List of meteorological and streamflow stations.
Station NameLatitudeLongitudeStation Type
Badenoch Estate5.55100.76Meteorological
Hospital Sungai Petani5.65100.5Meteorological
Hospital Baling5.68100.93Meteorological
Pusat Pertanian Charok Padang5.8100.72Meteorological
Pusat Pertanian Batu Seketol5.97100.8Meteorological
Felda Sungai Tiang5.99100.6Meteorological
Ampangan Pedu6.25100.77Meteorological
Ampangan Muda6.12100.85Meteorological
Butterworth5.47100.47Meteorological
Mardi Bertam5.54100.47Meteorological
Jambatan Syed Omar5.61100.63Streamflow
Table 3. Drought event classification based on SPI values [42].
SPIDrought Categories
>2.00Extremely wet
1.50 to 1.99Severely wet
1.00 to 1.49Moderately wet
0.99 to −0.99Near normal
−1.00 to −1.49Moderately dry
−1.50 to −1.99Severely dry
<−2.00Extremely dry
Table 4. Hydrological drought characteristics that occurred in the MRB.
Start DateEnd DateDurationPeakSeverityIntensity
Apr 1990Apr 199113−2.3−10.43−0.8
Dec 1991Jul 19928−1.87−9.98−1.25
Dec 1992Jun 19937−2.49−9.45−1.35
Jan 1995Mar 19953−1.88−3.61−1.2
Aug 1995Jan 19966−2.68−9.48−1.58
Mar 1998Aug 19986−2.5−9.77−1.63
Feb 2002Feb 200313−2.37−20.09−1.55
Nov 2004Feb 20054−1.44−3.87−0.97
Oct 2005Jan 20064−1.3−3.35−0.84
Sep 2006Feb 20076−1.9−6.96−1.16
Dec 2011Feb 20123−1.05−2.23−0.74
Oct 2016Dec 20163−1.42−2.94−0.98
Table 5. Summary of extreme drought (<−2) occurrences with the maximum drought characteristics (1985–2019); bold values indicate the maximum drought characteristics.
Station NameStart DateEnd DateDurationPeakSeverityIntensity
Ampangan MudaFeb 1986Sep 19868−2.13−7.56−0.95
May 2003Jul 20033−2.47−5−1.67
Ampangan PeduDec 2004Oct 200511−2.28−12.45−1.13
Mar 2015May 20153−2.42−5.58−1.86
Apr 2016Nov 20168−2.64−10.7−1.34
Badenoch EstateJan 1992Jul 19927−2.8−8.32−1.19
Apr 2016Jun 20163−2.16−4.28−1.43
ButterworthNov 1991Mar 19925−2.88−8.2−1.64
Aug 1994Jul 199512−2.37−13.53−1.13
Jun 2008Aug 20083−2.62−5.96−1.99
Felda Sungai TiangNov 1994Jul 19959−3.38−19.64−2.18
Apr 1998Jun 19983−3.04−7−2.33
Feb 2002Dec 200211−2.18−9.09−0.83
Hospital BalingJul 2012Dec 20126−3.04−14.29−2.38
Oct 2013Apr 20147−2.84−11.12−1.59
Mar 2019Sep 20197−2.86−10.02−1.43
Hospital Sungai PetaniJan 1990Sep 19909−3.01−12.78−1.42
Aug 2005Oct 200615−2.71−15.1−1.01
Mardi BertamApr 1998Jun 19983−2.51−4.91−1.64
Sep 2001Mar 20027−2.12−7.01−1
Jun 2008Sep 20084−2.45−7.4−1.85
Pusat Pertanian Batu SeketolFeb 1986Sep 19868−2.53−4−0.5
Apr 1998Jun 19983−2.58−6.2−2.07
Jun 2011Jan 20128−2.89−9.85−1.23
Apr 2016Jun 20163−3.06−5.75−1.92
Pusat Pertanian Charok PadangMay 2006Oct 20066−2.71−6.72−1.12
Oct 2012Dec 20123−2.51−4.97−1.66
Table 6. Correlations between ENSO, MJO, and IOD with drought indices (red bold indicates a significant correlation at a 95% confidence level).
MonthSPI-3SSI-3
ENSOIODMJOENSOIODMJO
January−0.360.01−0.27−0.140.110.13
February−0.340.140.41−0.32−0.070.10
March−0.620.46−0.05−0.390.440.02
April−0.670.22−0.07−0.550.400.11
May−0.330.20−0.28−0.430.16−0.40
June−0.110.050.17−0.270.20−0.16
July−0.10−0.150.26−0.080.270.00
August−0.11−0.04−0.350.220.52−0.19
September−0.07−0.11−0.150.080.26−0.09
October−0.04−0.17−0.060.040.13−0.13
November0.000.00−0.10−0.020.000.13
December−0.08−0.20−0.17−0.14−0.030.04
Table 7. Comparison of the SPI and SPEI in estimating frequency, average duration, average peak, average severity, and average intensity of droughts at 1-, 3-, 6-, and 12-month timescales.
SPI SPEI
StationTimescaleFrequencyDurationPeakSeverityIntensityFrequencyDurationPeakSeverityIntensity
Butterworth1452.07−1.69−2.53−1.35452.11−1.45−2.41−1.20
3293.86−1.73−4.41−1.16294.17−1.53−4.53−1.10
6186.44−1.65−7.13−1.08206.45−1.42−6.72−0.98
121010.50−1.70−12.29−1.07911.63−1.63−14.16−1.12
Pusat Pertanian Charok Padang1471.94−1.62−2.35−1.37481.96−1.52−2.32−1.32
3284.11−1.77−4.64−1.20274.15−1.64−4.67−1.20
6196.74−1.58−7.34−1.06226.09−1.28−6.47−1.04
12813.75−1.69−15.38−1.011011.00−1.56−12.27−1.01
Ampangan Muda1551.82−1.58−2.09−1.32571.82−1.36−1.96−1.18
3314.10−1.65−4.36−1.14313.84−1.50−4.25−1.13
6196.16−1.56−6.59−1.07196.95−1.46−7.50−1.07
121011.80−1.67−12.02−1.011210.70−1.41−10.58−0.93
Table 8. Correlation of the SPI and SPEI with rainfall and maximum and minimum temperatures at 1-, 3-, 6-, and 12-month timescales.
Station SPI-1SPEI-1SPI-3SPEI-3SPI-6SPEI-6SPI-12SPEI-12
ButterworthRF0.680.700.400.420.280.290.220.22
Tmax−0.28−0.31−0.24−0.28−0.21−0.25−0.17−0.20
Tmin−0.020.000.020.03−0.020.010.030.09
Pusat Pertanian Charok PadangRF0.700.700.430.430.280.270.230.21
Tmax−0.18−0.21−0.16−0.19−0.09−0.13−0.04−0.07
Tmin0.100.120.070.090.050.060.080.09
Ampangan MudaRF0.680.680.410.400.250.240.210.20
Tmax−0.15−0.20−0.19−0.22−0.16−0.19−0.10−0.14
Tmin0.110.100.080.070.020.000.03−0.01
Publisher’s Note: MDPI stays neutral with regard to jurisdictional claims in published maps and institutional affiliations.

