Article

Rapid Evaluation of the Effects of Policies Corresponding to Air Quality, Carbon Emissions and Energy Consumption: An Example from Shenzhen, China

1
Shenzhen Institute of Building Research Co., Ltd., Shenzhen 518049, China
2
Institute of Energy, Environment and Economy, Tsinghua University, Beijing 100084, China
3
School of Environment, Tsinghua University, Beijing 100084, China
4
Chinese Society for Urban Studies, Beijing 100835, China
5
School of Environment and Energy, South China University of Technology, Guangzhou 510006, China
*
Author to whom correspondence should be addressed.
Atmosphere 2021, 12(9), 1221; https://doi.org/10.3390/atmos12091221
Submission received: 3 August 2021 / Revised: 7 September 2021 / Accepted: 13 September 2021 / Published: 17 September 2021
(This article belongs to the Section Air Quality)

Abstract

:
Efficient environmental policies are necessary in the improvement of air quality and reduction in carbon emissions, and the interactions between policy, activity, emissions, and environment comprise a cycle allowing the evaluation of the effects of implemented policies. Based on the establishment of the connection between environmental parameters and policy context using a quantifiable methodology, in this study, we formulated a rapid and simplified pattern for the evaluation of the effects of policies concerning the atmospheric environment, and applied it to the evaluation and improvement of policies for Carbon dioxide (CO2) reduction and air quality enhancement in the sample city of Shenzhen. The Response Surface Model-Visualization and Analysis Tool (RSM-VAT) in the Air Benefit and Cost and Attainment Assessment System (ABaCAS) was applied as the core tool. The required reductions in Fine particulate matter (PM2.5) and Sulfur dioxide (SO2) emissions for 2014–2019 are expected to be achieved; however, the expected reductions in Nitrogen oxides (NOx) emissions (mainly from road mobile sources) and Volatile organic compounds (VOCs) emissions (mainly from secondary industry and road mobile sources) are less certain. According to the simulated concentration of PM2.5 in 2019, it is necessary to reduce the concentrations of air pollutants, both within and outside Shenzhen. The background weather conditions may be the main reason for the increased concentrations of Ozone (O3) in October compared to those in July. Reductions in NOx and VOCs tend to be the main factors driving changes in O3 concentrations. Policies have been formulated and implemented in a wide array of areas. According to the quantitative comparative analysis of the policies, and the relevant activities, the greatest challenge in reducing NOx and VOCs emissions is presented by the oil-powered vehicles in the road mobile sector and organic solvent production in the secondary industry sector. Therefore, in an effort to achieve better air quality and ensure that CO2 emissions reach a peak in Shenzhen by 2025, we propose key improvements in policies based on interdisciplinary cooperation, involving not only atmospheric and environmental science, but also governance and urban planning.

1. Introduction

Since the Industrial Revolution, the high-intensity consumption and utilization of fossil fuels has supported rapid economic growth in various fields and improved the comfort and convenience of people’s lives. However, this has been accompanied by air pollution and climate change, along with the consequent introduction of public health risks [1,2]. In the past decade, China has made significant efforts to prevent and control air pollution, and has achieved some improvements [3,4,5,6]. Since the announcement in 2020 that “China aims to have Carbon dioxide (CO2) emissions peak before 2030 and achieve carbon neutrality before 2060” [7], Chinese cities have been carrying out in-depth changes to their energy structure and industrial structure, while simultaneously solving multiple environmental problems with intensive management and control schemes, i.e., improvement in air quality and reductions in carbon emissions are being promoted together.
Figure 1 summarizes the relationship between policy, activity, emissions, and environment, as it pertains to improving air quality and reducing carbon emissions. There are also economic effects associated with these environmental issues; however, the objects of the present study are limited to the environmental policy effects corresponding to the reduction in the (concentrations of) specific physical substances in the atmosphere.
Policy: The United States Environmental Protection Agency (EPA) has formulated a system of “Pollution Prevention Law and Policies” [8]. Regarding pollution prevention policy and climate change mitigations, the EPA has established methods of measuring the effects of preventative policy—for instance, by considering key characteristics of the data source such as time frame, number of data points, and biases [9]. With regard to the European Commission’s 2030 climate and energy framework, the effects of the development of renewables in the European transport network have been evaluated, based on the method of strengths, weaknesses, opportunities, and threats (SWOT) [10]. With respect to the Italian liquid biofuel niche, processes including agenda setting, impact analysis, and policy formulation have been identified as a policy cycle, and the significance of combining different policy instruments has been emphasized [11]. In general, quantitative analysis is necessary to guarantee adequate and effective policymaking and implementation, and the improvements therein.
Activity: Energy consumption activities exist in diverse industries and sectors. The electric power industry involves the consumption of metal in power equipment (e.g., for power transmission), and significant differences in consumption patterns have been identified at different stages of low-carbon transformation [12]. In a Swedish case study, household energy consumption (e.g., for food preparation, recreation, or work) were codified for interviewees to complete daily records [13]. A study on household energy consumption activities in China identified a direct group (e.g., heating power, coal, natural gas, or gasoline) and an indirect group (e.g., hygiene, food, or education) [14]. A study characterizing mobility flows found that a 1.4% reduction in trip time could contribute to liters of fuel savings [15]. Critical issues in the consumption activities are efficient/reduced utilization of fossil fuel energy and increased consumption of clean energy, abstracted in the context of emissions reduction.
Emissions: Open burning of crop residue can exert negative effects on air quality, and 13 types of emitted air pollutants, e.g., Sulfur dioxide (SO2), Nitrogen oxides (NOx), Fine particulate matter (PM2.5), Volatile organic compounds (VOCs), Ammonia (NH3), and CO2, were found in an analysis combined with satellite-derived fire radiative energy [16]. Based on the total energy consumption, emission factors, efficiency, and effectiveness of renewable energy, the total emissions of NOx, PM, CO, and CO2 in Germany were estimated over several years, addressing the impact of power network congestion [17]. Taking the Brenner Base Tunnel as an example, a heuristic method for the accounting of CO2 emissions (for economic evaluation) in transport was developed, in which the phases of construction and operation were both considered; meanwhile, the uncertainties were analyzed in detail [18]. The carbon footprint of a rackmount electronic server was measured, accounting for the uncertainty arising from temporal variability and technological specificity [19]. A growing number of studies suggest that CO2 and air pollutants possess similar emission sources [20,21,22]; thus, synergistic policies to control emission sources can aid in both air quality improvements and climate-change mitigation. The physical substances emitted into the atmosphere are the core control objects, in addition to the relevant emission activities.
Environment: Air quality is the ultimate optimization object in the control policies of the present study. The effects of controls on regional air pollution and CO2 emissions during the 2014 Youth Olympic Games in Nanjing, China, were evaluated based on monthly concentrations of air pollutants and simulated CO2 emissions [23]. Observed and simulated hourly PM2.5 concentrations in Qingdao, China were analyzed for three PM2.5 pollution events [24]. Through source apportionment, it was established that the particulate pollutions in Lanzhou, China, were highly influenced by vehicle emissions [25]. Observational recording of concentrations, identification of composition via sampling analysis (e.g., source apportionment), and temporal and spatial distribution simulated by models or observed by satellites comprise a series of methods for the comprehensive evaluation of air quality, which is itself a consequence of the policy, activity, and emissions in a specified area.
However, apart from the observational recordings, each approach to air quality evaluation is applied relatively independently, due to the highly specialized skills and equipment required in fields as varied as environmental science, computer science, atmospheric chemistry, and remote sensing imagery. Therefore, the establishment of a connection between policymaking and those fields is becoming essential, in order to ensure the adequacy and the effectiveness of policy. To meet this demand, firstly, the environmental parameters should be connected to the relevant policy contents, and secondly, a rapid and simplified pattern by which users can evaluate the effects of such controls is necessary, in order to identify both past and future policy effects, based on comprehensive evaluation of the circumstances. As such, this study aimed to explore such a perspective.
As a government functional unit to promote the optimization and improvement of environmental quality, the Shenzhen Ecological Environment Bureau has committed to ensuring that by 2025 the annual average concentration of PM2.5 in Shenzhen will be lower than 20 µg/m3, and the CO2 emissions peak will have been achieved [26,27]. Although Shenzhen has implemented an abundance of relevant policies, and achieved good outcomes supported by empiricism and comprehensiveness, the evaluation of the policy effects in terms of clear interaction mechanisms has yet to be carried out. This constitutes a problem from a scientific perspective, with regard to normalization of the data.
Therefore, the city of Shenzhen, China, was selected as an example, and the present study had three main objectives: (1) to establish the connection between environmental parameters and policy context using a quantifiable methodology; (2) to formulate a rapid and simplified pattern for the evaluation of the effects of policy on the atmospheric environment, with an explanation of the interaction mechanism; and (3) to apply the evaluation pattern in order to improve/modify the policies in the sample city, so as to achieve CO2 reduction and better air quality. In general, the uniqueness of the present study is in the preliminary establishment of a complete workflow by which environmental policy can be evaluated, addressing the full cycle of policy, activity, emissions, and environment.

2. Data and Methodology

A flowchart of the present study’s methodology is shown in Figure 2. The first objective of this study was achieved through the identification of similarity (i.e., “Similar category” shown in Figure 2) between the policy section and the emissions section. The second objective was achieved via the full view of Figure 2, in which the loops are the key processes by which to identify policy effects in specific scenarios. The third objective was fulfilled by the application of the evaluation pattern to Shenzhen, and the discussion of potential future policy improvements. This study focuses on the effects of policy on air quality in a limited timespan (i.e., years), and carbon emissions (as a proven cooperative phenomenon with air pollution) are also partially addressed for the discussion of synergism in management.
Materials including data on base year air quality and base year air pollutant emissions, in addition to the relevant policy documents implemented in the time period, are necessary. Models are essential tools for the outputs of air quality, i.e., for the loops in Figure 2. The details of each element in Figure 2 are explained in the following subsections.

2.1. Meteorology, Energy, Economy, and Air Quality in Shenzhen

2.1.1. Meteorology, Energy, and Economy

Shenzhen is located to the east of the Pearl River Estuary (113°46’ to 114°37’ E, 22°27’ to 22°52’ N) (excluding the Shenzhen–Shanwei Special Cooperation Zone [28] in this study), and hot summers can last for more than 6 months (from April to October) [29]. The average temperature in July is the highest, with the best Ozone (O3) conditions, whereas the worst O3 concentrations are frequently found in October [30].
Shenzhen’s total energy consumption was 3711.72 (10,000 tons of SCE) in 2014 [31], and 4534.14 (10,000 tons of SCE) in 2019 [32], of which (in 2019) secondary industries accounted for approximately 35%. The proportions of gross domestic product (GDP) created by primary, secondary, and tertiary industries in Shenzhen have changed from 0%, 40.3%, and 59.7%, respectively, in 2016 to 0.1%, 37.8%, and 62.1%, respectively, in 2020 [33]. Tertiary industries with low-carbon and high-tech characteristics are the key development fields in the 14th Five-Year Plan [34], and the energy consumption of these fields usually depends on electricity supply.

2.1.2. Air Quality Findings from Studies and Observational Reports

(1)
Source apportionment research
According to the source apportionment of PM2.5 in Shenzhen in 2014 [35], vehicle emissions are one of the main sources of air pollutants. By comparison, regional pollutant contributions are clearer—vehicle emissions, secondary nitrate, coal burning, fugitive dust, and building dust were the main local emissions. A study [36] based on the monitoring data in Shenzhen in 2015 showed that geographic and meteorological characteristics significantly influenced the concentration of PM2.5; the contributions to the PM2.5 from the surrounding area were greater than those from local area; and the highest local contribution was from industry, followed by vehicle emissions and road dust.
As one precursor of O3, VOCs in some areas of Shenzhen [37] mainly come from road vehicle emissions (29%), solvent and paint use (31%), the chemical industry (23%), and stationary combustion (17%).
(2)
Analysis based on simulation
According to the simulated analysis of O3 source apportionment at the East Coast of the Pearl River Estuary (where Shenzhen’s Bao’an district is located) in October 2014 [38], approximately 60% of the O3 in the afternoon was background concentration; the contribution of local emissions was relatively less, but the emissions from the neighboring cities were relatively high; and the O3 in this area was mainly generated in the morning and late afternoon in the NOx sensitive region, and near noon in the VOCs sensitive region.
(3)
Annual report of air quality
As described in the annual environmental bulletin, 5 annual indicators of air quality assessment from 2014 to 2019 were collected, and are displayed in Table 1. The average annual concentration of PM2.5 has steadily decreased from 34 µg/m3 in 2014 to 24 µg/m3 in 2019, achieving the WHO’s IT-2 [39].
Table 1 shows that the poor air quality caused by PM2.5 has been significantly improved, but the O3 concentration in Shenzhen has increased, and has become the main impediment to the improvement of air quality. Therefore, the improvement of air quality in Shenzhen highly depends on the collaborative control of concentrations of PM2.5 and O3—the two substances on which this study focuses.
According to the WHO Air Quality Guidelines: Global Update 2005 [39], WHO’s IT-1 for annual mean concentration of PM2.5 is 35 µg/m3, whereas IT-2 is 25 µg/m3—which were achieved in Shenzhen in 2014 and 2019, respectively. IT-3 is 15 µg/m3, but the target of Shenzhen for 2025 is 20 µg/m3. Therefore, it will still be necessary to significantly reduce the concentration of PM2.5 even when Shenzhen’s 2025 target has been achieved.
The WHO’s IT-1 for the daily maximum 8 h mean of O3 is 160 µg/m3, and the Ambient Air Quality Standards (GB 3095-2012) of China [46] apply the same value as a secondary concentration limit standard. Since the issuance of the Technical Regulation for Ambient Air Quality Assessment (On Trial) (HJ 663095-2013) in China [47] in 2013, the 90th percentile of the daily maximum 8 h means of O3 concentrations has been applied as the key indicator for the concentration of O3, and is the value that has been used by the Shenzhen government since approximately 2017, as shown in Table 1. Due to the required model settings in this study, and the effectiveness of the simulated concentration, the monthly outputs of the 90th percentile of the daily maximum 8 h means of O3 were assigned and obtained for further analysis, instead of annual outputs. In the subsequent sections, “the 90th percentile of daily maximum 8-h means of O3 concentrations” is abbreviated as “the concentration of O3” or “O3 concentration”.

2.2. Data and Scenario Settings

2.2.1. Data Sources for Air-Quality Simulation

In 2014, the Shenzhen government invited research institutions to establish a pollutant emission inventory, and to simulate the “whole year” and “typical months” of the air quality. The School of Environment, Tsinghua University, was one of these institutions, and completed the research on benefit and cost analysis regarding the improvement of air quality in Shenzhen, using the Response Surface Model-Visualization and Analysis Tool (RSM-VAT) [48], based on the outputs of the Community Multiscale Air Quality Model (CMAQ) [49]. The default RSM-VAT results for 2014 were applied in this study as the base year (i.e., 2014) conditions.
The simulated air quality in all of the corresponding years (i.e., 2014, 2019, and 2025) was obtained based on scenario settings. Atmospheric conditions in each year were assumed to be the same as in 2014. The annual PM2.5 concentrations in 2014 and 2019, as shown in Table 1, were used as the calibrated reference for the simulation outputs in 2014 and 2019, respectively.

2.2.2. Reference of Air Pollutant Emissions and Reductions from 2014 to 2019

Table 2 presents the annual reduction ratios for the SZ area and OTHER, in accordance with the public document Air Quality Improvement Plan of Shenzhen (2017–2020) (issued by the Shenzhen Government [50]), with information about the scale of emissions reduction from 2012 to 2016. The reduction ratios for OTHER are half of those in SZ, with the assumption that the reduction in OTHER was weaker than in SZ.
The annual reduction ratios in Table 2, based on the annual conditions in 2012–2016, were applied in this study as the ratios for 2014–2019, i.e., regarded as the idealized capacity of annual reduction due to the lack of precise information on emissions for 2014. This assumed settings in Table 2 were calibrated by the simulation scenarios for 2014 and 2019 using the annual concentrations of PM2.5 (i.e., 35 and 24 µg/m3, respectively; see Table 1). The simulations for 2019 and 2025 were based on higher reduction ratios compared with the 2014 emissions. The principles underlying the scenario settings are introduced in Section 2.2.4.

2.2.3. Emission Inventory

Accounting for sources of emissions in different sectors is necessary not only for the control of emissions and related activities, but also for policymaking. Table 2 presents the reference level of emissions reduction for this study; however, data on the total emissions of air pollutants from different sectors in 2014 are lacking in this study (i.e., as mentioned above, information on the exact emission inventory for 2014 is incomplete). Therefore, guidance on the creation of an emission inventory was partially applied, along with the RSM-VAT input, in order to estimate the emission contributions by different sectors, and to meet the demands for policy analysis and improvements.
The report of the Technical Manual for Preparation of Urban Air Pollutant Emission Inventory [51,52] (hereafter referred to as the “Technical Manual”) edited by HE, K.B. et al., was applied as the key guidance. Appendix B in the Technical Manual provides a four-level coding system for the emission sources and control technologies, and parts of this coding system (see Table 3, translated from Chinese) are utilized as keyword labels in the policy analysis, i.e., this coding system is applied as the “similarity” between the policy and emissions sections illustrated in Figure 2. The air pollutant emission inventory for Guangdong province [53] was also consulted.
The absolute values of air pollutant emissions in the base year (2014) were generally estimated using 6 sectors: primary industry, secondary industry, road mobile, non-road mobile, living, and dust. Five air pollutants were included: SO2, NOx, VOCs, NH3, and PM2.5. The data used in the estimation were sourced from statistical yearbooks, environmental bulletins, and published research.
For instance, because NH3 emissions have not been a mainstream concern in Shenzhen, the emission amounts in 2014 and 2019 were estimated: the emissions from primary industry were based on the Technical Manual, and emissions from road mobile were based on the study by Cao, Y. [54] and the Technical Manual. According to the estimation presented in Table 4, the reduction ratios for NH3 presented in Table 2 were obtained.

2.2.4. Scenario Settings for RSM-VAT Simulations

Scenarios with different emission ratios are presented in Table 5, and are divided into three clusters pertaining to the three years of concern: 2014, 2019, and 2025. The meaning of each scenario is presented in Table 6. In general, the scenarios are designed for the continuous reduction in each air pollutant starting from 2014-S0. Furthermore, referring to the process of “modification if required” described in Figure 1, in addition to the necessary loops illustrated in Figure 2, the settings in Table 5 (with the exception of 2014-S0) were finalized based on a number of cycle tests, in order to ensure that the air quality can be improved as expected. For instance, the emission ratios for 2025 were calculated based on the reduction ratio applied in 2019, increasing the intensity until the scenario reached the PM2.5 target (i.e., an annual average of 20 µg/m3); this condition can be found in 2025-S4. Based on the reduction ratio for 2025-S4, the settings for 2025-S5, 2025-S6, and 2025-S7 were designed for emissions testing based on O3 concentration.

2.2.5. Source of Policy Text

Over the past 10 years, Shenzhen has conscientiously implemented the commands issued by the State Council [55,56,57], and the documents of policies related to Shenzhen’s ecological environment form the key basis of this study (i.e., original documents listed in Table 7). As early as 2013, Shenzhen issued a medium- and long-term low-carbon development plan covering a comprehensive grouping of social sectors through to 2020. Due to the similarity in emission sources of CO2 and air pollutants, this document (labeled “T-11–20” in Table 7) was included. T-13 in Table 7 is almost the oldest document identifying the management fields in Shenzhen for the pursuit of better air quality, and the subsequent documents have inherited a significant portion of its content.
Therefore, the policies addressed in this study pertain to air quality, carbon emissions, and energy consumption, and the synergy in management between these issues is considered. All of these documents possess three characteristics: (1) the issuance time is relatively continuous; (2) the policies within are not unchangeable; and (3) the topics covered in the text can be divided into 8 sectors: agriculture, industry (manufacturing), industry (energy and water), road mobile, non-road mobile, living, dust, and ecological items. The differences in sector scope were considered in the analysis of the results. The codes listed in Table 3 played a key role in textual reading and truth table label counts.

2.2.6. Estimation of CO2 Emissions and Economic and Social Activities

The report [64] Achieving Triple Goals of Carbon Emission Peaking, Air Quality Standard Attainment, and Economic Prosperity at the City Level: The Shenzhen Case (hereafter referred to as the “Triple Goals Study”) was applied to discuss emission sources of CO2 and PM2.5 by sector. Furthermore, direct carbon emissions from primary energy consumption in secondary industries were calculated based on Table 8 for the discussion of synergism in this sector. The data from the Shenzhen Statistical Yearbook [31] are abundant, and support this discussion particularly in the estimation of CO2 emissions and energy consumption.
The relative weightings of economic and social activities related to emissions of air pollutants and CO2 are also based on the data reported in the Shenzhen Statistical Yearbook.

2.3. Model and Methods

2.3.1. Application of ABaCAS

As an integrated assessment system linking a set of decision support tools for the conduction of integrated assessments of air quality, the “Air Benefit and Cost and Attainment Assessment System” (ABaCAS) [68,69] was developed to be user-friendly for both researchers and policymakers. The ABaCAS includes 8 parts, of which the RSM-VAT was the specific module applied in this study. As an air quality assessment tool, the RSM-VAT provides real-time estimates of air quality responses to changes in emissions using air quality models (e.g., CMAQ), and has been widely applied in studies on air quality [70,71,72,73].
Based on the simulated air quality in 2014, this study applied the RSM-VAT as the core model for simulations of air quality in 2019 and 2025, with a specific focus on emissions reduction, i.e., to evaluate the effects of policies (management and control measures) in the past, and identify their possible modifications for the future.
The path by which to approach the ABaCAS and RSM-VAT is presented in Figure 3a,b, respectively. The simulated areas distinguished by SZ (red, marked with “A-SZ”) and OTHER (blue, marked with “B-OTHER”) are labeled in Figure 3c, and these areas are divided into administrative regions where different reduction ratios and policies can be implemented. The distribution of annual average concentration of PM2.5 in the simulated area of the base year of 2014, as an example of the simulated results of the RSM-VAT, is presented in Figure 3d.
The RSM-VAT control panels operated in this study were the PM2.5-related control panel and the O3-related control panel. Both sets of control panels were divided between SZ and OTHER. The emission ratios of NOx, SO2, NH3, VOCs, and PM2.5 are parameters in the PM2.5-related control panel, whereas all but the latter are parameters in the O3-related control panel.
Based on the simulation conducted for the base year of 2014, the impact of reduced emission of air pollutants on both PM2.5 and O3 concentrations between each scenario is a key reference for the evaluation of the adequacy and effectiveness of policies. Although the simulated outputs can take the form of distrubution maps (e.g., Figure 3d), this research focuses on the analysis of the simulated value ranges via statistical methods (i.e., boxplots).

2.3.2. Application of Qualitative Comparative Analysis

Qualitative comparative analysis (QCA) has been widely used in policy analysis [75,76,77]. The method of policy matrix analysis also involves quantitative analysis of policy items [78,79]. In the process of policy analysis, the labels (i.e., the leveled codes in Table 3 and the 8 sectors mentioned in Section 2.2.5) were first applied to mark the policy texts, and then the counts of the labels were utilized to construct a quantitative table (i.e., a truth table) containing time series (i.e., the years as presented in Table 5). Subsequently, the truth table was abstracted into two bar charts—depicting the number of codes appearing in the text labeling, and the recognition of key words in the text labeling—for QCA analysis of policy impacts on emissions reduction.

3. Results

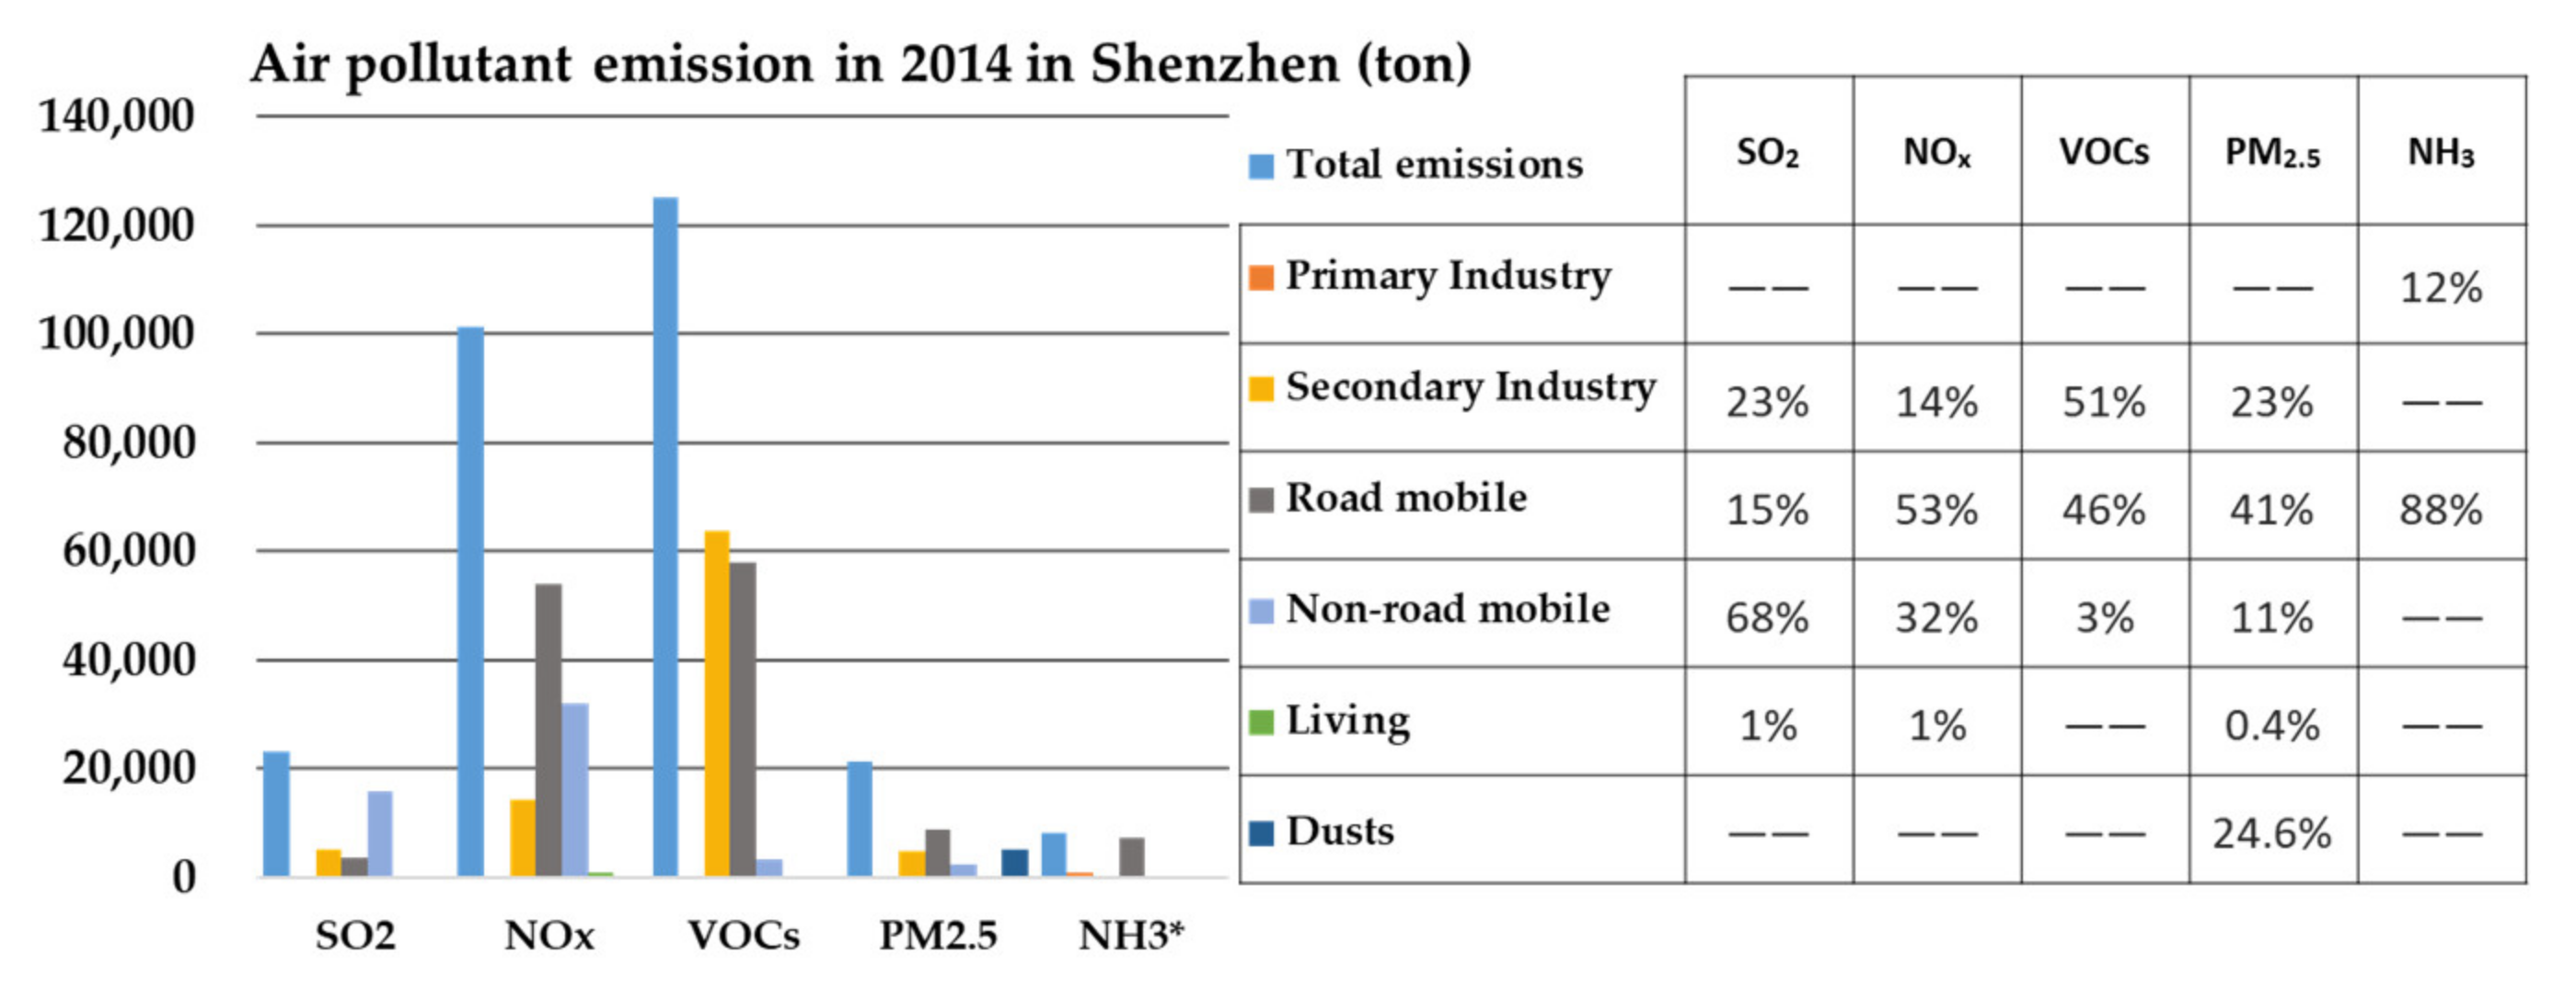
3.1. Estimation of Total Emissions in 2014

Estimated emissions of air pollutants in the base year of 2014 are detailed in Figure 4 by sector, together with the proportion of each pollutant. In 2014, the total emissions of NOx and VOCs (more than 100,000 tons of each) were significantly higher than those of the other three air pollutants. This suggests that the influence of NOx and VOCs on the air quality is higher than that of other pollutants with similar reduction ratios in each scenario. In addition, secondary industries, including the sectors mentioned in policies concerning industry (manufacturing), industry (energy and water), and organic solvent usage in living, and emissions from the sector of living, are specified from the perspective of energy consumption.
When analyzed by sector, the emission sources of VOCs in 2014 appear to be mainly from secondary industries and road mobile sectors, which are also the two sectors that contributed the greatest PM2.5 emissions. The emission sources of NOx appear to be mainly from the road mobile sector, followed by non-road mobile and secondary industries. The non-road mobile sector appears to have contributed the greatest SO2 emissions in 2014. These estimates are consistent with studies mentioned in Section 2.1.2.

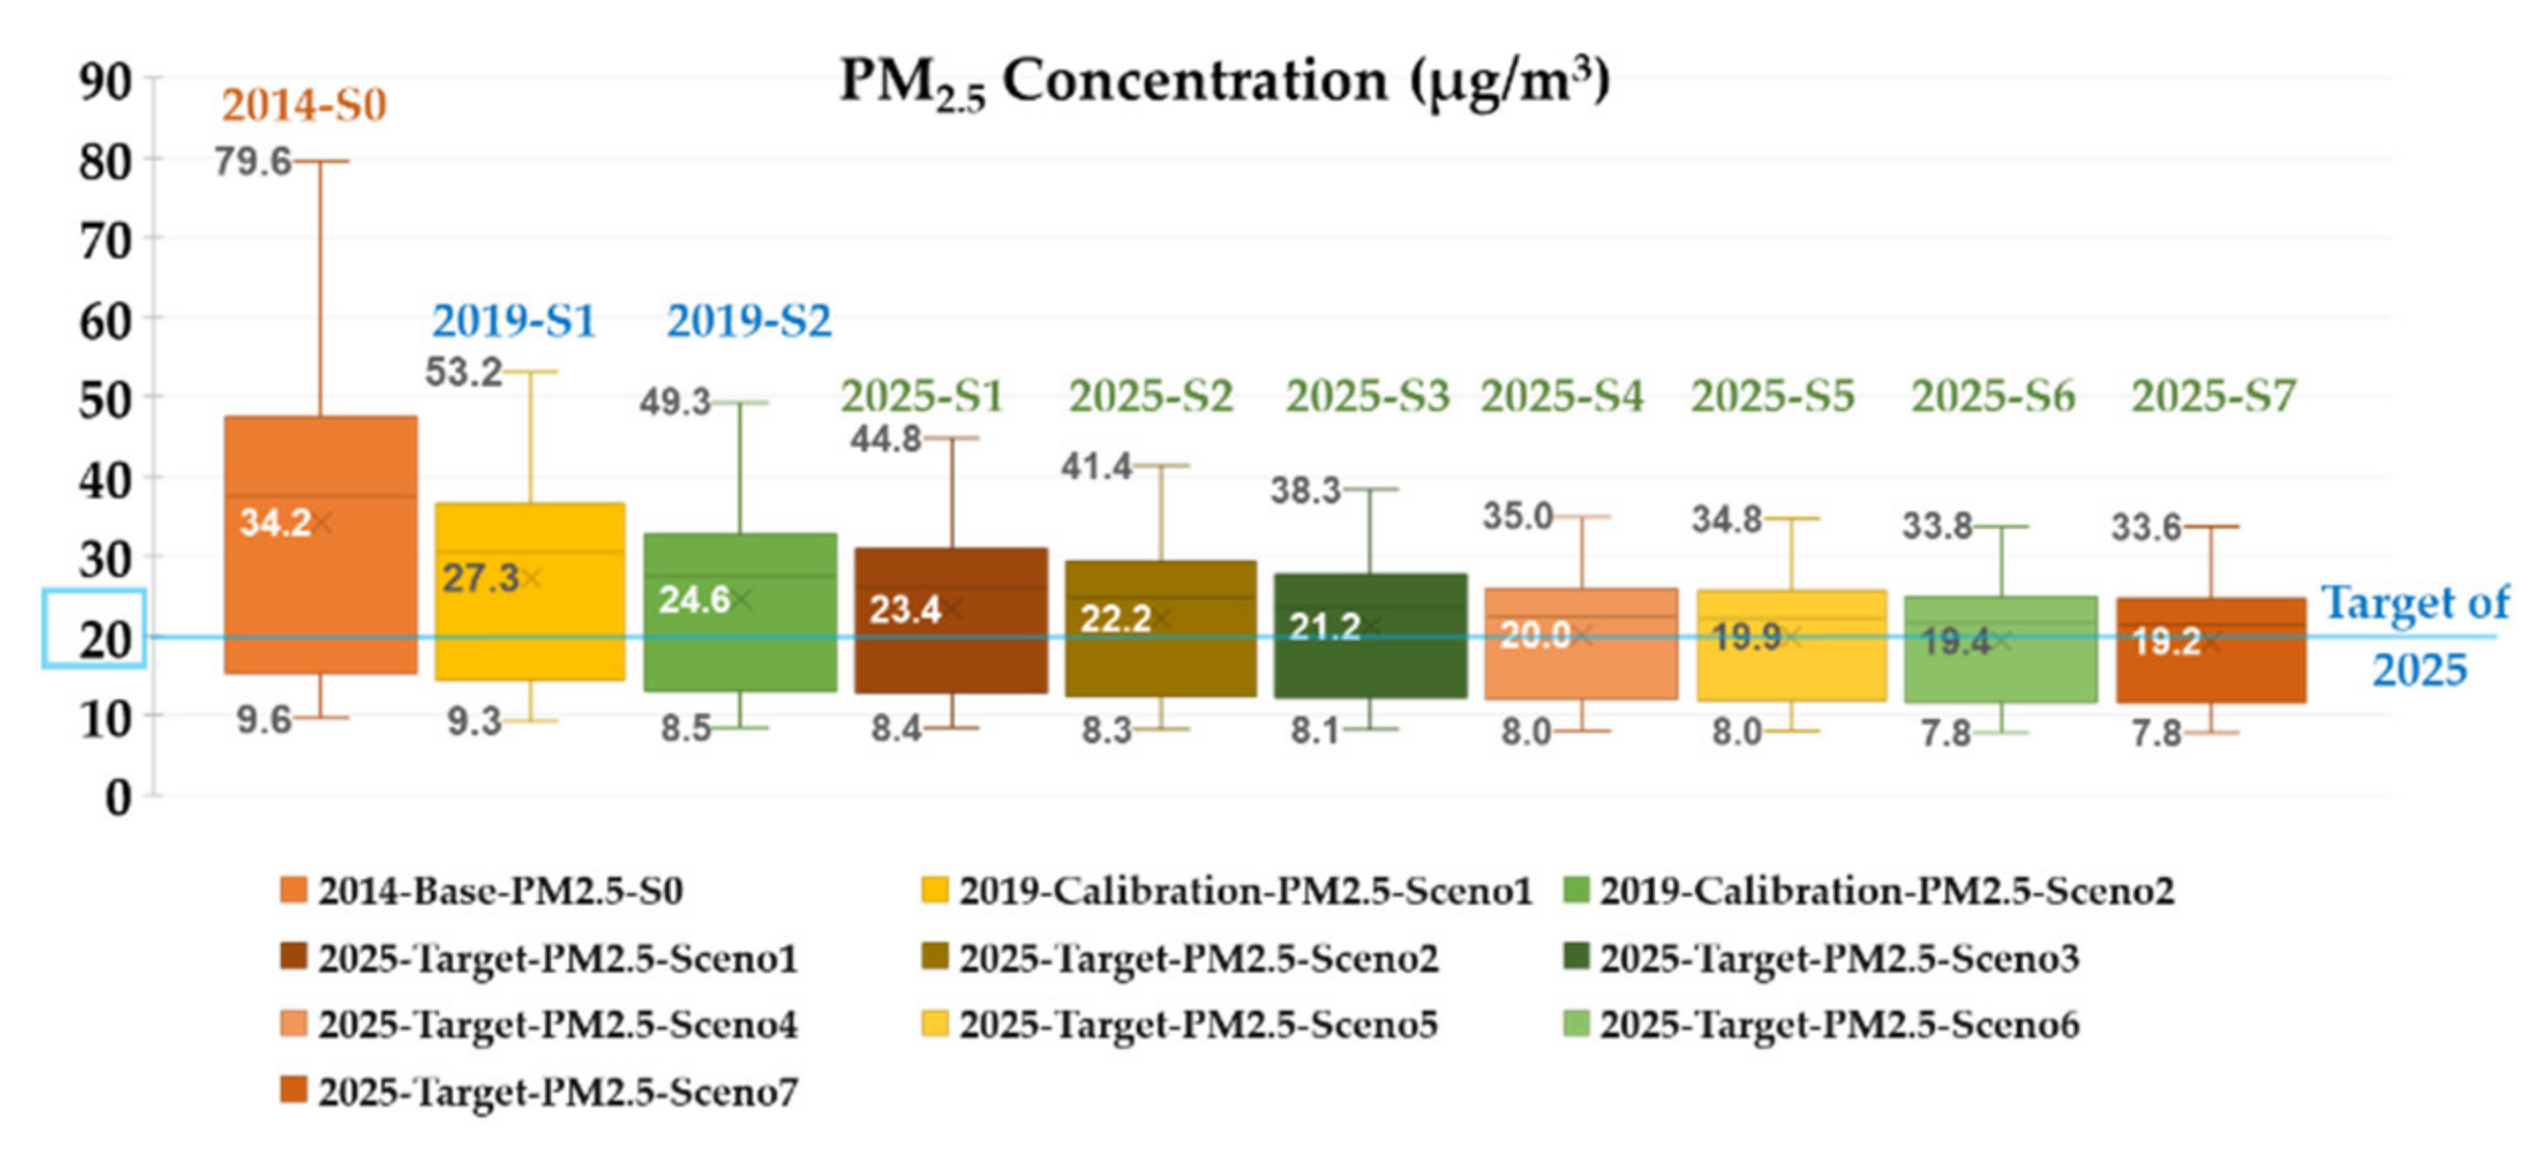
3.2. Simulated Concentrations of PM2.5 in Each Scenario in Shenzhen

The boxplots presented in Figure 5 show the simulated annual concentrations of PM2.5 (µg/m3) in SZ in each scenario listed in Table 5. In the first boxplot, the average value in the base year 2014 (2014-S0) is almost equal to 34 µg/m3, which is reported in Table 1 as the annual concentration of PM2.5 in 2014. Therefore, the base year conditions simulated by the RSM-VAT can be considered as being representative of the reality in 2014. Similarly, the average value in the calibration year 2019 (2019-S2) is close to 24 µg/m3, which Table 1 reports as the annual average value for 2019. Therefore, the simulated concentrations of PM2.5 in 2019-S2 can be regarded as being close to the actual conditions in SZ in 2019.
Furthermore, due to the two scenario settings for the simulations in 2019 (i.e., 2019-S1 and 2019-S2), the influence of OTHER on SZ can be clearly identified and, thus, reduction in air pollutant concentrations both within and outside SZ are necessary. This also indicates that the isolated efforts of SZ alone cannot achieve the required air quality in 2019, proving the existence of the synchronous reduction related to PM2.5 in OTHER.
The average value in the boxplot of 2025-S4 in Figure 5 is 20 µg/m3, which is equal to the target set by the Shenzhen government for 2025. In this simulated condition, each air pollutant (excluding NH3) was reduced dramatically (see the settings in Table 5), which would be a significant challenge in reality in both economic and social terms.
According to the comparison between 2025-S4, 2025-S5, 2025-S6, and 2025-S7, even with a stronger reduction in the four air pollutants both within and outside Shenzhen, no obvious changes in the annual concentrations of PM2.5 can be found in the boxplots, particularly in 2025-S5, in which only the emissions of NOx and VOCs are reduced (probably with a much higher absolute reduction, according to Section 3.1). Two aspects might explain this phenomenon: Firstly, the PM2.5 emissions are not reduced after 2025-S4, and according to the PM2.5 source apportionment analysis, a huge amount of PM2.5 originates from background sources (e.g., secondary sulfate and secondary nitrate). Secondly, although reduction in NOx and VOCs emissions can also reduce the annual concentrations of PM2.5 (comparing 2025-S4, 2025-S5, and 2025-S7), such concentrations may be more sensitive to PM2.5 and SO2 emissions (comparing 2025-S4, 2025-S6, and 2025-S7).

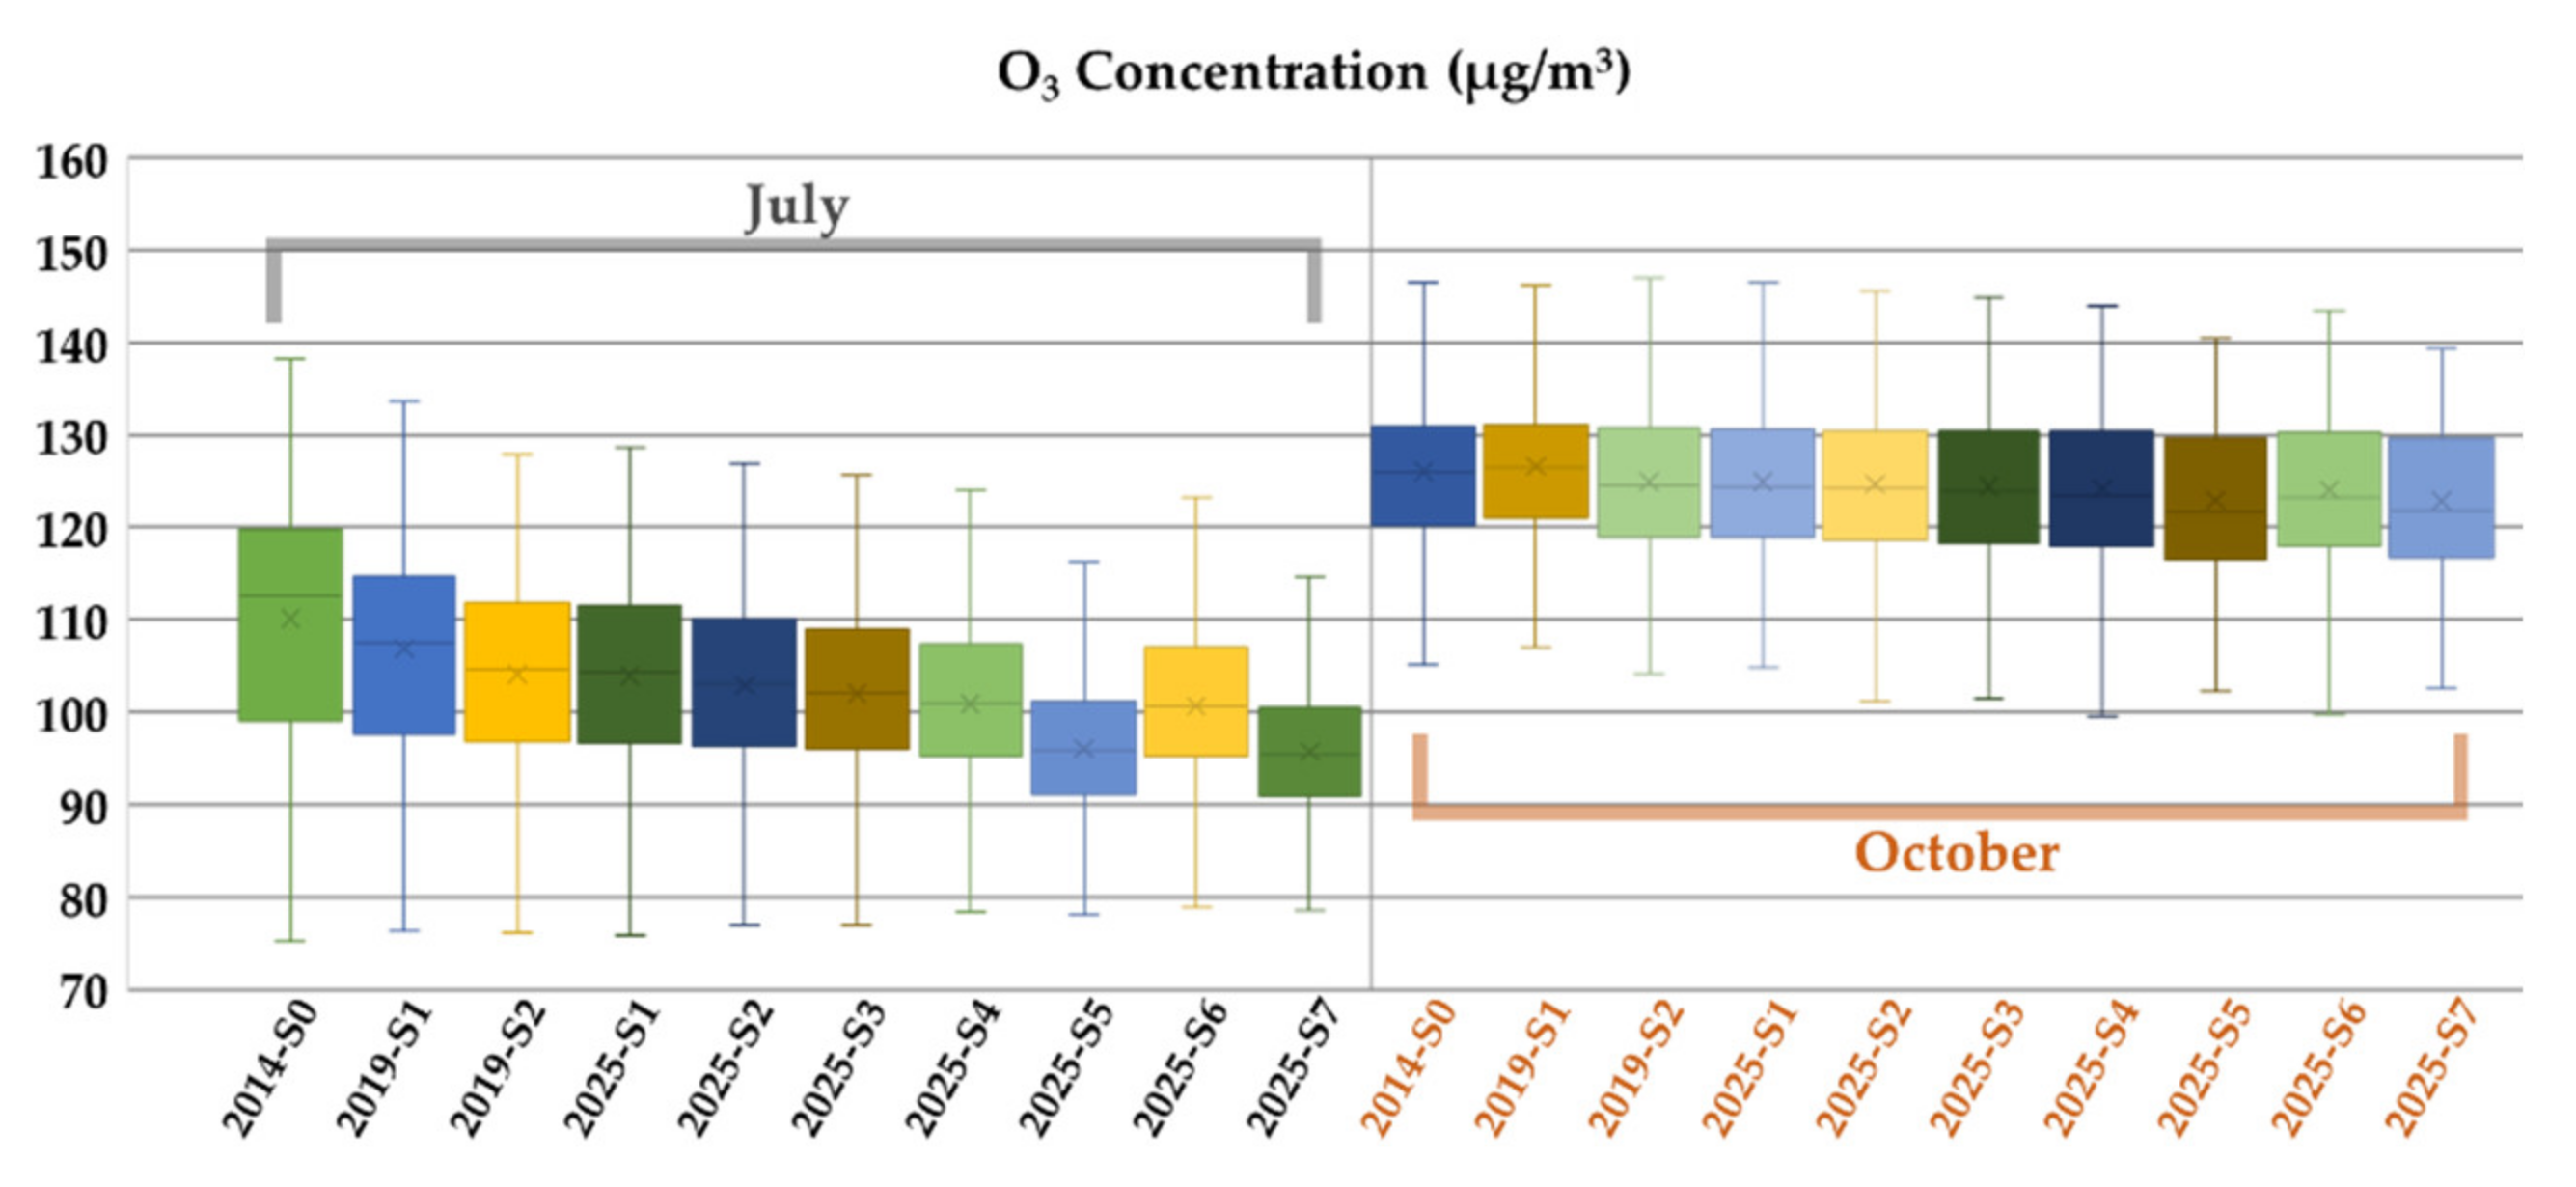
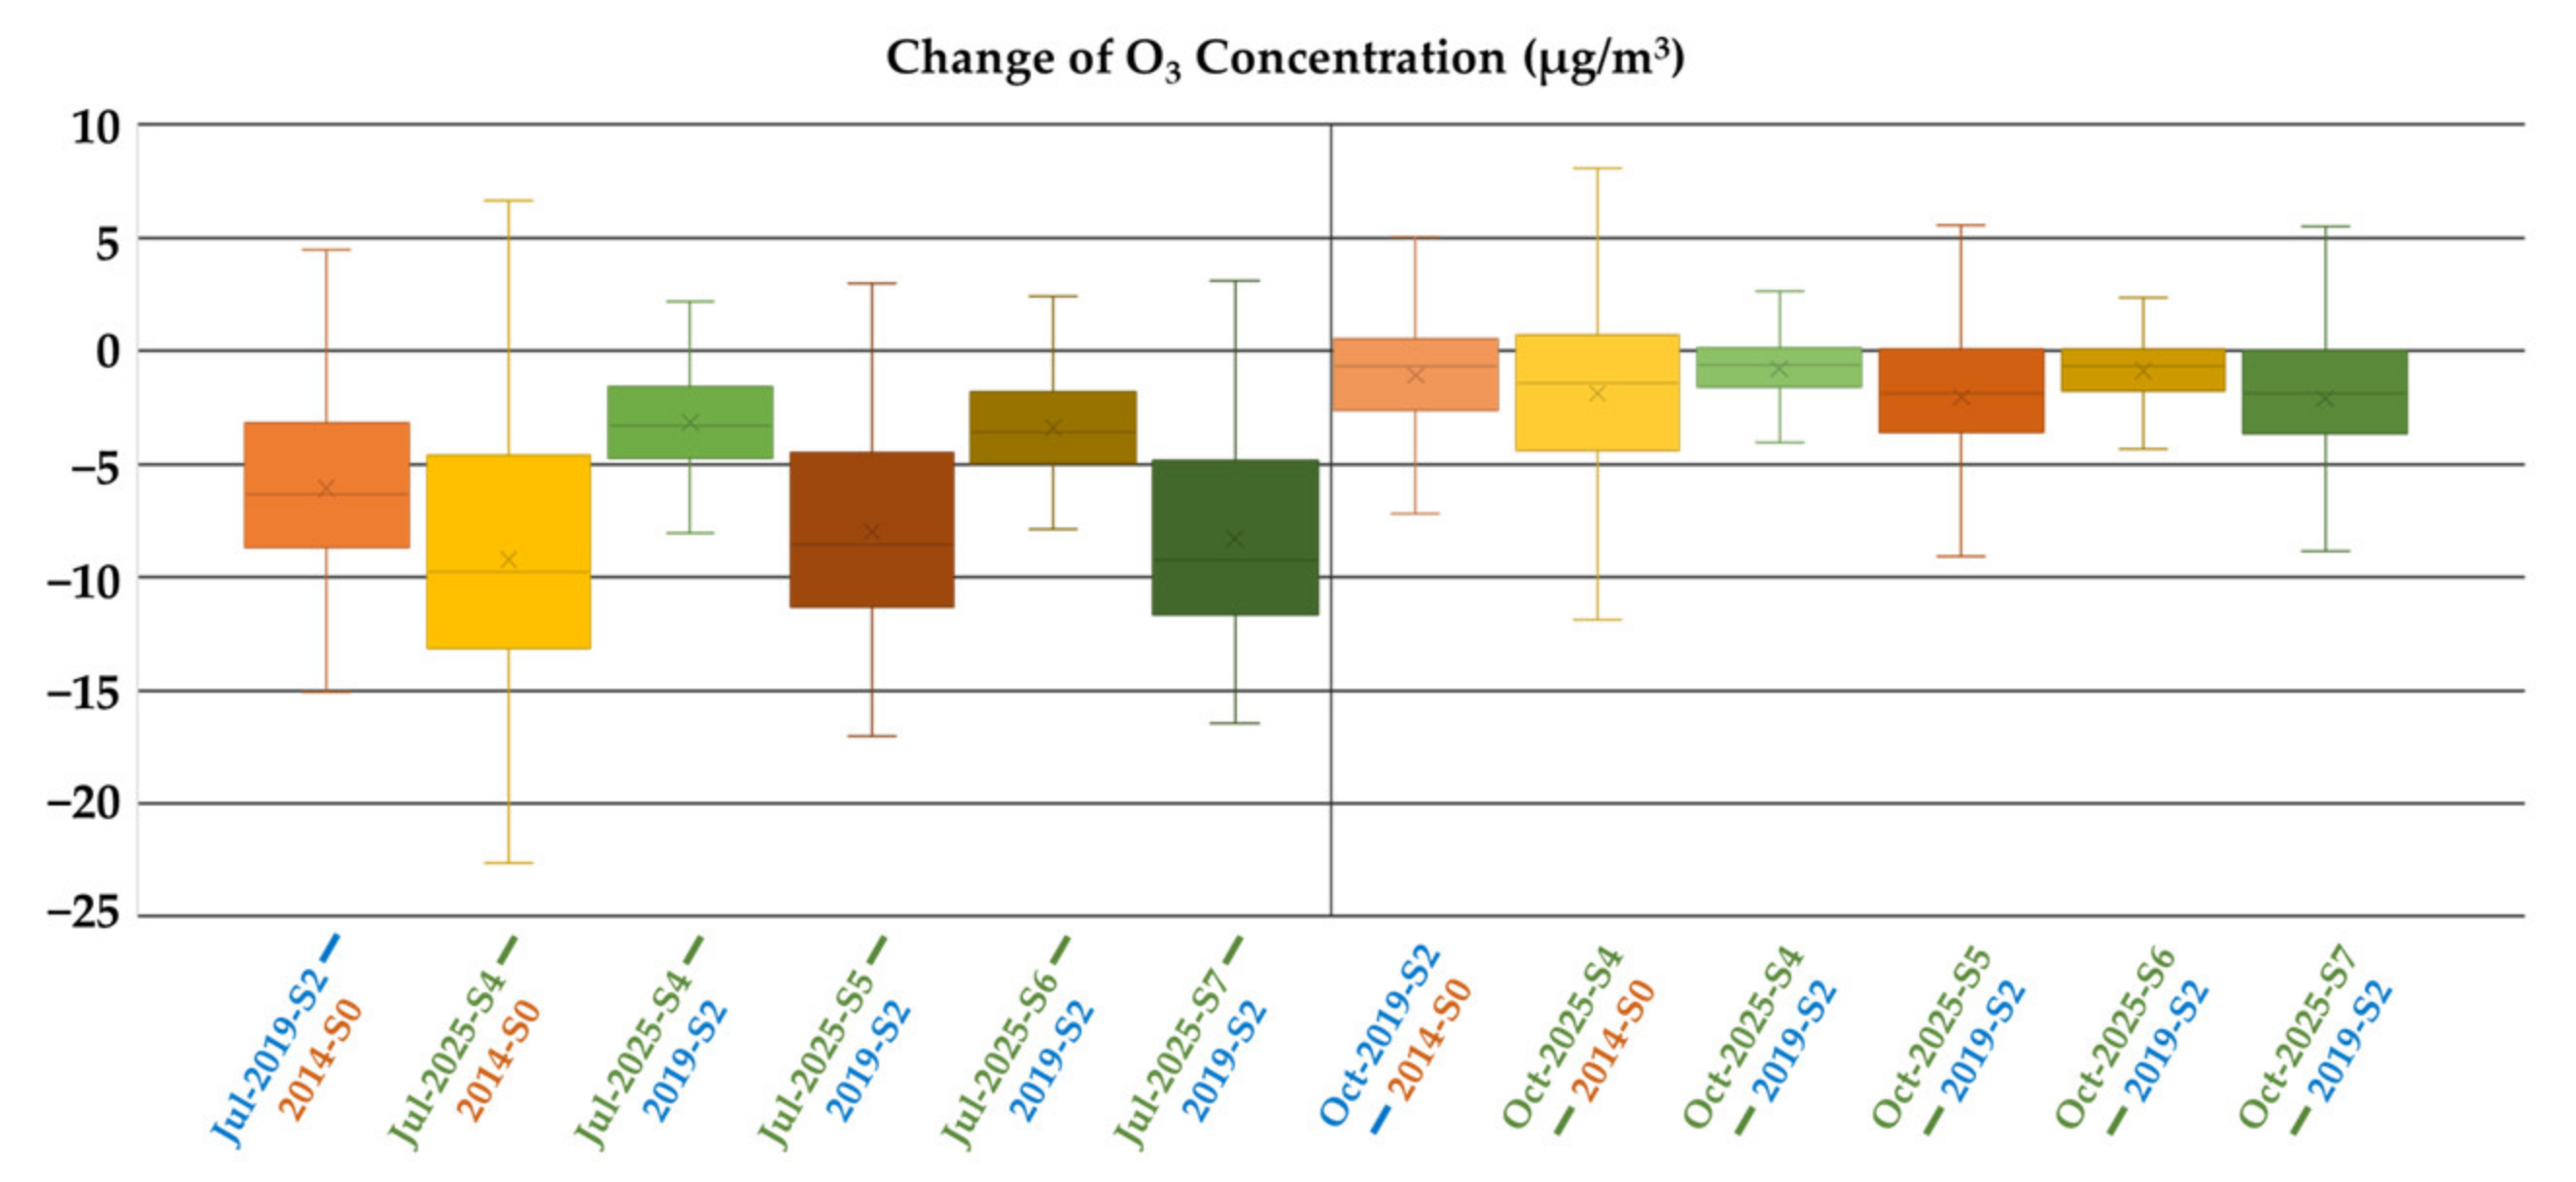
3.3. Concentrations of O3 in Each Scenario in Shenzhen

The boxplots in Figure 6 present the statistical characteristics of the simulated concentrations of O3 (µg/m3) in SZ in July and October. The boxplots in Figure 7 present the statistical characteristics of the changes in the simulated concentration of O3 (µg/m3) in each grid (i.e., the minimum position unit in the outputted maps) between six pairs of scenarios in SZ in July and October; the six pairs of boxplots can be divided into two clusters for analysis: comparisons with 2014-S0 and comparisons with 2019-S2.
Comparing the July group and the October group in Figure 6, the conditions in October are worse than those in July (i.e., much higher concentrations), but all of them are far below WHO’s IT-1 for the daily maximum 8 h mean of O3 (160 µg/m3). These simulated differences are consistent with the actual conditions reported by public bodies (mentioned in Section 2.1.1). Because emissions of air pollutants are generally intended to be continually reduced, the simulated concentrations of O3 are also expected to improve. However, a clear trend of improvement can be observed only in July; in general, differences between scenarios in Shenzhen in October are not clear. Considering the ground air passing through Shenzhen in October (mentioned in Section 2.1.2), this may be related to the adverse weather conditions. According to a study on the contribution of vegetation to VOCs [80], the levels of O3 concentration shown in the 2025-S7 boxplots may be mainly caused by background sources.
Focusing on the boxplots related to 2025-S5, 2025-S6, and 2025-S7 in Figure 6 and Figure 7, and considering the meaning of each scenario displayed in Table 6, the phenomenon was clearly simulated by the RSM-VAT: reductions in NOx and VOCs tend to be the main factors driving the changes. This phenomenon (i.e., in which the concentrations of O3 are more sensitive to NOx and VOCs emissions) has also been mentioned in other studies [81,82,83].
According to the actual conditions summarized in Table 1, the concentrations of O3 increased in the period of 2014–2019; in contrast, however, the simulated conditions from 2014-S0 to 2019-S2 in Figure 6 and Figure 7 present reductions. Therefore, the actual reduction in PM2.5 and SO2 emissions (more strongly related to PM2.5 concentrations) may have been implemented well; however, the actual NOx and VOCs emissions (more strongly related to O3 concentrations) were not reduced as much as expected in the scenarios after 2014, or were not reduced/controlled well in specific periods, which may be the cause of the frequent appearance of high O3 concentrations. Considering the findings of Lin, C.X. et al. [38] (i.e., that the contributions from background sources and neighboring cities are significant), the reduction in actual NOx and VOCs emissions may also have not been implemented well in the surrounding area in the simulation, i.e., the reduction ratio of “OTHER” shown in Table 5 was probably not achieved in reality.

3.4. Analysis of the Implementation of Policies

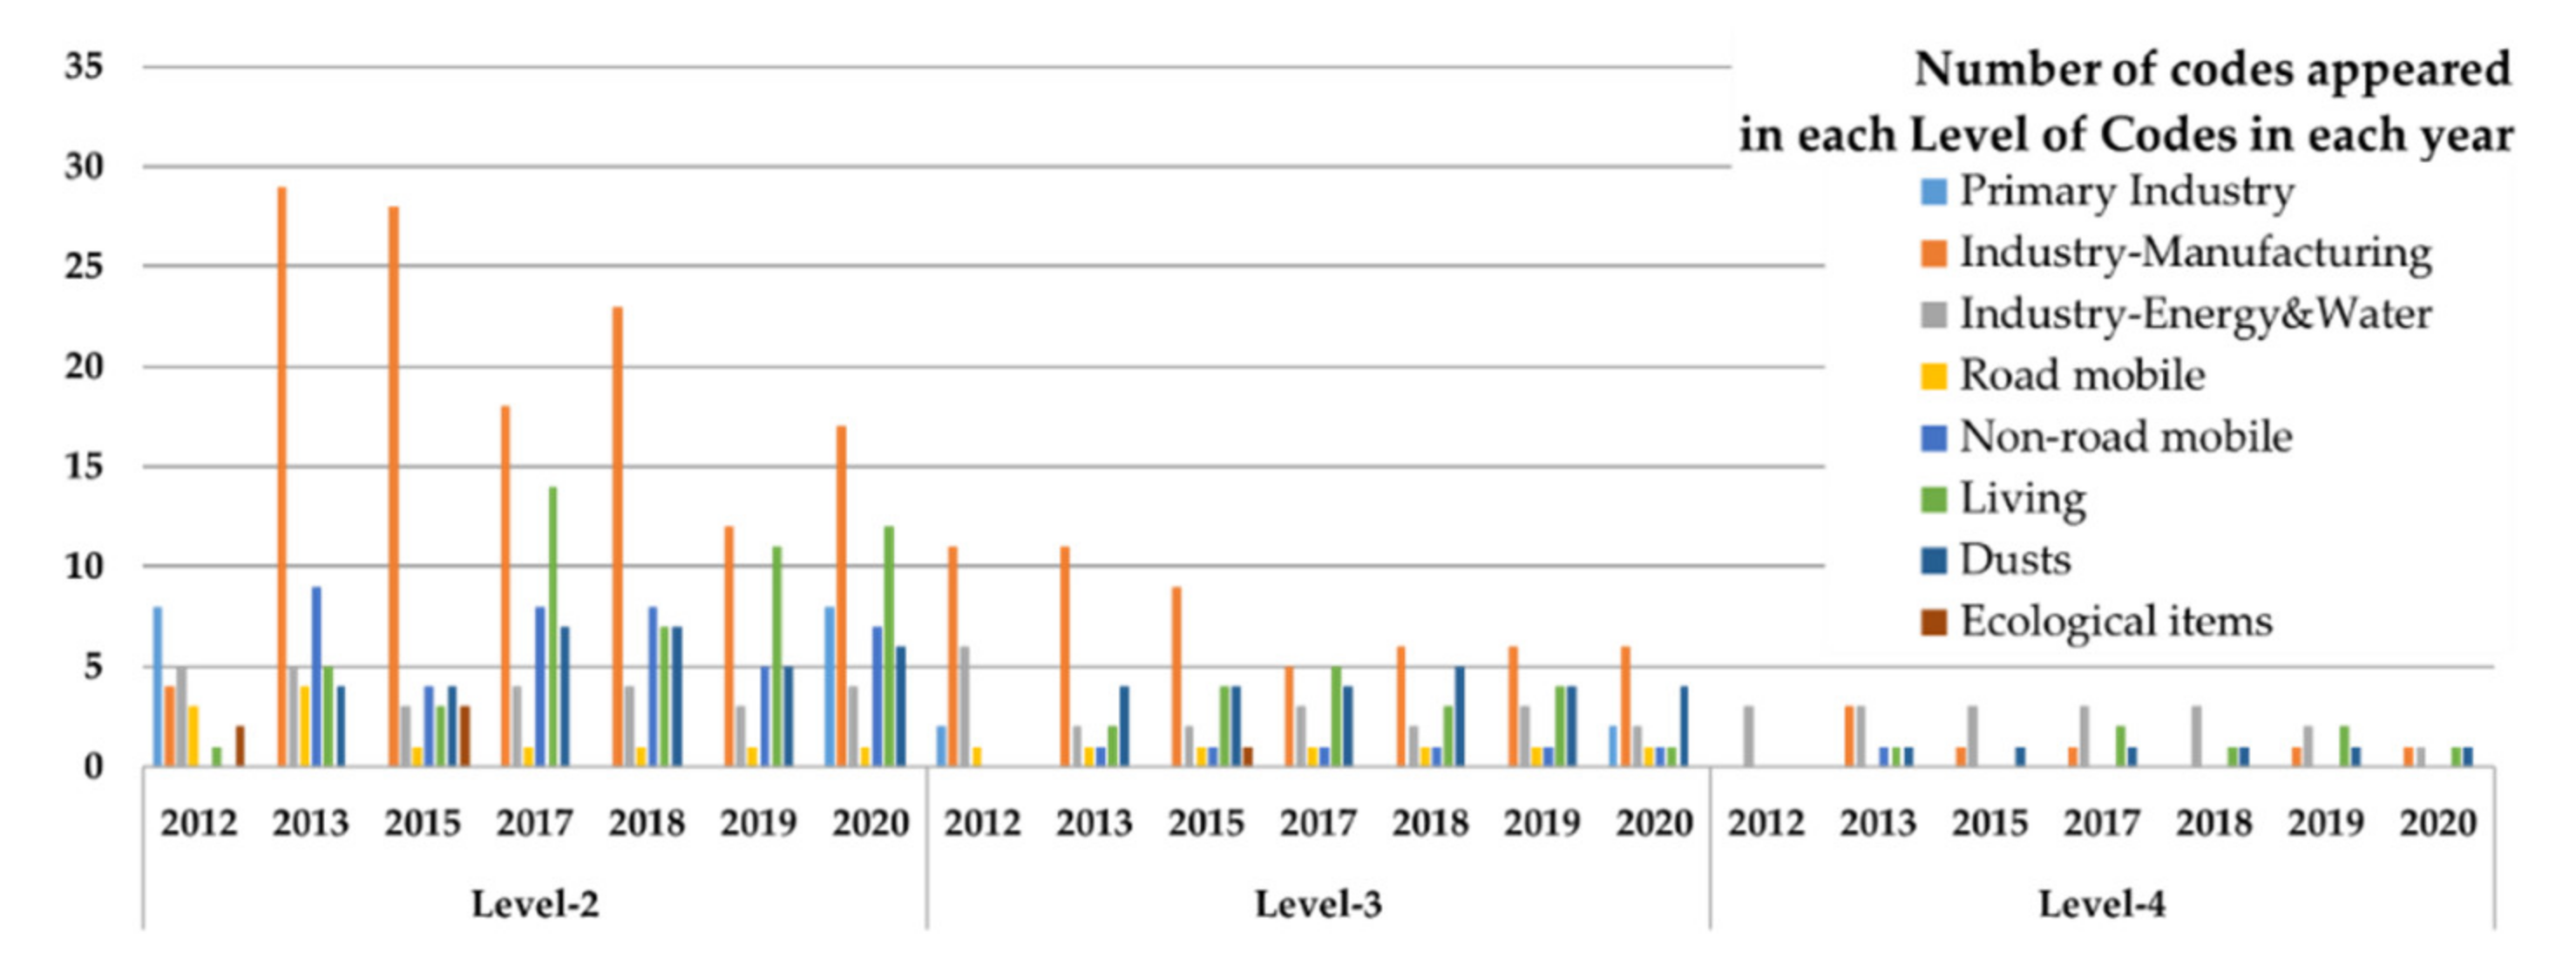
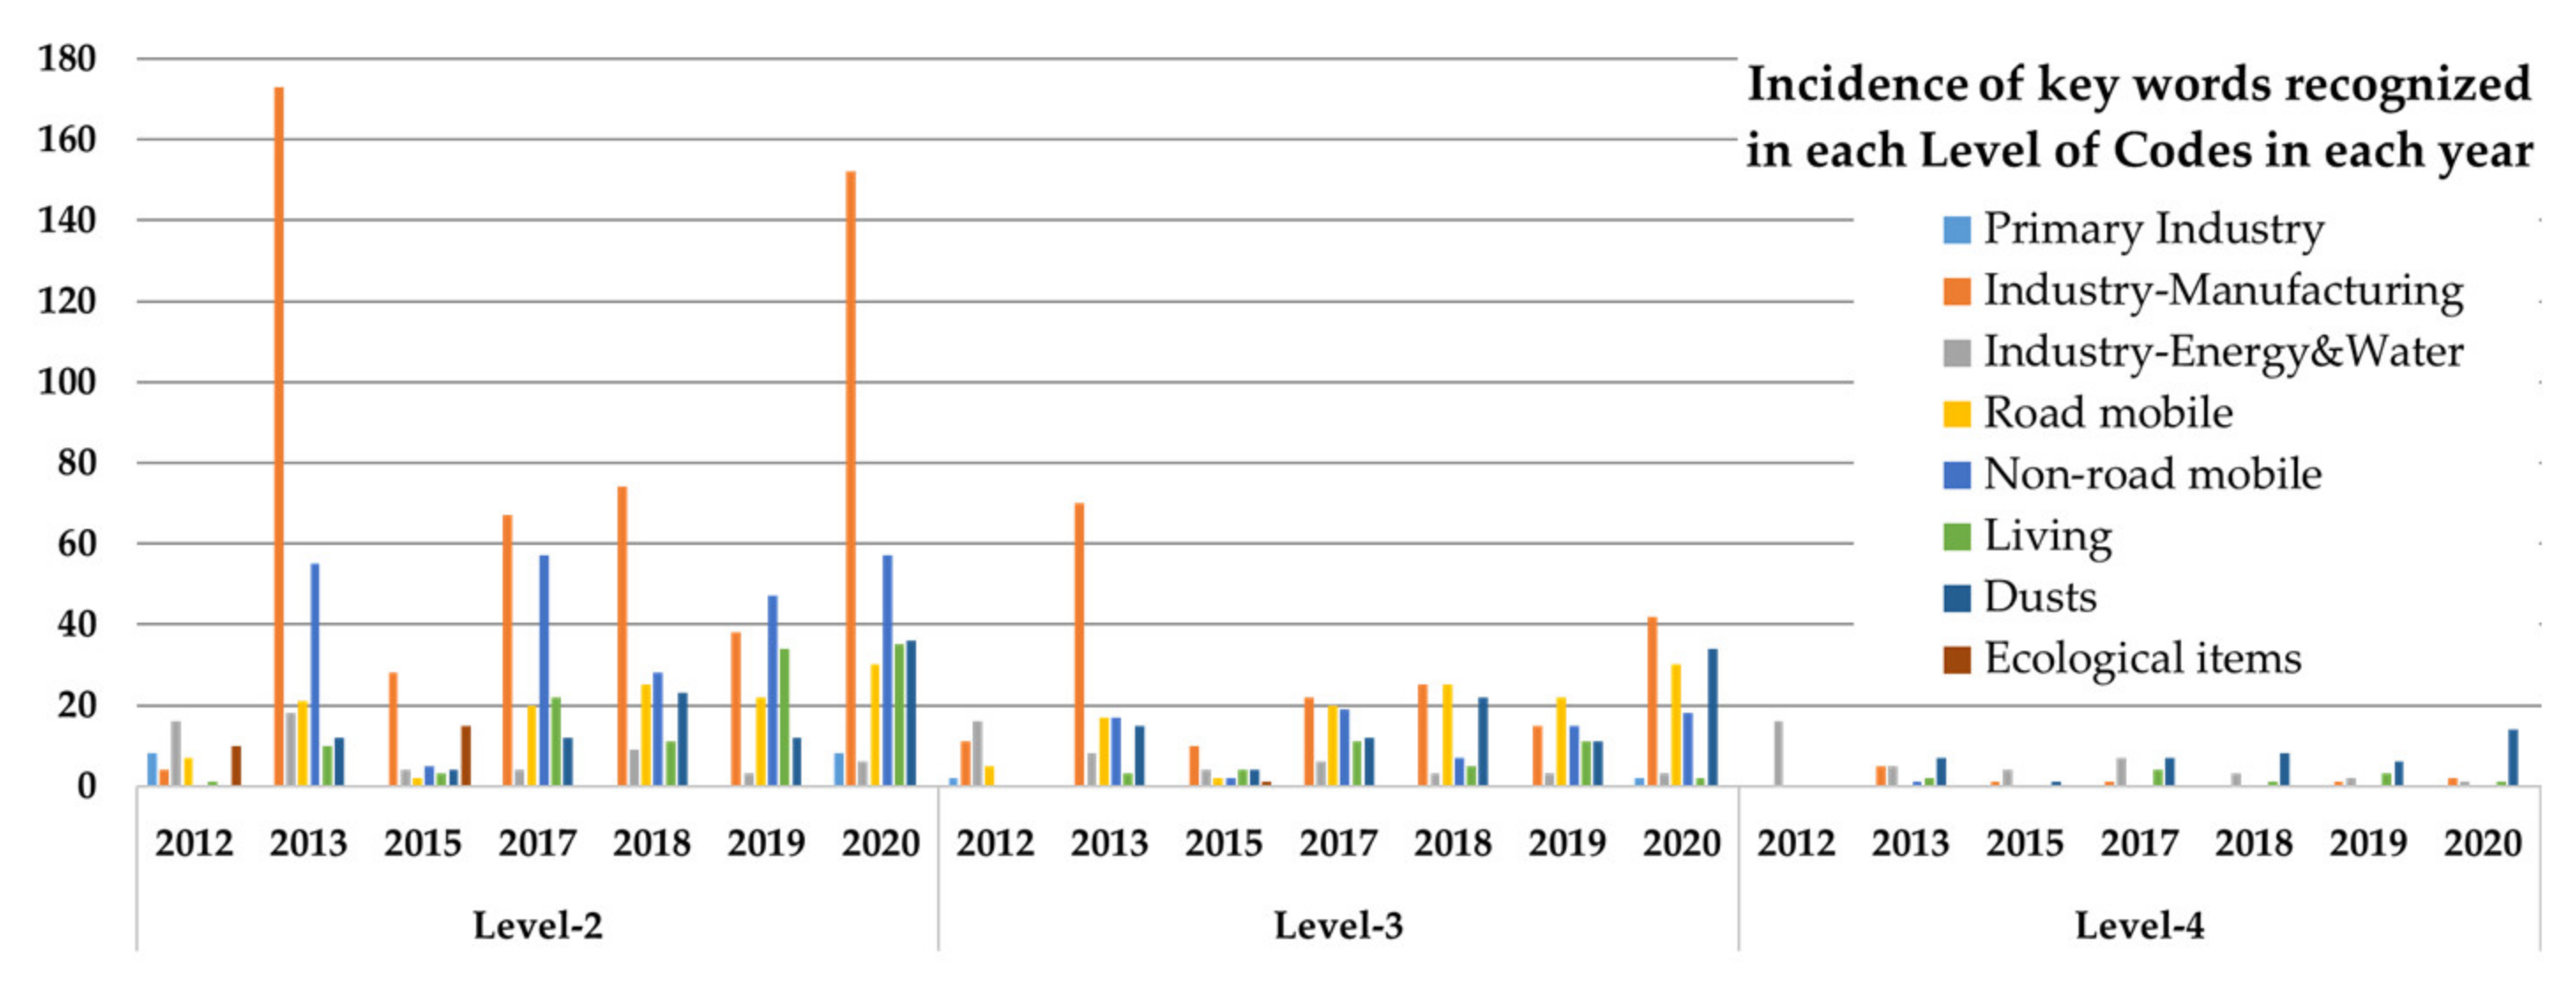
3.4.1. Statistical Analysis of Policy Contents Based on Truth Table

The count of each label (i.e., the leveled codes introduced in Table 3) in a given year’s policies was obtained in a truth table, according to the eight sectors mentioned in Section 2.2.4, and this truth table is presented in Table S1. Figure 8 and Figure 9 show results based on Table S1. “Number of codes” in Figure 8 signifies how many leveled codes were considered in policy documents in each year, whereas “Incidence of key words” in Figure 9 represents how many contents related to a specific code were mentioned in policy documents of each year. According to Figure 8 and Figure 9, the control measures or management have involved an abundance of issues with respect to fuel/products (i.e., Level-2), combustion mode/processing technology (i.e., Level-3), and terminal control technology (i.e., Level-4); furthermore, comprehensive management entails continuity over the years.
Controls related to industry (energy and water) focus on the fuel type at Level-2, boilers at Level-3, and flue gas treatment at Level-4, with a particular focus on the latter. However, the improvements in industry (energy and water) appear to be in the plateau phase (decreasing trend in both Figure 8 and Figure 9), because relevant advanced measures may have already been applied, and power plants or water plants in Shenzhen cannot be relocated. However, the achieved status must be maintained.
Policy texts concerning industry (manufacturing) mainly focus on VOCs emissions related to products at Level-2, together with a small number of control items regarding factory-owned boilers at Level-3. It is worth considering that the terminal control technology (i.e., Level-4) for VOCs emissions may be a new research direction for future application. From 2015, the issues with management at each level decreased slightly (see Figure 8), but their contents increased dramatically (e.g., see incidence of key words as recognized in Figure 9 for 2015, 2017, 2018, 2019, and 2020 at Level-2). The decrease is mainly because the products being considered in this sector of policy texts (e.g., fuel consumed by the (non-)road mobile sector labeled as 19##, 20##, 21##, etc. in Level-2) have been almost narrowed to organic solvent products (e.g., coatings and inks). The trend of increase shown in Figure 9 presents more detailed considerations of diverse industrial products in Shenzhen, in addition to identifying more types (e.g., concentrations of organic solvents for the dry-cleaning industry in recent years).
The consideration of living in the policy analysis involves not only the simple energy consumption and cooking involved in daily life, but also the painting/coating demanded in municipal engineering, construction projects, and oil storage and transportation (e.g., drawing traffic lines, building façade coatings, adhesive substances, and gas station management), and this involvement of living issues is different from that presented in Section 3.1, which refers only to energy consumption. Therefore, the continuity and trends in the number of codes and the incidence of keywords related to living are similar to those in industry (manufacturing) at Level-2. Moreover, the 1900 at Level-3 (open burning) and 0500 at Level-4 (cooking fume purifier) are the objects managed in the policies related to living issues. The domestic utilization of natural gas is at the encouraged level for both cooking and bathing in Shenzhen.
Policy texts regarding the road mobile sector are mostly confined to only two codes: 19## at Level-2 (road mobile sources) and 18## at Level-3 (national exhaust emissions standards). According to Figure 8, up to four codes at Level-2 involving fuel types were the focus of management during the early stage, because the elimination of old motor vehicles, improvement of gasoline and diesel oil quality, and installation of exhaust absorbers were major priorities. Since 2017, the policies have mainly focused on the increase in the number of new energy vehicles, together with the construction of charging facilities, and also demand the simultaneous implementation of the latest national exhaust emissions standards. Therefore, although the number of codes remains unchanged in Figure 8, diverse implementation of these contents has resulted in a growing trend of the incidence of keywords recognized in each code (see Figure 9). It should be noted that an explicit policy objective pertaining to a limit on the total number of fuel vehicles has not yet been directly mentioned in current policy texts implemented by agencies concerned with environmental protection. However, in the policy brief released in 2012 (see Table 7), “to increase the travel rate of public transport, and to construct slow travel system” indirectly reflects the control of “the total number of motor vehicles”.
Polices concerning the non-road mobile sector devote attention to many more topics at Level-2 (see Figure 8). At Level-3, 18## (national exhaust emissions standards) is the only relevant code, whereas 04## at Level-4 appeared only once (in 2013), pertaining to the management of oil and gas storage for port ships. Due to the diversity of topics at Level-2, the analysis of Figure 9 must be compared with Table S1. The codes 20## (construction machinery), 22## (general machinery), and 24## (boats and ships) at Level-2 present time-continuous features. The number of mentions of boats and ships reached a relatively high value by 2013. This is largely because considerably more detailed regulations (e.g., fuel quality, channel types, shore power, research, and financial support) were released in document T-13 (see Table 7) compared with polices relating to the same issues in other documents; furthermore, shipping is an important economic activity not only in Shenzhen, but also in the region around the Pearl River Estuary. Codes 21## (agricultural machinery), 25## (railway diesel locomotive), and 26## (civil aircraft) have not received such a continuous focus. In addition, the references to 26## in T-17–20, T-18, and T-20 in Table S1 concern controls on motor vehicles in airports, rather than direct controls on aircraft.
As shown in Figure 8, the management of dust sources was a point of continuous focus, with a variety of relevant codes (see Table S1), since 2013. Because dust is not considered to be a source of carbon emissions, the concept does not appear in documents from 2012. According to Figure 9, keywords pertaining to dust appear more frequently with time, with their peak reached in 2020. According to the Technical Manual, all dust sources have been considered and controlled in Shenzhen, particularly dust from construction projects. Therefore, strict management and control of dust sources have been implemented.
In the sector of ecology, improvement of the ecological environment (i.e., 38##, 42##, and 43## at Level-2, and 20## at Level-3) was mentioned in both 2012 and 2015, which may have had an indirect impact on dust emissions. However, since 2017, this sector was not clearly mentioned, because green spaces have been relatively well protected in Shenzhen, and the related duties may have begun to change during the process of adjustment of departments and institutions of the State Council in 2018 [84].
Consideration of primary industries was only recognized in 2012 and 2020 in a few codes; this is mainly due to the small scale of primary economy and production in Shenzhen.
A number of issues have been overlooked in policymaking: specifically, polices pertaining to the extraction of petroleum and natural gas (related to 02##, 03##, 04##, 0500, and 06## at Level-2; 03## and 17## at Level-3; and 01##, 02##, 03##, and 04## at Level-4), manufacture of non-metallic mineral products (related to 10## at Level-2, 23## at Level-3, and 06## at Level-4), and aircraft (2600 at Level-2 directly, and possibly 18## at Level-3). However, at present there are significant economic challenges, e.g., in limiting the extraction of petroleum and natural gas and the use of aircraft. The manufacture of non-metallic mineral products (e.g., cement factories) can be expected to decrease alongside construction projects.

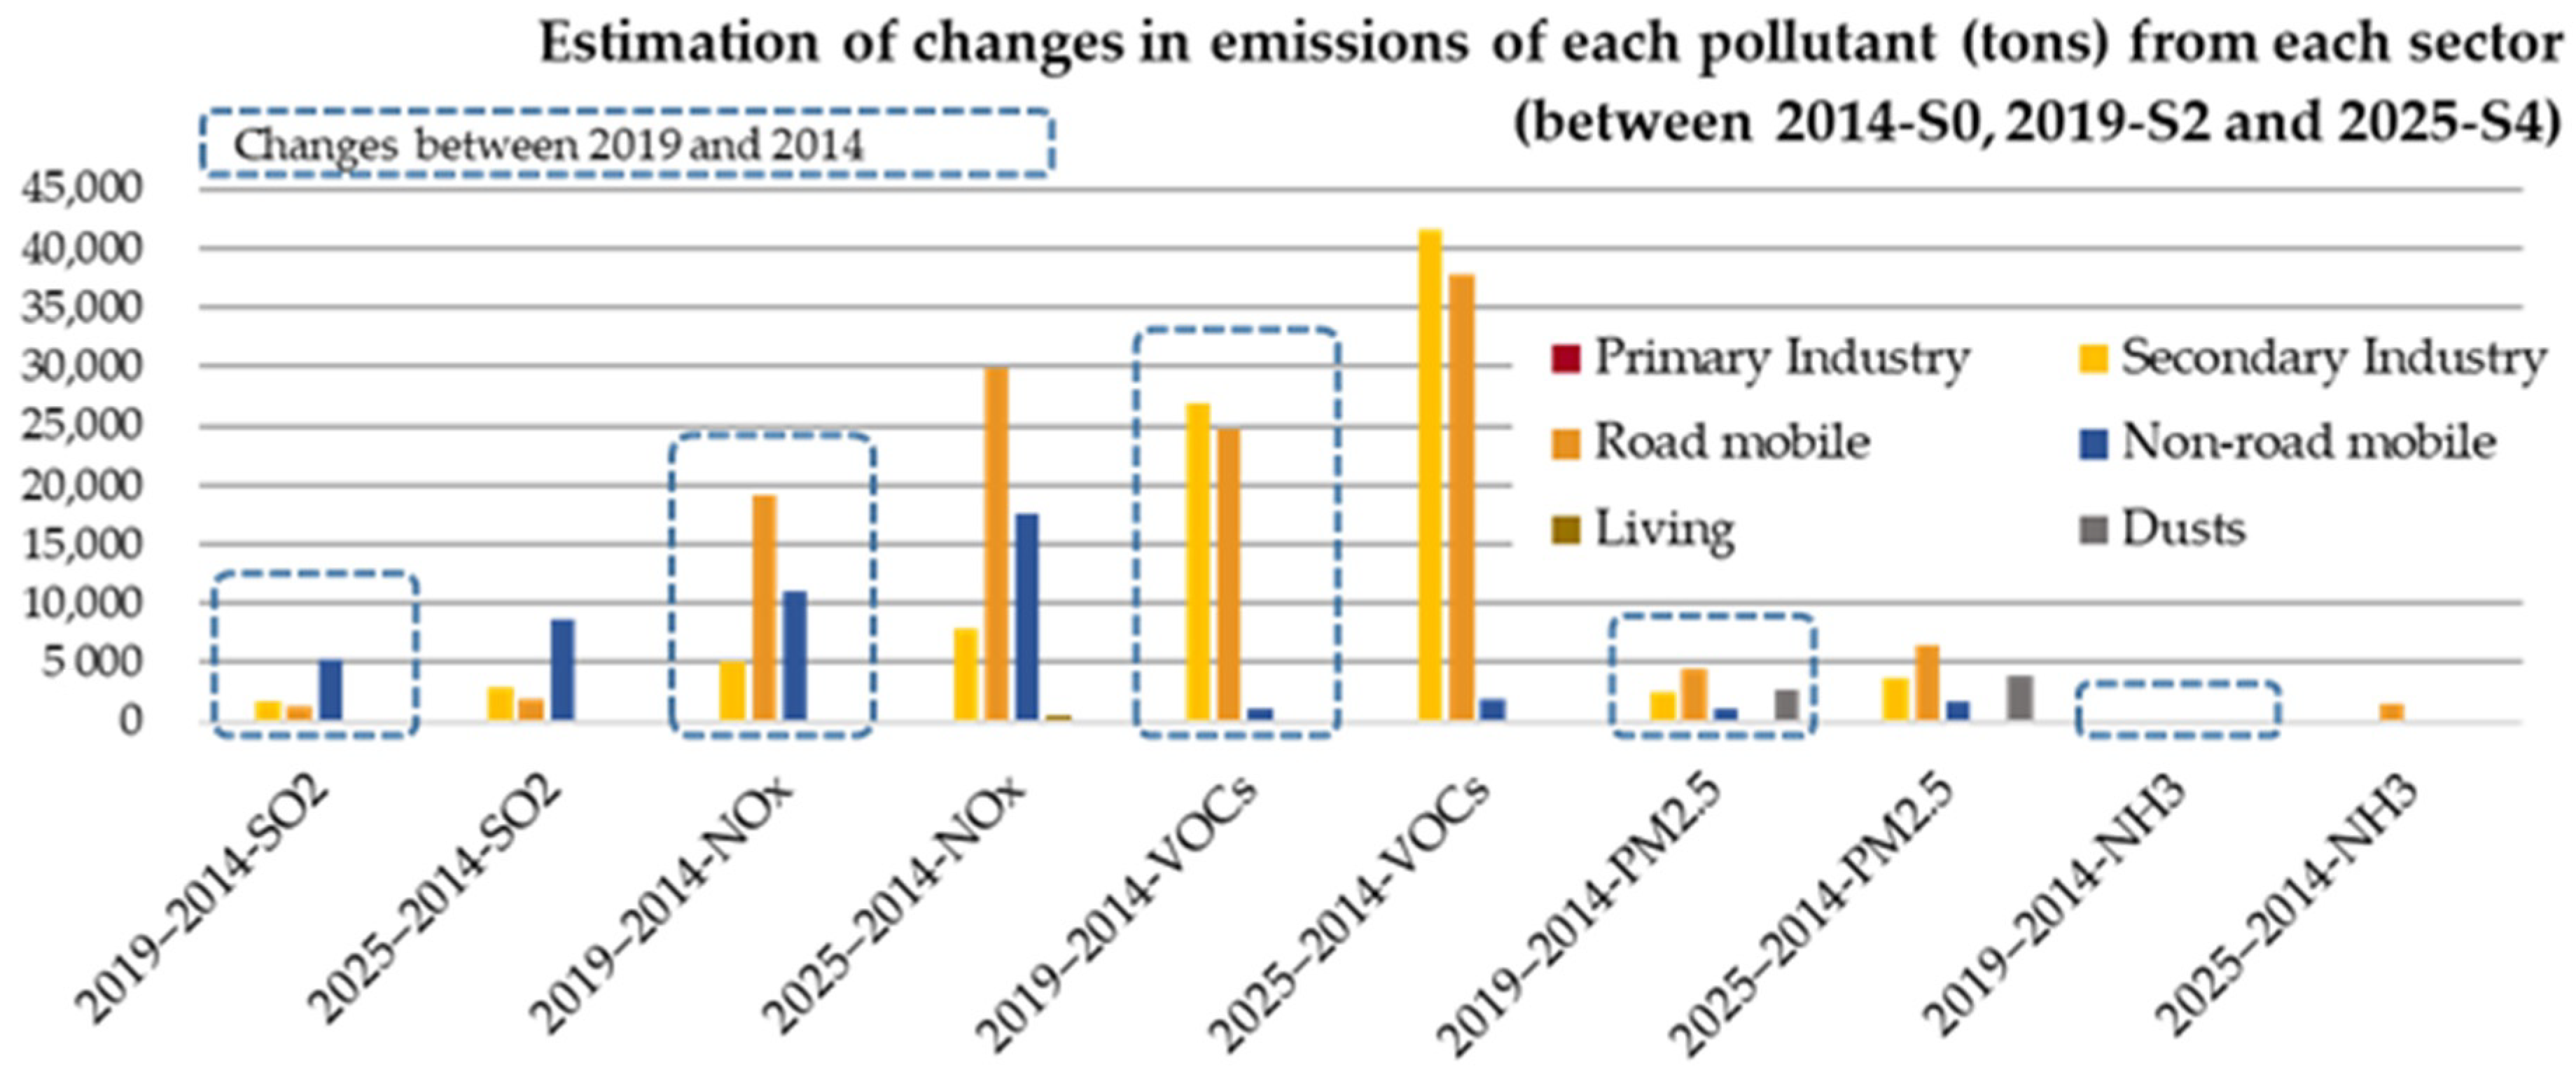
3.4.2. Possibility of Emissions Reductions as a Result of Management and Controls

Compared with 2014, Figure 10 presents the estimated reduction expected in 2019 and 2025, as calculated according to Table 5 (i.e., reduction ratios of 2019-S2 and 2025-S4 for SZ) and Figure 4 (i.e., total emissions in 2014); that is, according to the simulations, the total emissions of each air pollutant as presented in Figure 10 for 2019 and 2025 are the targets necessary to reproduce/achieve the desired air quality for those years. It should be noted that if the required reduction for 2019 cannot be achieved, the reduction goals for 2025 in Shenzhen would be difficult to be met in practice. This evaluation can identify the challenges within Shenzhen that must be confronted in order to ensure the reduction in emissions, although similar reductions in OTHER are also necessary.
The changes in the economic and social activities related to energy consumption in Shenzhen are summarized in Table 9, in addition to predictions of the trends of such changes through to 2025. Each activity is also clustered into the most relevant sector. The quantifications in Table 9 for 2014–2019 were used to judge whether the required reduction in emissions was achieved, whereas the predictions through to 2025 were applied to identify the obstacles to reducing emissions.
Due to the diverse emission features, the emission factors of vehicles are addressed in Appendix F-3 in the Technical Manual. According to the national exhaust emissions standards, factors pertaining to gasoline, large passenger cars, medium trucks, and heavy-duty trucks are characterized by high emissions of NOx and VOCs. Regarding diesel oil, emissions of NOx, SO2, and PM2.5 are generally higher than those from gasoline (especially NOx), but the emissions of VOCs and NH3 are generally lower. The highest emissions of NOx are from large passenger cars powered by diesel oil. Medium passenger cars powered by diesel oil can emit significantly more VOCs, and their emissions of SO2 and NH3 are also as high as those from larger passenger cars, medium trucks, and heavy-duty trucks.
Reduction in SO2 emissions: As shown in Figure 10, three sectors contribute as the main SO2 emission sources, of which non-road mobile is the most important sector. According to Table 9, the total number of civil transport vessels increased by 7.9% from 2014 to 2019, whereas the ratio of berths with shore power increased by 72.7%; furthermore, the oil quality of boats and ships improved significantly. Therefore, policies pertaining to non-road mobile can be considered to have achieved the reduction for 2014–2019 with respect to boats and ships. Coal consumption in power generation was reduced by 20.1%, and the factory-owned boilers were reduced in number or replaced with gas-fired boilers. Therefore, policies related to secondary industries can also be considered to have achieved the required reduction. Although the total number of oil-fired motor vehicles remained almost unchanged, the reduction in the number of diesel-oil vehicles and oil-fired large passenger cars (i.e., 100% bus electrification in 2017 [85])—both of which have high SO2 emissions—was well implemented. Thus, the policies pertaining to the road mobile sector should also be considered to have achieved the desired reduction. Because there remains a high possibility of further reduction in the sectors of non-road and road mobile (e.g., reduction in the number of oil-fired trucks), the target reduction in SO2 emissions by 2025 may be achievable.
Reduction in NOx emissions: The reduction in emissions from road mobile appears to be the greatest, and partial reduction should be similar to the reduction analyzed in Reduction in SO2 emissions. However, based on the actual data for oil-fired motor vehicles (i.e., stable total numbers since 2015, as shown in Table 9) under the polices implemented until 2020, the reduction presented in Figure may might be difficult to achieve for 2014–2019, and for 2021–2025, if the control strength remains similar. Based on the same analysis used in Reduction in SO2 emissions, the actual reduction in emissions from the non-road mobile sector may be achieved under the current control scheme, and for 2021–2025. The reduction in emissions from secondary industries should have been achieved by the proper implementation of 17## at Level-3 and 02## at Level-4 shown in Table 3; therefore, the reduction for 2014–2019 should have already been completed; however, due to the updating of most of the boilers in Shenzhen, the reduction expected in 2021–2025 may be covered by the other two sectors, or by increased electrification.
Reduction in VOCs emissions: According to Table 9 (based on the decrease in industrial fossil fuel consumption), and the analysis in Section 3.4.1, the scale of partial secondary industry followed a decreasing trend, and the utilization of organic solvents was strictly controlled in the production process; therefore, the reduction in emissions from secondary industries should have been completed for 2014–2019, and a further decrease should be possible for 2021–2025, with the potential to even surpass those targets with the better use of terminal control technologies in the production process (and during the utilization). Based on the analysis of the road mobile sector in Reduction in NOx emissions, the desired reduction in emissions from this sector may also be difficult to achieve, because gasoline-powered vehicles with relatively high VOCs emissions make up the majority of the unchanged total number of oil-fired vehicles [85]. A relatively small reduction in emissions from the non-road mobile sector should have been achieved, and can be completed in the future.
Reduction in PM2.5 emissions: As shown in Figure 10, the road mobile sector would appear to have contributed to the greatest reduction in emissions; this may be a result of similar reasons to those outlined above: reduction in the number of diesel-oil vehicles and 100% bus electrification, together with strict management to equip diesel particulate filters (DPFs). DPFs are also an important reason for the reduction in emissions by the non-road mobile sector. Secondary industries should have reduced their emissions through the effective implementation of 03## at Level-4 in 2014–2019, as shown in Table 3; however, the potential for further decrease may be weak in 2021–2025. Reduction in emissions from dust are certain, because the main sources from construction projects, roads, and storage yards have been continuously controlled since 2013, with a large number of terminal control methods in relation to 06## at Level-4, as shown in Table 3. Because the amount of construction may still decrease in the future (see Table 9), this reduction is expected to continue through 2021–2025. Because the total emissions of PM2.5 were maintained at a relatively low level, the main sources of PM2.5 in the future may be background sources.
Reduction in NH3 emissions: Because NH3 emissions are significantly lower than those of the other four studied air pollutants, and their main source is from the road mobile sector, there was not an obvious reduction in their levels for 2014–2019. Due to the relatively stable status of primary industries (see Table 9), the expected reduction in 2021–2025 (see Figure 10) should be mainly from the road mobile sector. Therefore, the challenge is similar to that faced in the reduction in VOCs emissions, wherein the decrease in the total number of gasoline-powered vehicles is the key solution.

4. Discussion

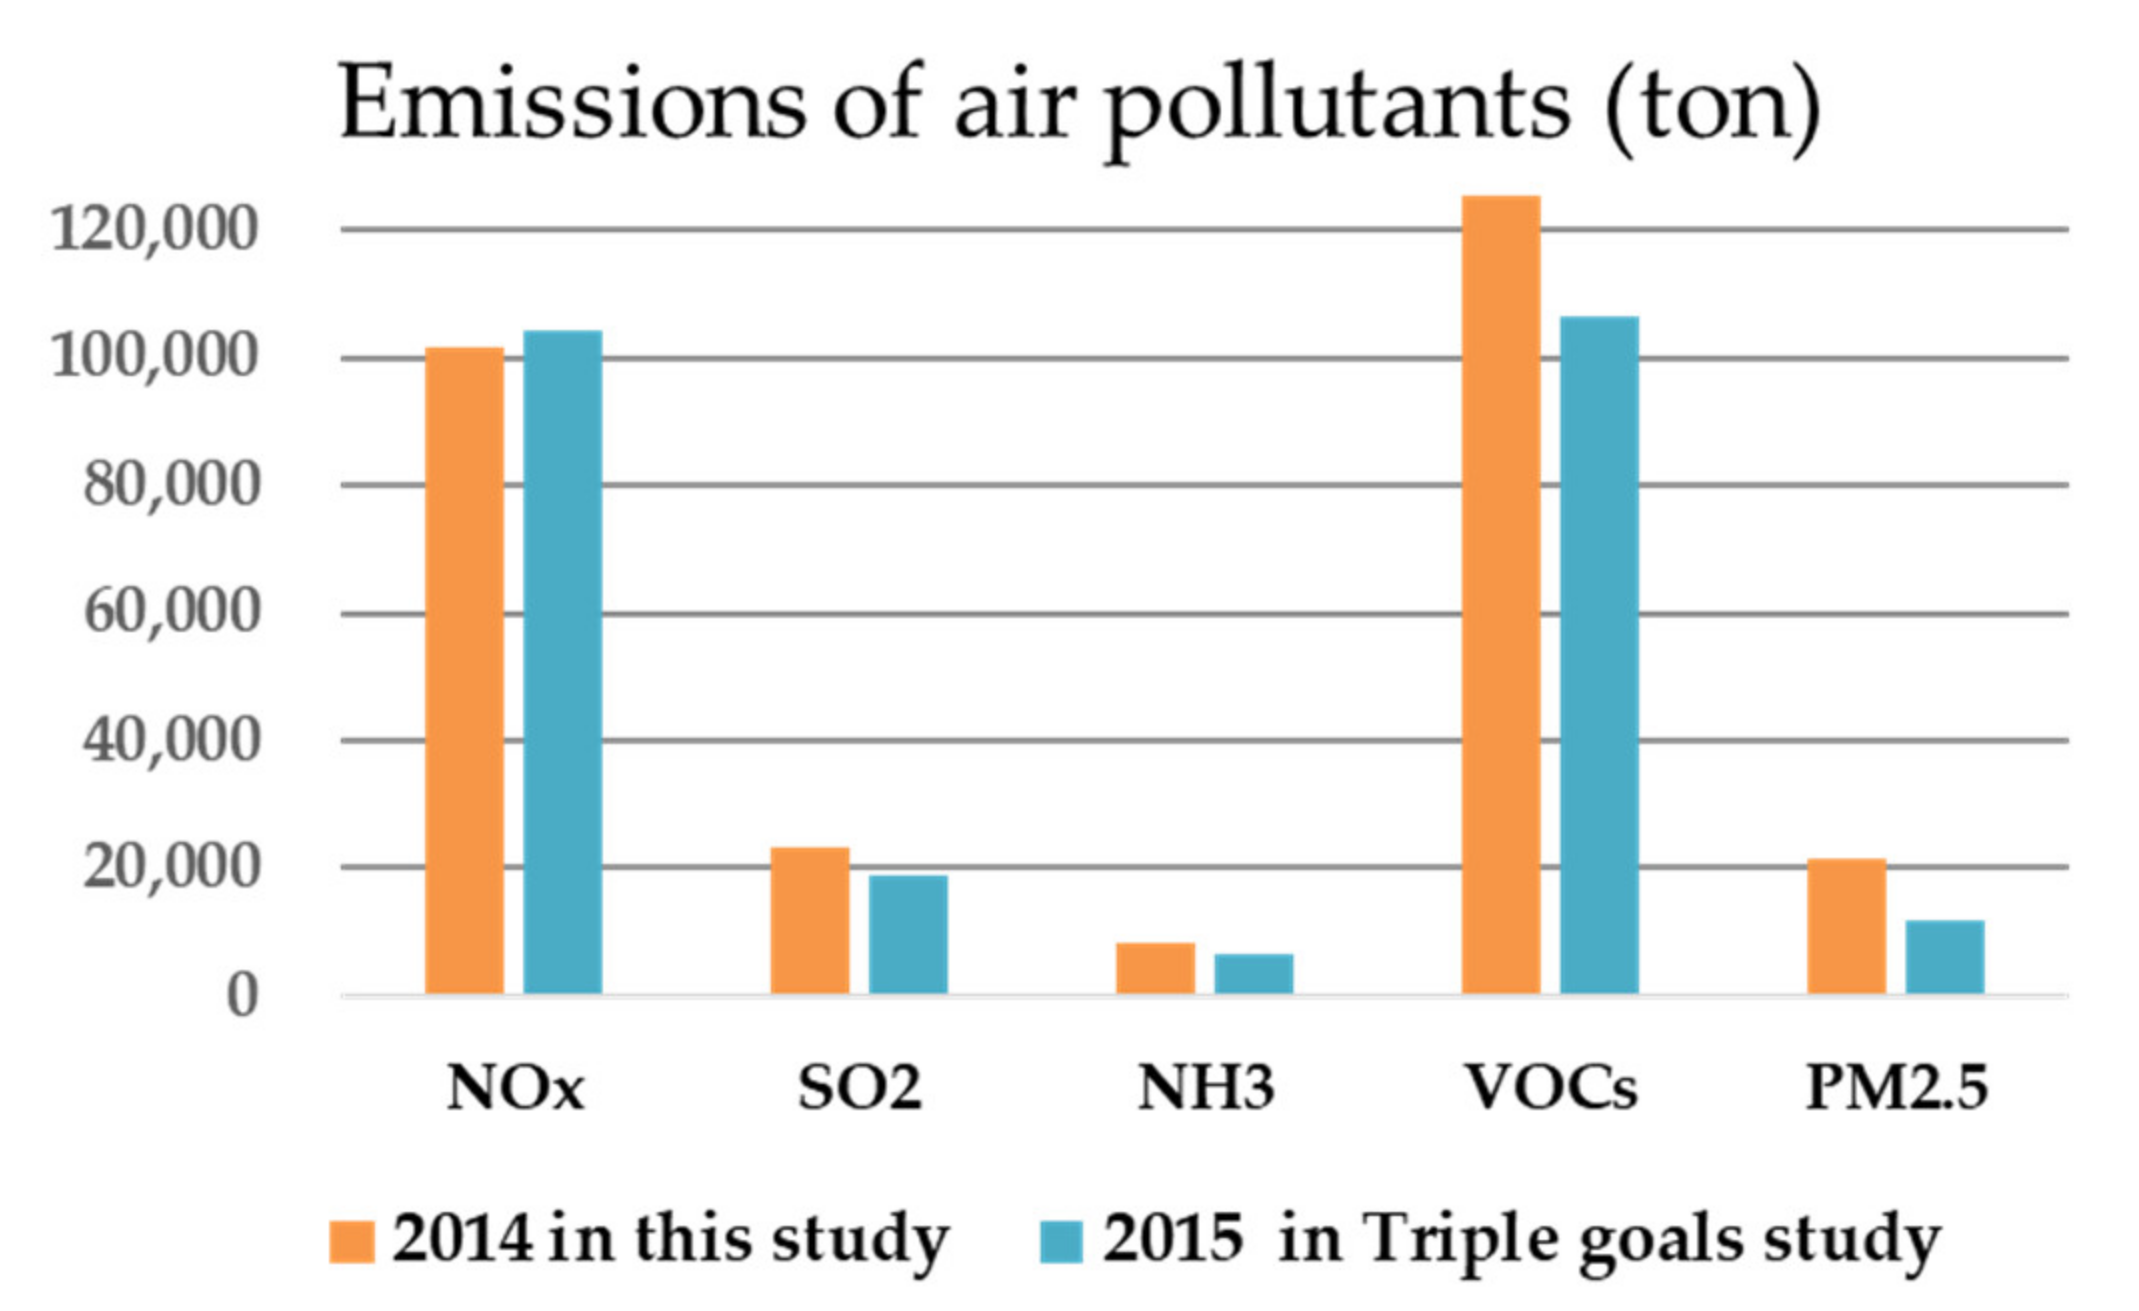
4.1. Comparison of Emissions with the Triple Goals Study

As shown in Figure 11, the emissions estimated in this study are close to the amounts reported in the Triple Goals Study, with the exception of the considerably higher PM2.5 emissions (if these emissions were included, the higher sensitivity of the concentration of PM2.5 to the PM2.5 emissions would be as assumed in Section 3.2). Therefore, it can be further asserted that the emissions of SO2 and PM2.5 in Shenzhen have been greatly reduced in reality, but emissions of NOx and VOCs remain high, posing a significant problem in the prevention and control of O3 pollution.

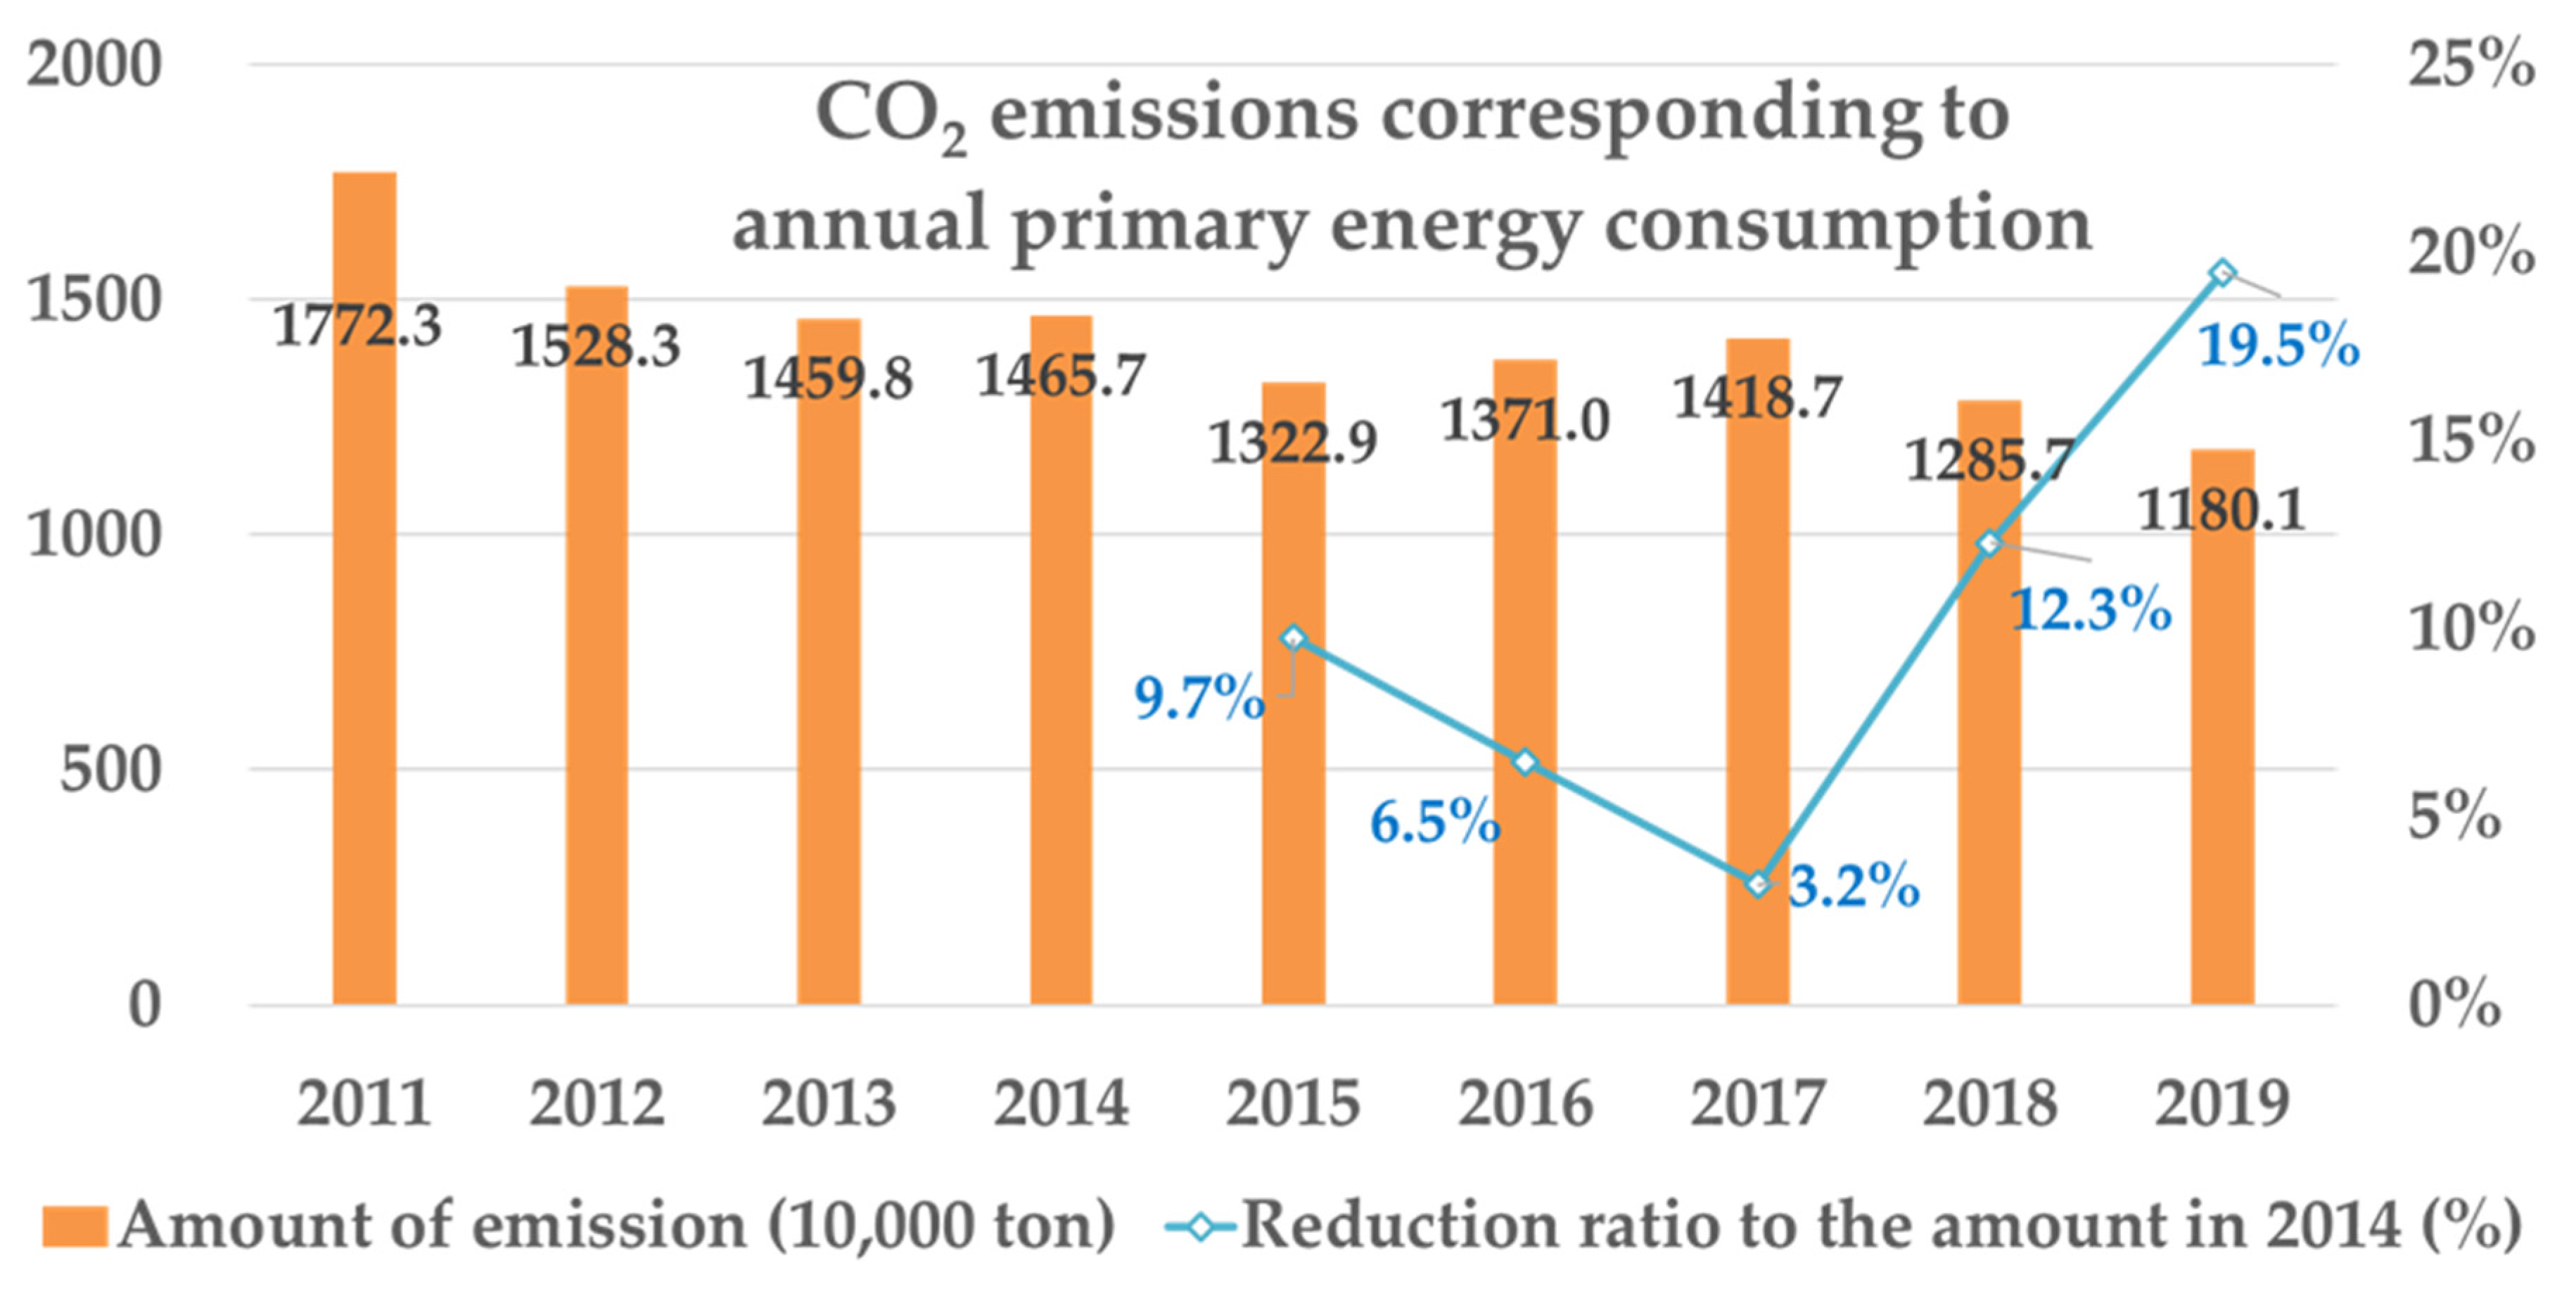
4.2. Trend of CO2 Emissions in the Industrial Sector

Table 10 shows the results of the Triple Goals Study, by which the values in Figure 4 were also calibrated. In general, comparing Table 10 with Figure 4, reduction in CO2 emissions can be implemented synergistically with the reduction in air pollutant emissions. More specifically, road mobile is the sector with the highest synergistic control potential in Shenzhen, offering potential reductions in emissions of CO2, NOx, VOCs, PM2.5, and NH3. A significant reduction in emissions of CO2 and SO2 could also be synergistically implemented in the non-road mobile sector. The reduction in emissions of SO2, NOx, VOCs, and PM2.5 by secondary industries also displays apparent synergistic results in the reduction in CO2 emissions for 2014–2019.
Figure 12 presents calculations of direct CO2 emissions from secondary industries based on the consumption of primary energy. Compared with the base year of 2014, the CO2 emissions decrease continuously, with some fluctuations. The peak in CO2 emissions from secondary industries may have occurred prior to 2011 due to industrial restructuring, as suggested by the stable decrease in the proportion of GDP contributed by secondary industries from 2016 to 2020 in Section 2.1.1.
Considering the data on the consumption of energy by sector as detailed in yearbooks [31], the main sources of CO2 emissions are the consumption of coal (e.g., ~70% in 2018) and natural gas (e.g., ~24% in 2018), which are the major fuel sources for “production and distribution of electricity, heat, and gas” in Shenzhen. Because (1) coal-fired power generation equipment provides a guaranteed power supply for both SZ and OTHER, and (2) natural gas is strongly advocated in Shenzhen, not only for the production of electricity, but also for daily use by residents, the potential reduction in direct CO2 emissions from secondary industries may be limited in the future, with the exception that carbon capture and storage can be applied in practice. However, the reduction in emissions of air pollutants from this sector may be limited in 2021–2025.

4.3. Policies in 2021–2025

In general, the formulation of policy is tending towards maturity; however, the objects of the management and control measures are still systematically weak. Hence, the contents in the emission inventory (e.g., Table 3) should be applied as a checklist; furthermore, the sources of CO2 emissions should be combined within the policy formulation, due to their similar emission activities. Thereby, the duplication of work (e.g., onsite verification) may be avoided.
The biggest challenge is presented by the road mobile sector, due to the significant emissions of precursors of O3 (i.e., NOx and VOCs). Because the O3 conditions appear to be worse in reality, stricter policies should be implemented. In the short term, the large number of oil-fired vehicles used in Shenzhen and the surrounding region should be reduced. For instance, the limitation of vehicles by license plate number during specific periods can directly reduce the emission of precursors of O3. Furthermore, as mentioned in document T-11–20 in Table 7, a traffic system comprising operation lines, bus lines, and zero-carbon transportation (i.e., bicycles and walking) should be developed, not only in Shenzhen, but also in the surrounding region (i.e., the metropolitan area surrounding Shenzhen). Furthermore, the promotion of new energy vehicles, i.e., one aspect of electrification of the road mobile sector, should be continued. Regarding the operation process of oil-fired vehicles and oil-production storage, the policies advised above can also contribute to the synchronous reduction in CO2 emissions.
In secondary industries, manufacturing industries in Shenzhen have been encouraged to move to industrial parks that provide a centralized energy supply with a more efficient energy-consumption scheme. In the process of planning these parks, the sustainable capacity of the atmospheric environment (i.e., the level of air pollutant emissions that can be allowed) of the region should be evaluated and opened to the public for necessary supervision.
Thirdly, polices pertaining to the non-road mobile sector can be still diversified, due to the continuous development of some segments in this sector (e.g., boats and ships, aircraft). The strength of controls should be continually implemented, and the reduction in CO2 emissions can also be achieved. Effective regional cooperation between the administrative units around the Pearl River Estuary should be sufficiently clear to be fully implemented. In addition, the emissions from aircraft should be considered.
In practice, reductions in emissions are achieved via cooperation between government departments, enterprises, and individuals. Despite the precise management and controls implemented by the Ecological Environment Bureau in Shenzhen, future polices should take advantage of cooperation and collaborations between stakeholders—for instance, the cooperation between the departments of transportation and environmental protection on the limitation of motor vehicles, the supply of clean energy by energy enterprises, or the support of individuals for the banning of outdoor barbecues.

4.4. Potential and Limitations

Because the synergy of management and control of emissions of CO2 and air pollutants has become the mainstream approach to achieving a safer and better atmospheric environment, this study proposes an approach in which the reduction in emissions can be evaluated in an efficient and user-friendly manner, based on the RSM-VAT model in the ABaCAS. In terms of a comprehensive understanding of the whole cycle of policy-activity–emission–environment, the practical implications of the evaluation pattern reflect the possibility of predicting the effects of policy, based on quantitative analysis of the implemented policy, and the weakening of obstacles to interdisciplinary cooperation. Although the outputs from other numerical simulations are initially necessary, this evaluation pattern can omit the complicated recalculation procedures if the emission conditions change. Thereby, the real-time simulated air quality can be directly used as feedback for the modification of policies, and the model can be used by the policymakers or urban planners who work to modify economic and social activities.
Regarding the temporal scale, the year and month were selected for the measurement of the time span; however, in future studies, combinations with different times of day would be helpful in the identification of the impacts on O3 concentrations. The policy contents of the current study have not involved economic issues (e.g., economic evaluation of CO2 emissions [86]) or social issues (e.g., social inclusion [87]); however, these are inevitable consequences of the environmental quality, and should be considered and evaluated in a systematic approach.
Due to the lack of an emission inventory, the present study applied the RSM-VAT to analyze policy effects in the following order: (1) estimation of total emissions and verification with other studies; (2) sufficiency tests of emission reduction strength via multiple simulations of air quality with specific targets; (3) analysis of the efficiency of policies pertaining to existing economic and social activities in achieving the desired reduction; and (4) identification of the necessary optimization of policies to achieve specific air quality levels in the future. If the emission inventories for 2014 and 2019 were available, the application of the model could be simplified as follows: (1) simulations of air quality based on the reductions/increases in emissions between 2014 and 2019; (2) identification of the necessary optimization of policies to achieve specific air quality levels in the future. Therefore, the scientific, comprehensive, and timely preparation of air pollutant emission inventories can assist in and facilitate the process of efficient policymaking, in addition to providing the same influence in the control of CO2 emission reductions. Furthermore, whether the control objects are activities or emission quantities should be clarified in the policy.

5. Conclusions

This study presents a rapid and simplified pattern for the evaluation of the effects of environmental policies. The connection between environmental parameters and policy context was identified and applied via a qualitative comparative analysis. The evaluation pattern was applied to the city of Shenzhen. The whole process of the present study can be similarly applied in the context of other cities, in terms of the evaluation of the effects of environmental policies, and professional barriers can be weakened by interdisciplinary cooperation.
The main sources of VOCs emissions in 2014 appear to be from secondary industries and the road mobile sector, which are also the two sectors that contributed the most PM2.5 emissions. The main sources of NOx emissions appear to be from the road mobile sector, followed by the non-road mobile and secondary industries. The non-road mobile sector appears to have contributed the greatest SO2 emissions in 2014.
Regarding air quality, according to the simulated scenarios of the concentration of PM2.5 in 2019, reductions in the concentrations of air pollutants both within and outside SZ are necessary, and there is clearly a synchronous reduction related to PM2.5 in OTHER. Background weather conditions may be the main reason for the worse concentrations of O3 in October than in July. Reductions in NOx and VOCs emissions tend to be the main factors driving changes in O3 concentrations; however, reductions in the emissions of those two pollutants in 2014–2019 may have not been achieved as expected in practice, in either SZ or OTHER.
Analysis of policy implementation shows that controls pertaining to industry (energy and water) have focused on the fuel type; however, the efficacy of this policy appears to have plateaued. Policy pertaining to industry (manufacturing) has mainly concentrated on products’ VOCs emissions, in addition to controls on factory-owned boilers, and more detailed considerations of diverse industry products have been recognized in Shenzhen. Different measures concerning the road mobile sector have been implemented at different stages in Shenzhen—for instance, the installation of exhaust absorbers in the early stages, and the increase in the use of new energy vehicles since 2017; however, the number of fuel vehicles has not been directly limited.
In the evaluations of policy effects, the required reduction in SO2 emissions from 2014 to 2019 should have been achieved due to the contributions of policies pertaining to the non-road mobile, secondary industries, and road mobile sectors; their continued reduction in 2021–2025 may be possible. The desired reduction in NOx emissions from 2014 to 2019 has likely not been achieved due to the stable total number of fuel vehicles since 2015; the required reduction in 2021–2025 may derive mainly from controls of the road mobile sector. The reason for the insufficient reduction in VOCs emissions from 2014 to 2019 may be the same as that for NOx. Although the proportion of emissions from secondary industries and non-road vehicles should have been reduced as expected, there remain significant grounds for further effort in 2021–2025. The total PM2.5 emissions were maintained at a low level until 2019 through strict and continuous controls during the period; further reductions in 2021–2025 will mainly rely on regional cooperation.
In general, considering the economic and energy structure of Shenzhen, the process of air quality improvement may have entered a bottleneck period. The requirement in 2021–2025 to maintain the average annual concentration of PM2.5 within 20 µg/m3 may be relatively modest, but to control the increase in O3 concentration poses a much greater challenge. Due to the synergy between CO2 emissions and air pollutant emissions, the policies pertaining to the improvement of air quality have resulted in positive effects—for instance, in secondary industries. The greatest potential for further collaborative reduction in emissions is in the road mobile, secondary industries and non-road mobile sectors.

Supplementary Materials

The following are available online at https://www.mdpi.com/article/10.3390/atmos12091221/s1, Table S1: The truth table for policy analysis.

Author Contributions

Conceptualization, Y.Z. and J.X.; methodology, S.-Q.Y., J.X. and Y.Z.; software, J.X.; validation, J.X., W.-Y.C. and F.L.; formal analysis, S.-Q.Y.; investigation, S.-Q.Y.; resources, Y.Z., S.-Q.Y. and F.L.; data curation, S.-Q.Y.; writing—original draft preparation, S.-Q.Y.; writing—review and editing, S.-Q.Y., J.X., W.-Y.C. and F.L.; visualization, S.-Q.Y.; supervision, W.-Y.C. and F.L.; project administration, F.L. All authors have read and agreed to the published version of the manuscript.

Funding

This research was funded by (1) 2020 international cooperation projects of Shenzhen Science and Technology Innovation Committee, China, grant number GJHZ20190822173805220 (Project title: Study on the Synergetic Mechanism of Urban Energy Structure, Carbon Emission and air pollution); (2) “One Belt, One Road” international science and technology cooperation platform construction project from China Association for Science and Technology, grant number 2021ZZGJB071545 (Project title: Research on key technologies with green and low-carbon features for countries along the line of “One Belt, One Road” to cope with climate change); (3) National Natural Science Foundation of China, grant number 51861135102.

Institutional Review Board Statement

Not applicable.

Informed Consent Statement

Not applicable.

Data Availability Statement

Data set available on request to corresponding authors.

Conflicts of Interest

The authors declare no conflict of interest. The funders had no role in the design of the study; in the collection, analyses, or interpretation of data; in the writing of the manuscript, or in the decision to publish the results.

Abbreviations

CO2Carbon dioxide
NH3Ammonia
NOxNitrogen oxides
O3Ozone
PM2.5Fine particulate matter
SO2Sulfur dioxide
VOCsVolatile organic compounds
µg/m3Microgram per cubic meter
SZShenzhen, Guangdong Province, China
OTHERArea surrounding Shenzhen (in model setting)

References

  1. Tagaris, E.; Liao, K.-J.; DeLucia, A.J.; Deck, L.; Amar, P.; Russell, A.G. Potential Impact of Climate Change on Air Pollution-Related Human Health Effects. Environ. Sci. Technol. 2009, 43, 4979–4988. [Google Scholar] [CrossRef]
  2. Maione, M.; Fowler, D.; Monks, P.; Reis, S.; Rudich, Y.; Williams, M.; Fuzzi, S. Air quality and climate change: Designing new win-win policies for Europe. Environ. Sci. Policy 2016, 65, 48–57. [Google Scholar] [CrossRef] [Green Version]
  3. Yang, S.Y.; Wang, F.; Liu, N. Assessment of the Air Pollution Prevention and Control Action Plan in China: A Difference-in-Difference analysis. China Popul. Resour. Environ. 2020, 30, 110–117. [Google Scholar]
  4. Wang, W.L.; Li, M.Y.; Zhang, M.H.; Wang, H.W. Analysis on variation characteristics of air quality in 31 key cities from 2014 to 2018 in China. Chin. J. PHM 2020, 36, 441–445. [Google Scholar] [CrossRef]
  5. Guo, Y.M.; Lin, X.Q.; Bian, Y. The Spatial-Temporal Characteristics and Influencing Factors of Air Quality in China’s Urban Agglomerations. Ecol. Econ. 2019, 35, 167–175. [Google Scholar]
  6. Huang, C.; Wang, Q.; Wang, S.; Ren, M.; Ma, R.; He, Y. Air Pollution Prevention and Control Policy in China. Adv. Exp. Med. Biol. 2017, 1017, 243–261. [Google Scholar] [CrossRef]
  7. China Daily. Available online: http://www.chinadaily.com.cn/a/202009/23/WS5f6a5791a31024ad0ba7b1df.html (accessed on 2 August 2021).
  8. United States Environmental Protection Agency-Pollution Prevention Law and Policies. Available online: https://www.epa.gov/p2/pollution-prevention-law-and-policies (accessed on 31 August 2021).
  9. Office of Pollution Prevention and Toxics, United States Environmental Protection Agency. Chapter 2 Data Sources and Evidence for Conclusions. Evaluation of EPA Efforts to Integrate Pollution Prevention Policy throughout EPA and at Other Federal Agencies, United States. October 2008. Available online: https://www.epa.gov/p2/evaluation-epa-efforts-integrate-pollution-prevention-policy-throughout-epa-and-other-federal (accessed on 31 August 2021).
  10. D’Adamo, I.; Falcone, P.M.; Gastaldi, M.; Morone, P. RES-T trajectories and an integrated SWOT-AHP analysis for biomethane. Policy implications to support a green revolution in European transport. Energy Policy 2020, 138, 111220. [Google Scholar] [CrossRef]
  11. Falcone, P.M.; Lopolito, A.; Sica, E. Instrument mix for energy transition: A method for policy formulation. Technol. Forecast. Soc. Chang. 2019, 148, 119706. [Google Scholar] [CrossRef]
  12. He, R.-F.; Zhong, M.-R.; Huang, J.-B. The dynamic effects of renewable-energy and fossil-fuel technological progress on metal consumption in the electric power industry. Resour. Policy 2021, 71, 101985. [Google Scholar] [CrossRef]
  13. Ellegård, K.; Palm, J. Visualizing energy consumption activities as a tool for making everyday life more sustainable. Appl. Energy 2011, 88, 1920–1926. [Google Scholar] [CrossRef] [Green Version]
  14. Ding, Q.; Cai, W.; Wang, C.; Sanwal, M. The relationships between household consumption activities and energy consumption in china—An input-output analysis from the lifestyle perspective. Appl. Energy 2017, 207, 520–532. [Google Scholar] [CrossRef]
  15. Faria, M.; Rolim, C.; Duarte, G.; Farias, T.; Baptista, P. Assessing energy consumption impacts of traffic shifts based on real-world driving data. Transp. Res. Part. D Transp. Environ. 2018, 62, 489–507. [Google Scholar] [CrossRef]
  16. Zhou, Y.; Zhang, Y.; Zhao, B.; Lang, J.; Xia, X.; Chen, D.; Cheng, S. Estimating air pollutant emissions from crop residue open burning through a calculation of open burning proportion based on satellite-derived fire radiative energy. Environ. Pollut. 2021, 286, 117477. [Google Scholar] [CrossRef] [PubMed]
  17. Monforti-Ferrario, F.; Blanco, M.P. The impact of power network congestion, its consequences and mitigation measures on air pollutants and greenhouse gases emissions. A case from Germany. Renew. Sustain. Energy Rev. 2021, 150, 111501. [Google Scholar] [CrossRef]
  18. Nocera, S.; Maino, F.; Cavallaro, F. A heuristic method for determining CO2 efficiency in transportation planning. Eur. Transp. Res. Rev. 2012, 4, 91–106. [Google Scholar] [CrossRef] [Green Version]
  19. Weber, C.L. Uncertainty and Variability in Product Carbon Footprinting. J. Ind. Ecol. 2012, 16, 203–211. [Google Scholar] [CrossRef]
  20. Wang, L.; Chen, H.; Chen, W. Co-control of carbon dioxide and air pollutant emissions in China from a cost-effective perspective. Mitig. Adapt. Strat. Glob. Chang. 2020, 25, 1177–1197. [Google Scholar] [CrossRef]
  21. Wang, M.; Feng, X.Z.; Du, X.L.; Wu, L.P.; Zhao, M.X.; Wang, P.; An, Q. Evaluation of co-controlling GHGs from pollutant reduction facilities in the industrial sectors, empirical analysis based on data in Chongqing city. Clim. Chang. Res. 2021, 17, 296–304. [Google Scholar] [CrossRef]
  22. Zhao, W.; Kong, F.; Shen, W. Co-benefits of local air pollutants and greenhouse gas reduction achieved by hydropower development in Xizang (Tibet) Autonomous Region, China. China Geogr. Sci. 2016, 26, 304–313. [Google Scholar] [CrossRef] [Green Version]
  23. Hu, C.; Liu, C.; Hu, N.; Hong, J.; Ai, X. Government environmental control measures on CO2 emission during the 2014 Youth Olympic Games in Nanjing: Perspectives from a top-down approach. J. Environ. Sci. 2022, 113, 165–178. [Google Scholar] [CrossRef]
  24. Zhang, Q.; Xue, D.; Liu, X.; Gong, X.; Gao, H. Process analysis of PM2.5 pollution events in a coastal city of China using CMAQ. J. Environ. Sci. 2019, 79, 225–238. [Google Scholar] [CrossRef]
  25. Wang, M.; Tian, P.; Wang, L.; Yu, Z.; Du, T.; Chen, Q.; Guan, X.; Guo, Y.; Zhang, M.; Tang, C.; et al. High contribution of vehicle emissions to fine particulate pollutions in Lanzhou, Northwest China based on high-resolution online data source appointment. Sci. Total Environ. 2021, 798, 149310. [Google Scholar] [CrossRef]
  26. Shenzhen Ecological Environment Bureau. Available online: http://meeb.sz.gov.cn/szssthjjwzgkml/szssthjjwzgkml/qt/hjxw/content/post_6745419.html (accessed on 2 August 2021).
  27. Shenzhen Ecological Environment Bureau. Available online: http://meeb.sz.gov.cn/szssthjjwzgkml/szssthjjwzgkml/qt/hjxw/content/post_5547508.html (accessed on 2 August 2021).
  28. Shenzhen-Shanwei Special Cooperation Zone. Available online: http://www.szss.gov.cn/ (accessed on 2 August 2021).
  29. Meteorological Bureau of Shenzhen Municipality. Available online: http://weather.sz.gov.cn/qixiangfuwu/qihoufuwu/qihouguanceyupinggu/qihougaikuang/ (accessed on 2 August 2021).
  30. Shenzhen Ecological Environment Bureau (Monthly Air Quality Report). Available online: http://meeb.sz.gov.cn/ztfw/ztzl/hjbhxxgkzl/kqhjxx/hjkqzlgszk/ (accessed on 2 August 2021).
  31. Shenzhen Municipal Bureau of Statistics. Available online: http://tjj.sz.gov.cn/zwgk/zfxxgkml/tjsj/tjnj/ (accessed on 2 August 2021).
  32. Shenzhen Municipal Bureau of Statistics. Available online: http://tjj.sz.gov.cn/zwgk/zfxxgkml/tjsj/tjnj/content/post_8386382.html (accessed on 2 August 2021).
  33. Shenzhen Government Online. Available online: http://www.sz.gov.cn/cn/xxgk/zfxxgj/tjsj/tjgb/content/post_8718466.html (accessed on 2 August 2021).
  34. Shenzhen Government Online. Available online: http://www.sz.gov.cn/zfgb/2021/gb1121/content/post_8852606.html (accessed on 2 August 2021).
  35. Sun, T.L.; Zou, B.B.; Huang, X.F.; Shen, H.Y.; Dai, J.; He, L.Y. Source apportionment of PM2.5 pollution in Shenzhen. China Environ. Sci. 2019, 39, 13–20. [Google Scholar] [CrossRef]
  36. Li, P.; Tian, P.S.; Zhu, Z. Pollution Characteristics and Source Apportionment of PM2.5 in Bao’an District of Shenzhen. Environ. Sci. Surv. 2018, 37, 51–55. [Google Scholar] [CrossRef]
  37. Huang, L.Y. Study on the Source Apportionment and Synergistic Emission Reduction of PM2.5 and Ozone in a Certain Area of Shenzhen. Master’s Thesis, Harbin Institute of Technology, Shenzhen, China, December 2019. [Google Scholar]
  38. Lin, C.X.; Chen, J.Y.; Li, H.X.; You, Y.; Xu, J.Z.; Li, S.P. Ozone Source Apportionment in East Coast of the Pearl River Estuary Based on the CAMx Model. Saf. Environ. Eng. 2017, 24, 51–56+83. [Google Scholar] [CrossRef]
  39. World Health Organization. Occupational and Environmental Health Team. WHO Air Quality Guidelines for Particulate Matter, Ozone, Nitrogen Dioxide and Sulfur Dioxide: Global Update 2005: Summary of Risk Assessment; WHO Press: Geneva, Switzerland, 2006; Available online: https://apps.who.int/iris/handle/10665/69477 (accessed on 2 August 2021).
  40. Shenzhen Ecological Environment Bureau (Environmental Bulletin 2014). Available online: http://meeb.sz.gov.cn/xxgk/tjsj/ndhjzkgb/content/post_2015599.html (accessed on 2 August 2021).
  41. Shenzhen Ecological Environment Bureau (Environmental Bulletin 2015). Available online: http://meeb.sz.gov.cn/xxgk/tjsj/ndhjzkgb/content/post_2015589.html (accessed on 2 August 2021).
  42. Shenzhen Ecological Environment Bureau (Environmental Bulletin 2016). Available online: http://meeb.sz.gov.cn/xxgk/tjsj/ndhjzkgb/content/post_2015582.html (accessed on 2 August 2021).
  43. Shenzhen Ecological Environment Bureau (Environmental Bulletin 2017). Available online: http://meeb.sz.gov.cn/xxgk/tjsj/ndhjzkgb/content/post_2015572.html (accessed on 2 August 2021).
  44. Shenzhen Ecological Environment Bureau (Environmental Bulletin 2018). Available online: http://meeb.sz.gov.cn/xxgk/tjsj/ndhjzkgb/content/post_2015555.html (accessed on 2 August 2021).
  45. Shenzhen Ecological Environment Bureau (Environmental Bulletin 2019). Available online: http://meeb.sz.gov.cn/xxgk/tjsj/ndhjzkgb/content/post_7259599.html (accessed on 2 August 2021).
  46. Ministry of Ecology and Environment of the People’s Republic of China; State Administration for Market Regulation. Ambient Air Quality Standards (GB 3095-2012); China Environmental Science Press: Beijing, China, 2012. Available online: http://www.mee.gov.cn/ywgz/fgbz/bz/bzwb/dqhjbh/dqhjzlbz/201203/t20120302_224165.shtml (accessed on 1 August 2021).
  47. Ministry of Ecology and Environment of the People’s Republic of China. Technical Regulation for Ambient Air Quality Assessment (on Trial) (HJ 663-2013); China Environmental Science Press: Beijing, China, 2013. Available online: http://www.mee.gov.cn/ywgz/fgbz/bz/bzwb/jcffbz/201309/t20130925_260809.htm (accessed on 1 August 2021).
  48. ABaCAS (RSM-VAT). Available online: http://abacas.see.scut.edu.cn/abacas/ABaCASSystem.aspx (accessed on 2 August 2021).
  49. United States Environmental Protection Agency (CMAQ). Available online: https://www.epa.gov/cmaq/how-cite-cmaq (accessed on 2 August 2021). [CrossRef]
  50. Shenzhen Government Online. Available online: http://www.sz.gov.cn/zfgb/2017/gb995/content/post_4995986.html (accessed on 2 August 2021).
  51. Xue, Z.G.; Du, J.H.; Ren, Y.J.; Zhang, X.M.; Chen, W.; Ying, N.; Zhang, H.F. Development Course and Suggestion of Air Pollutant Emission Inventory in China. Res. Environ. Sci. 2019, 32, 1678–1686. [Google Scholar] [CrossRef]
  52. He, K.B. Technical Manual for Preparation of Urban. Air Pollutant Emission Inventory; Tsinghua University: Beijing, China, 2018. [Google Scholar]
  53. Pan, Y.Y.; Li, N.; Zheng, J.Y.; Yin, S.S.; Li, C.; Yang, J.; Zhong, L.J.; Chen, D.H.; Deng, S.X.; Wang, S.S. Emission inventory and characteristics of anthropogenic air pollutant sources in Guangdong Province. Acta Sci. Circumst. 2015, 35, 2655–2669. [Google Scholar] [CrossRef]
  54. Cao, Y. Studies of Vehicle Emission Inventory in Shenzhen Using MOVES. Master’s Thesis, Harbin Institute of Technology, Shenzhen, China, December 2017. [Google Scholar]
  55. China Daily. Available online: http://www.chinadaily.com.cn/a/201802/01/WS5a724e1ba3106e7dcc13a0e0.html (accessed on 2 August 2021).
  56. Ministry of Ecology and Environment of the People’s Republic of China. Available online: http://english.mee.gov.cn/News_service/news_release/201807/t20180713_446624.shtml (accessed on 2 August 2021).
  57. Xing, Y.K.; Mao, X.Q.; Feng, X.Z.; Gao, Y.B.; He, F.; Yu, H.; Zhao, M.X. An effectiveness evaluation of co-controlling local air pollutants and GHGs by implementing Blue Sky Defense Action at city level—A case study of Tangshan city. Chin. J. Environ. Manag. 2020, 12, 20–28. [Google Scholar] [CrossRef]
  58. Development and Reform Commission of Shenzhen Municipality. Available online: http://fgw.sz.gov.cn/zwgk/ghjh/zxgh/content/post_4561905.html (accessed on 2 August 2021).
  59. Shenzhen Government Online. Available online: http://www.sz.gov.cn/zfgb/2013/gb852/content/post_4952084.html (accessed on 2 August 2021).
  60. Shenzhen Government Online. Available online: http://www.sz.gov.cn/zfgb/2015/gb917/content/post_4984661.html (accessed on 2 August 2021).
  61. Shenzhen Government Online. Available online: http://www.sz.gov.cn/gkmlpt/content/7/7786/post_7786646.html#749 (accessed on 2 August 2021).
  62. Shenzhen Ecological Environment Bureau. Available online: http://meeb.sz.gov.cn/ydmh/zwgk/ghjh/jqgh/content/post_6742369.html (accessed on 2 August 2021).
  63. Shenzhen Ecological Environment Bureau. Available online: http://meeb.sz.gov.cn/xxgk/qt/tzgg/content/post_7294665.html (accessed on 2 August 2021).
  64. Harbin Institute of Technology (Shenzhen). Achieving Triple Goals of Carbon Emission Peaking, Air Quality Standard Attainment, and Economic Prosperity at the City Level: The Shenzhen Case; Energy Foundation China: Beijing, China, 2019; Available online: https://www.efchina.org/Reports-en/report-lccp-20191015-en?set_language=en (accessed on 2 August 2021).
  65. Wang, D.; Liao, S.M.; Liang, Z.J. Evolution of Total and Structure of Direct Emissions of Industrial Carbon Dioxide in Shenzhen. Spec. Zone Econ. 2019, 10, 10–13. [Google Scholar]
  66. Energy Research Institute of national development and Reform Commission; China National Institute of Standardization. General Rules for Calculation of the Comprehensive Energy Consumption (GBT2589-2008); Energy Fundamentals and Management (TC20), Standardization Administration: Beijing, China, 2008. Available online: http://std.samr.gov.cn/gb/search/gbDetailed?id=71F772D7F5DAD3A7E05397BE0A0AB82A (accessed on 1 August 2021).
  67. National Center for Climate Change Strategy and International Cooperation (NCSC) (The Provincial Greenhouse Gas Inventories (on Trial)). Available online: http://www.ncsc.org.cn/SY/tjkhybg/202003/t20200319_769763.shtml (accessed on 2 August 2021).
  68. ABaCAS. Available online: http://abacas.see.scut.edu.cn/abacas/About.aspx (accessed on 2 August 2021).
  69. Xing, J.; Wang, S.X.; Zhu, Y.; Ding, D.; Long, S.C.; Tian, H.Z.; Jang, C.; Hao, J.M. Development and Application of the Scientific Decision Support Platform for Air Pollution Prevention and Control. Res. Environ. Sci. 2019, 132. [Google Scholar] [CrossRef]
  70. Wang, S.X.; Xing, J.; Jang, C.; Zhu, Y.; Fu, J.S.; Hao, J.M. Impact assessment of ammonia emissions on inorganic aerosols in East China using response surface modeling technique. Environ. Sci. Technol. 2011, 45, 9293–9300. [Google Scholar] [CrossRef]
  71. Foley, K.M.; Napelenok, S.L.; Jang, C.; Phillips, S.; Hubbell, B.J.; Fulcher, C.M. Two reduced form air quality modeling techniques for rapidly calculating pollutant mitigation potential across many sources, locations and precursor emission types. Atmos. Environ. 2014, 98, 283–289. [Google Scholar] [CrossRef]
  72. Wang, H.; Zhu, Y.; Jang, C.; Lin, C.J.; Wang, S.X.; Fu, J.S.; Gao, J.; Deng, S.; Xie, J.P.; Ding, D.; et al. Design and demonstration of a next-generation air quality attainment assessment system for PM2.5 and O3. J. Environ. Sci. 2015, 29, 178–188. [Google Scholar] [CrossRef] [PubMed]
  73. Pan, Y.Z.; Zhu, Y.; Jang, J.C.; Wang, S.X.; Xing, J.; Chiang, P.C.; Zhao, X.T.; You, Z.Q.; Yuan, Y.Z. Source and sectoral contribution analysis of PM2.5 based on efficient response surface modeling technique over Pearl River Delta Region of China. Sci. Total Environ. 2020, 737. [Google Scholar] [CrossRef] [PubMed]
  74. School of Environment, Tsinghua University. Improvement Measures of Atmospheric Environmental Quality in Shenzhen—Project Report of Cost Benefit Analysis; Project Report; Tsinghua University: Beijing, China, December 2016. [Google Scholar]
  75. Xiong, Y.; Zhou, J.G. Policy Reproduction in River-chief System Transfer: Influencing Factors and Model Generalization--Based on the Qualitative Comparison and Analysis (QCA) of Multiple Cases in Jiangsu Province. J. Gansu Adm. Inst. 2017, 1, 37–47; 126–127. [Google Scholar] [CrossRef]
  76. Jiang, X.; Ma, H.Q.; Wang, D.Z. Research on Policy Synergy of Open Research Data and Personal Data Protection from the Perspective of Qualitative Text Analysis: A Case Study of Foreign Funding Agencies. Inf. Stud. Theory Appl. 2020, 43, 54–62. [Google Scholar] [CrossRef]
  77. Pruditsch, N. The Conditions of Successful Renewable Energy Governance. Exploring Qualitative Comparative Analysis (QCA) in Energy Policy Research. Energy Procedia 2017, 118, 21–27. [Google Scholar] [CrossRef]
  78. Jian, X.H.; Peng, S.Z. Constructing and analyzing the environmental policy matrix of China. China Popul. Resour. Environ. 2003, 13. [Google Scholar]
  79. Zhang, K.; Watanabe, K.; Aoyama, T. A Prediction Study on the Localization Policy of Improving the Satisfaction of Chinese Visitors to Japan by Using Matrix Factorization Techniques. J. Syst. Sci. Inf. 2019, 7, 510–531. [Google Scholar] [CrossRef]
  80. Ning, W.T. VOCs Estimate of Biogenic Sources Emissions and the Impact on Regional Air Quality. Master’s Thesis, Shandong Normal University, Jinan, China, 17 April 2012. [Google Scholar]
  81. Wei, W.; Cheng, S.Y.; Li, G.H.; Wang, G.; Wang, H.Y. Characteristics of ozone and ozone precursors (VOCs and NOx) around a petroleum refinery in Beijing, China. J. Environ. Sci. 2014, 26, 332–342. [Google Scholar] [CrossRef]
  82. Sheng, Y.W.; Zhu, Y.; Tao, J.; Chen, X.H.; Liu, K.X.; Jang, C.; Wang, S.X.; Zhu, Z.H.; Wei, H.; Yuan, Y.Z. Source contribution analysis of ambient ozone and cost-benefit assessment of control scenarios in a typical ozonepolluted city. Acta Sci. Circumstantiae 2017, 37, 3306–3315. [Google Scholar] [CrossRef]
  83. Jiang, M.Q.; Lu, K.D.; Su, R.; Tan, Z.F.; Wang, H.L.; Li, L.; Fu, Q.Y.; Zhai, C.Z.; Tan, Q.W.; Yue, D.L.; et al. Ozone formation and key VOCs in typical Chinese city clusters. Chin. Sci. Bull. 2018, 63, 1130–1141. [Google Scholar] [CrossRef]
  84. The State Council of the People’s Republic of China. Available online: http://www.gov.cn/xinwen/2018-03/17/content_5275116.htm (accessed on 2 August 2021).
  85. Shenzhen Government Online (Web version of Shenzhen Yearbook). Available online: http://www.sz.gov.cn/cn/zjsz/nj/ (accessed on 2 August 2021).
  86. Nocera, S.; Cavallaro, F. A methodological framework for the economic evaluation of CO2 emissions from transport. J. Adv. Transp. 2014, 48, 138–164. [Google Scholar] [CrossRef]
  87. Sareen, S. Digitalisation and social inclusion in multi-scalar smart energy transitions. Energy Res. Soc. Sci. 2021, 81, 102251. [Google Scholar] [CrossRef]
Figure 1. Relationship between improvement in air quality and reduction in carbon emissions.
Atmosphere 12 01221 g001
Figure 2. Research flowchart of the present study.
Atmosphere 12 01221 g002
Figure 3. Key interface and parameters in the ABaCAS: (a) interface of the ABaCAS [68]; (b) interface of the RSM-VAT [69]; (c) geographical boundary of simulation [74]; (d) concentration distribution (default visualization of the annual average concentration of PM2.5 in the base year) [74].
Atmosphere 12 01221 g003
Figure 4. Estimated emissions in 2014, by sector. * Living emissions are taken from the China National Environmental Monitoring Centre (http://www.cnemc.cn/, accessed on 12 September 2021).
Atmosphere 12 01221 g004
Figure 5. PM2.5 concentrations in each scenario.
Atmosphere 12 01221 g005
Figure 6. O3 concentrations in each scenario in July and October.
Atmosphere 12 01221 g006
Figure 7. Changes in O3 concentrations between six pairs of scenarios.
Atmosphere 12 01221 g007
Figure 8. Evaluation of policy contents by the number of codes appearing in each year.
Atmosphere 12 01221 g008
Figure 9. Evaluation of policy contents by the incidence of keywords recognized in each year.
Atmosphere 12 01221 g009
Figure 10. Expected reduction in emissions of air pollutants in 2019 and 2025.
Atmosphere 12 01221 g010
Figure 11. Comparison of levels of emissions between the findings of this study and those of the Triple Goals Study.
Atmosphere 12 01221 g011
Figure 12. Annual CO2 emissions in relation to primary energy consumption in secondary industries of Shenzhen from 2011 to 2019 (consumption of coal is estimated by identifying the parts of the Shenzhen–Shanwei Special Cooperation Zone, in which the coal consumption was added to the Shenzhen Yearbook since 2017).
Atmosphere 12 01221 g012
Table 1. Basic information on air quality in Shenzhen [27,40,41,42,43,44,45].
Annual Air Quality Indices201420152016201720182019
Annual average of PM2.5 (µg/m3)343027282624
90th percentile of the daily maximum 8 h of O3 (µg/m3)————135 *147 **137156
Percentage of days with the daily maximum 8 h of O3 (µg/m3) lower than 16098.9%99.6%99.4%94.8%94.8%91.0%
Annual average of O3 (µg/m3)57565961————
Loading factors (%) of six air pollutants in Shenzhen-O3 20.321.924.326.426.030.7
* Average; ** calculated by 2018 report.
Table 2. Reduction ratio of air pollutants.
Air PollutantsPM2.5SO2NOxVOCsNH3 *
Emission amount reduced from 2012 to 2016 (ton)11,00070,00033,00051,000——
Ratio of reduction from 2012 to 201641%27%28%34%——
SZ Annual
reduction ratio
10.25%6.75%7%8.5%2%
OTHER Annual
reduction ratio
5.13%3.38%3.5% 4.25%1%
* Due to the lack of information, 2% was calculated based on calculations of 2014 and 2019. The accounting results are introduced in the following section.
Table 3. Leveled codes for categories and subcategories of air pollutant emission sources.
Level 2 Fuel/Products Level 3 Combustion Mode/Processing Technology
01##Coal (solid fuel)01##Boiler type
02##Gaseous fuel02##Integral Coal Gasification Combination Cycle Power Generation
03##Liquid fuels (e.g., gasoline)03##Stove type
04##Naphtha, lubricating oil, solvent oil04##Sintering or pelletizing
0500paraffin wax05##Coking
06##Other petroleum products06##Converter, electric furnace, casting
07##Biomass07##blast furnace
08##Steel products08##Steel rolling
09##Nonferrous Metals09##Smelting
10##Nonmetallic mineral products10##Cement and lime
11##Chemical raw materials11##Glass
12##Synthetic resins12##Coatings
13##Synthetic fibers13##Inks
14##Fertilizers14##Surface coating related to automobile manufacturing and maintenance
15##Coatings and inks15##raising methods
16##Rubber, alcohol and other chemical products16##Solid waste treatment
17##Food, agricultural and sideline products17##Treatment of denitrification flue gas
18##Silk thread textiles18##National exhaust emission standard
19##Road mobile source1900Open burning
20##Non road mobile source-construction machinery20##Soil type
21##Non road mobile source-Agricultural machinery21##Road pavement type
22##Non road mobile source-General machinery22##Construction process
2300Diesel generator set23##Material handling process
24##Non road mobile source-boats and ships9999Technology insensitive
25##Non road mobile source-Railway diesel locomotive Level 4 Terminal control technology
2600Non road mobile source-Civil aircraft01##Industrial desulfurization technology
27##Insecticides02##Industrial denitration technology
28##Herbicides03##Industrial dust removal technology
29##Fungicides04##Oil/gas recovery
30##Architectural coatings0500Cooking fume purifier
31##Automobile and bicycle surface spraying06##Dust emission control of farmland, road, construction site, storage yard
32##Surface coating of other products9999No control technology
33##Printing and dyeing40##Type/stage of construction project
34##Industrial solvents41##Stacking type
35##Civil solvents42##Forest types
36##Livestock and poultry43##Grassland type
37##Cultivated land, crops, compost and population44##Waste type (solid, liquid, gas)
38##Surface type45##Liquid/gas fuel production, processing and storage
39##Road type4600Cooking fume
Table 4. NH3 emissions in Shenzhen in 2014 and 2019.
SourcePrimary IndustryRoad MobileTotal
2014Amount (ton)999.437364.038363.46
Ratio (%)12%88%100%
2019Amount (ton)821.6377364.038185.67
Ratio (%)10%90%100%
Table 5. Emission ratio in each scenario.
Year-ScenarioZoneNOxSO2NH3VOCsPM2.5
2014-S0SZ100%100%100%100%100%
Other100%100%100%100%100%
2019-S1SZ65%66%98%58%49%
Other100%100%100%100%100%
2019-S2SZ65%66%98%58%49%
Other83%83%99%79%74%
2025-S1SZ60%60%95%50%40%
Other83%83%99%79%74%
2025-S2SZ55%55%90%45%35%
Other80%80%98%75%70%
2025-S3SZ50%50%85%40%30%
Other78%78%95%73%68%
2025-S4SZ45%45%80%35%25%
Other75%75%93%70%65%
2025-S5SZ25%45%80%15%25%
Other65%75%93%60%65%
2025-S6SZ45%25%60%35%25%
Other75%65%83%70%65%
2025-S7SZ25%25%60%15%25%
Other65%65%83%60%65%
Table 6. Meaning of each scenario.
Year-ScenarioZoneMeaning of Settings
2014-S0SZBase year emission
OTHERBase year emission
2019-S1SZEmission strength compared to 2014, decreasing with the annual ratio presented in Table 2 for SZ
OTHERKeep the base year emission
2019-S2SZEmission strength compared to 2014, decreasing with the annual ratio presented in Table 2 for SZ; a scenario achieved the reported air quality (SZ annual PM2.5 = 24 µg/m3), regarded as the calibration
OTHEREmission strength compared to 2014, decreasing with the annual ratio presented in Table 2 for OTHER; a scenario achieved the reported air quality (SZ annual PM2.5 = 24 µg/m3), regarded as the calibration
2025-S1SZEmission strength compared to 2014 and decreasing more than that in 2019 for SZ; a process scenario towards the simulated air quality (PM2.5) reaching to 20 µg/m3
OTHEREmission strength compared to 2014 and decreasing more than that in 2019 for OTHER; a process scenario towards the simulated air quality (PM2.5) reaching to 20 µg/m3
2025-S2SZEmission strength compared to 2014 and decreasing more than that in 2025-S1 for SZ; a process scenario towards the simulated air quality (PM2.5) reaching to 20 µg/m3
OTHEREmission strength compared to 2014 and decreasing more than that in 2025-S1 for OTHER; a process scenario towards the simulated air quality reaching (PM2.5) to 20 µg/m3
2025-S3SZEmission strength compared to 2014 and decreasing more than that in 2025-S2 for SZ; a process scenario towards the simulated air quality (PM2.5) reaching to 20 µg/m3
OTHEREmission strength compared to 2014 and decreasing more than that in 2025-S2 for OTHER; a process scenario towards the simulated air quality (PM2.5) reaching to 20 µg/m3
2025-S4SZEmission strength compared to 2014 and decreasing more than that in 2025-S3 for SZ; a scenario achieved the simulated air quality (SZ PM2.5 = 20 µg/m3), regarded as the target
OTHEREmission strength compared to 2014 and decreasing more than that in 2025-S3 for OTHER; a scenario achieved the simulated air quality (SZ PM2.5 = 20 µg/m3), regarded as the target
2025-S5SZEmission strength compared to 2014 and decreasing more than that in 2025-S4 for SZ; a scenario of NOx- and VOCs- sensitive analysis for O3
OTHEREmission strength compared to 2014 and decreasing more than that in 2025-S4 for OTHER; a scenario of NOx- and VOCs- sensitive analysis for O3
2025-S6SZEmission strength compared to 2014 and decreasing more than that in 2025-S4 for SZ; a scenario of SO2- and NH3- sensitive analysis for O3
OTHEREmission strength compared to 2014 and decreasing more than that in 2025-S4 for OTHER; a scenario of SO2- and NH3- sensitive analysis for O3
2025-S7SZEmission strength compared to 2014 and decreasing more than that in 2025-S4 for SZ; a scenario of NOx-, VOCs-, SO2-, and NH3- sensitive analysis for O3
OTHEREmission strength compared to 2014 and decreasing more than that in 2025-S4 for OTHER; a scenario of NOx-, VOCs-, SO2-, and NH3-sensitive analysis for O3
Table 7. Policy documents issued in Shenzhen for environmental improvement.
Documents of Atmosphere Environmental PoliciesWord Count
(≈1000 in Chinese)
Year of ReleaseText-Nr. *
Medium- and Long Term Plan of Low-carbon Development in Shenzhen (2011–2020) [58]252013T-11–20
Air Quality Improvement Plan of Shenzhen [59]102013T-13
Ten Key Tasks for Improving Environmental Quality of Shenzhen in 2015 [60]72015T-15
Air Quality Improvement Plan of Shenzhen (2017–2020) [50]102017T-17–20
Sustainable Action Plan of “Shenzhen Blue” in 2018 [61]102018T-18
Sustainable Action Plan of “Shenzhen Blue” in 2019 [62]72019T-19
Sustainable Action Plan of “Shenzhen Blue” in 2020 [63]172020T-20
* Abbreviations of the documents to be briefly addressed in analysis.
Table 8. Factors in the calculation of direct CO2 emissions from each energy type [65,66,67].
Energy TypesCalculation Factors (t-CO2/t)
Coal (ton)1.9003
Crude Oil (ton)3.0202
Gasoline (ton)2.9251
Kerosene (ton)3.0179
Diesel Oil (ton)3.0959
Fuel Oil (ton)3.1705
Liquefied Petroleum Gas (ton)3.1013
Natural Gas (10,000 m3)2.1622 × 10 (t-CO2/m3)
Table 9. Social activities in Shenzhen related to energy consumption.
SectorRepresentative Items of Energy Consumption20142019Trend * of ChangesTrend to 2025Reason
Primary
Industry
Sown Areas of Farm Crop (10,000 mu)7.387.77↑ 5.28%Limited by land type in the past several years
Animal Husbandry-Cattle (head)42112584↓ 38.6%↘ or →Limited by land use pattern
Animal Husbandry-Raised Hogs (10,000 heads)10.0610.16↗ 0.99%↗ or →Limited by land use pattern
Animal Husbandry-Raised Poultry (10,000 heads)287.86211.27↓ 26.61%Limited by land use pattern; not famous products
Secondary
Industry
Fossil energy consumption (excluding coal) in industrial (10,000 tons of SCE)427.53342.57↓ 19.9%Industrial restructuring, and will be partially replaced by tertiary industry
Coal consumption in power generation (10,000 tons of SCE)278.40222.57↓ 20.1%↘ or →Rigid demand in Shenzhen, with limitations
Road
mobile
Motor vehicles (10,000 units)319.35
(2015)
350↑ 9.6%Population continues increasing.
New energy vehicles (10,000 units)4.07
(2015)
36.28↑ 791.4%The target in the 14th Five-Year Plan of Shenzhen is 100.
Oil-fired motor vehicles (10,000 units)315.28
(2015)
313.72↘ 0.5%Not encouraged; new licenses for such vehicles are limited.
Volume of Passenger Traffic of Operation Lines (10,000 person-times)103,675203,216↑ 96.01%Encouraged in the urban traffic system
Number of Passengers Carried of Bus Lines (10,000 person-times)225,739158,973↓ 29.58%Encouraged in the urban traffic system, but less convenient than operation lines
Non-road
mobile
Energy consumption of Construction project (10,000 tons of SCE)45.0639.13↓ 13.2%↘ or →100% urbanization has been completed, but (re)construction in limited spaces still exists
Aircraft takeoff and landing (sortie)286,300369,596↑ 29.1%Towards the regional center at the Pearl River
Total Civil Transport Vessels (unit)265286↑ 7.9%Ports in Shenzhen are important to Guangdong Province (and China more broadly) in transportation by sea and river
Total Berths (unit)156
(2017)
156→ 0%↗ or →Limited by ecological protection
Berths with Shore Power/Total Berths (%)14%
(2017)
24%↑ 72.7%Highly valued in policy guidance
Living
and
Dust
Total Households at the Year-end (10,000 households)89.76116.64↑ 29.95%Population continues increasing.
Parks, Gardens and Green Areas (hectare)98,805101,822↑ 3.1%↗ or →Limited by land use pattern
* ↑: Greatly increased; ↗: increased; →: almost not changed; ↘: decreased; ↓: greatly decreased.
Table 10. Proportion of main sources of carbon emissions and PM2.5 emissions in Shenzhen.
SectorContribution Rates
Carbon EmissionPM2.5 Emission
Road mobile51.8%41.0%
Non-road mobile13.2%11.0%
Secondary industry for power and heat19.1%8.0%
Secondary industry not for energy supply3.4%15.0%
In total87.6%75.0%
Publisher’s Note: MDPI stays neutral with regard to jurisdictional claims in published maps and institutional affiliations.

