
Exploring the Impact of Urban Built Environment on Public Emotions Based on Social Media Data: A Case Study of Wuhan

1
Department of Urban Planning, School of Urban Design, Wuhan University, Wuhan 430072, China
2
Engineering Research Center of Human Settlements and Environment of Hubei Province, Wuhan 430072, China
*
Author to whom correspondence should be addressed.
Land 2021, 10(9), 986; https://doi.org/10.3390/land10090986
Submission received: 31 July 2021
/
Revised: 13 September 2021
/
Accepted: 15 September 2021
/
Published: 17 September 2021
(This article belongs to the Special Issue Reflecting on the Future of the Built Environment)
Abstract
:In the era of public participation in government, public emotions and expectations are important considerations influencing urban construction, planning, and management. A desirable urban environment can make people feel at ease and comfortable and contribute to promoting positive public emotions. However, in the process of rapid urban development, the high-density and overloaded urban built environment has triggered people’s mental tension and anxiety and has contributed to negative emotions. Thus, this study aimed to explore the spatial distribution of public emotions and urban built environments in cities and to thoroughly investigate the correlation between urban built environments and public emotions. Considering the lack of dynamic elements analysis and emotions spatial analysis in previous studies, this study takes Wuhan City as an example, uses social media big data as the basis for text emotion analysis, introduces dynamic traffic elements, and establishes a multidimensional urban built environment measurement index system from five aspects: land use, spatial form, road and traffic, green space and open space, and daily life service facilities. Subsequently, the spatial distribution characteristics of public sentiment and urban built environment elements in Wuhan were analyzed. Finally, a geographically weighted regression method was used to analyze the degree of influence of different urban built environment elements on public emotions. The results showed that public emotions in Wuhan are not homogeneously distributed in terms of score and space and that there are significant differences. The urban built environment has a significant influence on public emotions. Higher land use mix, higher road network density, higher number of public transportation facilities, higher number of public open spaces, lower traffic congestion, and impact of freight transportation play important roles in promoting positive emotions. Therefore, in the process of urban construction, planners and decision makers should purposefully improve the quality of the built environment. Measures can include improving the mix of land functions, alleviating traffic congestion, avoiding the negative effects of freight traffic, rationally constructing green and open spaces, and improving various living facilities. This can help contribute toward improving urban functions and urban environments, and promote the construction of a people-oriented healthy city.
1. Introduction
A city is the result of a complex combination of various characteristics and is a space where people live their daily lives [1,2]. As a spatial carrier of material exchange, a city is where production, consumption, sharing, and experience are combined [3]. Studies have shown that the urban built environment influences people’s perception of a city and evokes different feelings and emotions [4]. Moreover, the renewal and planning of a built environment has a long-term impact on the future development of cities [5,6]. Nowadays, people-oriented urban construction has become a global trend, and assessing a built environment from the public’s perspective has become an important element of urban renewal and urban planning [5,7,8,9]. Emotion is a complex multidimensional trait that reflects human personality and behavioral characteristics [10,11,12]. Emotional stress is influenced by the degree of habitability. A prolonged exposure to urban environments with poor habitability contributes to excessive emotional stress, generates negative emotions, and triggers mental illness [13,14,15]. It was suggested that space has the power to elicit emotions as early as the 1950s [16]. A comprehensive investigation of the relationship between urban built environments and people’s emotions is important for scientific urban renewal and urban planning and the construction of people-centered urban spaces.
However, the reality is that the lack of useful information about the relationship between multidimensional urban built environments and emotions has hindered the progress toward understanding which elements in cities influence public emotions and how to improve the urban built environment to build humane urban spaces. Taking Wuhan City as an example, this paper proposes a multidimensional urban built environment measurement index method incorporating dynamic traffic elements, combined with textual emotion analysis based on social media big data, and introduces a geographically weighted regression (GWR) analysis for a multifaceted interdisciplinary investigation. We pay attention to the relationship between urban built environments and public emotions, explored from a macroperspective to provide suggestions for urban planning and development. The methodology used in this study includes four steps: (1) emotion analysis of social media data texts in the study area; (2) exploration of the spatial distribution characteristics of emotions in the study area; (3) establishment of an index system to explore the spatial structure and characteristics of the urban built environment in the study area; (4) exploration of the correlation between elements of the urban built environment and emotions based on GWR. Here, this study changes the previous research approach of exploring the relationship between urban built environments and emotions from a single aspect. A multidimensional measure of the impact of urban built environments on people’s emotions and a more comprehensive analysis of the relationship between cognition and emotions can provide a new perspective for studying urban public emotions, thus bridging the gap in existing literature.
The rest of this paper is organized as follows. After a brief literature review in Section 2, we describe the natural and social backgrounds of the study area, data sources, and pre-processing in Section 3. Section 4 presents the methodology of the study. The results are reported in Section 5. Section 6 presents the discussion and conclusions of the study.
2. Literature Review
In this section, we briefly review some relevant research about understanding the interrelationship between urban built environments and emotions using emerging big data and natural language processing techniques.
Cities are the main sites where people conduct their activities, and the behavior of people in cities is closely related to their emotions [17]. The interrelationship between human cognition and emotion has become an important research topic in biology and medicine, including the regulation of negative emotions by cognition [18,19] and emotion recognition and emotion expression in sick adolescents [20]. Since the 21st century, urbanization has brought about many urban problems, such as traffic congestion, environmental pollution, and lack of supporting facilities [21,22,23]. The high-intensity, overloaded urban built environment has triggered physiological and psychological problems and negatively affected public emotions [24]. The impact of urban built environments on human emotions has become a hot topic in urban planning research. Relevant studies have shown that built environments include both static and dynamic elements of space [25,26]. Several scholars have studied the impact of static elements in the built environment on people’s emotional health, including architectural forms, public facility support, parks and green spaces, and land use [27,28,29]. In recent years, studies have found that dynamic elements in cities also have important effects on public emotion, including the interrelationship between emotion traffic, and the effect of congestion on emotion [30,31]. However, these studies tend to focus only on the effects of single-level elements in the urban built environment on emotion, rather than integrating static elements with dynamic ones. Therefore, this study combines dynamic and static elements to evaluate urban built environments and more comprehensively explore the impact of such environments on people’s emotions.
Most of the early studies collected people’s behaviors, opinions, and emotions through traditional social questionnaires, which had the disadvantages of having a small sample size and a long acquisition time [32,33]. In recent years, some scholars have used wearable physiological sensors to investigate the relationship between cognition and emotion, and this method can more accurately perceive emotional changes [34]. However, similar to conventional methods, physiological sensors have drawbacks such as small sample size and difficulty in obtaining data, which are unsuitable for large scale studies. With the development of Internet technology, various types of big data have been widely used in academic research. These big data have the advantages of having large sample sizes and easier access [35]. Among them, social media data is one of the most common big data. People use various social media platforms to share their activities, opinions, and emotions to further showcase the urban environment and reveal the hidden characteristics of urban spaces [36,37], as well as providing information on movements [38,39]. The development of social media data provides a new opportunity to systematically study the interrelationship between urban built environment and emotions, bridging the information gap of traditional surveys. In recent studies, some scholars have attempted to use social media data for urban and mental health-related studies, further revealing the research potential of social media data in the field of human behavior and urban spatial perception [14,40,41]. With the advancement of technology and social platforms, social media provides more diverse data (e.g., text, audio, and images), and scholars have explored multiple aspects in information extraction based on text and image data in social networks [42,43,44]. The application of new computer technologies such as deep learning and natural language processing provides a good basis for further mining the emotional and perceptual information in social media data [45,46]. Therefore, this study uses natural language processing methods to retrieve public emotion from social media data, combines static and dynamic elements to comprehensively evaluate the urban built environment, and thoroughly explores the interrelationship between urban built environments and public emotions.
3. Materials
3.1. Study Area
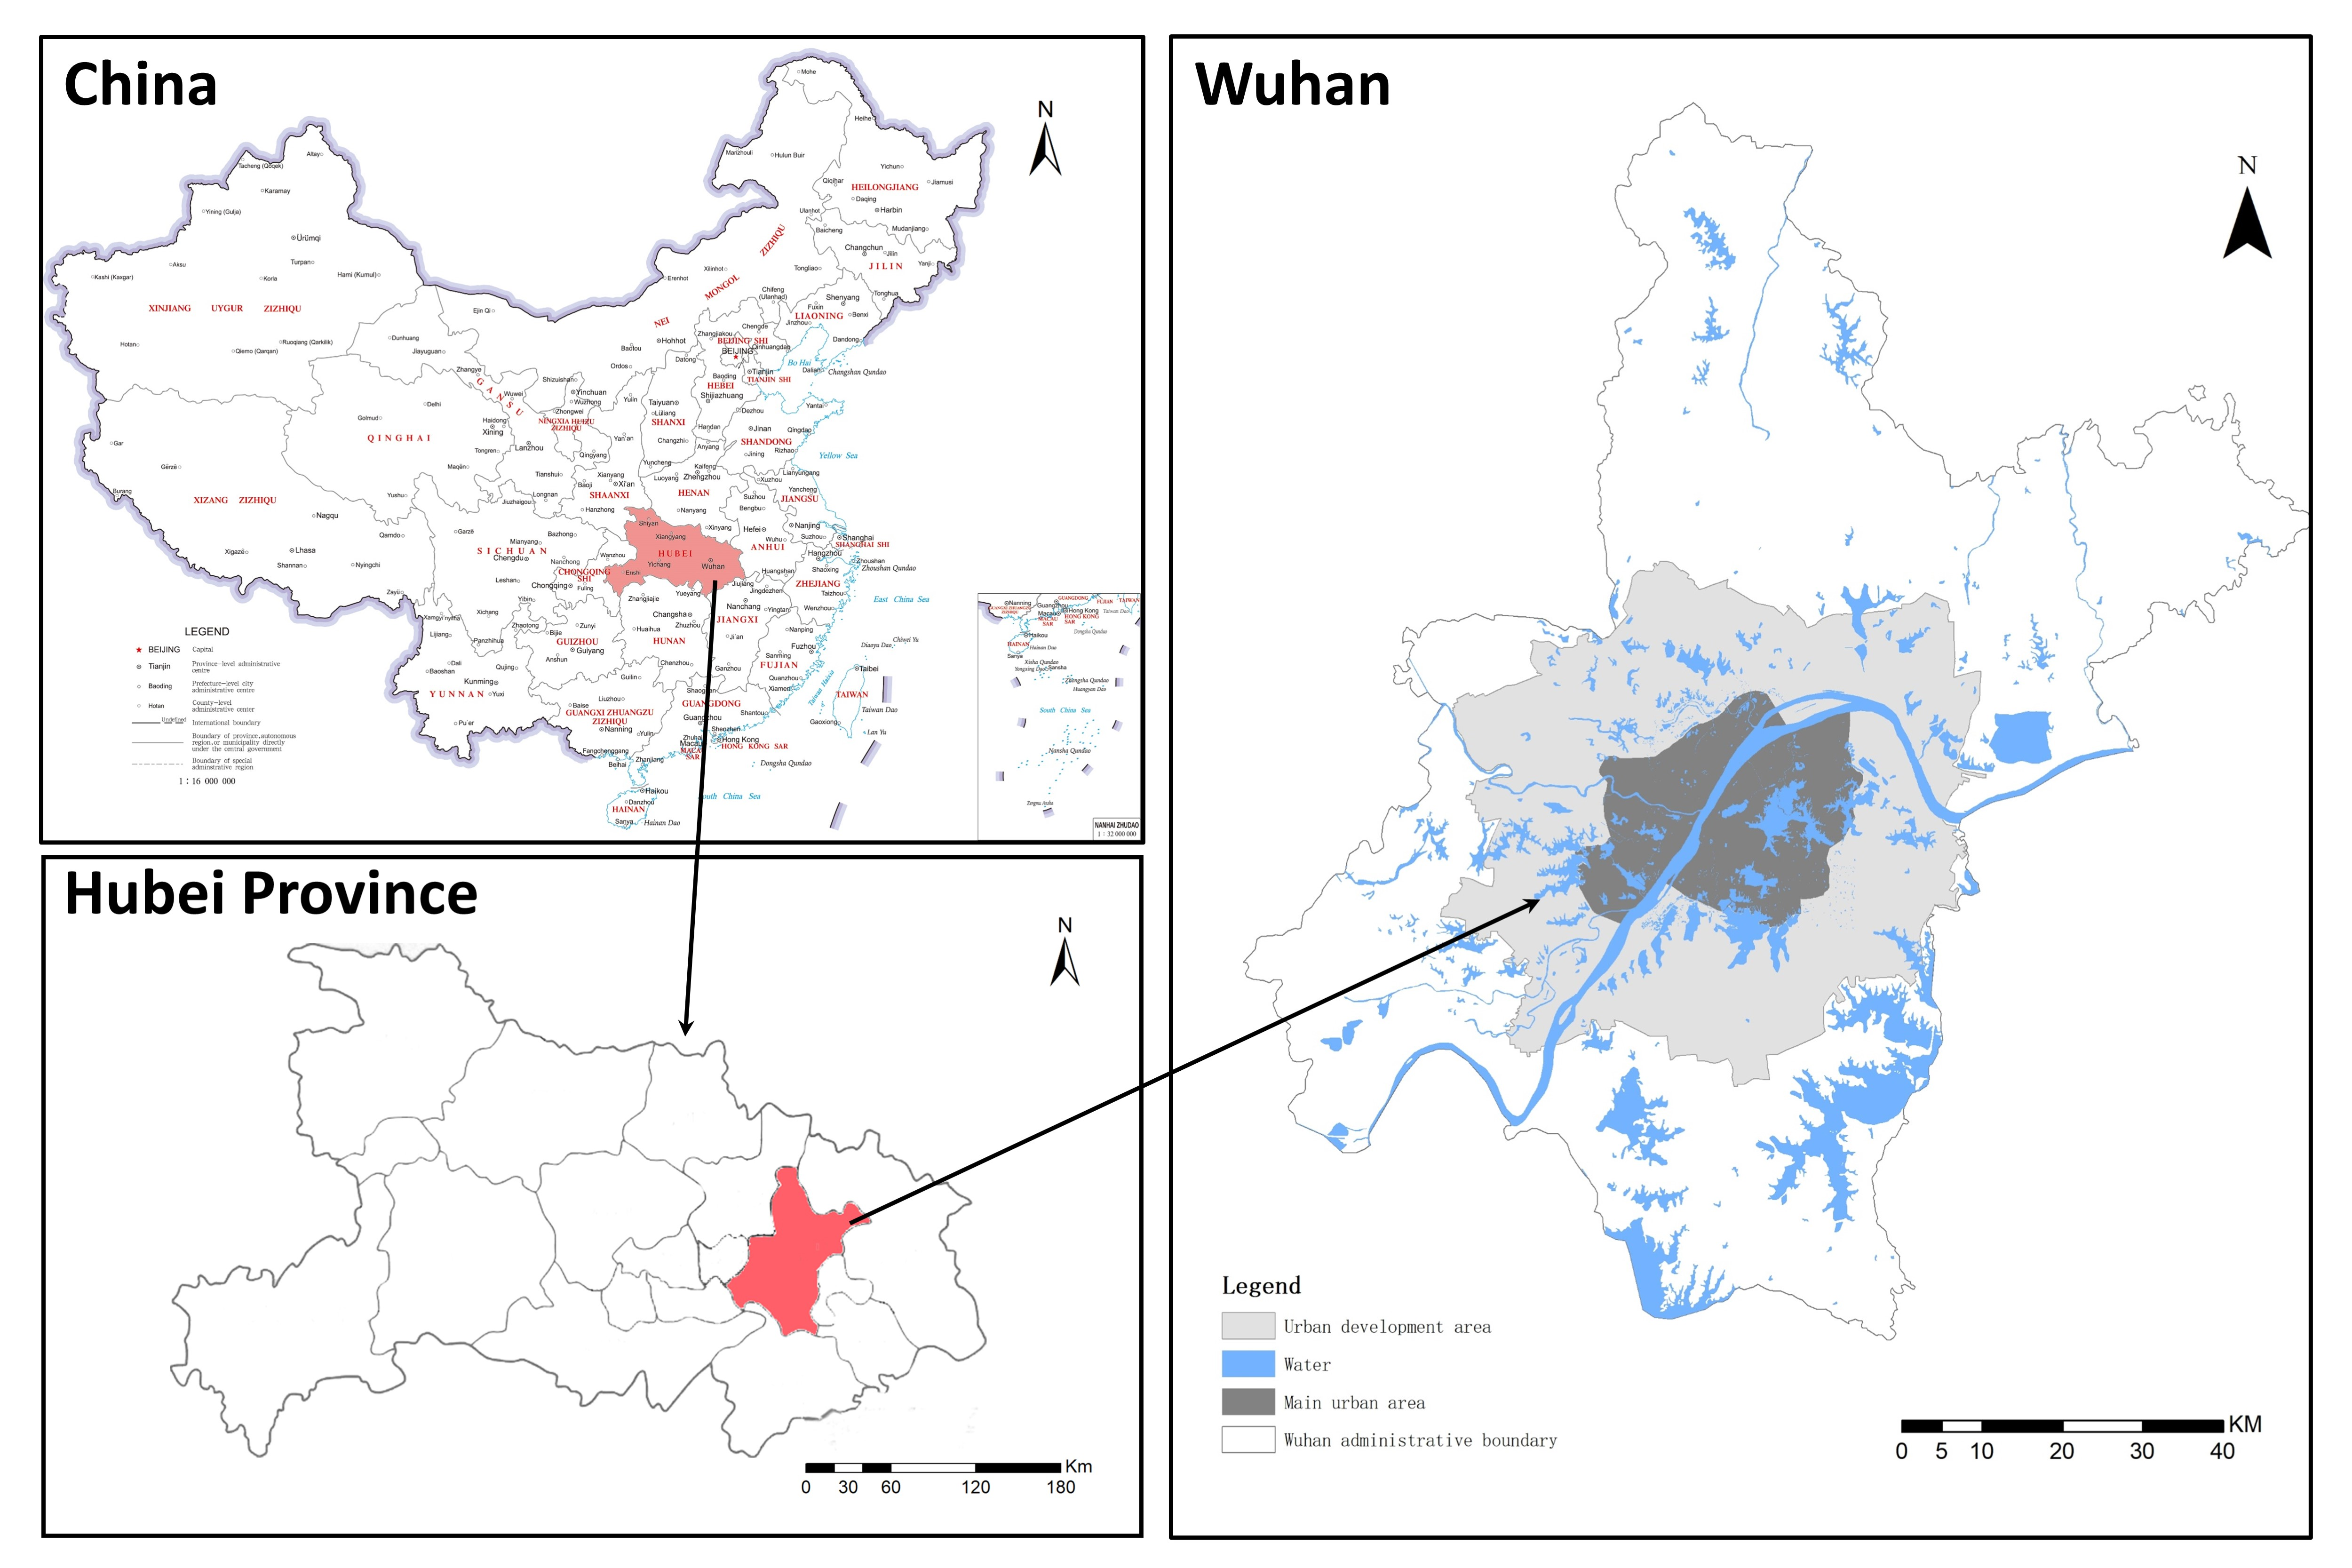
The study area is concentrated in Wuhan (113°41′–115°05′ E, 29°58′–22°31′ N). Wuhan is the capital city of Hubei Province and the central city of central China, located in the eastern part of the Jianghan Plain and the middle reaches of the Yangtze River, where the Yangtze River, the third largest river in the world, and its largest tributary, the Han River, meet in the city, forming the towns of Wuchang, Hankou, and Hanyang (Figure 1). Wuhan is an advanced metropolis with a long history, developed transportation, and a large population. It has a complex and diverse urban spatial environment that is representative of the rapidly developing cities of central China.
The Wuhan Urban Development Zone is the main gathering area of urban functions and the key expansion area of urban space in Wuhan, with a resident population of 8,474,600, accounting for 84.5% of the city’s resident population, and a total area of 3261 km2. In the Wuhan Urban Master Plan (2010–2020), the Wuhan Urban Development Area is divided into one main urban area and six new city clusters with a spatial structure of “1 + 6”. Given that the urban development within the Wuhan Urban Development Zone is mature, the urban built-up area and urban population are mainly distributed in this area. Therefore, the urban development zone of Wuhan City is taken as the main study area in this work.
3.2. Data Sources
3.2.1. Data Unit
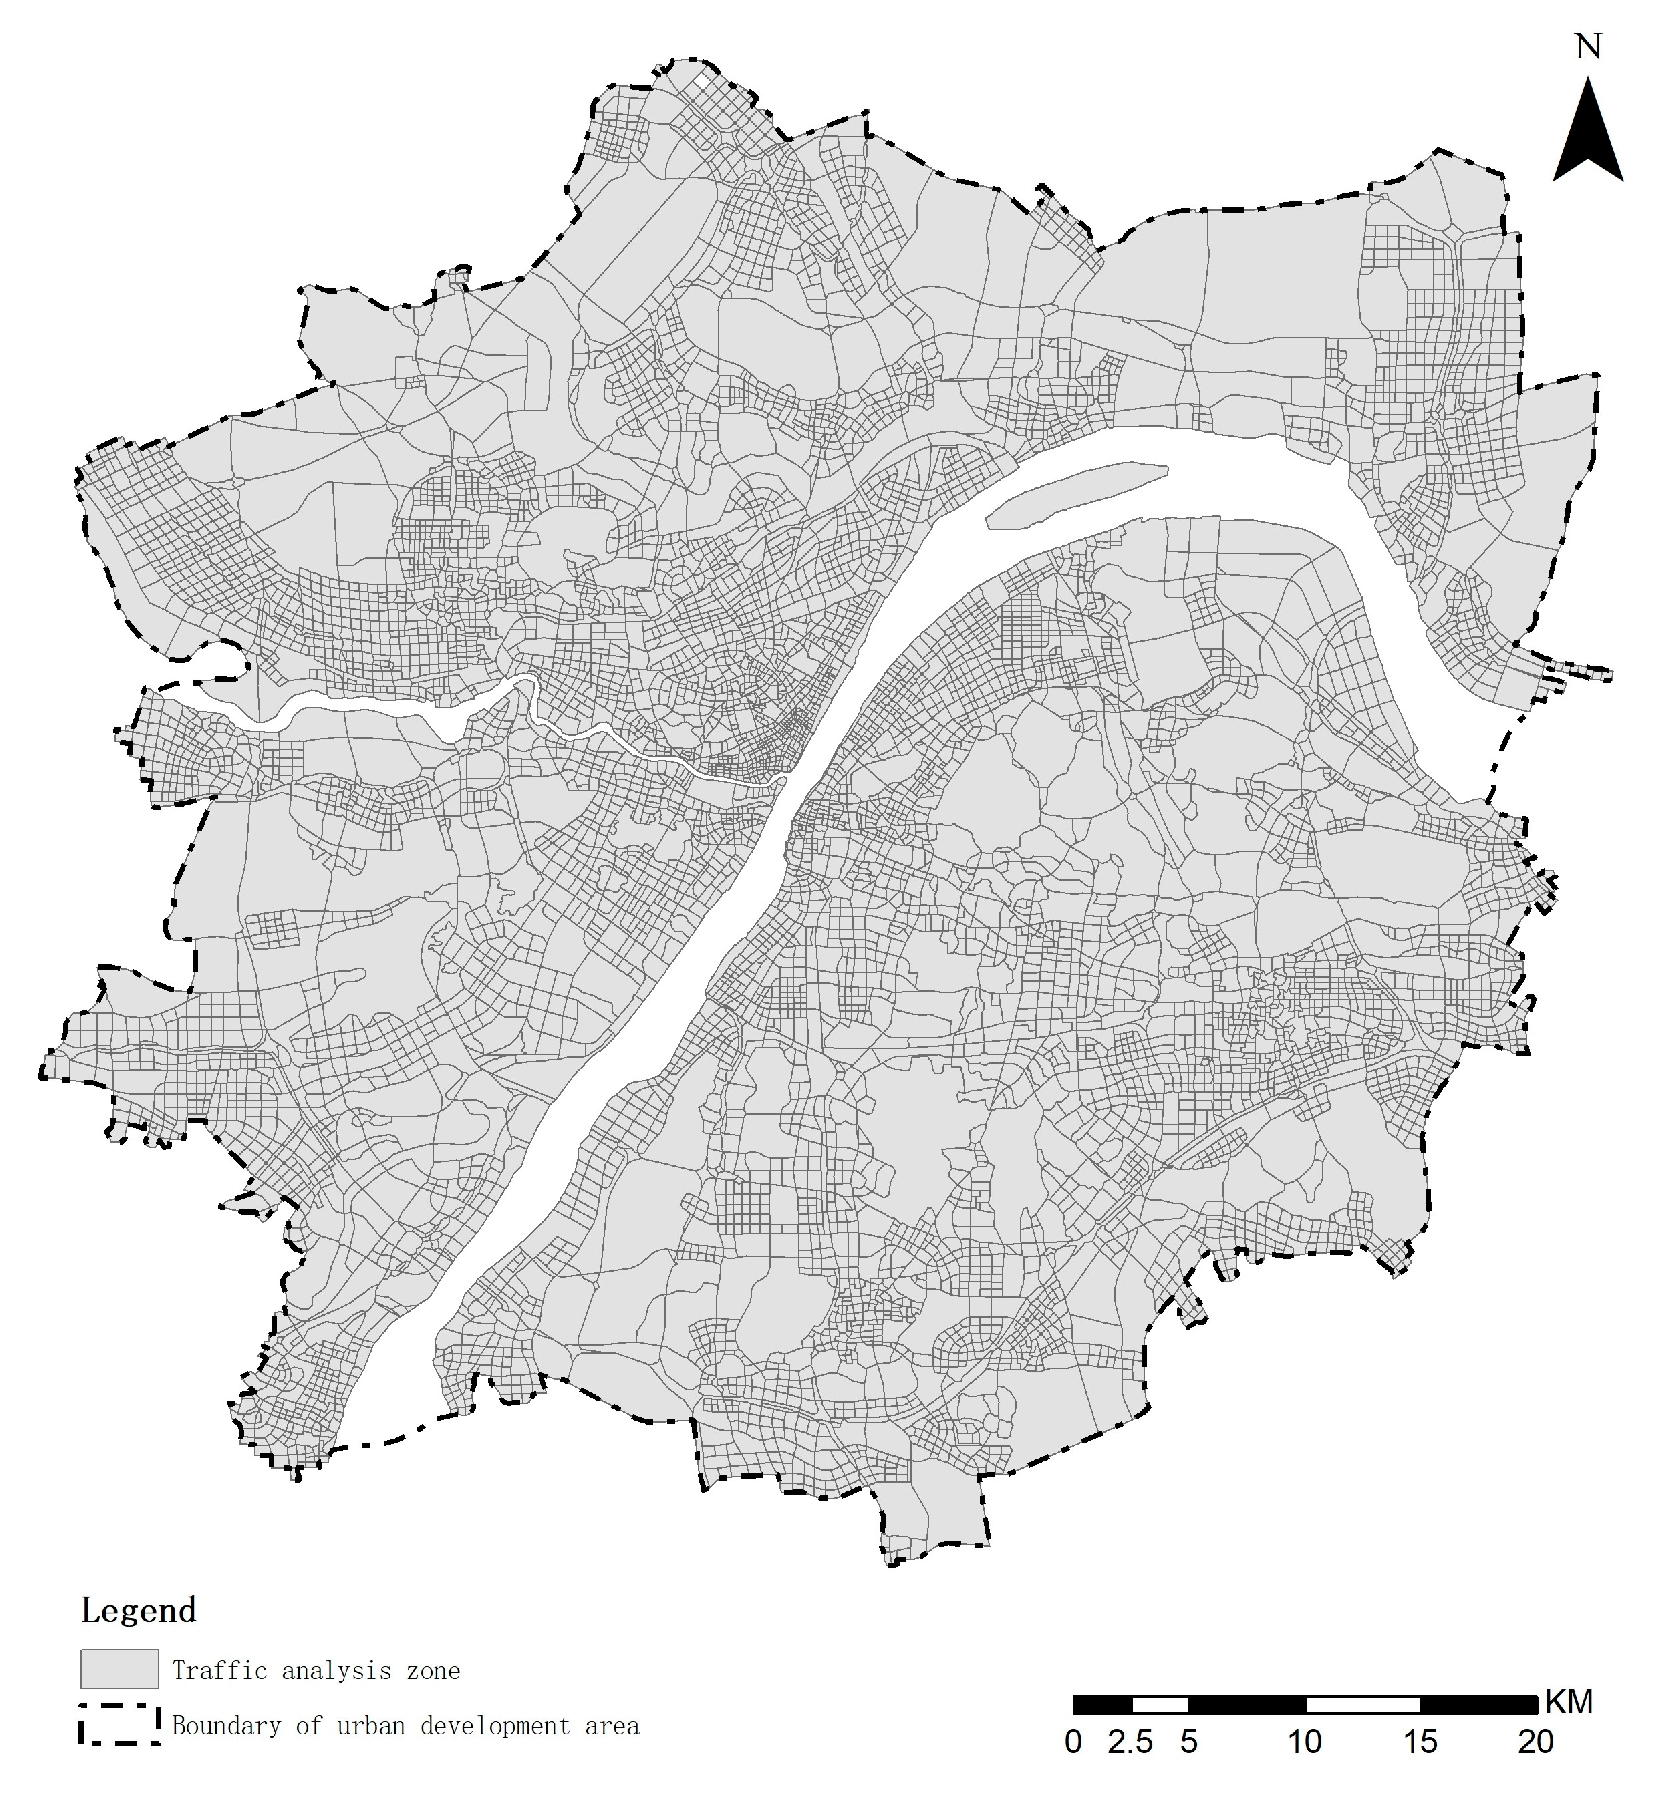
The traffic analysis zone (TAZ) is the basic data unit of traffic planning and plays an important role in traffic planning. Compared with other types of urban spatial divisions, each traffic zone has more similar characteristics, such as population density, economic density, and land function, which can help measure the urban built environment in each zone more accurately and fairly [47]. Therefore, this study considers 7940 traffic districts within the Wuhan urban development area to finely characterize the urban built environment and people’s emotions in the area (Figure 2).
3.2.2. Weibo and POI Data
Sina Weibo is a social media platform operated by Sina Corporation to publicly share, disseminate, and receive information with free, open, and shared characteristics [48]. Users can log onto Weibo through their website or mobile app and share their current geographic location and upload text, images, and videos to express their moods and opinions. Approximately 57% of Sina Weibo users are in China, and approximately 87% of Sina Weibo activities occur in China, while Sina Weibo is one of the most visited websites in mainland China. This study obtained information on users’ check-in data points through the official open API interface of Sina Weibo, including the geographical location (i.e., latitude and longitude), text content posted, and time of posting when users check-in. Table 1 shows some of the original data. The data cover dates ranging from 1 January 2018 to 31 December 2018 in Wuhan area, with a total of 1,138,655 check-ins. Point of interest (POI) data were obtained through the Baidu Map API interface in 2018 by administrative area and time, with a total of 168,424 entries in 13 categories.
3.2.3. Road Traffic Data
Traffic data has a more pronounced cyclical nature than social media data. Studies have shown that urban traffic is usually repeated on a monthly cycle [49,50]. Therefore, traffic data for one month was gathered as a dynamic element.
Traffic dynamics is a new concept derived from the traditional traffic flow theory, which is simply the current state and future trend of traffic flow [51]. In this study, the traffic congestion at the center point of each road segment is used to represent the traffic congestion of this road segment, and the hourly traffic congestion on the main roads in Wuhan was obtained through the open API interface of Baidu Maps to measure the overall road traffic congestion in the study area. A total of 15,432,210 data were collected from 1 March 2018 to 31 March 2018. Table 2 shows some of the original data. The “Statue” field in the table represents the congestion of the current road in Baidu Map, where “1” means the road is unobstructed and “5” means serious congestion. The cost of time through the road is used to represent the congestion score, which is recorded as the “value” field. The calculation process is as follows: congestion = (1 − expedite) + congested × 2 + blocked × 5.
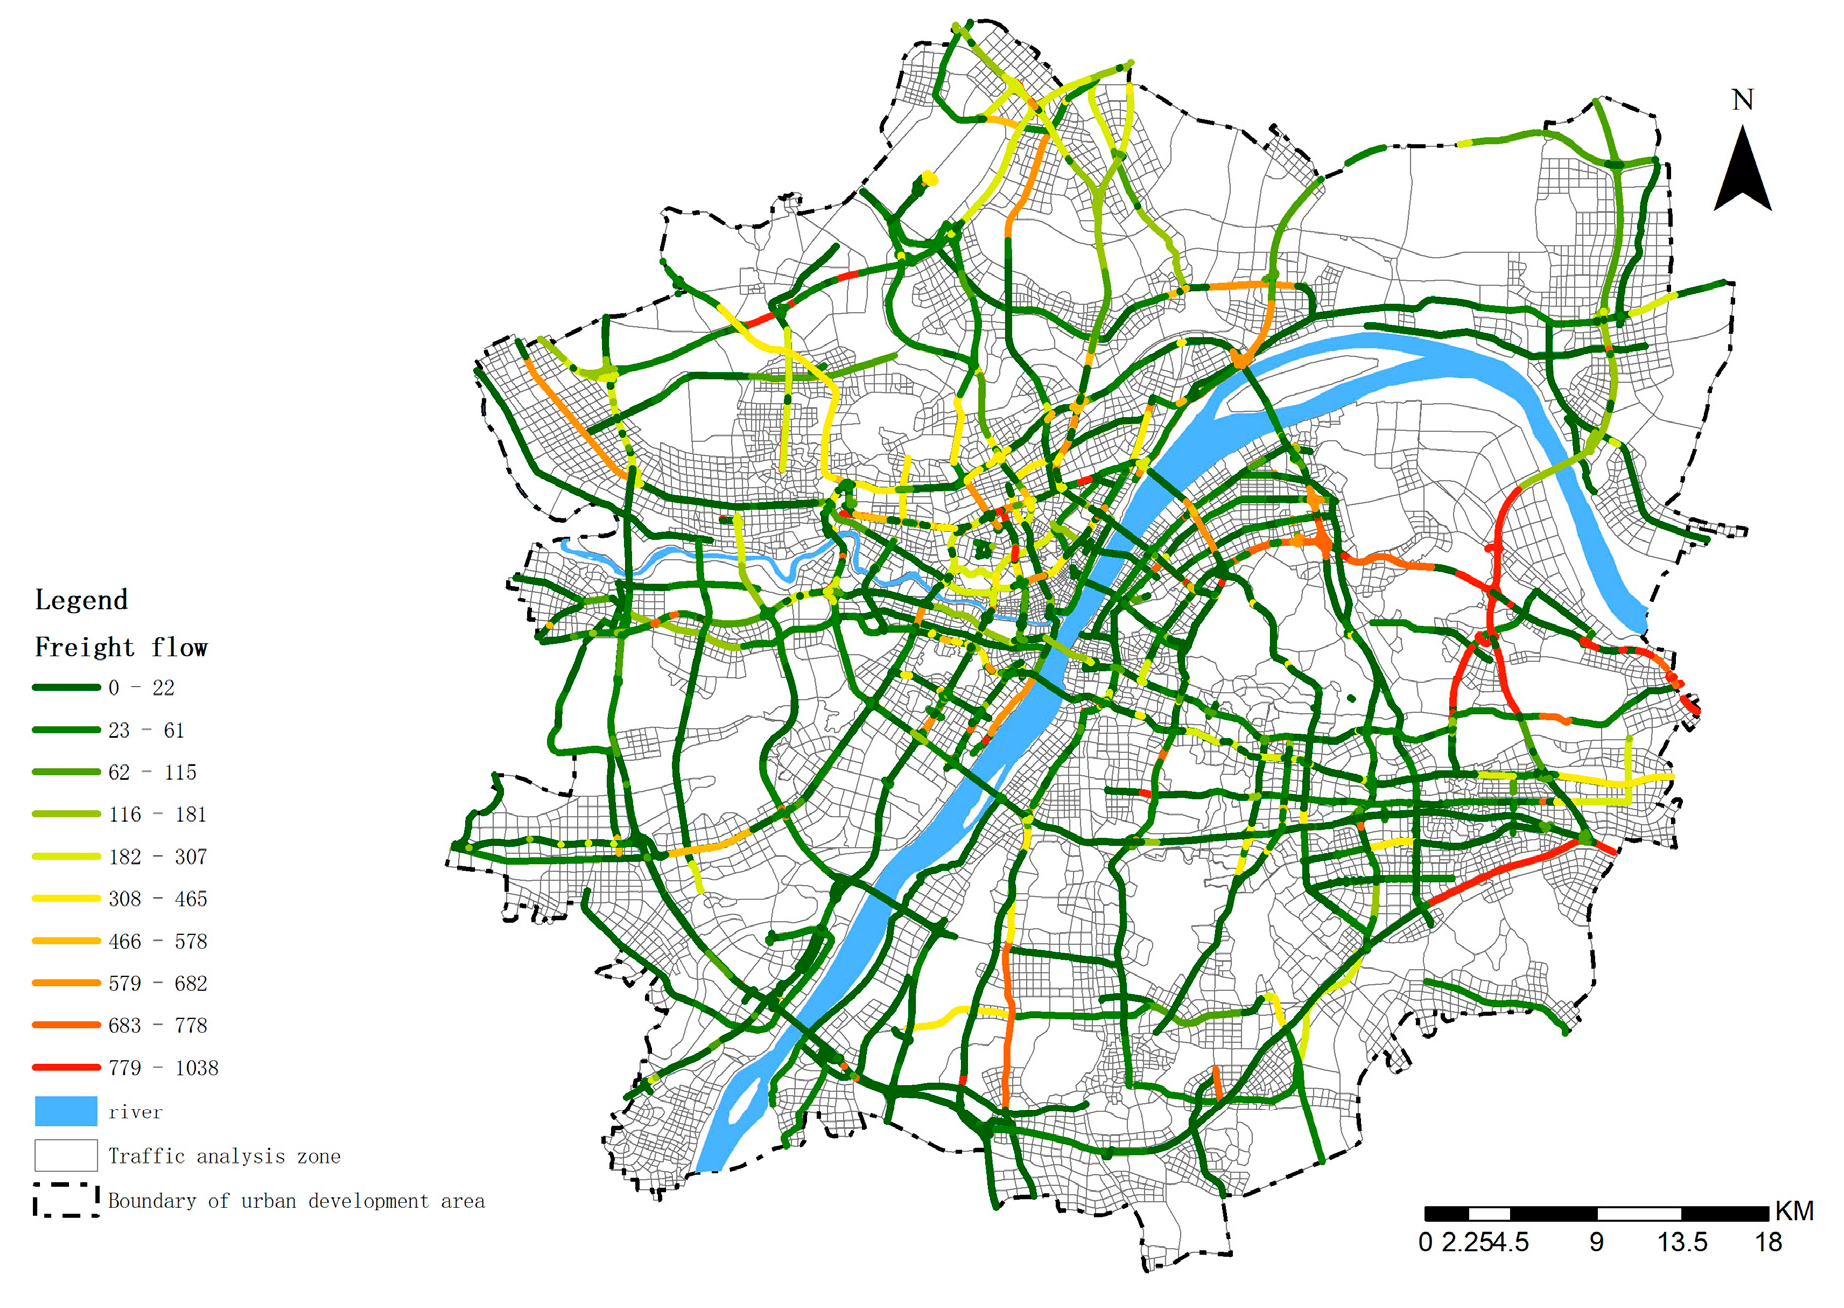
The freight corridor flows were obtained from the truck GPS monitoring data provided by Wuhan Truck Management Company. The daily average truck flows of the major freight corridors in Wuhan were monitored from 1 March 2018 to 31 March 2018, and a total of 1,072,815 data were obtained.
3.3. Data Pre-Processing
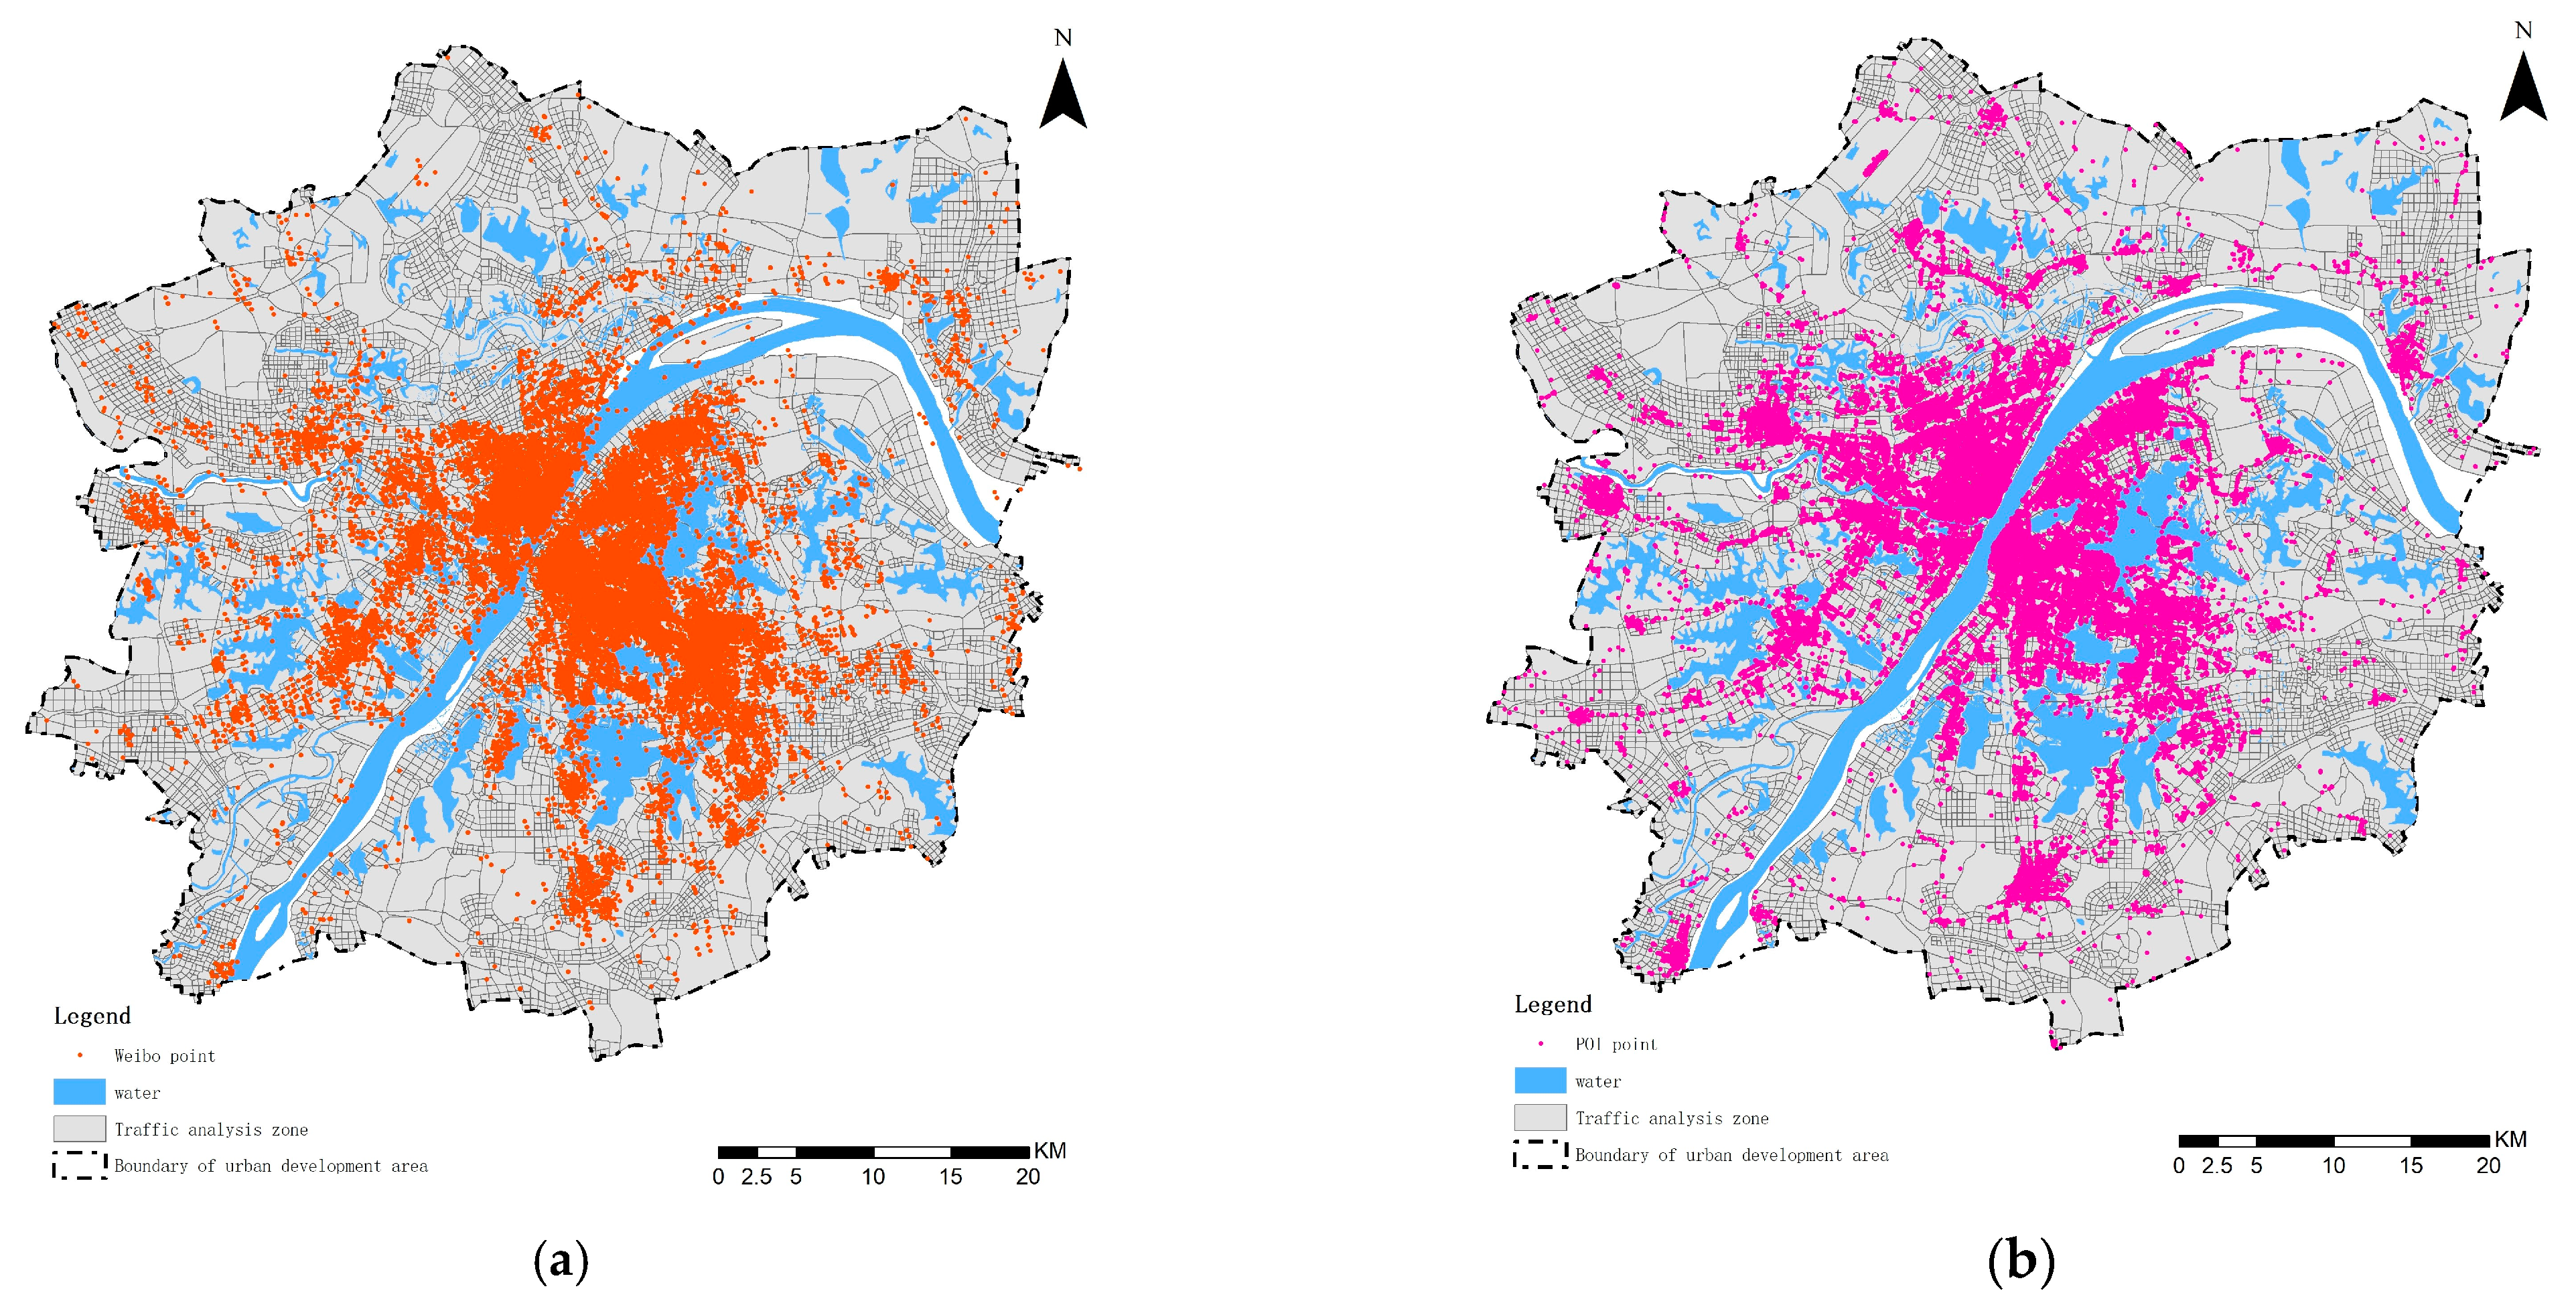
In the early stage of this study, the original Weibo data needed to be screened to ensure their validity and also to improve the accuracy of the results. First, since Weibo data contains not just subjective emotions, it is necessary to remove data that do not reflect subjective opinions and contain only blank text such as images and videos. Second, the ArcGIS10.7 tool was used to filter and delete Weibo data from surrounding areas whose search range exceeds the range of the Wuhan Urban Development Zone. Third, using JIEBA and term frequency–inverse document frequency (TF-IDF) methods to extract the subject words of each data, the data was filtered based on the subject words to get the topics related to the urban built environment [52]. Finally, we obtained 883,440 check-in data entries. Similarly, the POI data were cleaned using geographic coordinates (latitude and longitude) to obtain 101,954 POIs located within the urban development zone of Wuhan. The POIs were classified into seven categories based on attributes: transportation facilities, park square areas, scenic spots, leisure and entertainment, shopping services, restaurant services, and medical service facilities.
The Weibo check-in data and POIs were imported into ArcGIS 10.7, and after pre-processing, such as coordinate correction, a distribution of the check-in points and POI points in the study area was generated (Figure 3).
To express the average performance of the dynamic urban road traffic congestion in March 2018, the daily traffic dynamics data generated during the same time of year were averaged, and weights were assigned on an hourly basis to obtain the average urban road traffic congestion score. The freight corridor data were processed in the same manner. Figure 4 shows the results, where the congestion conditions of low-level roads are not shown because of display effect considerations.
4. Methods
4.1. Lexicon-Based Emotion Analysis of Weibo Text
4.1.1. Splitting of the Weibo Text
Participle is to cut the Weibo text into individual words according to Chinese grammar rules. In the process of element selection, different word participle effects directly affect the emotion scores of words, thus affecting the results of data analysis [53]. Weibo text data have the characteristics of short text content, a high degree of colloquialism, an uncritical language structure, and common use of Internet words, which makes the emotion analysis method for Weibo different from conventional text emotion analyses [8]. A total of 245 professional terms and 483 Internet terms were added. Moreover, the more complex forms of Chinese expressions increased the difficulty of performing an emotion analysis of Weibo data.
In this study, the JIEBA word participle was used, which is an open source word separation method with simple installation and high accuracy. It is suitable for analyzing large amounts of text and is widely used by noncomputer professionals [54]. The JIEBA participle analysis has three modes, in which the precision mode word participle can segment the utterance precisely with no overlapping words, which helps solve the ambiguity problem to a great extent. Therefore, this study selects the precision mode of the JIEBA word participle and invokes the cut method to realize the participle of Weibo text. At the same time, since there are some drawbacks in the lexicon in terms of specialized terms and emerging random Internet terms, this study manually added specialized terms related to the urban built environment and some Internet terms to further improve the accuracy of the word participle. After the word participle, we used the deactivation word list of HIT and the deactivation word database of Machine Intelligence Laboratory of Sichuan University to remove the irrelevant deactivation words and obtain the processed Weibo text.
4.1.2. Integration of Emotional Lexicon
Loading of the Emotion Lexicon
The rule-based emotion lexicon approach is an intuitive and effective method for emotion analysis [55]. The emotion lexicon is a collection of words or phrases labeled with emotion intensity, which are of any lexical nature and can be nouns, verbs, or adjectives. Emotion words are typically polarized into positive and negative emotion words, and the scores of emotion words can be quantified. For example, the emotion of the word “like” is positive, whereas the emotion of the word “dislike” is negative.
This study uses the How Net emotion lexicon as the basis for emotion analysis [56]. How Net emotion lexicon is widely used for emotion analysis in social situations. Liu and Li proposed to establish a believable vocabulary on semantic knowledge named How Net, and then obtained the sentiment polarity of words through comparison with the similarity between the words [57]. Zhu succeeded in judging the semantic orientation of Chinese online reviews based on the How Net lexicon [58]. Casas-Garriga proposed the emotion word polarity calculation method based on the semantic similarity and semantic correlation of How Net lexicon [59], in which the positive emotion word levelness was 1 and the negative emotion word levelness was −1.
Complement of Negative Vocabulary and Degree Adverbs
The presence of negative vocabulary tends to change the emotional tendency of an utterance, and the degree adverbs in a sentence have an important influence on the intensity of emotion [60]. This study adds and integrates the commonly used negative vocabulary and adverbs of degree in How Net to obtain a more comprehensive negation word database and adverbs of degree database.
The database of negative vocabulary was obtained by supplementing the How Net negative vocabulary; the common negative words are listed in Table 3. In addition, the number of negatives preceding the emotion word reverses the emotion polarity. In case of odd numbers, the intensity of the sentiment word is multiplied by −1, and in the case of even numbers, it is multiplied by 1.
The How Net list of degree adverbs was supplemented to obtain 219 degree adverbs. The degree adverbs were divided into six levels, representing different strengths and weaknesses of emotional tendencies. Each level was assigned a different weight value according to the gradient descent formula, and the gradient descent formula was expressed as follows.
where is the weight value of the first level “extremely, most”; the constant is the gradient descent rate. The grading of the degree adverbs used in this study is shown in Table 4.
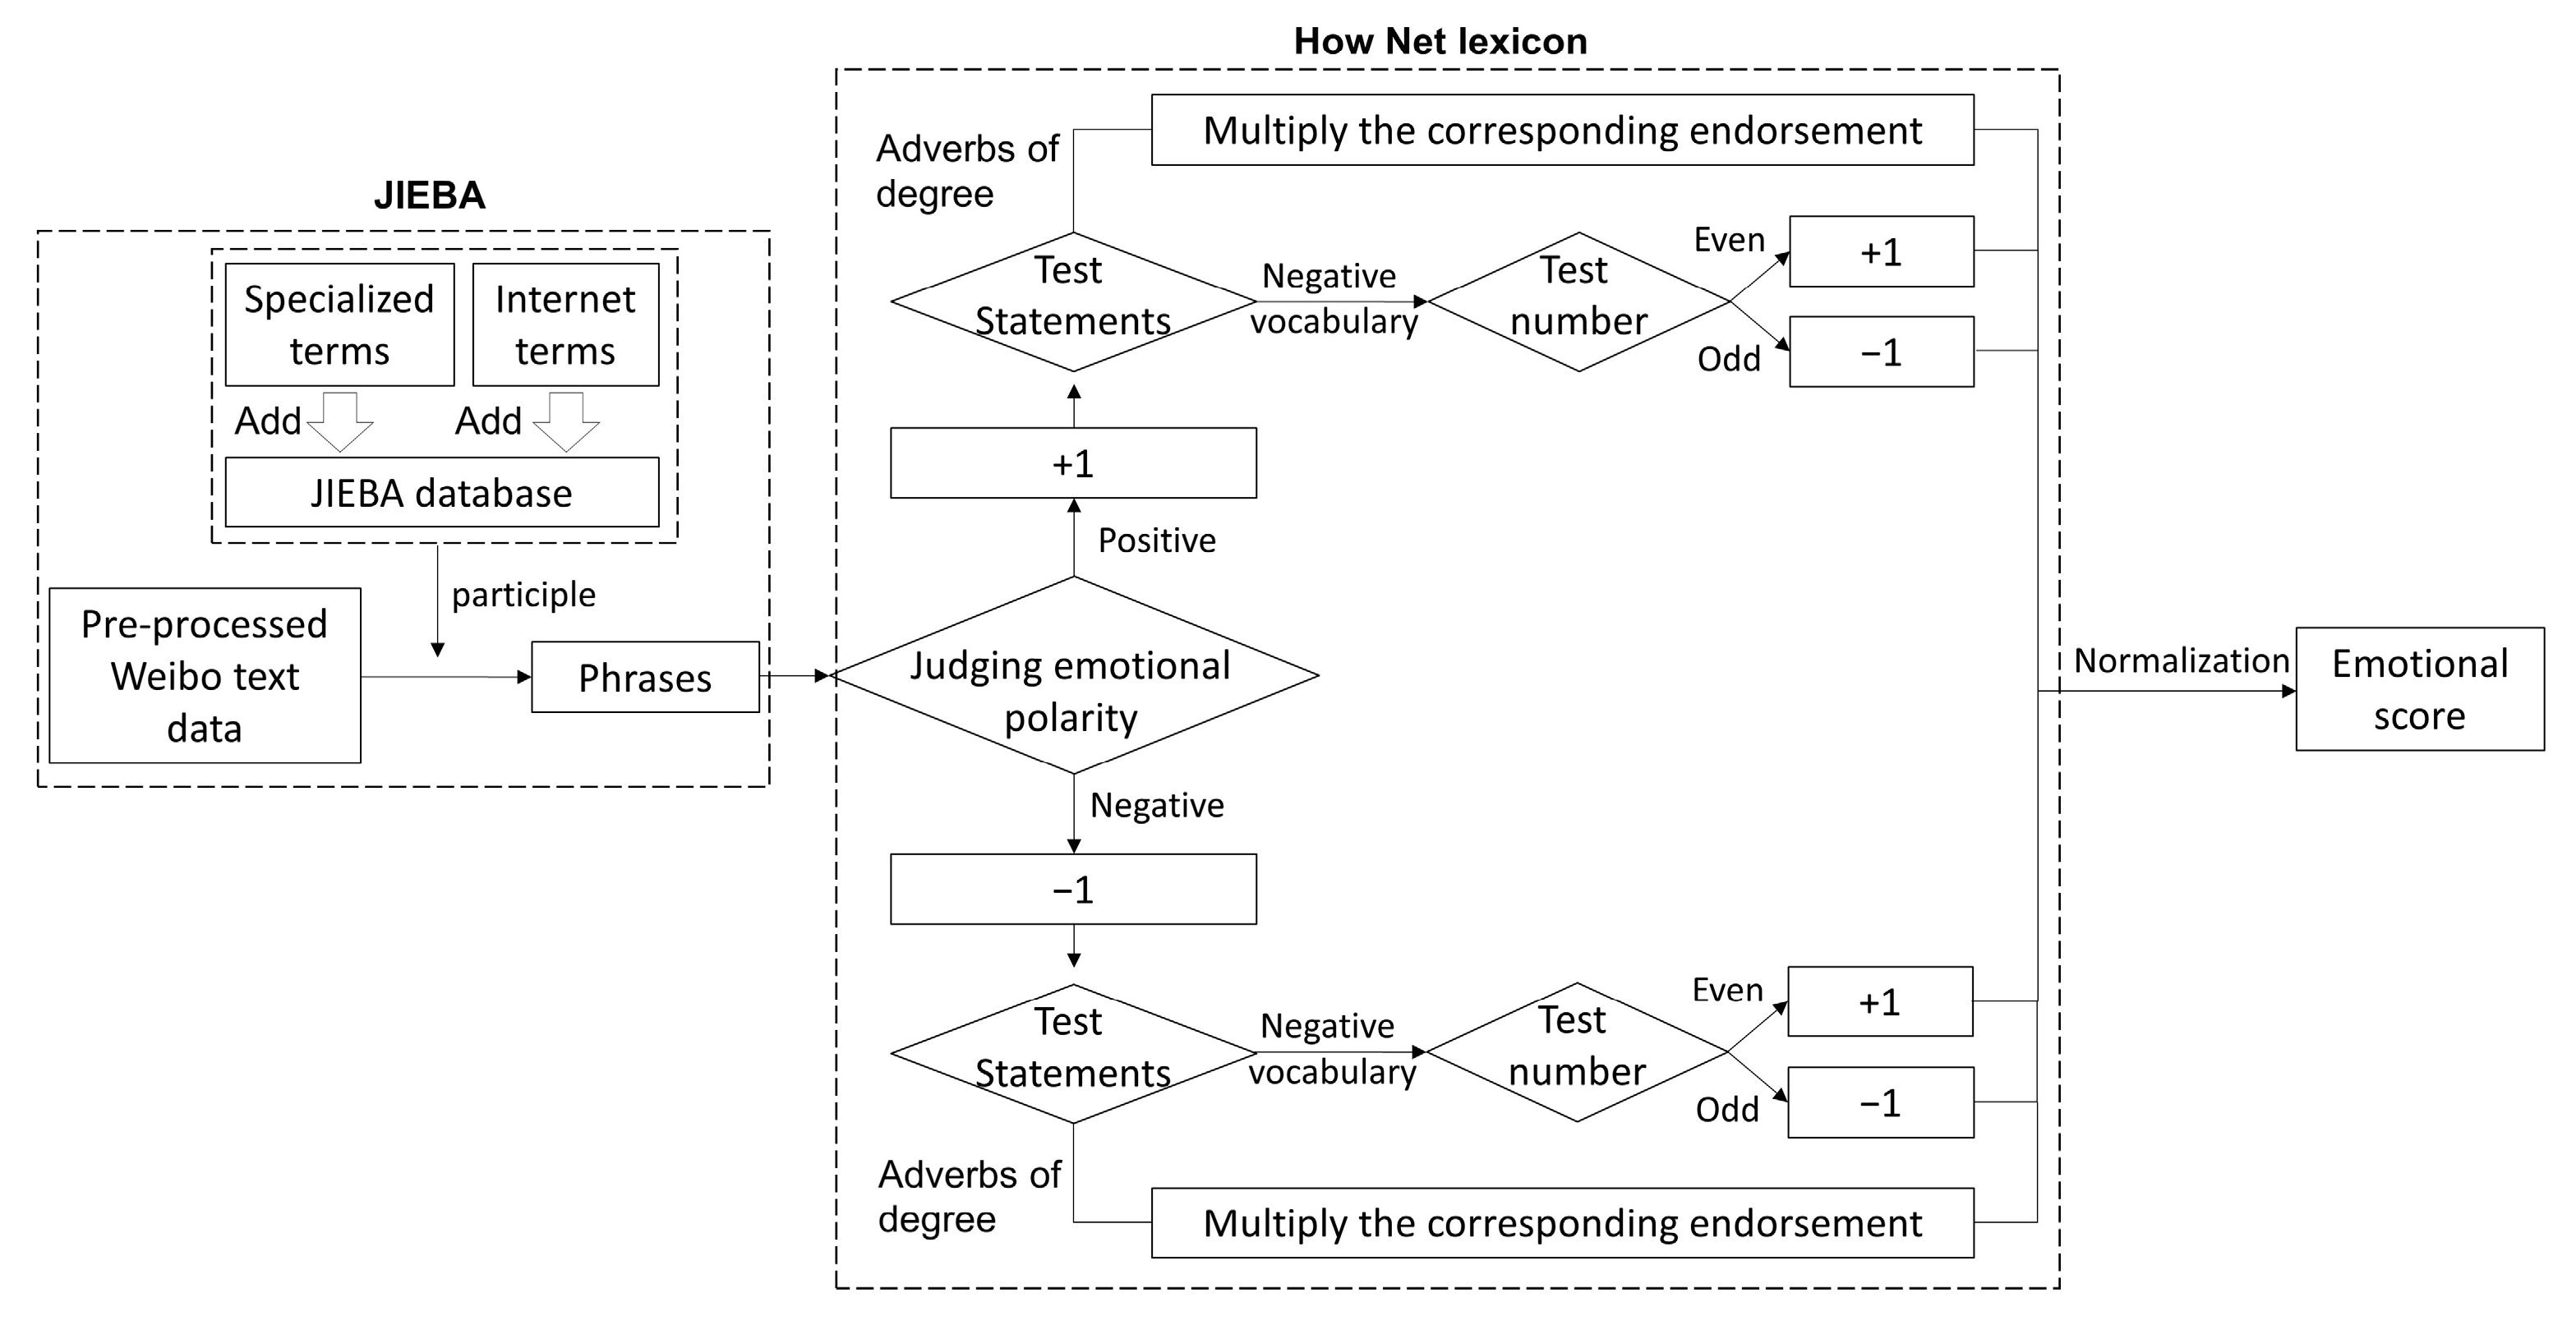
4.1.3. Algorithmic Rule Construction for Weibo Emotion
This study is based on the emotion classification method using How Net lexicon, supplemented by negative vocabulary and degree adverbs, and integrated to obtain the emotion lexicon. The emotion value of the Weibo text is calculated for the emotion words, expressions and symbols, negative vocabulary, and degree words in the text after the word participle process. The specific method is as follows: Python is used to read the emotion lexicon, negative vocabulary database, and degree adverbs database. Each text is traversed, divided into words and compared with the integrated emotion lexicon, with a score of 1 if it is a positive word and −1 if it is a negative word. If the degree adverbs appear in the sentence, the score is multiplied by the weight indicator. For the presence of negative words, an even score is multiplied by 1 and an odd score is multiplied by −1. Subsequently, the emotion scores are calculated. To better demonstrate the distribution of the emotion scores, the scores are normalized and distributed in the [−1,1] interval. Figure 5 shows the specific algorithmic model.
Based on the algorithm model, the accuracy of the emotion analysis of the Weibo text based on the sentiment lexicon was tested to be approximately 81.25%.
4.2. Construction of Urban Built Environment Index System
Based on previous research on the relationship between emotions, urban space and behavioral activities, and built environment, in this study 15 built environment-related elements were selected from five aspects, namely land use, spatial form, road and traffic, green and open spaces, and daily life service facilities, to construct a system of urban built environment indicators (Table 5) [5,27,28,29,61].
The mix of parcels for various uses creates a diverse urban built environment. This study uses POI data, which represents the most fine-grained land use, to measure the mixed degree of land use in cities [62]. Mixed degree of land use is quantified by using the spatial entropy of the POI, with higher entropy values indicating more functional types and a higher mixed degree. The spatial entropy calculation formula is expressed as follows.
where refers to the number of a certain type of POI in the -th TAZ, is the total number of POIs in the -th TAZ, and is the spatial information entropy.
4.3. Geographically Weighted Regression
The GWR model, proposed by Fortheringham et al., is a refined model for a local spatial correlation analysis based on the conventional general linear regression analysis and parametric analysis [63]. The model embeds the geographic location of sample data into regression parameters and calculates the local regressions of the observations in the data and similar observations in its vicinity to overcome the shortcomings of general linear regression models. In recent years, the GWR has been widely used in the field of urban planning to study the factors influencing urban transportation, urban public space, and urban vitality [64,65]. The coefficients of the variables in this model can be visualized in an identifiable manner to provide better support for analyzing Weibo check-in behavior. Considering the spatial heterogeneity of sentiment distribution, this study uses the GWR model to describe the spatial relationship between emotion values and the built-up urban environment in a more refined way. The model is defined as follows.
where the dependent variable is the average emotion of each traffic cell, is the intercept value and is a constant, is the geographic coordinate of the sampling point, is the characteristic elasticity coefficient at sampling point , and is the random error.
The regression coefficients of the GWR were estimated using a locally weighted least-squares method based on the decay of the distance influenced by the observations around the spatial location of each TAZ . The estimated parameters can be expressed as follows.
In this study, the most commonly used Gaussian kernel function was employed as the estimated weight function to represent the relationship between the weights and distances . The matrix representation is as follows.
where represents the bandwidth, a non-negative decay parameter as a function of the distance between the weights. The higher the bandwidth, the slower the influence decay of the weights as the distance between locations . and increases. The choice of bandwidth has an important influence on the GWR results. The corrected Akaike information criterion (AICc) method was chosen in this study to select the appropriate bandwidth.
5. Results
5.1. Distribution of Emotions
5.1.1. Score Distribution of Emotions
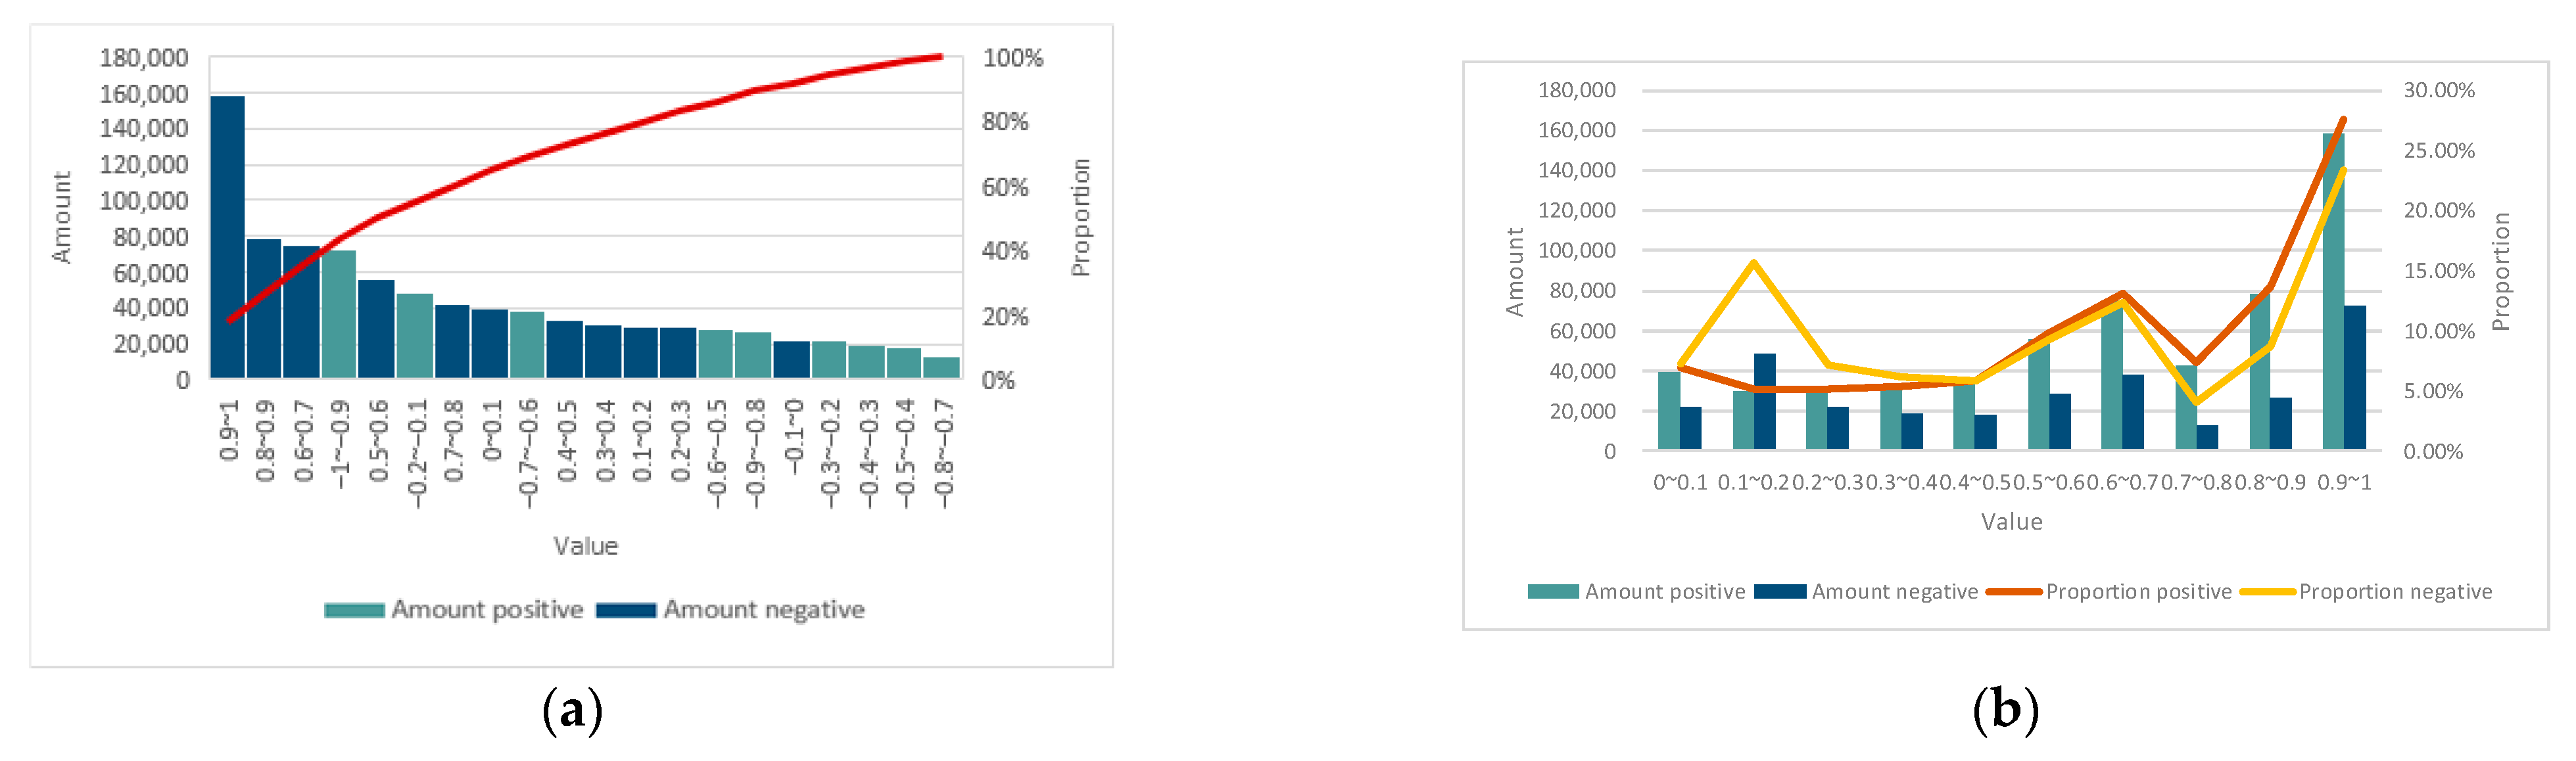
To study the characteristics of public emotion distribution within the urban development zone of Wuhan, this study scored the pre-processed Weibo texts individually. The scores were taken as absolute values and the processed results were tallied according to two categories to further analyze the intensity distribution of positive and negative emotions. A positive emotion score indicates that the emotions in the text content are positive, and the higher the score, the greater the positivity of the emotions; a negative emotion score indicates that the emotions in the text content are negative and pessimistic, and the higher the score, the greater the negativity of the emotions [8,14]. Table 6 presents the statistical data related to the emotion score distribution. The statistical results show that there are significantly more positive emotions than negative emotions in the study area, and compared to positive emotions, negative emotions have a more pronounced polarization phenomenon. The highest numbers are in the strong emotion interval of 0.8–1, and the distribution of the second strongest emotion interval of 0.6–0.8 and the weak emotion interval of 0–0.2 are more in number, with evident changes in the emotional intensity.
A further decomposition of the emotion scores was performed (Figure 6). The results showed that positive emotions accounted for a significantly higher proportion in the overall emotion than negative emotions, and the balance of the distribution of the negative emotions was slightly higher than that of the positive emotions. The positive emotion scores were mainly distributed in the intervals of 0.9–1, 0.8–0.9, and 0.6–0.7, indicating a strong emotional tendency. The negative emotion scores were mainly distributed in the intervals of −1–−0.9 and −0.2–−0.1, with evident differences in emotional tendencies.
5.1.2. Spatial Distribution of Emotions
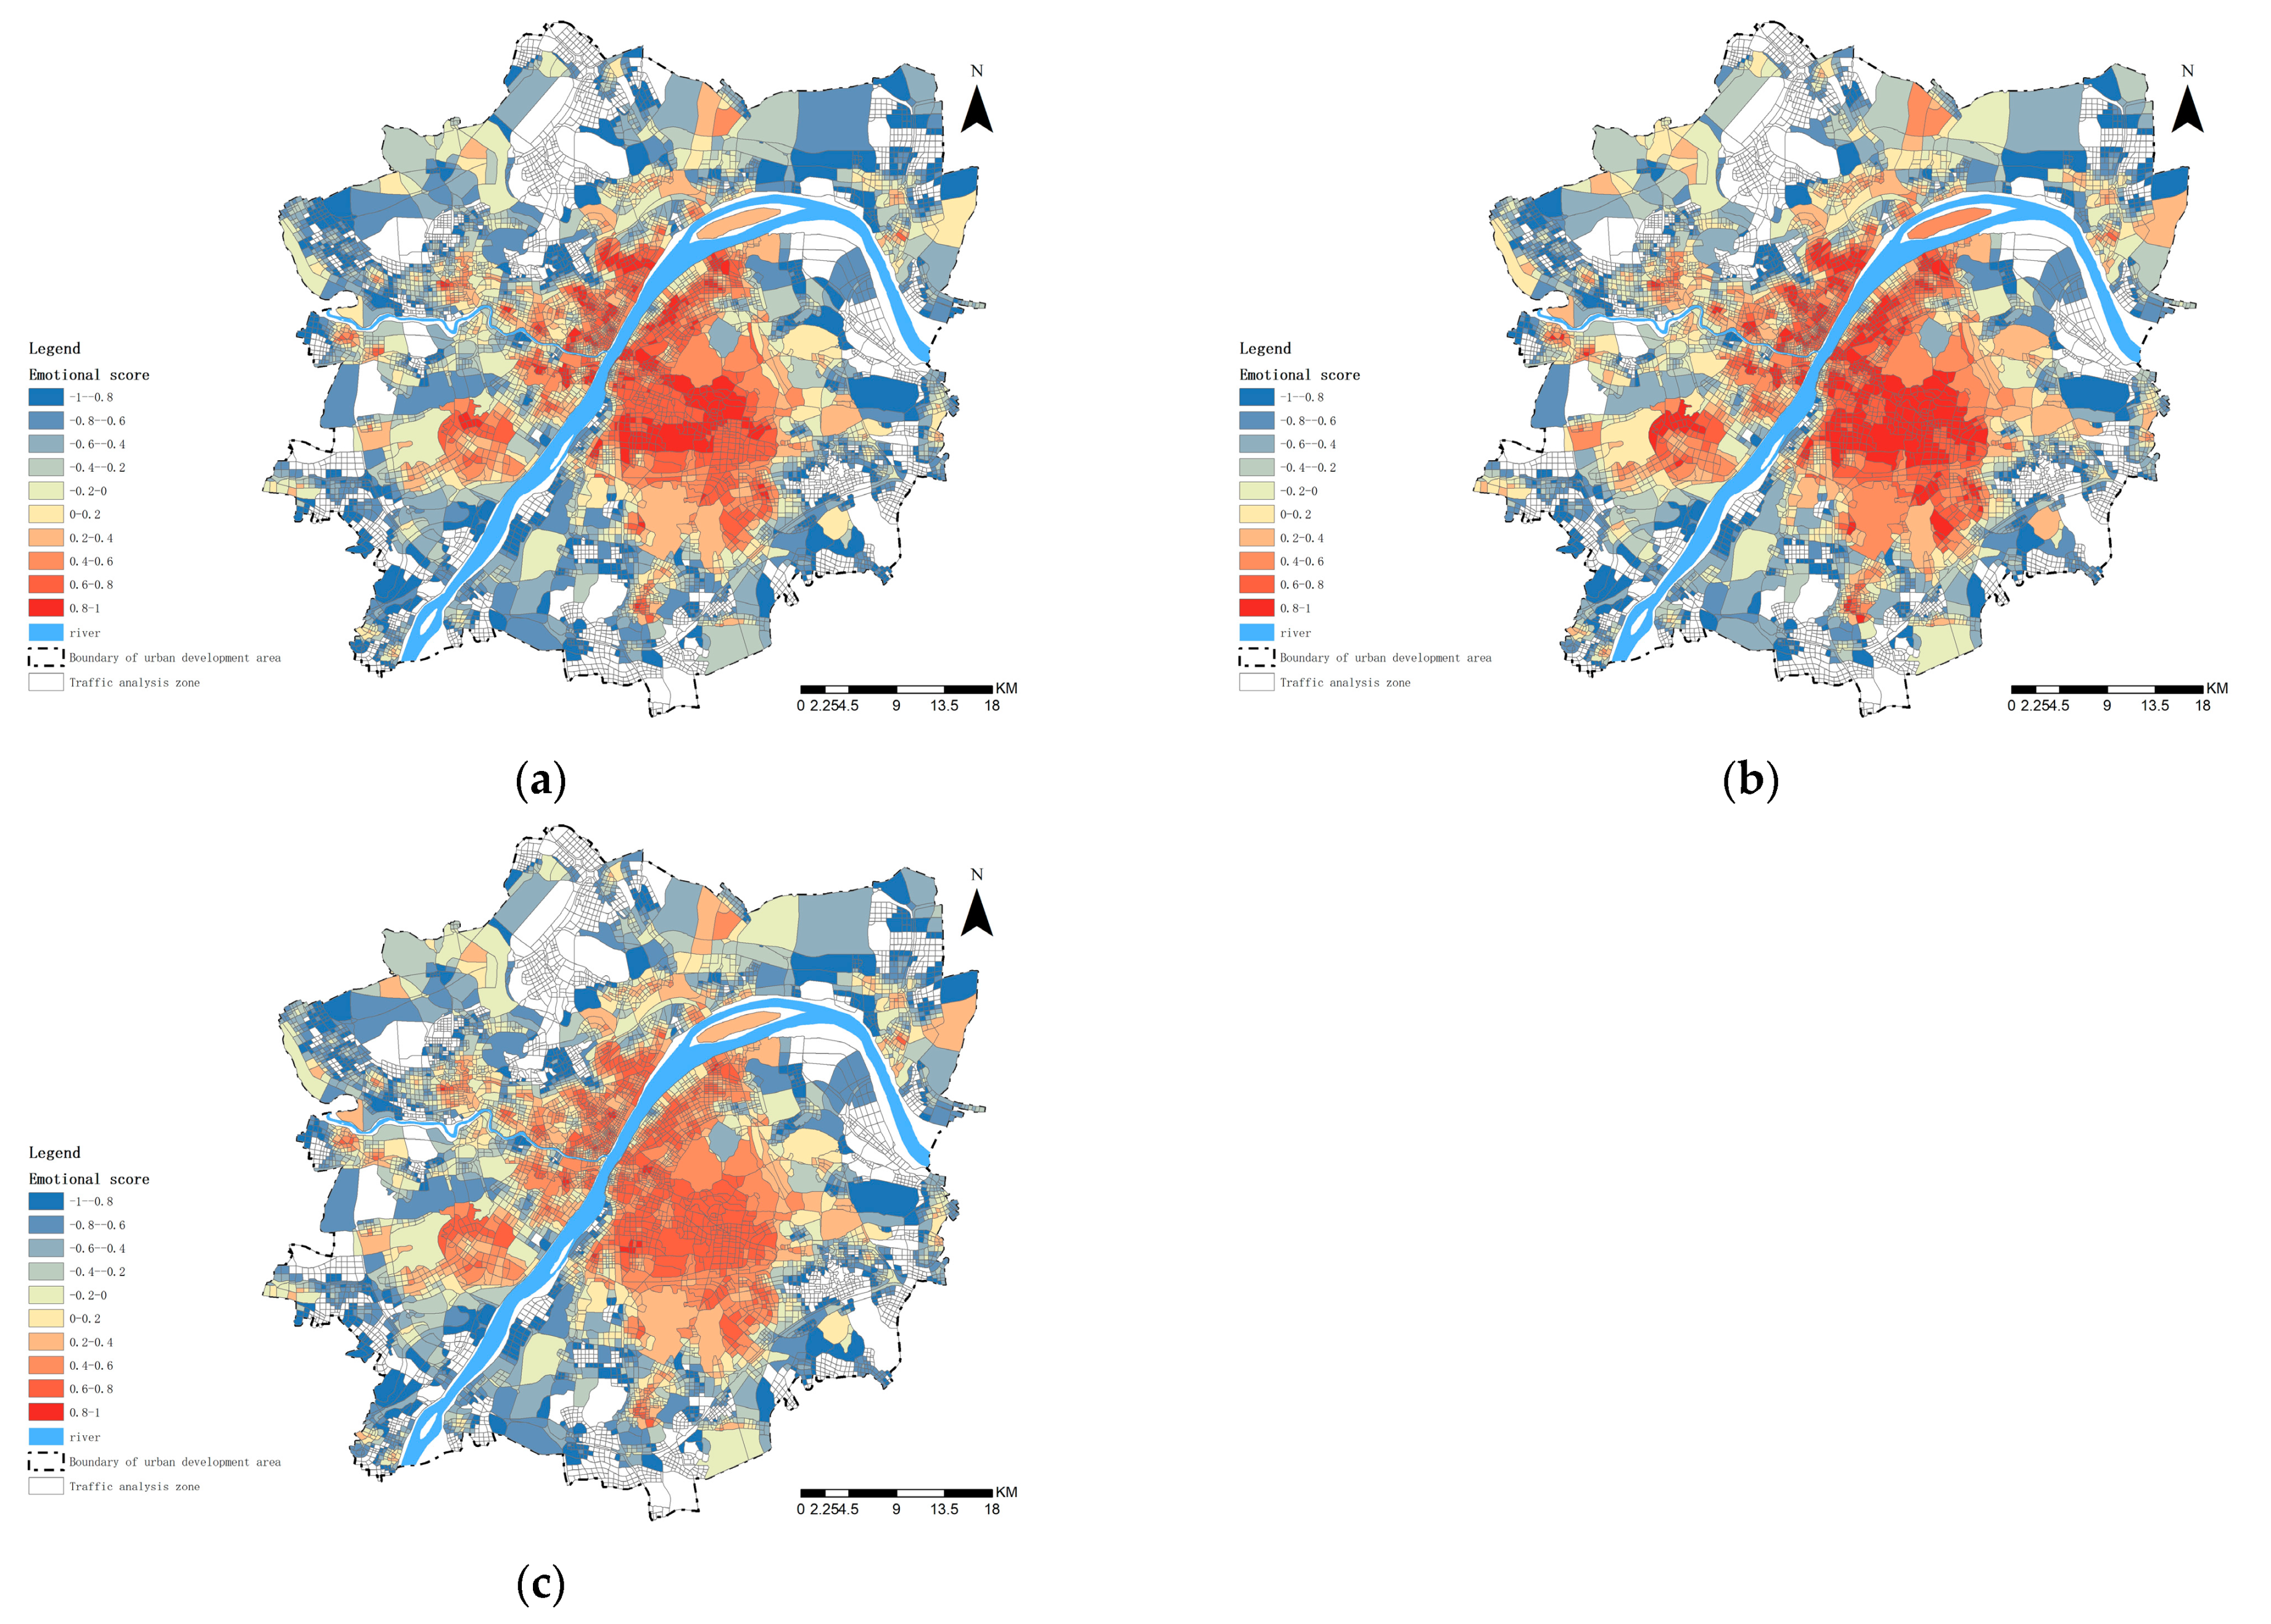
To more fairly represent the spatial distribution of emotions within the study area to further explore the spatial distribution characteristics of the emotions instead of individual emotion points, this study used the geographic coordinate information of Weibo data to synthetically calculate the average of the internal emotion point scores of each TAZ, and comprehensively analyze the spatial distribution of emotion score from the average, the top, and lowest quartile. Figure 7 shows the results.
From the overall spatial distribution of the emotions, the scores of the main city center are significantly higher than those of the surrounding new cities in all three aspects. The emotion scores of the Wuchang area east of the Yangtze River are significantly higher than those of the Hankou and Hanyang areas in the west, showing distribution characteristics of strong positive emotions and weak negative emotions. The distribution of the emotions in new cities shows more evident clustering characteristics, and there is a circle-decreasing effect.
Looking at the emotion classification in more detail, positive emotions are mainly distributed along the Yangtze and Hanshui Rivers in the main urban area, with a ribbon distribution feature. Moreover, a small number of positive areas exist outside the main urban area. The proportion of positive emotions in the Wuchang area is the highest, followed by the Hankou area and finally the Hanyang area. The distribution of positive emotion scores is more homogeneous in the Hankou area and varies most within the Wuchang area. Negative emotions are mainly distributed in six new cities in the periphery, and there are evident circle differences; the closer to the main urban area, the less significant the negative emotions, mainly −0.4–−0.2 points. In addition, the closer to the positive emotion gathering point within the new city, the weaker the negative emotions.
5.2. Distribution Characteristics of the Urban Built Environment
In this study, 15 built environment-related elements were selected from five aspects: land use, spatial form, road and traffic, green space and open space, and daily life service facilities, covering both static and dynamic elements, to build a built environment measurement index system. To reflect the spatial distribution pattern of the urban built environment in different dimensions more intuitively, a study was conducted from two aspects: static elements and dynamic elements.
5.2.1. Spatial Distribution of Static Elements
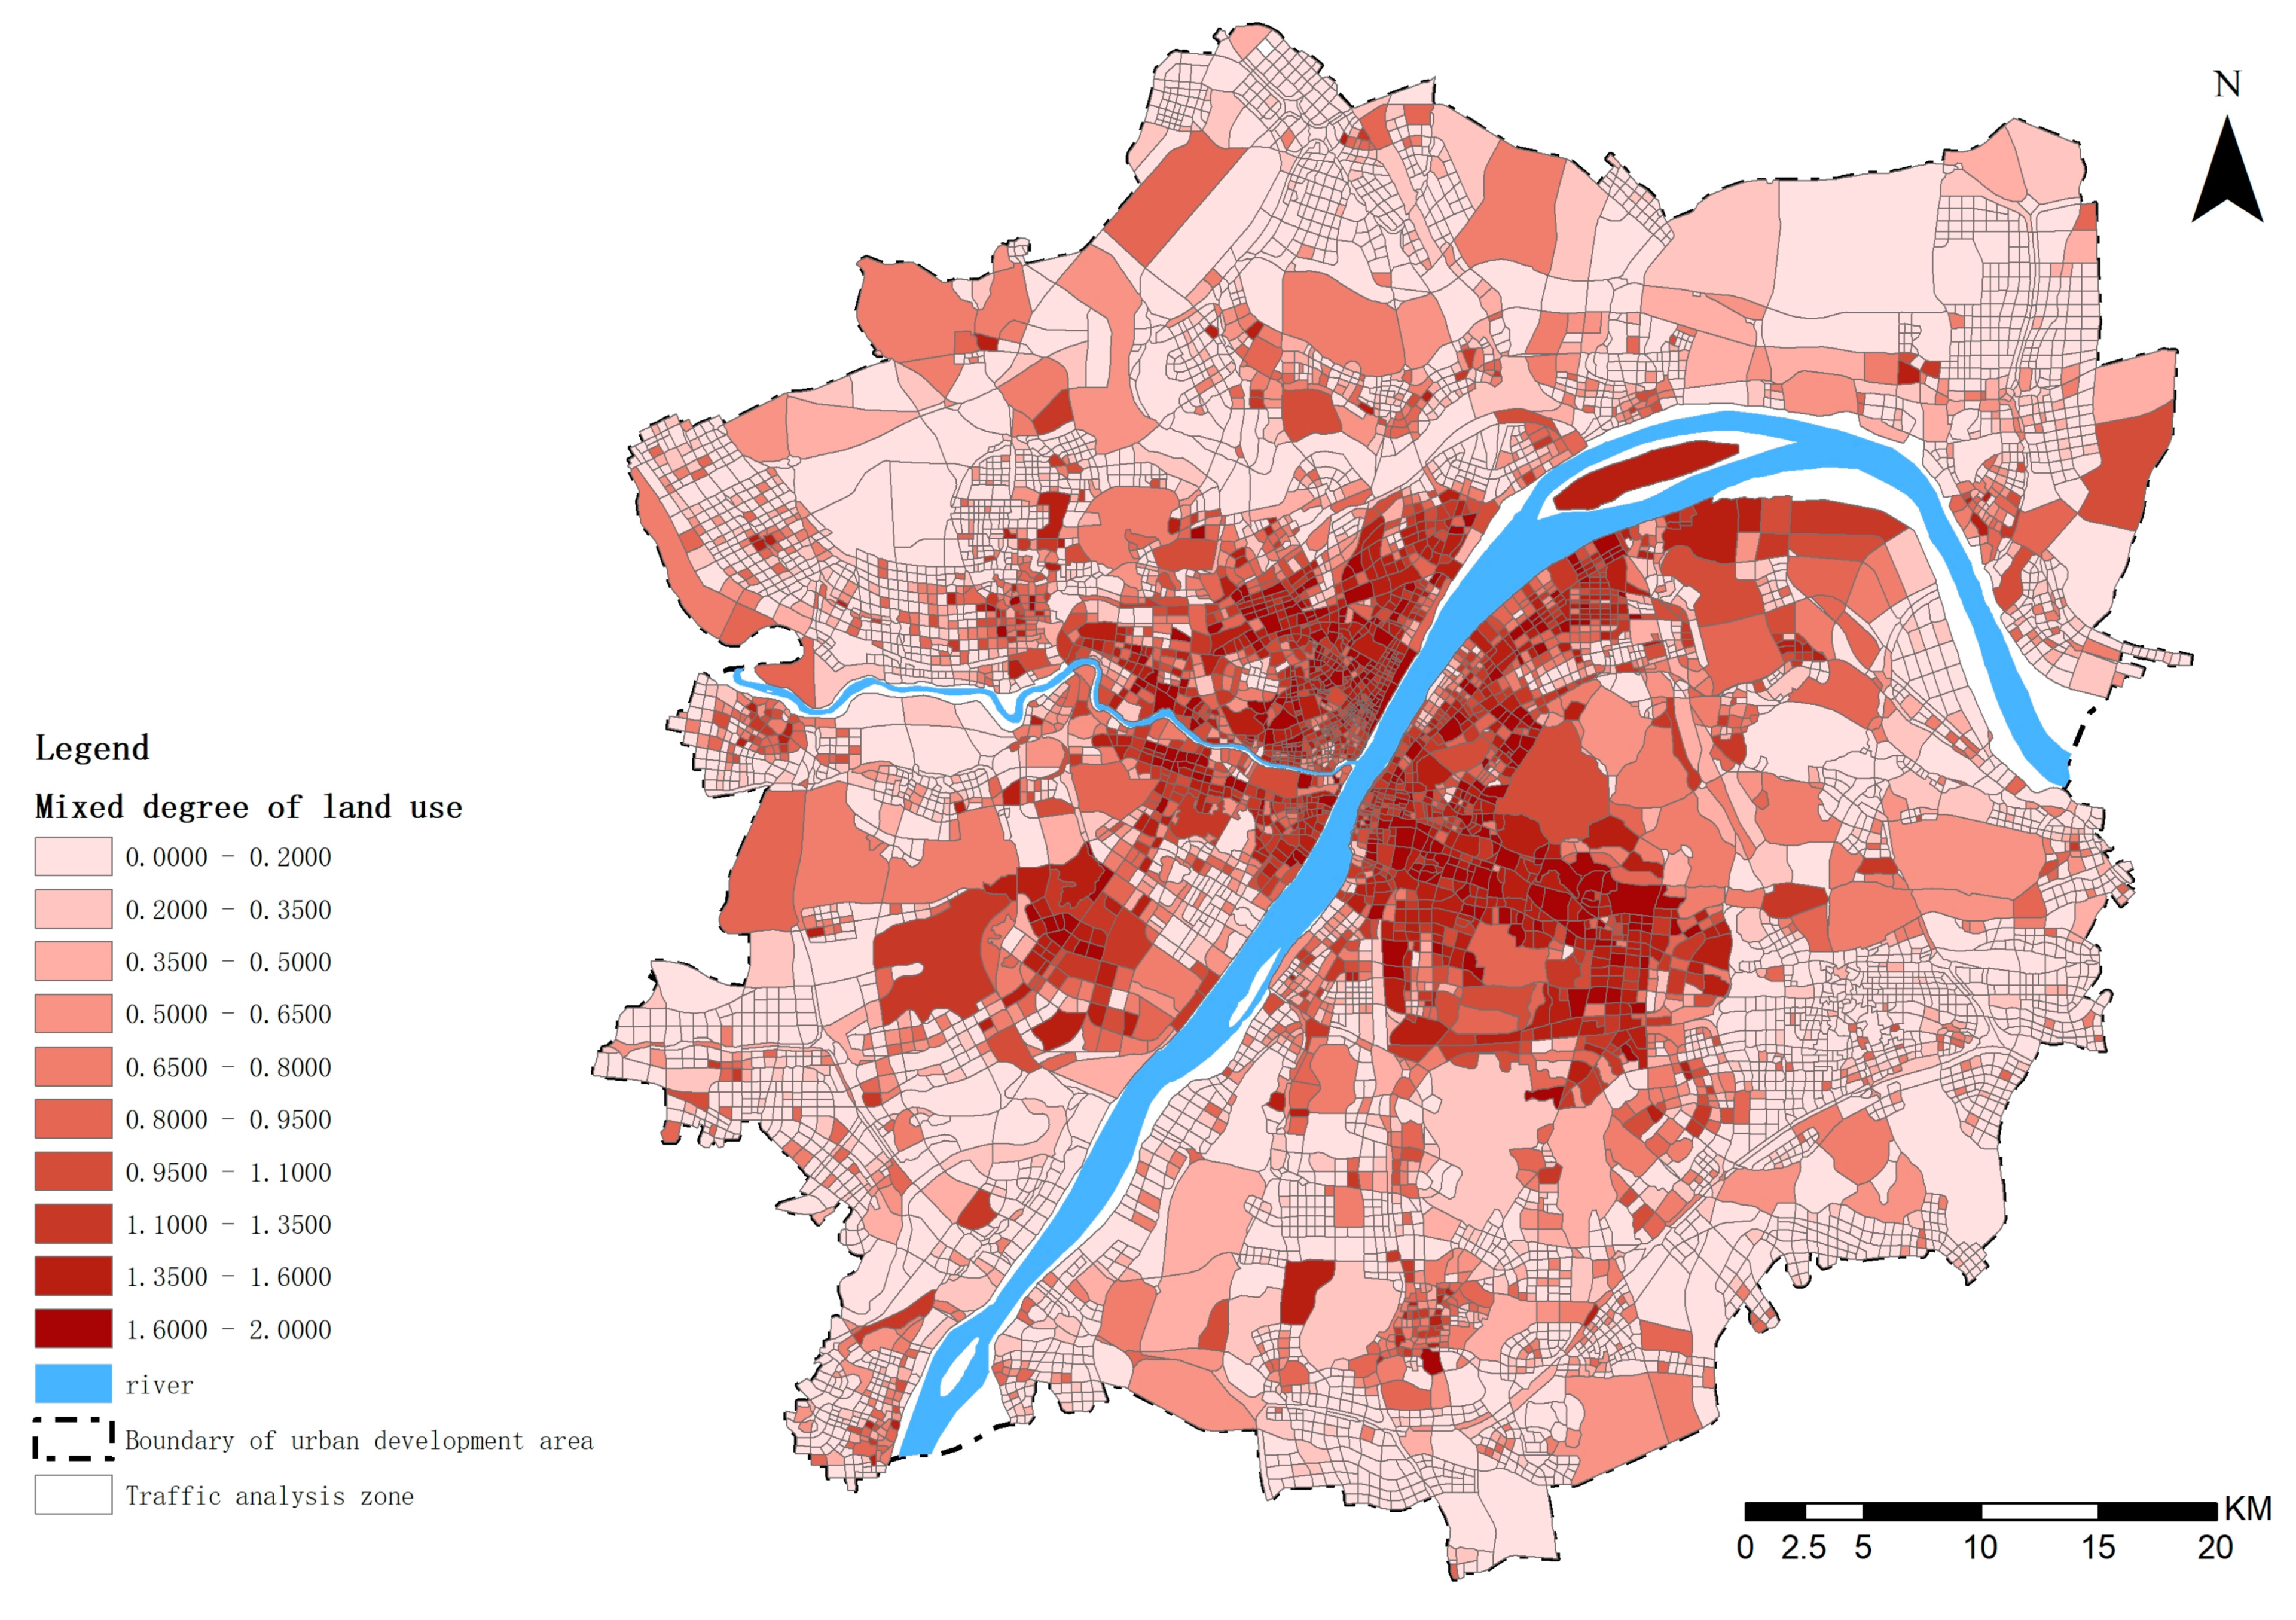
Urban land use reflects the layout of urban functions, and studies have demonstrated that land use has a significant impact on human activities [66]. A mixed degree of land use is a response to the diversity and complexity of land use properties within a particular area in the city, and the higher the mix, the richer the built environment.
The POI entropy index was calculated for each traffic cell to reflect its land use mix (Figure 8). The results showed that the overall land use mix is high in the study area and has significant distributional differences. The closer to the central city, the higher the mixing degree and the more complex the urban functions. The land use mixing degree in Hankou and Wuchang areas is higher than that in Hanyang area, and both have evident functional aggregation areas.
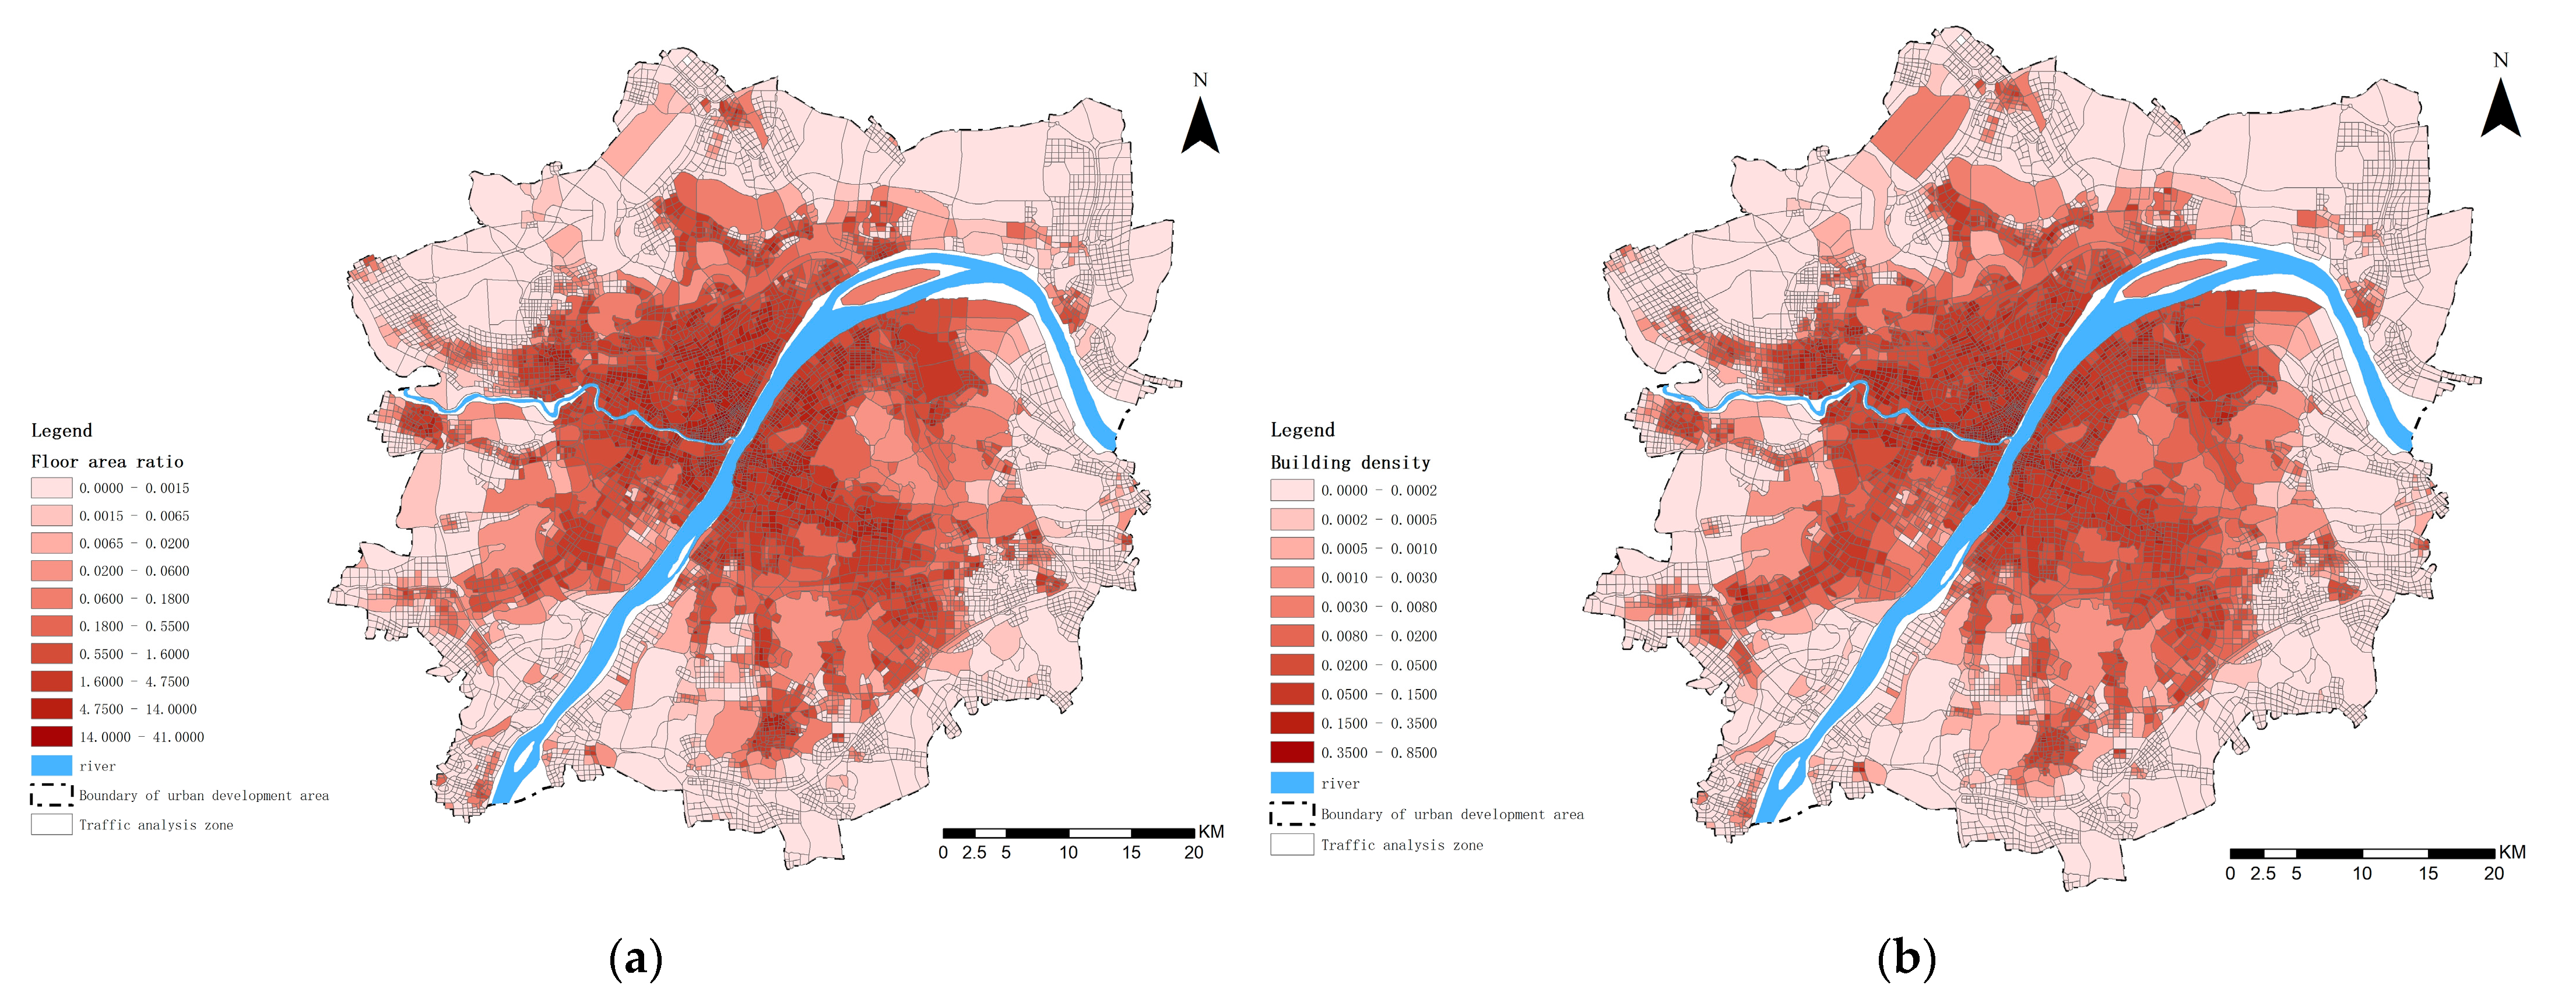
The spatial form of the urban built environment within the TAZ unit was measured comprehensively by calculating two indicators: the average floor area ratio, and building density (Figure 9). The results show that the floor area ratio and building density are generally high in the study area, reflecting a high degree of urban construction and dense buildings. Specifically, there is a consistency in the spatial distribution of the floor area ratio and the building density, both showing the characteristics of high in the central urban area and low in the external areas, indicating an evident circle-decreasing effect. The average floor area ratio in the central urban area is typically in the range of 1.615%–4.755%, and the building density is typically in the range of 13.472%–33.800%.
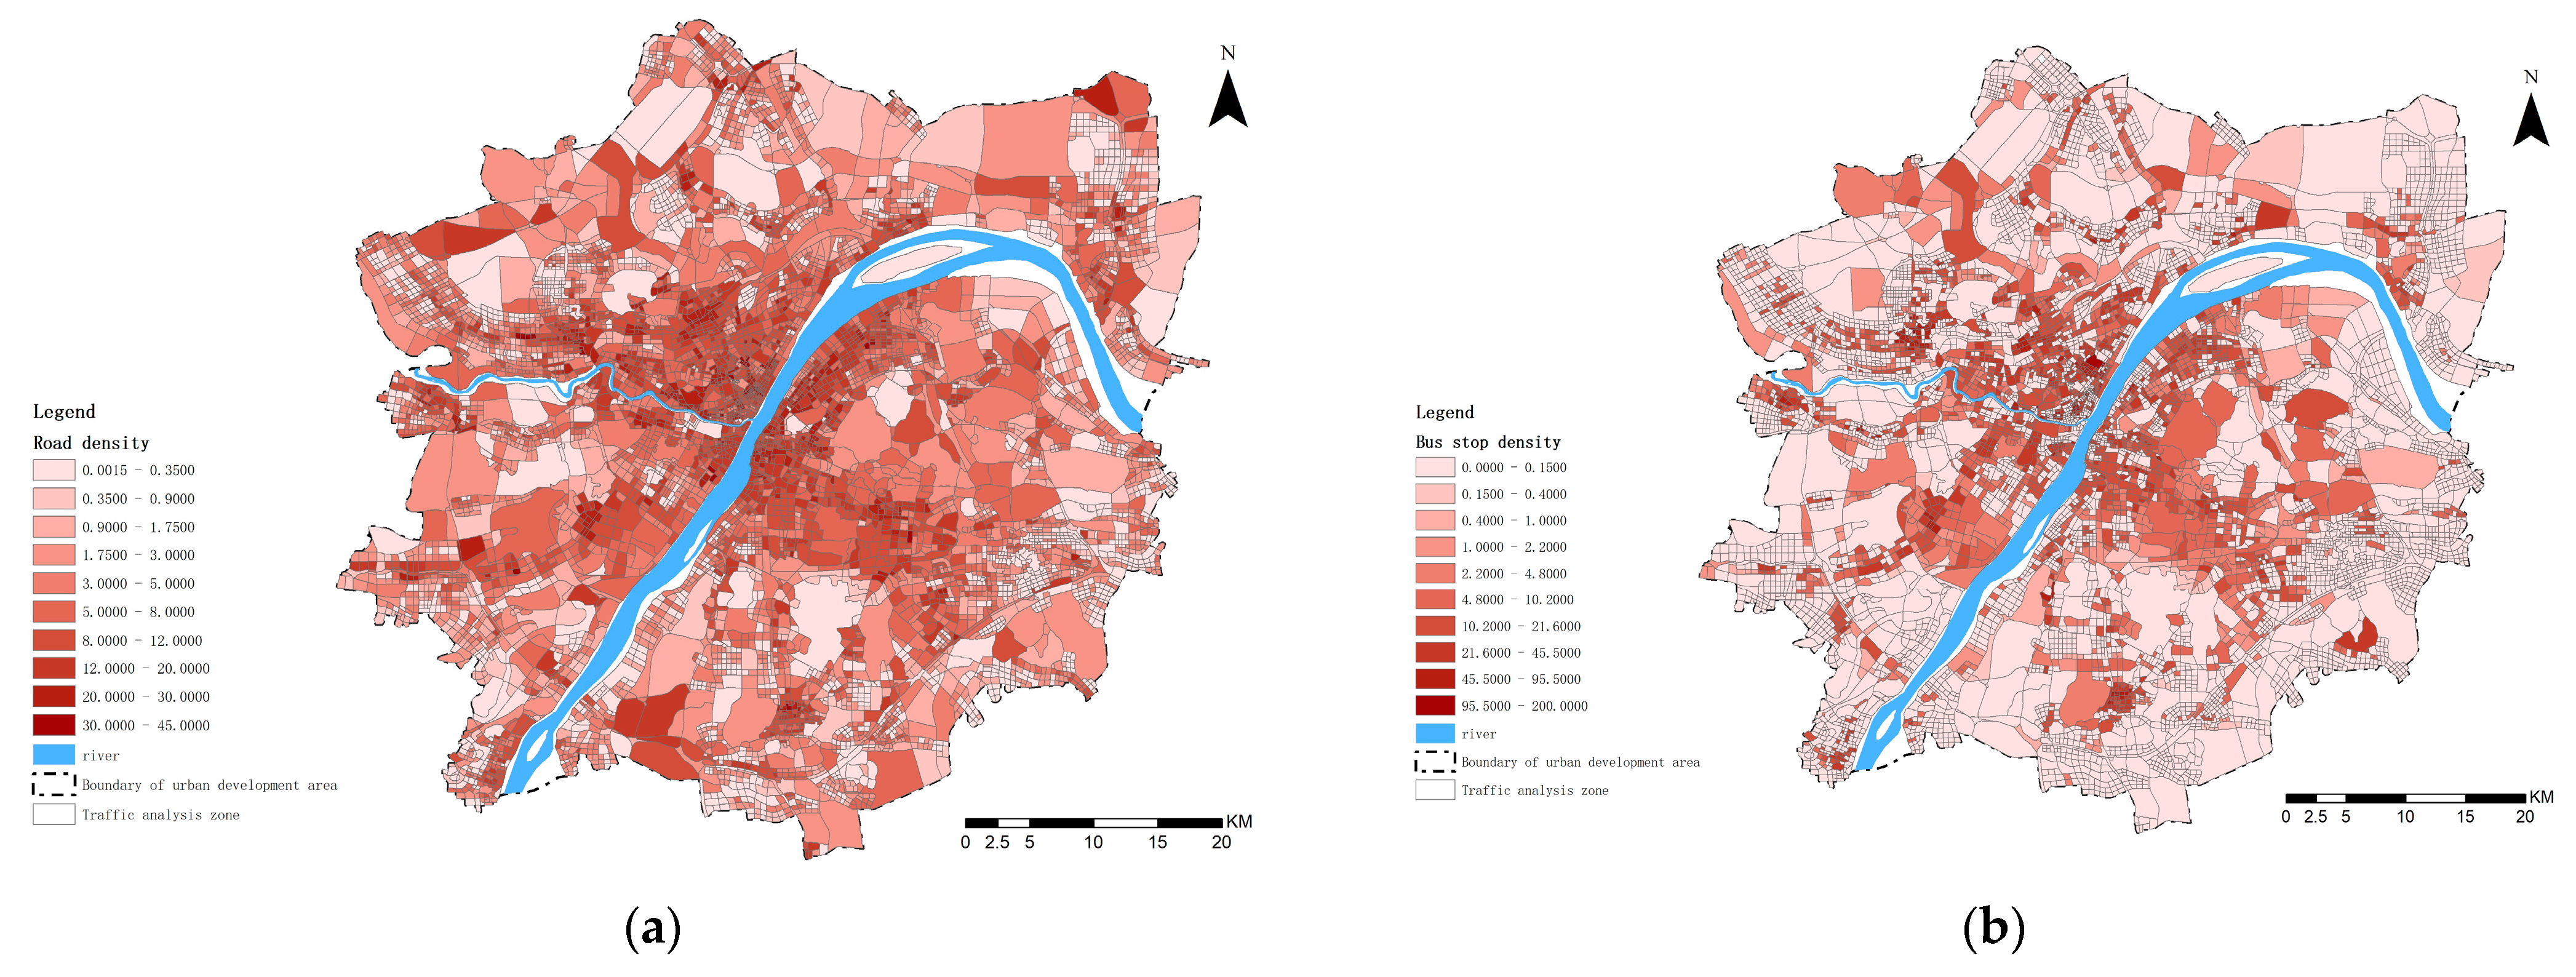
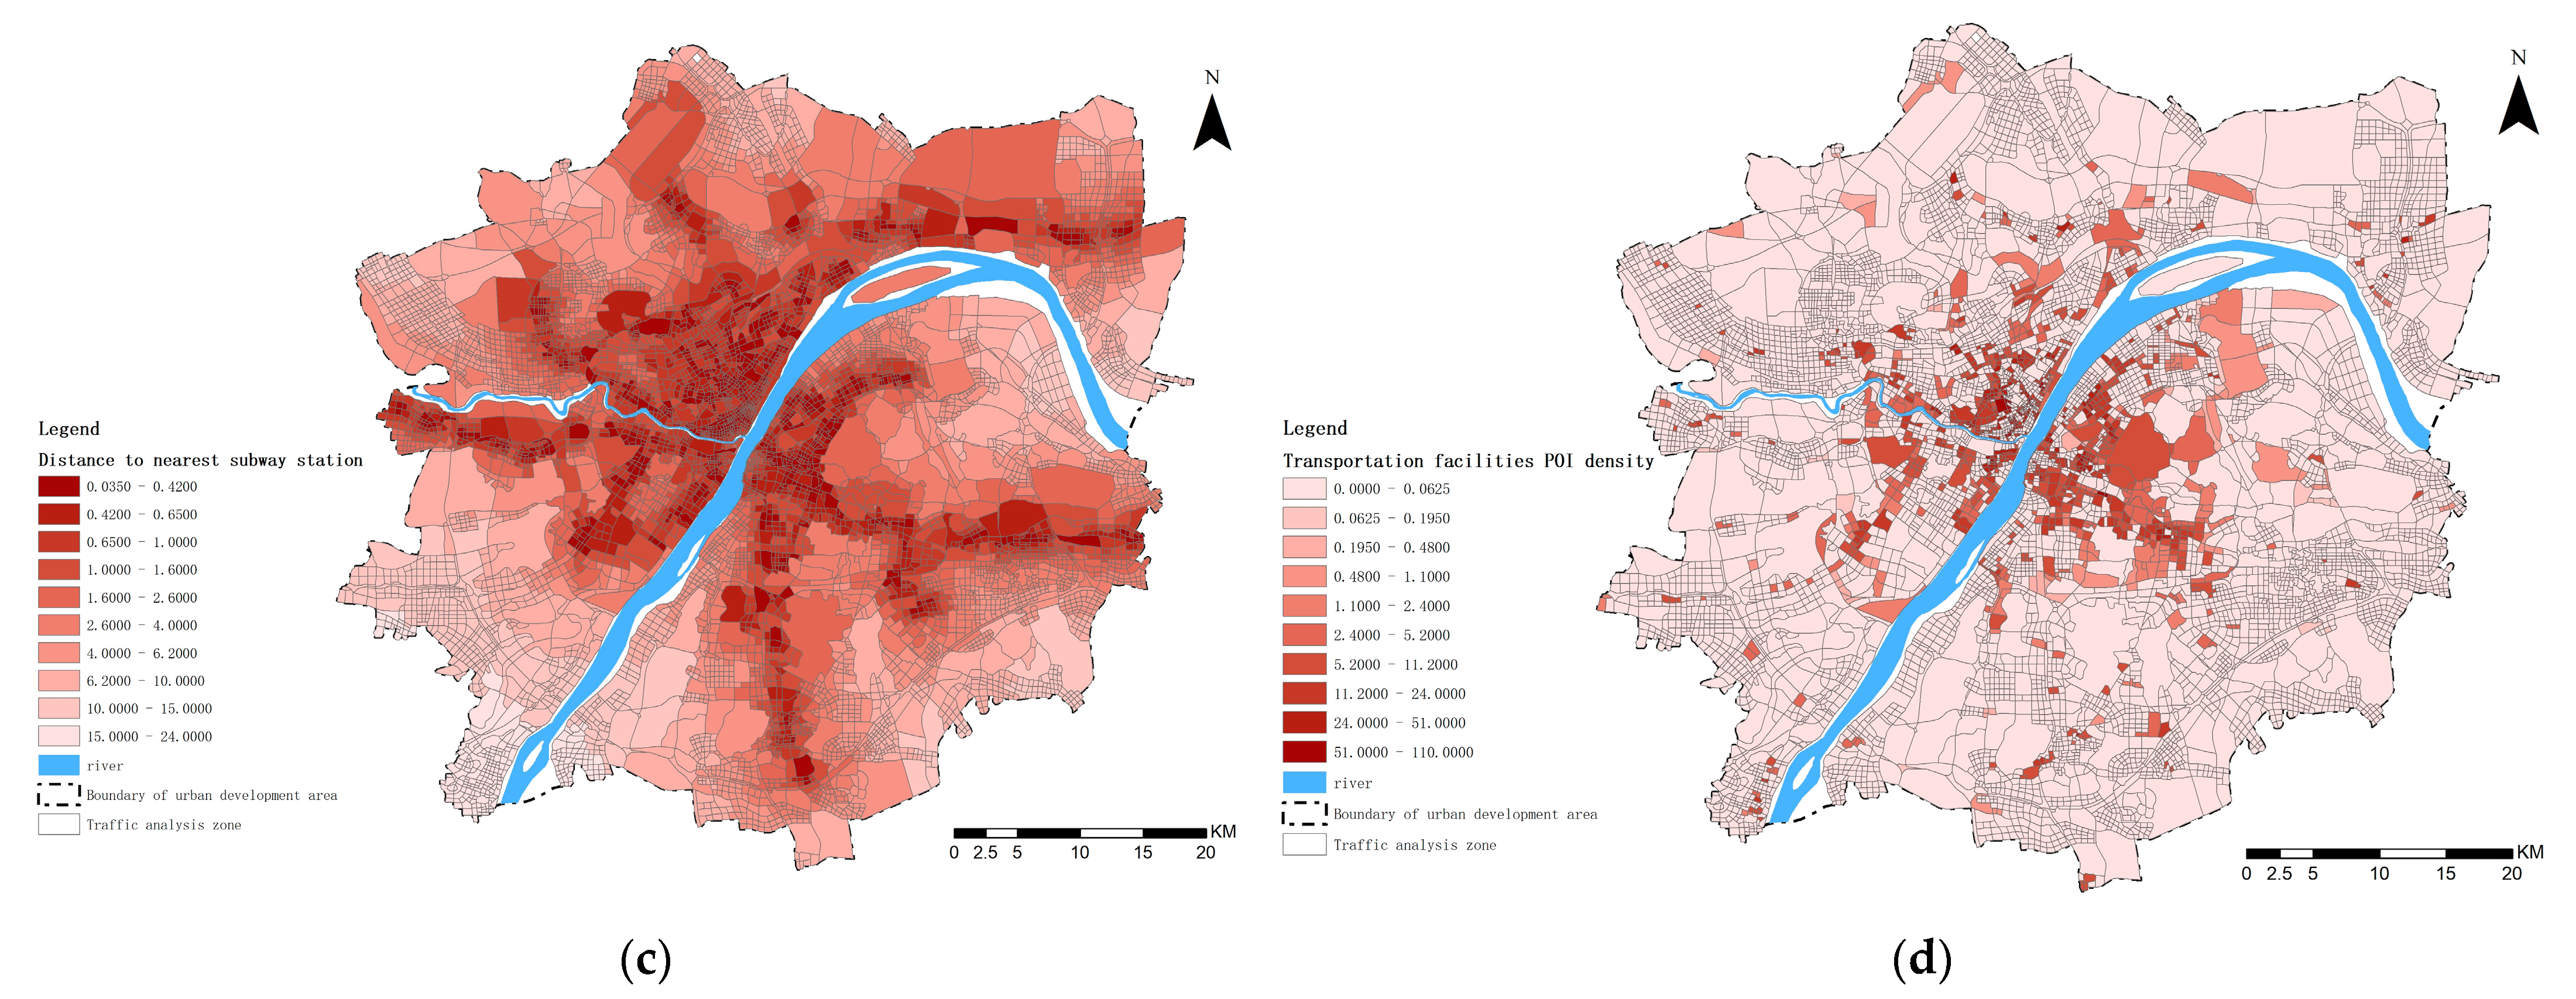
The static road and traffic in the study area was measured in terms of the road density, bus stop density, distance to the nearest subway station, and transportation facilities POI density (Figure 10). The overall urban road and traffic is highly developed, with a dense road network and extensive coverage of bus stops. The construction of subway and transportation facilities is mainly in the densely populated areas of the main urban areas, with evident distribution differences.
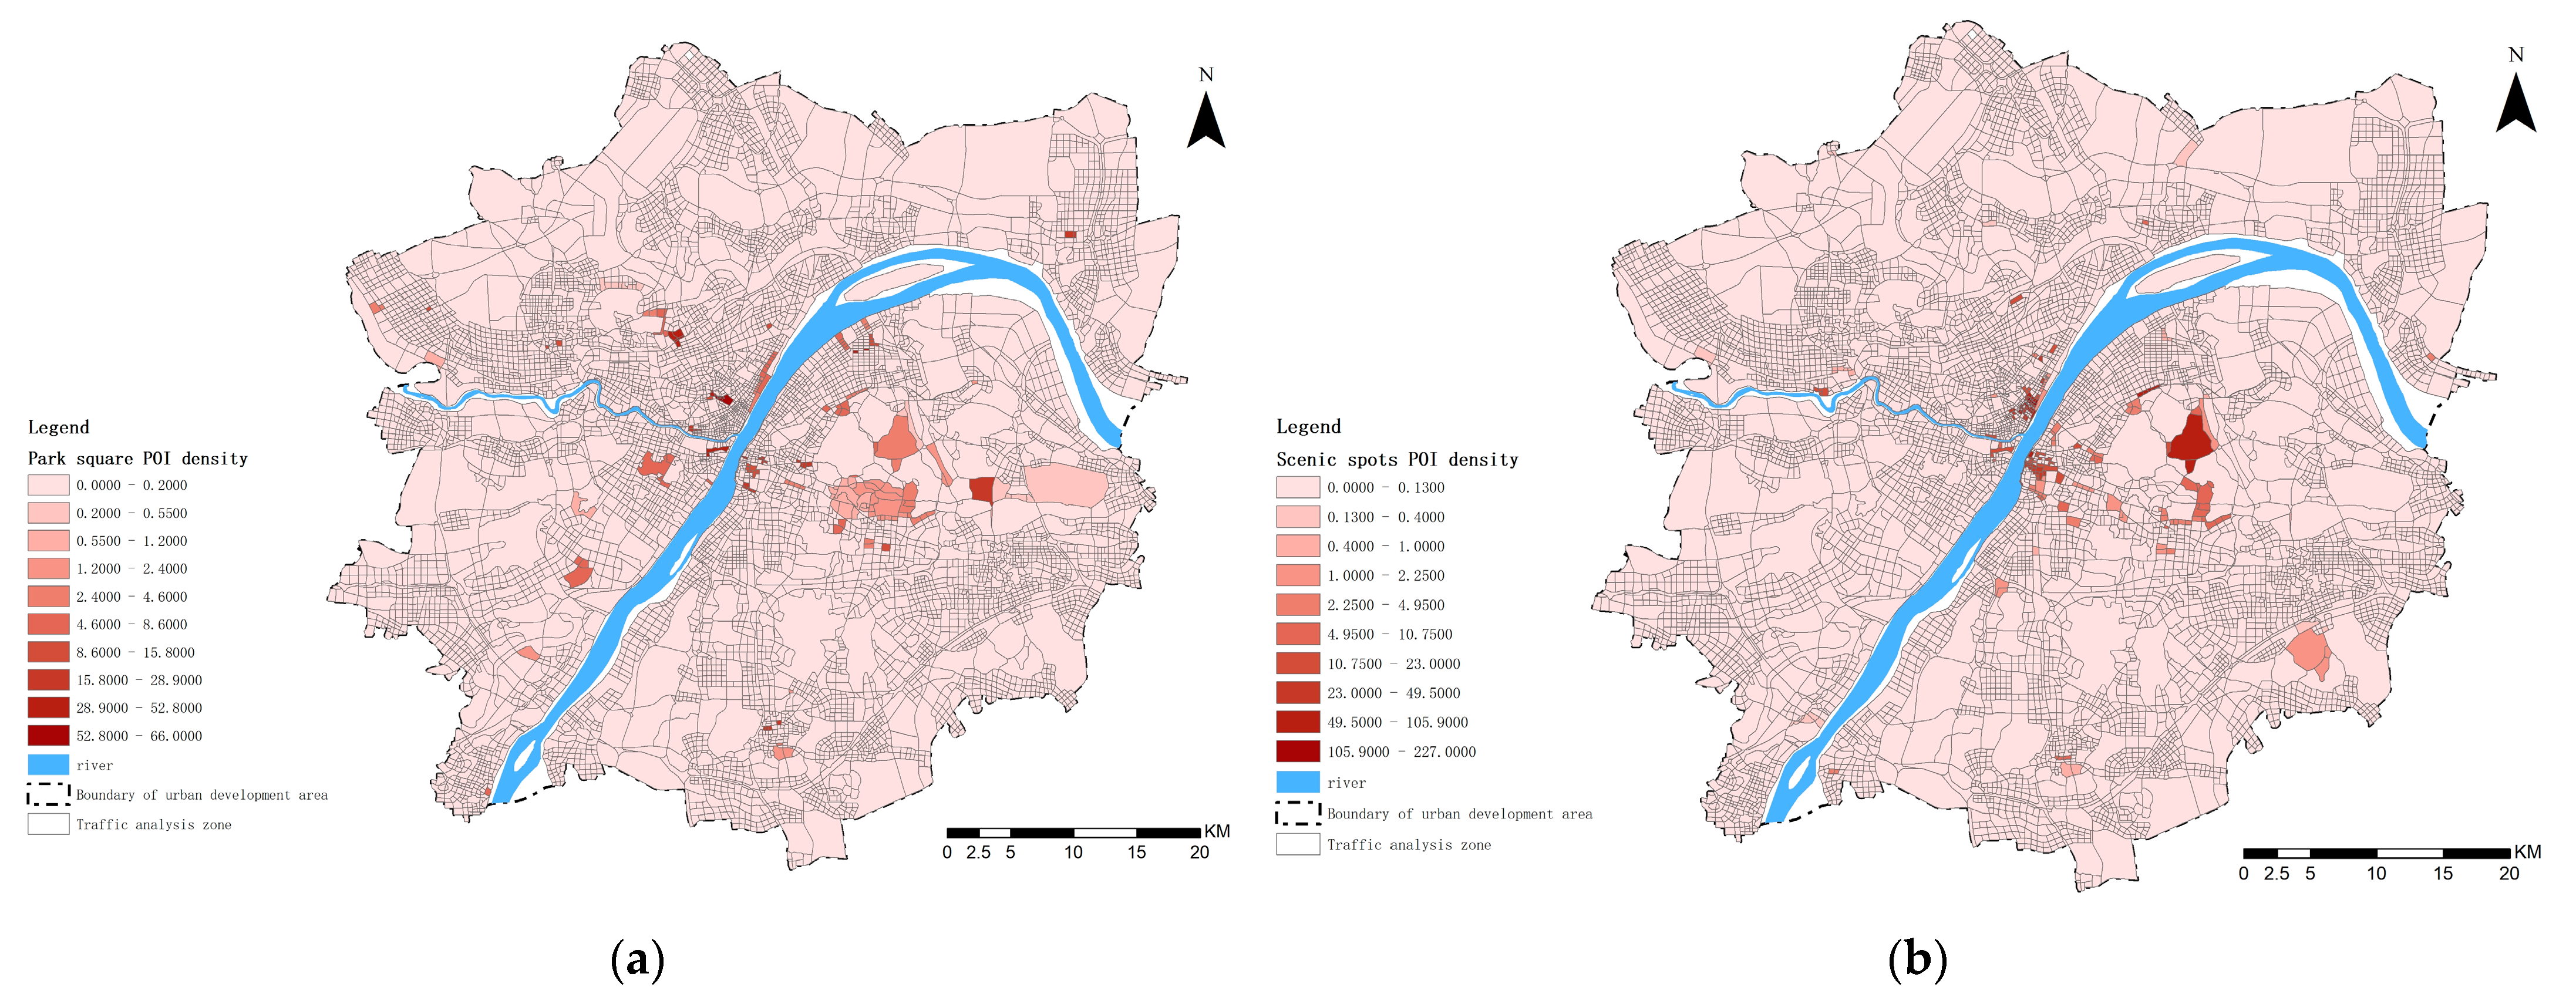
Public green spaces and open spaces play an important role in the emotional health of the public [14]. Figure 11 shows the results of green and open spaces distributions. Green and open spaces are significantly lacking in the study area. This is mainly reflected in the generally low distribution density of park green spaces and scenic spots in the study area, with few high-distribution densities in the Wuchang area.
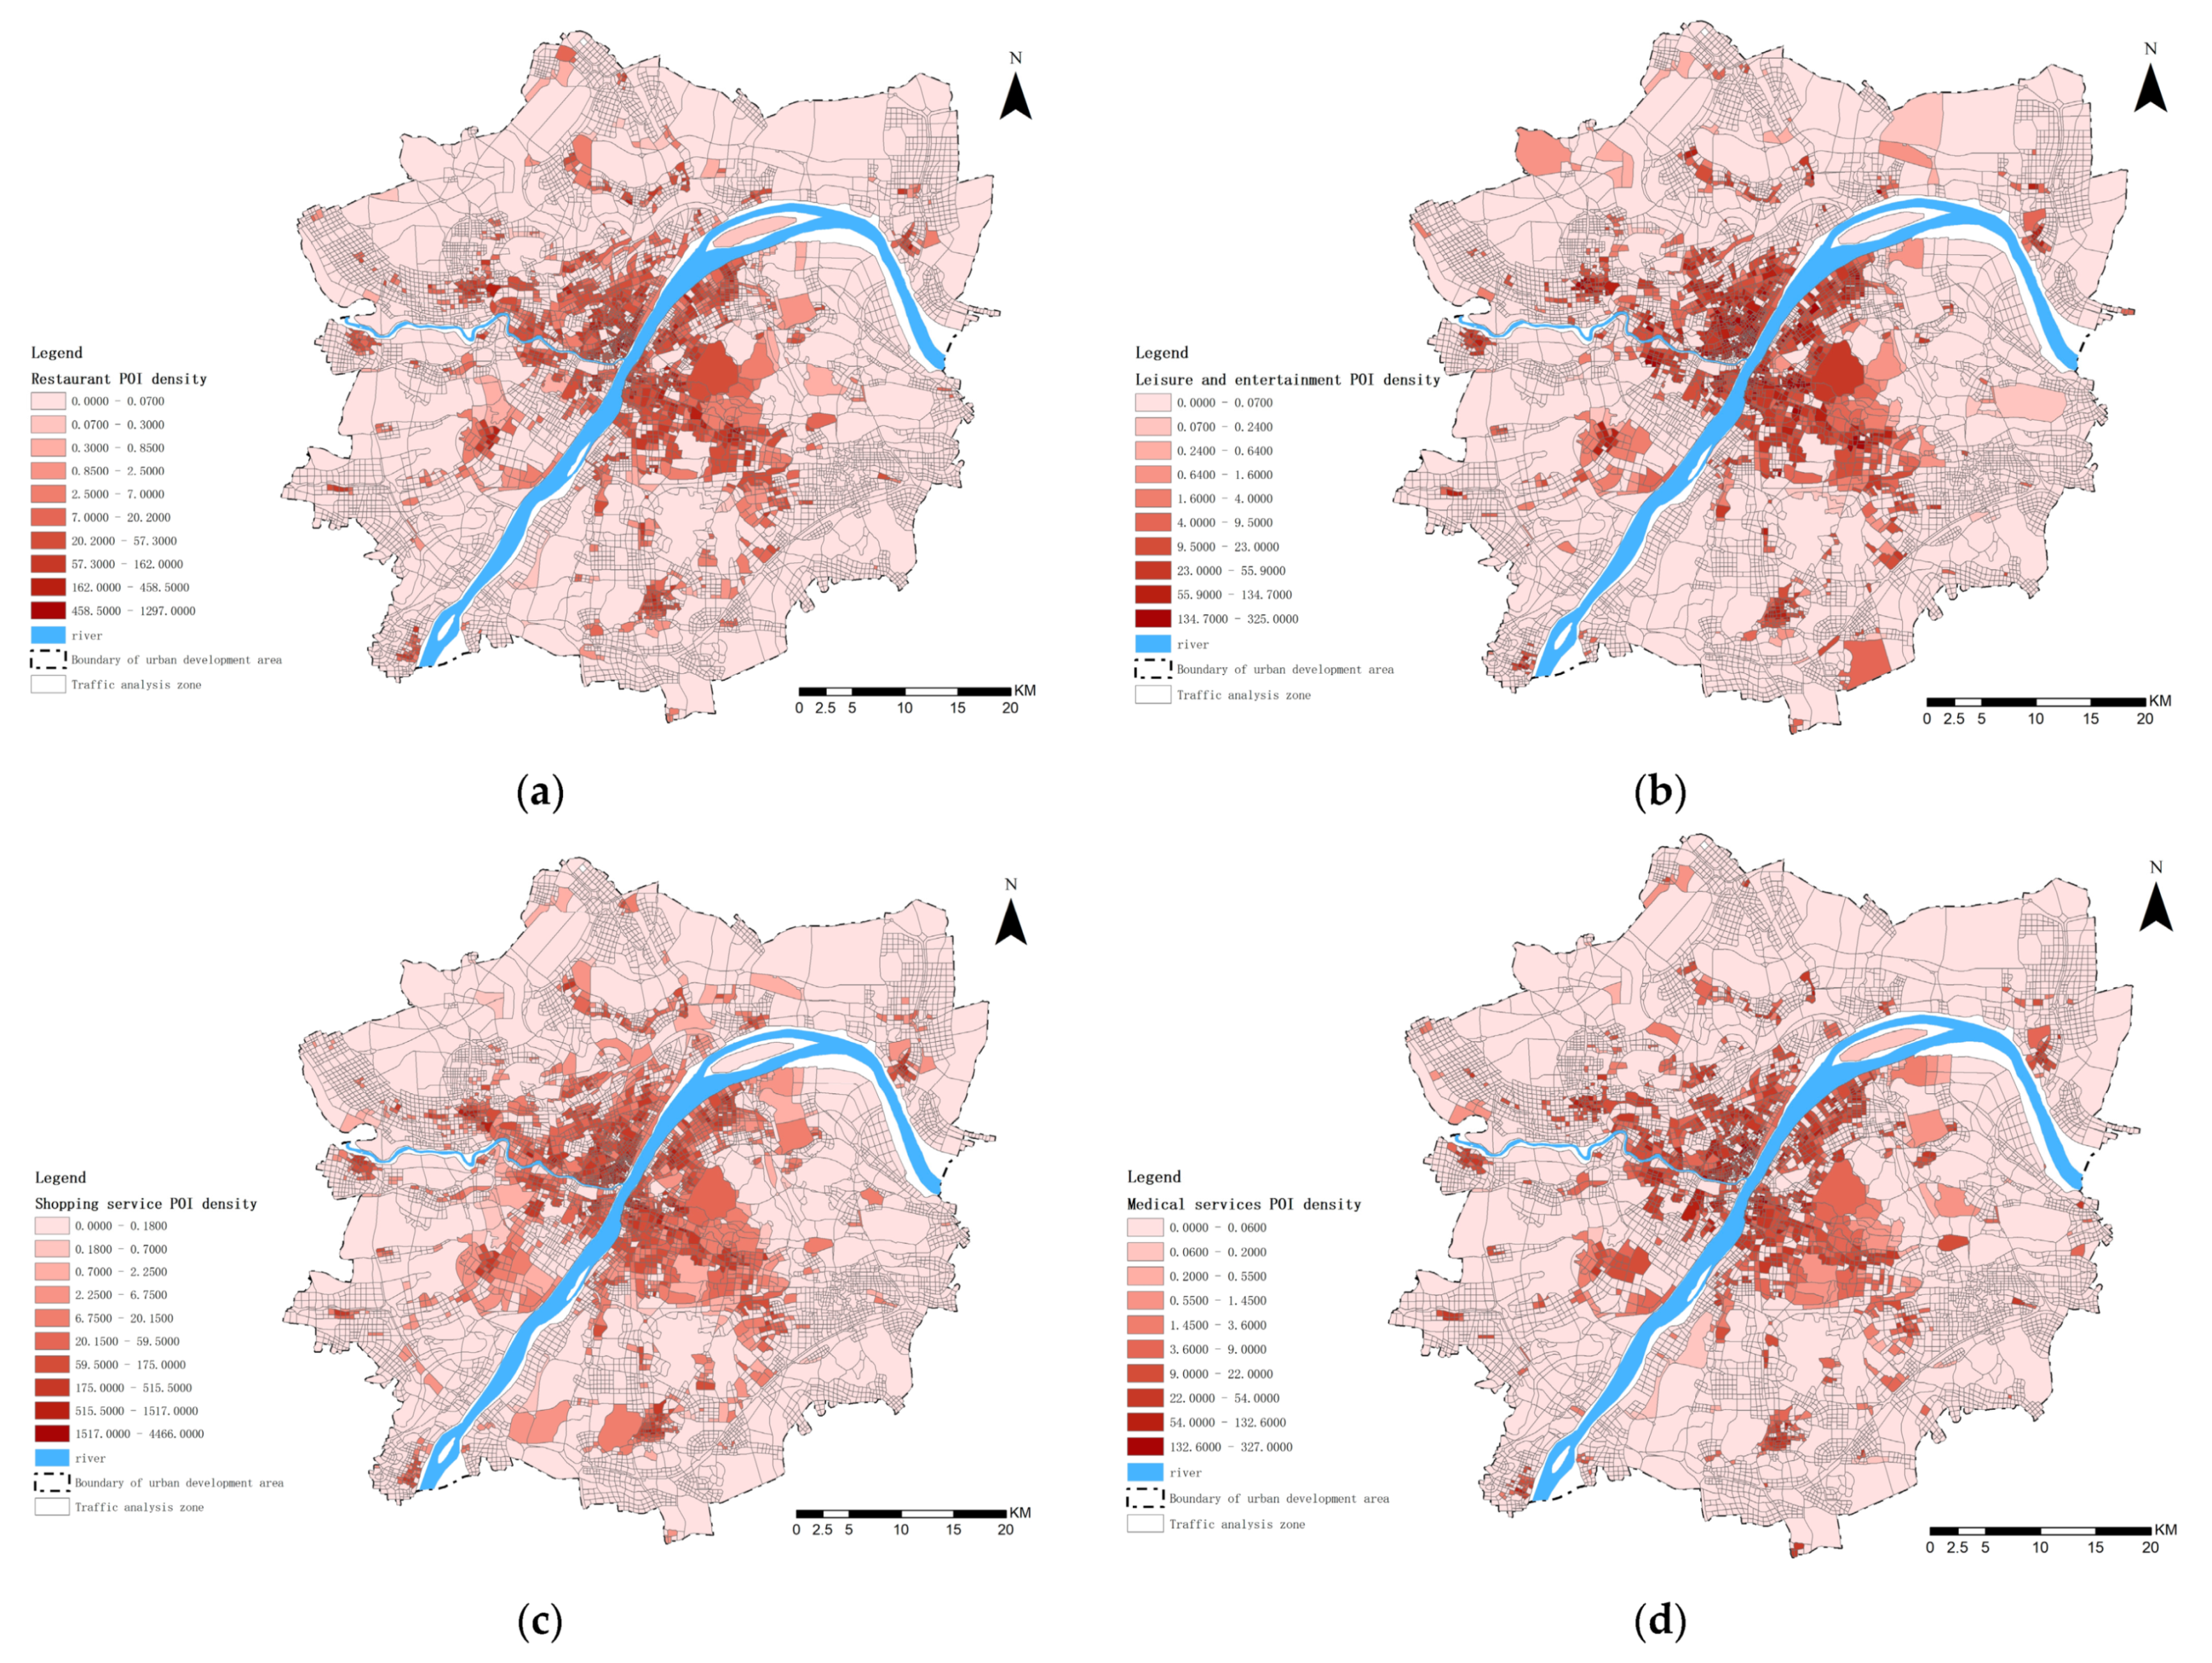
The spatial distribution of daily living places was reflected in the distributions of four types of POIs: restaurants, shopping services, leisure and entertainment, and medical service facilities (Figure 12). The results showed that most of the daily life service facilities in the study area are widely distributed, sufficient in number, and rich in type in the TAZ. The distribution of daily living service facilities shows a highly similar cluster distribution, with high density in the central area and low density in the peripheral areas. Among them, the density of dining and shopping facilities is significantly higher than that of medical and leisure facilities.
5.2.2. Spatial Distribution of Dynamic Elements
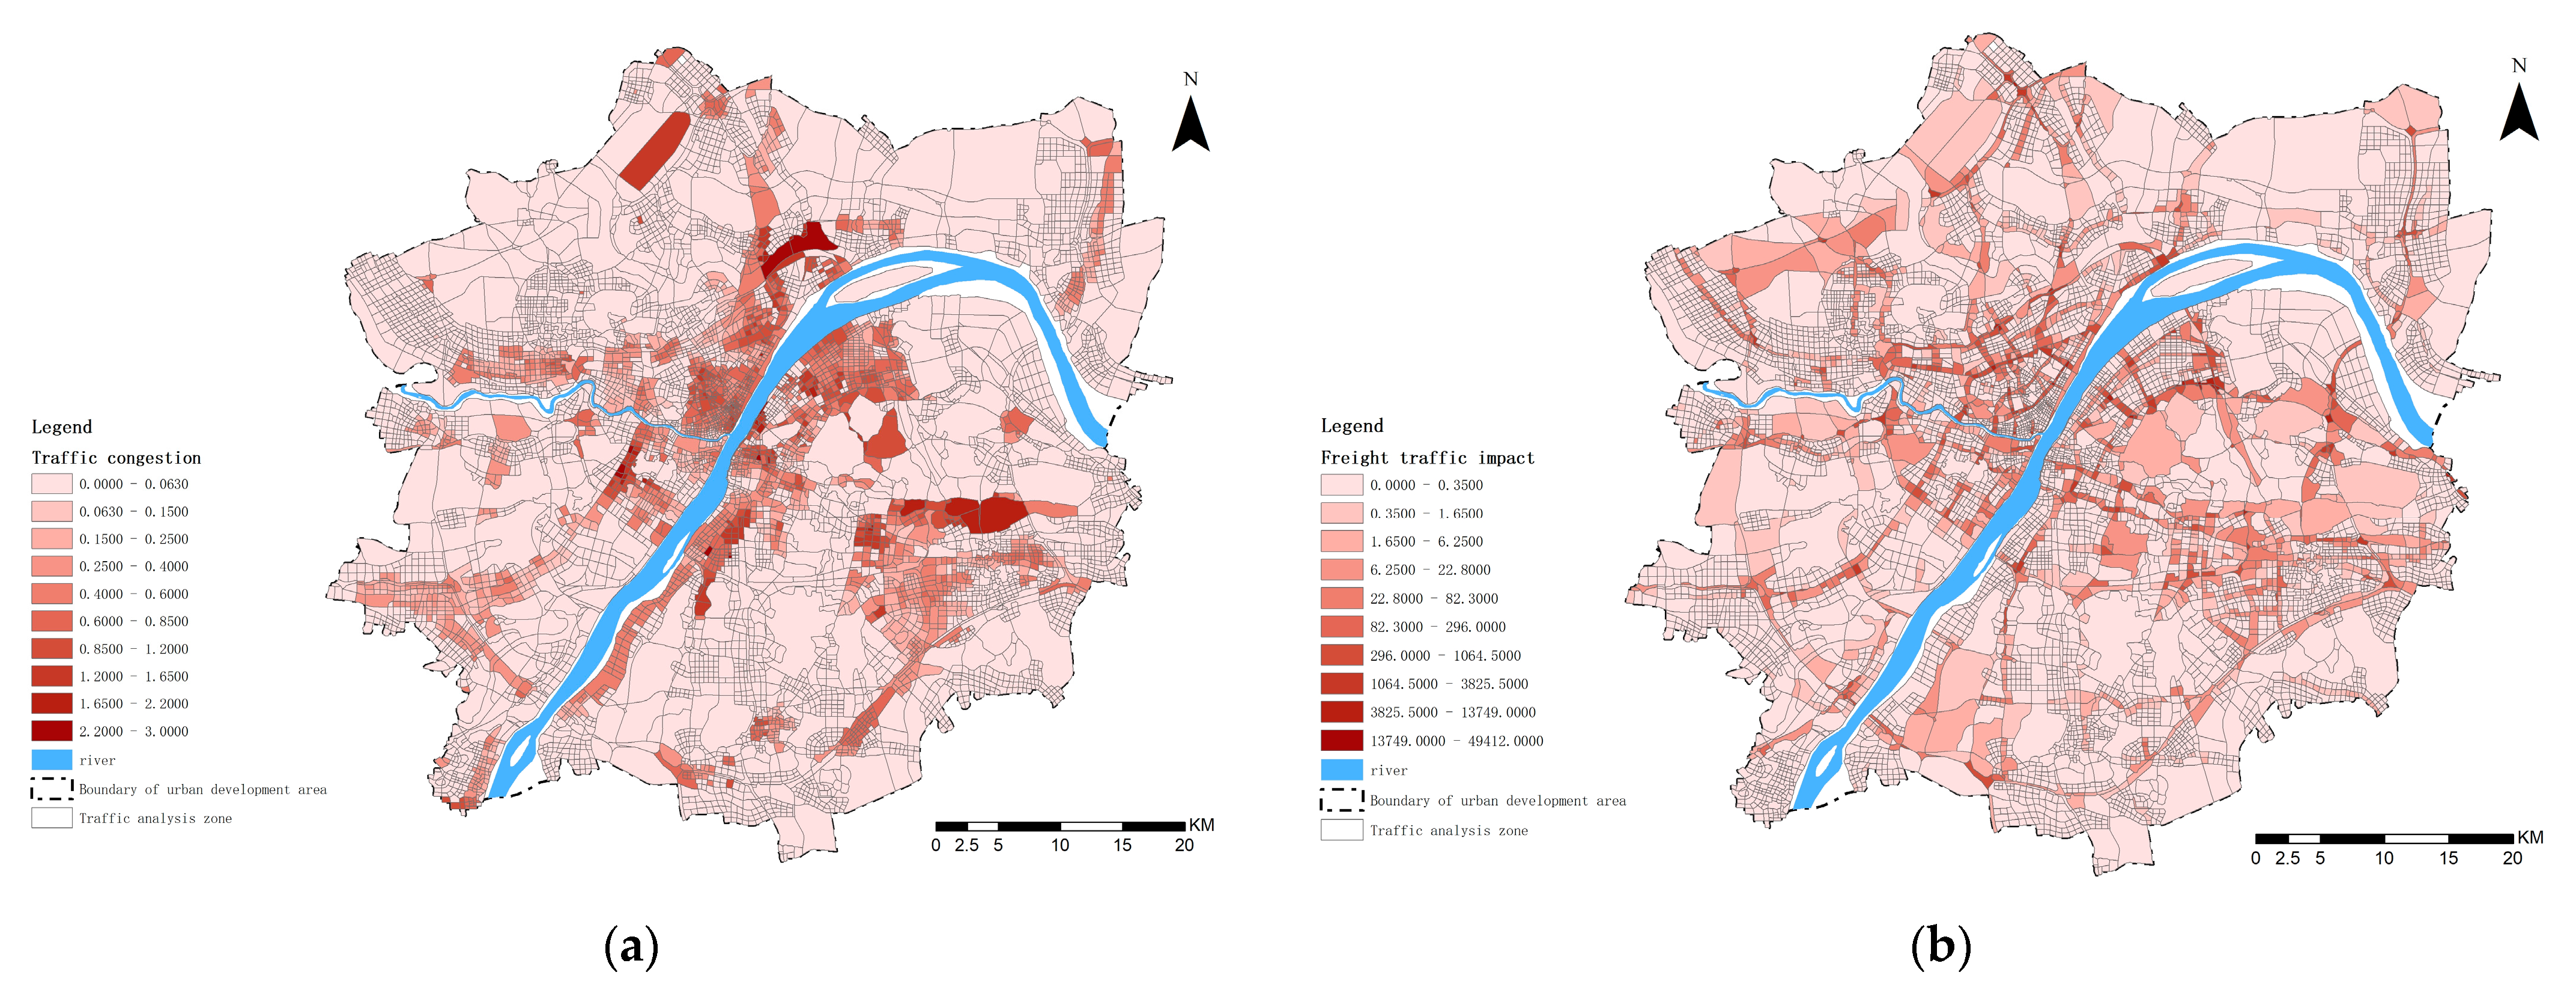
Urban road traffic is a dynamic process, and the physical aspects, such as the road density, distribution of traffic stations, and service facilities, do not fully reflect the real situation of urban roads and traffic. In this study, two dynamic traffic elements, such as the traffic dynamics and freight corridor flow, are added to further measure the urban built environment of the study area.
Traffic dynamics can reflect the general state of urban road traffic congestion (Figure 13a). The results showed that the traffic in the study area is generally smooth, with slight congestion in some areas and significant congestion in the main urban area, particularly in the central area along the river. The degree of congestion in the north–south direction is significantly higher than that in the east–west direction, and the congestion in the Wuchang and Hankou areas is more serious.
Freight corridors are important corridors for urban road transportation, but they are often neglected. This study further analyzed the degree of impact of freight corridors on the surrounding area of roads (Figure 13b). The results showed that the impact of freight traffic is stronger in the main urban area because of its dense population and high road network density.
5.3. Characteristics of the Built Environment under Different Emotional Polarities
To better investigate the characteristics of built environments under different emotional polarities, the mean and standard deviation of the built environment characteristics under positive and negative emotions were calculated and compared with the overall situation in the study area. Table 7 presents the results.
The results showed that the positive areas have a higher mix of urban functions, denser distribution of public facilities, and shorter distances to subway stations. At the same time, the built environment varies more within the positive areas. The mean value of the distance to the nearest metro station is negative area > overall situation > positive area, while the mean value of the other built environment elements is positive area > overall situation > negative area. The standard deviation of the built environment elements in the positive area is generally positive area > overall situation > negative area.
5.4. Correlation between Built Environment and Emotions
5.4.1. Numerical Distribution of Correlation Coefficients
A GWR model has been introduced to investigate the coupling relationship between urban built environment and emotion, in which the emotion score is taken as the dependent variable and the urban built environment elements are taken as independent variables. After passing the covariance test that none of them are collinear, the GWR is calculated. Table 8 presents the results. Based on the parameters listed in the table, the R2 after model fitting is 0.655, and the adjusted R2 is 0.640, indicating that the model fits well. The multiple regression equation fitted by the independent variables can explain 64.0% of the variation.
The regression coefficients of the independent variables responded to the degree of influence of the independent variables on the dependent variable. The mean, minimum, maximum, and positive and negative percentages of the coefficients of each independent variable were counted. Table 9 shows the results. The greater the mixed degree of land use, floor area ratio, road density, bus stop density, scenic spots POI density, and medical facility POI density, the more conducive it is to the positive emotions. The greater the distance from the nearest subway stop, the more likely it is to lead to negative emotions.
5.4.2. Spatial Distribution of GWR Correlation Coefficients
The regression coefficients of the independent variables provide a visual representation of the spatial distribution and differences in the effects of the built environment elements on the emotional polarity.
The sensitivity of emotional polarity to the independent variables varies across the different TAZs in the study area, showing significant spatial differences. Figure 14 shows the distribution of the estimated coefficients of the GWR of the respective variables. Among them, the east side area of Wuhan is more likely to be influenced in a more positive direction than the west side. This distribution is also reflected in the north–south direction, with the north side being influenced to a greater extent. In addition, it is significantly reflected in several factors such as the mixed degree of land use, road density, bus stop density, and the degree of freight traffic impact (Figure 14d,e,h).
Specifically, in terms of the built environment factors, the correlations of the different built environment elements with emotions are spatially distinct and uneven. In terms of the mixed degree of land use, the correlation is highest in the Wuchang area, particularly in the eastern side, and lower in the Hankou and Hanyang areas, on both sides of the Hanshui basin (Figure 14a). The correlation of building density and the floor area ratio is significantly lower in the main urban area than in the outer areas, with Wuchang having a significantly lower value than Hankou and Hanyang (Figure 14b,c). The correlation between the road density, bus stop density, and emotions has evident consistency, showing a clear trend of circle distribution, with low correlation at the center and a high correlation between the east and west sides (Figure 14d,e). There is a significant negative correlation between the distance to the nearest subway station and emotions. The closer the distance to the subway station, the more positive the emotion (Figure 14f). The density of traffic facilities has a significantly higher impact on emotion in the outer areas than in the main city, with the west side significantly stronger than the east side (Figure 14g). The correlation of the degree of freight traffic impact is more evident in the outer areas, which is closely related to the industrial layout status and the distribution of traffic corridors (Figure 14h). There is an evident spatial divergence in the degree of urban road traffic congestion in the main urban area and the outer areas, which is reflected by a weak correlation in the main urban area and a strong correlation in the outer areas. This is related to the generally congested traffic conditions within the city (Figure 14i). The trend in the correlation between the density of POI distribution and emotion of public open space and daily activity space has evident consistency, such as park square space, scenic spots, restaurants, shopping services, leisure and entertainment, and medical service facilities. The higher the density of the distribution of facilities, the more positive the emotion. This indicates that the configuration of public open space and daily life service facilities is conducive to evoking positive emotions (Figure 14j–o).
The above correlation analysis shows that urban built environments and emotions have an evident correlation. The distribution of this correlation has evident spatial consistency and spatial divergence, which is strongly influenced by geographical location.
6. Discussion and Conclusions
Research on analyzing emotions and urban built environments through social media data is emerging in the context of other cities around the world. Zhu et al. have explored emotional differences in urban green spaces in 34 parks in three northern Chinese cities [14]. Ma et al. have explored the emotion distribution of social media texts around the waterfront of Wuhan [8]. However, existing studies have mainly focused on single elements such as green areas and waterfronts in urban areas, paid little attention to the overall built environment in cities, and used short research periods or few research data sets. This study takes Wuhan City as an example and explores the spatial distribution of urban public emotions and urban built environment from the perspective of public emotions, providing a new perspective for the future enhancement of urban built environment and people-centered urban construction, and proposing recommendations for the renewal, planning, and development of humanized urban spaces and built environments. The research results for Wuhan prove the feasibility of this approach. Wuhan is an advanced metropolis with a long history, developed transportation, and a large population. It has a complex and diverse urban spatial environment that is representative of the rapidly developing cities of central China. These representative characteristics ensure that the research results obtained for Wuhan can be extended to similar cities.
6.1. Results Discussion
This study proposes a new approach and perspective that combines text emotion analysis of social media big data and multidimensional urban built environment incorporating dynamic elements, and explores the spatial distribution of public emotions and urban built environments in cities. A GWR model and spatial analysis are introduced to explore the relationship between emotions and the built environment and to provide targeted suggestions for improving the quality of the built environment from the perspective of emotions. The results of the study indicate that the scores and spatial distribution of public sentiment within the Wuhan urban development zone have significant differences, and the built-up urban environment has a significant impact on public emotion.
Specifically, on the one hand, the distribution of positive and negative emotions in Wuhan has evident differences in terms of the scores and spatial heterogeneity. The number and scores of positive emotions are significantly higher than those of negative emotions. Positive emotions are mainly distributed in the main urban areas and other areas where functions are gathered, while negative emotions are mainly distributed in the outer areas. In comparison, the emotion value of each TAZ is the average of all values in the region and represents the overall situation rather than an individual case. There is a clear divergence between the main urban area and the new urban area in the study area. Within the main urban area, Wuchang is the political, educational, and cultural center with a better natural environment. Hankou is mainly the commercial and trading center of Wuhan city, and parts of Hankou and Hanyang have undergone urban renewal, and their urban environment and landscape are better. Therefore, it has a high score within the main urban area. New urban areas are in the development stage, with more industrial areas and poorer overall environment, which is more likely to cause negative emotions. On the other hand, the impact of urban built environments on the public also has a large variability. Among the 15 indicators, those with the greatest impact on public sentiment values are mixed degree of land use, road density, traffic congestion, and freight traffic impact. Hence, the quality of Wuhan’s future urban built environment can be improved by enhancing land use mix, reasonably increasing the density and accessibility of the road network, increasing the number of public transportation facilities, improving traffic congestion, weakening the impact of freight traffic, and increasing public open space within an appropriate range. Further enriching the functions of the urban built environment, enhancing urban vitality, mitigating the negative impacts of urban traffic, and reasonably developing and constructing urban green and public spaces are important for promoting positive public emotions and mitigating negative ones.
6.2. Values and Innovations
Four innovative and unique research contents and methods have been reported in this paper: first, a multidisciplinary interdisciplinary inquiry method that combines GIS, natural language processing, and psychology was developed. Various methods, such as text emotions, GWR, and multifactor evaluation, were incorporated into the study. Second, social media big data were used to respond to public sentiment in a more relevant manner. Unlike conventional purposeful survey methods, social media data can provide continuous information on users’ opinions and attitudes toward cities, further revealing their hidden characteristics. The use of social media data makes an important contribution to urban planning and decision making and to deeply interpreting the role of urban space and built environment from a human perspective, which helps further improve the relationship between people and cities and enhance urban well-being. Third, the introduction of dynamic traffic environment elements provided a comprehensive measure of urban built environment from a multidimensional perspective, which further revealed the environmental elements affecting people’s emotions in urban spaces in a more comprehensive manner. Fourth, unlike existing studies, the specific built environment elements significantly related to emotions were clarified in this study to provide direct feedback for urban renewal and urban planning.
6.3. Limitations
This study, like any other, has some limitations. First, iconic words and symbols were used to rate Weibo texts. Because of the diverse forms of Chinese expressions, our method does not fully and accurately reflect users’ emotions. Methods such as machine learning can be incorporated in subsequent studies to improve the interpretation of emotions. Second, the age distribution of people in Weibo data has limitations. Despite the rapid development of mobile networks, the number of Weibo users is limited, particularly in terms of the age distribution. Children and older people were not considered in the study given the lack of related Weibo data. Hence, further attention should be paid to the coupling between the emotions of different age groups and the urban built environment by combining traditional questionnaire methods in subsequent studies. Third, our consideration of the elements that influence emotion is still not comprehensive enough. The influence of urban environmental and social factors, such as air quality and crime rates, is ignored. Future research can further investigate the elements influencing emotions in a comprehensive manner.
Author Contributions
Conceptualization, H.J. and Y.M.; methodology, H.J. and Y.M.; software, Y.M.; validation, H.J., Y.M. and Y.Y.; formal analysis, Y.M.; investigation, H.J.; resources, H.J.; data curation, Y.M. and Y.Y.; writing—original draft preparation, Y.M.; writing—review and editing, H.J. and Y.Y.; visualization, Y.M. and Y.Y.; supervision, H.J.; project administration, H.J.; funding acquisition, H.J. All authors have read and agreed to the published version of the manuscript.
Funding
This research was funded by the National Key Research and Development Program “Research and Development of Emergency Response and Collaborative Command System with Holographic Perception of Traffic Network Disaster “(2020YFC1512002)”.
Data Availability Statement
Not applicable.
Conflicts of Interest
The authors declare no conflict of interest.
References
- Benabbou, R.; Lee, H. Exploring the evolution of urban emotions in the City of Seoul using social media information. Int. J. Knowl. Based Dev. 2019, 10, 232–248. [Google Scholar] [CrossRef]
- Herrera-Yague, C.; Schneider, C.M.; Couronne, T.; Smoreda, Z.; Benito, R.M.; Zufiria, P.J.; Gonzalez, M.C. The anatomy of urban social networks and its implications in the searchability problem. Sci. Rep. 2015, 5, 10265. [Google Scholar] [CrossRef] [Green Version]
- Yang, Z.H.; Liu, P.G. Expert system of the urban community safety plan based on ArcIMS data frame. Ind. Saf. Environ. Prot. 2008, 7, 550–555. [Google Scholar]
- Jing, Q. Urban space and emotion. Urban Plan. Forum 2004, 3, 6–8. [Google Scholar]
- Hijazi, I.H.; Koenig, R.; Schneider, S.; Li, X.; Bielik, M.; Schmit, G.N.J.; Donath, D. Geostatistical analysis for the study of relationships between the emotional responses of urban walkers to urban spaces. Int. J. E-Plan. Res. 2016, 5, 1–19. [Google Scholar] [CrossRef] [Green Version]
- Kumlu, K.B.Y.; Tudes, S. Effect of physical urban environment on sustainable urban development. In Lecture Notes in Civil Engineering, Proceedings of 3rd International Sustainable Buildings Symposium, Dubai, United Arab Emirates, 15–17 March 2017; Firat, S., Kinuthia, J., AbuTair, A., Eds.; Springer: Berlin, Germany, 2018; Volume 6, pp. 501–512. [Google Scholar]
- Martínez, L. Health differences in an unequal city. Cities 2021, 108, 102976. [Google Scholar] [CrossRef]
- Ma, Y.; Ling, C.; Wu, J. Exploring the spatial distribution characteristics of emotions of Weibo users in Wuhan waterfront based on gender differences using social media texts. ISPRS Int. J. Geo-Inf. 2020, 9, 465. [Google Scholar] [CrossRef]
- Qiu, J.H.; Liu, J.P. Research on urban image building based on the people-oriented. In Proceedings of the International Conference on Engineering and Business Management 2010, Chengdu China, 25–27 March 2010; pp. 3006–3009. [Google Scholar]
- Lee, S. The relationship between positive negative emotion, emotion-focused coping style and emotional eating behavior. J. Table Food Coord. 2020, 15, 61–80. [Google Scholar] [CrossRef]
- Strack, F.; Pauli, P.; Weyers, P. Editorial: Emotion and behavior. Front. Psychol. 2016, 7, 313. [Google Scholar] [CrossRef]
- Lindquist, K.A.; Barrett, L.F.; Bliss-Moreau, E.; Russell, J.A. Language and the perception of emotion. Emotion 2006, 6, 125–138. [Google Scholar] [CrossRef] [Green Version]
- Ward, J.S.; Duncan, J.S.; Jarden, A.; Stewart, T. The impact of children’s exposure to greenspace on physical activity, cognitive development, emotional wellbeing, and ability to appraise risk. Health Place 2016, 40, 44–50. [Google Scholar] [CrossRef] [PubMed]
- Zhu, X.; Gao, M.; Zhang, R.; Zhang, B. Quantifying emotional differences in urban green spaces extracted from photos on social networking sites: A study of 34 parks in three cities in northern China. Urban For. Urban Green. 2021, 62, 127133. [Google Scholar] [CrossRef]
- Calvillo Cortés, A.B.; Falcón Morales, L.E. Emotions and the urban lighting environment: A cross-cultural comparison. SAGE Open 2016, 6, 1. [Google Scholar] [CrossRef] [Green Version]
- Byrne, F.L. Libby prison—A study in emotions. J. South. Hist. 1958, 24, 430–444. [Google Scholar] [CrossRef]
- Weijs-Perree, M.; Dane, G.; van den Berg, P. Analyzing the relationships between citizens’ emotions and their momentary satisfaction in urban public spaces. Sustainability 2020, 12, 7921. [Google Scholar] [CrossRef]
- Kobylinska, D.; Karwowska, D. How automatic activation of emotion regulation influences experiencing negative emotions. Front. Psychol. 2015, 6, 66–71. [Google Scholar] [CrossRef] [Green Version]
- Vanderlind, W.M.; Millgram, Y.; Baskin-Sommers, A.R.; Clark, M.S.; Joormann, J. Understanding positive emotion deficits in depression: From emotion preferences to emotion regulation. Clin. Psychol. Rev. 2020, 76, 101826. [Google Scholar] [CrossRef] [PubMed]
- Burli, M.; Schmid, M.; In-Albon, T. Emotion regulation and interpersonal relationships in adolescents with NSSI—Emotion recognition and emotion expression. Nervenheilkunde 2013, 32, 24–29. [Google Scholar]
- Wang, G.-L.; Zhang, W. Effects of urban expansion and changes in urban characteristics on PM2.5 pollution in China. Huan Jing Ke Xue 2019, 40, 3447–3456. [Google Scholar] [CrossRef]
- Liu, B.; Cheng, K.; Ma, Z. Research on the impacts of urbanization on logistics carbon emission changes. China Popul. Resour. Environ. 2016, 26, 54–60. [Google Scholar]
- Ji, X.; Zhang, Y.; Chen, F. Deprivation-based transportation equity evaluation model for rapid urbanization areas. J. Transp. Syst. Eng. Inf. Technol. 2012, 12, 7–13. [Google Scholar]
- Adli, M.; Schondorf, J. Does the city make us ill? The effect of urban stress on emotions, behavior, and mental health. Bundesgesundheitsblatt Gesundh. Gesundh. 2020, 63, 979–986. [Google Scholar] [CrossRef]
- Zhu, H.; Gao, Q. Review on “emotional turn” and emotional geographies in recent western geography. Geogr. Res. 2015, 34, 1394–1406. [Google Scholar]
- Resch, B.; Summa, A.; Sagl, G.; Zeile, P.; Exner, J.P. Urban emotions-geo-semantic emotion extraction from technical sensors, human sensors and crowdsourced data. In Progress in Location-Based Services 2014; Lecture Notes in Geoinformation and Cartography; Gartner, G., Huang, H., Eds.; Springer: Berlin, Germany, 2015; pp. 199–212. [Google Scholar]
- Li, X.; Hijazi, I.; Koenig, R.; Lv, Z.H.; Zhong, C.; Schmitt, G. Assessing essential qualities of urban space with emotional and visual data based on GIS technique. ISPRS Int. J. Geo-Inf. 2016, 5, 218. [Google Scholar] [CrossRef]
- Pizzato, G.Z.; Guimaraes, L.B.D. Emotional attributes of urban furniture. In Advances in Intelligent Systems and Computing, Proceedings of the 20th Congress Of the International Ergonomics Association, Florence, Italy, 26–30 August 2018; Bagnara, S., Tartaglia, R., Albolino, S., Alexander, T., Fujita, Y., Eds.; Springer: Berlin, Germany, 2019; Volume 824, pp. 2087–2097. [Google Scholar]
- Qu, Z.Q.; Lu, Y.M.; Jiang, Z.Q.; Bassett, E.; Tan, T. A psychological approach to “public perception” of land-use planning: A case Study OF Jiangsu Province, China. Sustainability 2018, 10, 3056. [Google Scholar] [CrossRef] [Green Version]
- Wang, S.R.; Cao, D.L.; Lin, D.Z.; Chao, F. Traffic condition analysis based on users emotion tendency of microblog. In Advances in Computational Intelligence Systems; Advances in Intelligent Systems and Computing; Chao, F., Schockaert, S., Zhang, Q., Eds.; Springer: Berlin, Germany, 2018; Volume 650, pp. 299–311. [Google Scholar]
- Hu, T.Y.; Xie, X.F.; Li, J. Negative or positive? The effect of emotion and mood on risky driving. Transp. Res. Part F Traffic Psychol. Behav. 2013, 16, 29–40. [Google Scholar] [CrossRef]
- Niedenthal, P.M.; Rychlowska, M.; Wood, A.; Zhao, F. Heterogeneity of long-history migration predicts smiling, laughter and positive emotion across the globe and within the United States. PLoS ONE 2018, 13, e0197651. [Google Scholar] [CrossRef]
- Morello, E.; Ratti, C. A digital image of the city: 3D isovists in Lynch’s urban analysis. Environ. Plan. B Plan. Des. 2009, 36, 837–853. [Google Scholar] [CrossRef] [Green Version]
- Zhang, J.H.; Chen, M.; Zhao, S.K.; Hu, S.Q.; Shi, Z.G.; Cao, Y. ReliefF-based EEG sensor selection methods for emotion recognition. Sensors 2016, 16, 1558. [Google Scholar] [CrossRef]
- Kandt, J.; Batty, M. Smart cities, big data and urban policy: Towards urban analytics for the long run. Cities 2021, 109, 102992. [Google Scholar] [CrossRef]
- Yang, L.; Wu, L.; Liu, Y.; Kang, C. Quantifying tourist behavior patterns by travel motifs and geo-tagged photos from flickr. ISPRS Int. J. Geo-Inf. 2017, 6, 345. [Google Scholar] [CrossRef] [Green Version]
- Frias-Martinez, V.; Frias-Martinez, E. Spectral clustering for sensing urban land use using Twitter activity. Eng. Appl. Artif. Intell. 2014, 35, 237–245. [Google Scholar] [CrossRef] [Green Version]
- Rizal, A.R.; Doherty, B.; Haeusler, M.H. Enabeling low cost human presence tracking. In Proceedings of the 21st Conference on Computer-Aided Architectural Design Research in Asia, Melbourne, Australia, 30 March–2 April 2016; pp. 45–54. [Google Scholar]
- Krueger, R.; Hang, Q.; Ivanov, N.; Mahtal, S.; Thom, D.; Pfister, H.; Ertl, T. Bird’s-eye—Large-scale visual analytics of city Dynamics using social location data. Comput. Graph. Forum 2019, 38, 595–607. [Google Scholar] [CrossRef]
- Chen, T.T.; Hui, E.C.M.; Wu, J.M.; Lang, W.; Li, X. Identifying urban spatial structure and urban vibrancy in highly dense cities using georeferenced social media data. Habitat Int. 2019, 89, 102005. [Google Scholar] [CrossRef]
- Ullah, H.; Wan, W.G.; Haidery, S.A.; Khan, N.U.; Ebrahimpour, Z.; Muzahid, A.A.M. Spatiotemporal patterns of visitors in urban green parks by mining social media big data based upon WHO reports. IEEE Access 2020, 8, 39197–39211. [Google Scholar] [CrossRef]
- Ye, C.; Zhang, F.; Mu, L.; Gao, Y.; Liu, Y. Urban function recognition by integrating social media and street-level imagery. Environ. Plan. B-Urban Anal. City Sci. 2020, 48, 1430–1444. [Google Scholar] [CrossRef]
- Liu, J.X.; Bi, H.; Wang, M.L. Using multi-source data to assess livability in Hong Kong at the community-based level: A combined subjective-objective approach. Geogr. Sustain. 2020, 1, 284–294. [Google Scholar] [CrossRef]
- Feng, Y.; Sester, M. Extraction of pluvial flood relevant volunteered geographic information (VGI) by deep learning from user generated texts and photos. ISPRS Int. J. Geo-Inf. 2018, 7, 39. [Google Scholar] [CrossRef] [Green Version]
- Huang, L.; Li, S.S.; Zhou, G.D. Emotion corpus construction on microblog text. In Lecture Notes in Artificial Intelligence, Proceedings of the 16th Chinese Lexical Semantics Workshop, Bejing China, 9–11 May 2015; Lu, Q., Gao, H.H., Eds.; Sprigner: Berlin, Germnay, 2015; Volume 9332, pp. 204–212. [Google Scholar]
- Roberts, H.; Resch, B.; Sadler, J.; Chapman, L.; Petutschnig, A.; Zimmer, S. Investigating the emotional responses of individuals to urban green space using Twitter data: A critical comparison of three different methods of sentiment analysis. Urban Plan. 2018, 3, 21–33. [Google Scholar] [CrossRef]
- Ding, C.; Wang, Y.; Yang, J.; Liu, C.; Lin, Y. Spatial heterogeneous impact of built environment on household auto ownership levels: Evidence from analysis at traffic analysis zone scales. Transp. Lett. 2016, 8, 26–34. [Google Scholar] [CrossRef]
- Wu, J.; Chen, X.R.; Chen, S.L. Temporal characteristics of waterfronts in Wuhan city and people’s behavioral preferences based on social media data. Sustainability 2019, 11, 6308. [Google Scholar] [CrossRef] [Green Version]
- Zhang, S.; Huang, Z.X. Fractal analysis of the relation between the observation scale and the prediction cycle in short-term traffic flow prediction. Int. J. Intell. Transp. Syst. Res. 2019, 17, 1–8. [Google Scholar] [CrossRef]
- Ai, Y.F.; Bai, Z.M.; Su, H.; Zhong, N.; Sun, Y.H.; Zhao, J.D.; IEEE. Traffic flow prediction based on expressway operating vehicle data. In Proceedings of the 11th International Conference on Intelligent Computation Technology and Automation, Changsha, China, 22–23 September 2018; pp. 322–326. [Google Scholar]
- Fu, F.J.; Lou, Q.F.; Wang, B.; Wang, D.H. An identification method of traffic state inequality for urban roads. In Applied Mechanics and Materials; Bao, T., Ed.; Trans Tech Publications, Ltd.: Bäch, Switzerland, 2014; Volume 505–506, pp. 979–984. [Google Scholar]
- Curiskis, S.A.; Drake, B.; Osborn, T.R.; Kennedy, P.J. An evaluation of document clustering and topic modelling in two online social networks: Twitter and Reddit. Inf. Process. Manag. 2020, 57, 102034. [Google Scholar] [CrossRef]
- Wang, J.Y.; Ji, F.J.; Liu, B.Y.; Wang, N.; Yin, H.; Zhang, F.F. Research on mass news classification algorithm based on spark. In Proceedings of the 2020 International Conference on Big Data & Artificial Intelligence & Software Engineering, Bangkok, Thailand, 30 October–1 November 2020; pp. 408–414. [Google Scholar]
- Ding, Y.; Li, R.; Zhen, Y.; Li, W. Research on semi-automatic construction method of high-speed train. Mach. Des. Res. 2020, 36, 185–189. [Google Scholar]
- Bandhakavi, A.; Wiratunga, N.; Padmanabhan, D.; Massie, S. Lexicon based feature extraction for emotion text classification. Pattern Recognit. Lett. 2017, 93, 133–142. [Google Scholar] [CrossRef]
- Fu, X.H.; Liu, G.; Guo, Y.Y.; Wang, Z.Q. Multi-aspect sentiment analysis for Chinese online social reviews based on topic modeling and HowNet lexicon. Knowl. Based Syst. 2013, 37, 186–195. [Google Scholar] [CrossRef]
- Liu, Q.; Li, S. Word semantic similarity computation based on Hownet. In Proceedings of the 3th Chinese Lexical Semantic Workshop (CLSW2002), Taipei, Taiwan, 2–4 July 2002. [Google Scholar]
- Zhu, Y.; Min, J.; Zhou, Y.; Huang, J.; Wu, L. Semantic orientation computing based on HowNet. J. Chin. Inform. Process. 2006, 20, 14–20. [Google Scholar]
- Casas-Garriga, G. Discovering unbounded episodes in sequential data. In Knowledge Discovery in Databases: PKDD 2003, Proceedings of the European Conference on Principles of Data Mining and Knowledge Discovery, Cavtat-Dubrovnik, Croatia, 22–26 September 2003; Lecture Notes in Artificial Intelligence; Lavrac, N., Gamberger, D., Todorovski, L., Blockeel, H., Eds.; Sprigner: Berlin, Germany, 2003; Volume 2838, pp. 83–94. [Google Scholar]
- Niu, Y.; Pan, M.; Wei, O.; Cai, X. Emotion analysis of Chinese microblogs using lexicon-based approach. Comput. Sci. 2014, 41, 253. [Google Scholar]
- He, K.K.; Chen, Y. Urban Traffic Congestion Based on System Dynamics: Taking Wuhan City as an Example. In Proceedings of the 9th International Conference on Internet and Distributed Computing Systems (IDCS), Wuhan, China, 28–30 September 2016; pp. 372–380. [Google Scholar]
- Yue, Y.; Zhuang, Y.; Yeh, A.G.O.; Xie, J.Y.; Ma, C.L.; Li, Q.Q. Measurements of POI-based mixed use and their relationships with neighbourhood vibrancy. Int. J. Geogr. Inf. Sci. 2017, 31, 658–675. [Google Scholar] [CrossRef] [Green Version]
- Fotheringham, A.S.; Brunsdon, C. Local forms of spatial analysis. Geogr. Anal. 1999, 31, 340–358. [Google Scholar] [CrossRef]
- Nilsson, P. Natural amenities in urban space—A geographically weighted regression approach. Landsc. Urban Plan. 2014, 121, 45–54. [Google Scholar] [CrossRef]
- Zhang, X.X.; Huang, B.; Zhu, S.Z. Spatiotemporal influence of urban environment on taxi ridership using geographically and temporally weighted regression. ISPRS Int. J. Geo-Inf. 2019, 8, 23. [Google Scholar] [CrossRef] [Green Version]
- Zhao, X.F.; Ji, Y.N.; IOP. The urban public space betterment and land use sustainability under the human behavior. IOP Conf. Ser. Earth Environ. Sci. 2018, 113, 012143. [Google Scholar] [CrossRef]
Figure 1.
Location of study area.

Figure 2.
TAZ subdivision.

Figure 3.
Visualization results of Weibo and POI points: (a) Weibo sign-in data distribution display; (b) POI data distribution display.
Figure 3.
Visualization results of Weibo and POI points: (a) Weibo sign-in data distribution display; (b) POI data distribution display.

Figure 4.
Traffic corridor flow display.

Figure 5.
Emotional score algorithm.

Figure 6.
Number and percentage distribution of emotion scores: (a) Overall characteristics of the number of emotions distribution display; (b) Internal emotional intervals and polarity differences distribution display.
Figure 6.
Number and percentage distribution of emotion scores: (a) Overall characteristics of the number of emotions distribution display; (b) Internal emotional intervals and polarity differences distribution display.

Figure 7.
Spatial distribution of emotions. (a) Average score; (b) Top quartile score; (c) Lowest quartile score.
Figure 7.
Spatial distribution of emotions. (a) Average score; (b) Top quartile score; (c) Lowest quartile score.

Figure 8.
Mixed degree of land use.

Figure 9.
Spatial form: (a) Floor area ratio; (b) Building density.

Figure 10.
Road and traffic: (a) Road density; (b) Bus stop density; (c) Distance to nearest subway station; (d) Transportation facilities POI density.
Figure 10.
Road and traffic: (a) Road density; (b) Bus stop density; (c) Distance to nearest subway station; (d) Transportation facilities POI density.


Figure 11.
Green and open spaces: (a) Park square POI density; (b) Scenic spots POI density.

Figure 12.
Daily life service facilities: (a) Restaurant POI density; (b) Leisure and entertainment POI density; (c) Shopping service POI density; (d) Medical services POI density.
Figure 12.
Daily life service facilities: (a) Restaurant POI density; (b) Leisure and entertainment POI density; (c) Shopping service POI density; (d) Medical services POI density.

Figure 13.
Road and traffic: (a) Traffic congestion; (b) Freight traffic impact.

Figure 14.
GWR coefficients: (a–o) Representing the GWR coefficients between different built environment elements and emotions.
Figure 14.
GWR coefficients: (a–o) Representing the GWR coefficients between different built environment elements and emotions.


Table 1.
Part of the original data display.
| ID | Longitude | Latitude | Text | Number |
|---|---|---|---|---|
| 0 | 113.85714 | 30.254629 | 246 line scenery map appreciation, the original village station sign is still … | 20 February 2018 |
| 1 | 113.83689 | 30.65835 | Today’s driving is not as fast as walking. | 27 January 2018 |
| 2 | 113.82184 | 30.660141 | Another thief took public resources for private | 30 January 2018 |
| 3 | 114.10257 | 30.346842 | Wuhan’s snow is falling more and more, the highway is closed! I want to … | 26 January 2018 |
| 4 | 113.75531 | 31.019424 | Keep a good attitude, that very important person will come, just sooner … | 14 February2018 |
| 5 | 114.04178 | 30.70154 | Take a break. Let’s go on | 23 March 2018 |
| 6 | 114.10257 | 30.346842 | The excitement on the way out! Now, when others think about how to … | 27 January 2018 |
Table 2.
Part of the traffic dynamics data display.
| Longitude | Latitude | Status | Expedite | Congested | Blocked | Value |
|---|---|---|---|---|---|---|
| 113.85714 | 30.254629 | 1 | 50.00% | 0.00% | 50.00% | 3 |
| 113.83689 | 30.65835 | 1 | 0.00% | 100.00% | 0.00% | 3 |
| 113.82184 | 30.660141 | 1 | 33.33% | 33.33% | 33.33% | 2.998 |
| 114.10257 | 30.346842 | 1 | 40.00% | 40.00% | 20.00% | 2.4 |
| 113.75531 | 31.019424 | 1 | 25.00% | 75.00% | 0.00% | 2.25 |
| 114.04178 | 30.70154 | 1 | 20.00% | 20.00% | 20.00% | 2.2 |
| 114.10257 | 30.346842 | 1 | 50.00% | 33.33% | 16.67% | 2.0001 |
Table 3.
Negative vocabulary displays.
| Weight | Some Negative Vocabulary |
|---|---|
| −1 | no, not, can’t, not much, don’t have to, didn’t, no, don’t, none, non, don’t, in vain, hugh, white, empty, in vain, in no way … |
Table 4.
Negative vocabulary displays.
| Degree | Weight | Some Adverbs of Degree | Number |
|---|---|---|---|
| 1 | 3 | Very, extremely, fully, absolutely, most | 69 |
| 2 | 2.1 | super, over, excessive, more than, bias, extra | 30 |
| 3 | 1.5 | quite a lot, especially, extraordinarily, greatly | 42 |
| 4 | 1.06 | More, more and more, also, further | 37 |
| 5 | 0.75 | slightly, a little, somewhat | 29 |
| 6 | 0.53 | not a little, not very, not much, relatively | 12 |
Table 5.
Urban built environment measurement index system.
| Tier 1 Indicators | Tier 2 Indicators | Units |
|---|---|---|
| Land use | Mixed degree of land use | – |
| Spatial form | Floor area ratio | % |
| Building density | – | |
| Road and traffic | Road density | km/km2 |
| Bus stop density | pcs/km2 | |
| Distance to nearest subway station | km | |
| Transportation facilities POI density | pcs/km2 | |
| Freight traffic impact | – | |
| Traffic congestion | – | |
| Green and open spaces | Park square POI density | pcs/km2 |
| Scenic spots POI density | pcs/km2 | |
| Daily life service facilities | Restaurant POI density | pcs/km2 |
| Leisure and entertainment POI density | pcs/km2 | |
| Shopping service POI density | pcs/km2 | |
| Medical services POI density | pcs/km2 |
Table 6.
Intensity distribution of emotion scores.
| Value | 0–0.2 | 0.2–0.4 | 0.4–0.6 | 0.6–0.8 | 0.8–1 | Sum |
|---|---|---|---|---|---|---|
| Positive | 69,438 | 60,536 | 89,502 | 117,797 | 236,944 | 574,217 |
| Negative | 70,890 | 41,225 | 46,762 | 50,853 | 99,493 | 309,223 |
Table 7.
Statistics of built environment element values under different emotional polarities.
| Urban Built Environment | Total | Positive | Negative | ||||
|---|---|---|---|---|---|---|---|
| Average Value | Standard Deviation | Average Value | Standard Deviation | Average Value | Standard Deviation | ||
| Land use | Mixed degree of land use | 0.5475 | 0.5822 | 1.0763 | 0.5204 | 0.3523 | 0.4720 |
| Spatial form | Floor area ratio | 2.4440 | 3.7361 | 5.3191 | 4.6709 | 1.3828 | 2.6230 |
| Building density | 0.0609 | 0.0849 | 0.1201 | 0.0976 | 0.0390 | 0.0676 | |
| Road and traffic | Road density | 6.8872 | 6.5022 | 10.9595 | 6.9866 | 5.3841 | 5.6112 |
| Bus stop density | 6.6934 | 13.9940 | 12.0664 | 18.6165 | 4.7102 | 11.2072 | |
| Distance to nearest subway station | 3.4621 | 4.1325 | 1.1058 | 1.1331 | 4.3319 | 4.4835 | |
| Transportation facilities POI density | 2.3355 | 7.7844 | 5.9778 | 12.2998 | 0.9911 | 4.5187 | |
| Freight traffic impact | 48.8836 | 389.3905 | 63.7367 | 302.2095 | 43.4011 | 416.8560 | |
| Traffic congestion | 0.2319 | 0.3717 | 0.3991 | 0.4236 | 0.1701 | 0.3298 | |
| Green and open spaces | Park square POI density | 0.3240 | 3.0059 | 0.7911 | 4.7848 | 0.1516 | 1.9518 |
| Scenic spots POI density | 0.9026 | 8.6549 | 2.8130 | 15.8469 | 0.1974 | 2.8316 | |
| Daily life service facilities | Restaurant POI density | 18.7648 | 64.1207 | 45.6255 | 86.2631 | 8.8501 | 50.1771 |
| Leisure and entertainment POI density | 14.2956 | 36.3408 | 35.6877 | 52.7102 | 6.3995 | 23.4804 | |
| Shopping service POI density | 53.9652 | 170.9552 | 130.2214 | 258.9595 | 24.4489 | 1,106,538 | |
| Medical services POI density | 8.0928 | 21.6962 | 18.8236 | 32.1794 | 4.1319 | 14.2851 | |
Table 8.
Geographically weighted regression parameters.
| Varname | Variable |
|---|---|
| Bandwidth | 7501.522 |
| Residual Squares | 101.261 |
| Effective Number | 244.445 |
| Sigma | 0.131 |
| AICc | −7382.546 |
| R2 | 0.655 |
Table 9.
Distribution of the regression coefficients of independent variables.
| Explanatory | Average | Minimum | Maximum | % of Positive | % of Negative |
|---|---|---|---|---|---|
| Mixed degree of land use | 0.04706 | −0.21335 | 0.207051 | 98.84% | 1.16% |
| Floor area ratio | −0.19383 | −0.04334 | 0.398989 | 59.29% | 40.71% |
| Building density | −0.048451 | −4.86299 | 3.956941 | 48.56% | 51.44% |
| Road density | 0.001778 | −0.00785 | 0.009447 | 68.59% | 31.41% |
| Bus stop density | 0.000687 | −0.00272 | 0.006895 | 66.55% | 33.45% |
| Distance to nearest subway station | −0.29818 | −0.13458 | 0.010312 | 4.07% | 95.93% |
| Transportation facilities POI density | −0.000313 | −0.15775 | 0.21269 | 48.46% | 51.54% |
| Freight traffic impact | −0.000015 | −0.00094 | 0.000202 | 42.49% | 57.51% |
| Traffic congestion | −0.040992 | −0.11581 | 0.190944 | 21.56% | 78.44% |
| Park square POI density | 0.002059 | −0.13386 | 0.60973 | 54.93% | 45.07% |
| Scenic spots POI density | 0.00629 | −0.25801 | 0.112994 | 71.02% | 28.98% |
| Restaurant POI density | 0.000106 | −0.0013 | 0.002887 | 48.80% | 51.20% |
| Leisure and entertainment POI density | 0.00193 | −0.00735 | 0.003355 | 55.86% | 44.14% |
| Shopping service POI density | 0.000125 | −0.00111 | 0.002496 | 69.36% | 30.64% |
| Medical services POI density | 0.000243 | −0.0061 | 0.004681 | 73.38% | 26.62% |
Publisher’s Note: MDPI stays neutral with regard to jurisdictional claims in published maps and institutional affiliations. |
© 2021 by the authors. Licensee MDPI, Basel, Switzerland. This article is an open access article distributed under the terms and conditions of the Creative Commons Attribution (CC BY) license (https://creativecommons.org/licenses/by/4.0/).
Share and Cite
MDPI and ACS Style
Ma, Y.; Yang, Y.; Jiao, H. Exploring the Impact of Urban Built Environment on Public Emotions Based on Social Media Data: A Case Study of Wuhan. Land 2021, 10, 986. https://doi.org/10.3390/land10090986
AMA Style
Ma Y, Yang Y, Jiao H. Exploring the Impact of Urban Built Environment on Public Emotions Based on Social Media Data: A Case Study of Wuhan. Land. 2021; 10(9):986. https://doi.org/10.3390/land10090986
Chicago/Turabian StyleMa, Yuanyuan, Yunzi Yang, and Hongzan Jiao. 2021. "Exploring the Impact of Urban Built Environment on Public Emotions Based on Social Media Data: A Case Study of Wuhan" Land 10, no. 9: 986. https://doi.org/10.3390/land10090986
Note that from the first issue of 2016, this journal uses article numbers instead of page numbers. See further details here.