Can Emission Trading Scheme Improve Carbon Emission Performance? Evidence From China
 Yuhua Zheng
 Xiaoyang Sun2
  Chenyu Zhang
 Daojuan Wang
- 1Business School, Beijing Technology and Business University, Beijing, China
- 2School of Economics and Management, China University of Labor Relations, Beijing, China
- 3Aalborg University Business School, Aalborg University, Aalborg, Denmark
- 4Business School, Renmin University of China, Beijing, China
This paper explores the effect of China’s emission trading scheme (ETS) pilot policy implemented during 2013-2014 on carbon emission performance. Adopting the Difference-in-Difference (DID) model, we find that: 1) China’s ETS pilot policy can significantly improve the carbon emission performance of listed companies in the pilot provinces. 2) The heterogeneity analysis shows that the carbon emission performance of listed companies in the eastern coastal pilot areas has improved significantly, which is not significant in the central and western pilot areas. 3) We find that China’s ETS pilot policy can significantly improve innovation capabilities of listed companies, suggesting that innovation is a channel for the impact of the China’s ETS pilot policy on carbon emission performance in the pilot provinces. Overall, our study shows that ETS pilot policy has played a governance role in China and improved carbon emission performance. We further highlight some important policy implications with respect to helping companies save energy and reduce emissions, and promoting the further improvement of China’s ETS pilot policy.
1 Introduction
In order to cope with the problem of global warming and seek a balance and win-win situation between the economy and the environment, countries around the world have never stopped making efforts to explore. In May 1992, the United Nations Framework Convention on Climate Change (UNFCC) (United Nations, 1992) was formally promulgated, requiring all countries in the world to assume “common but differentiated” responsibilities to jointly reduce carbon dioxide and other greenhouse gas emissions. In December 1997, as a supplement to the UNFCC, the Kyoto Protocol of the United Nations Framework Convention on Climate Change mandated the emission reduction obligations and emission reduction methods for developed and developing countries, and artificially created a carbon trading market for the first time in the form of regulations, effectively promoting the rapid development of international carbon trading and carbon finance activities. As the world’s second-largest economy, China has taken the initiative to claim carbon emission reduction obligations and actively deployed carbon emission rights trading markets. In July 2010, December 2012, and January 2017 (National Development and Reform Commission, 2010; National Development and Reform Commission, 2012; National Development and Reform Commission, 2017), the National Development and Reform Commission of China has successively identified three batches pilot areas; With the advancement of low-carbon pilot policies, from June 2013 to June 2014, 6 provinces in the low-carbon pilot regions (General Office of National Development and Reform Commission, 2011) (including Shenzhen, Shanghai, Beijing, Guangdong Province, Tianjin, Hubei Province, and Chongqing) has successively carried out carbon emission trading, which opened the curtain of China’s ETS pilot policy. These six pilot provinces span the east, middle and west regions, and the level of regional economic development is quite different. The specific system design reflects certain regional characteristics. We searched for the keyword “carbon dioxide” through the website of Baidu Index (https://index.baidu.com/). The two spatial distribution maps (Figures 1, 2) are the results of a portrait of searchers from July 1, 2013 to July 31, 2021 at the province and city level, respectively. As can be seen from the search volume ranking in Figure 1, 4 of the top 10 provinces are the pilot provinces. From the search volume ranking in Figure 2, it can be seen that 6 of the top 10 cities belong to the pilot provinces, which shows that the public in the pilot provinces have been paying continuous attention to carbon dioxide since the implementation of China’s ETS pilot policy, the most important component is greenhouse gas. China’s ETS pilot policy has played a long-term guiding role, and raised people’s awareness of greenhouse gas emission reduction and environmental protection.
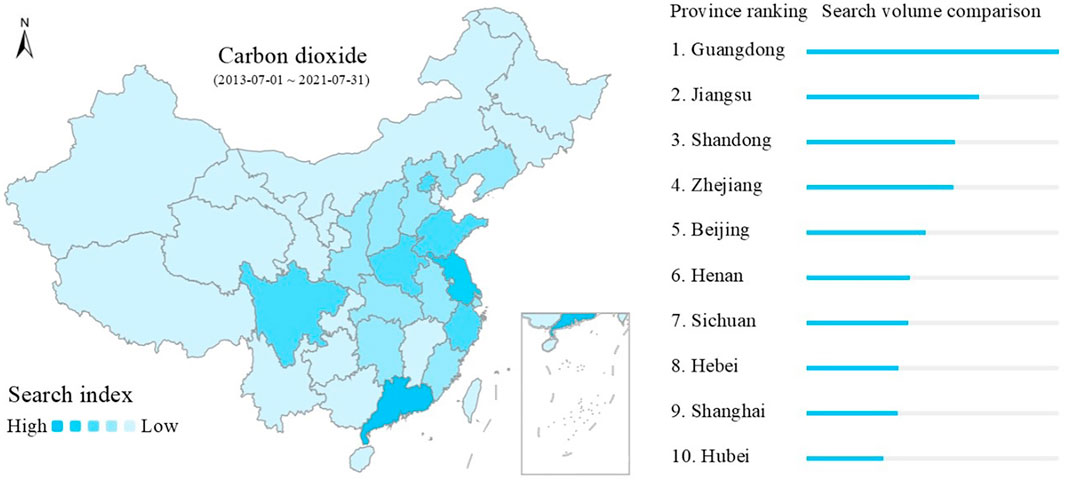
FIGURE 1. Spatial distribution map of the CO2 search index at the province level.
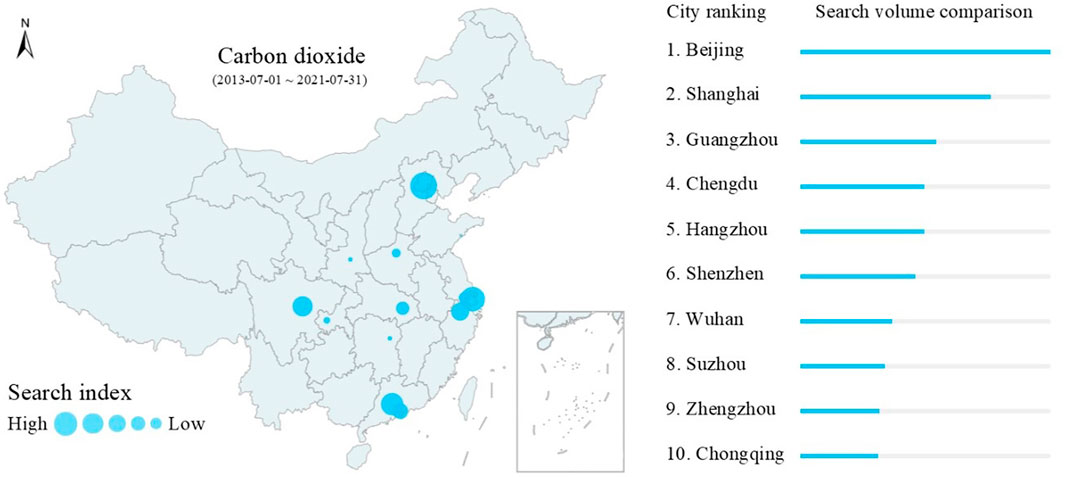
FIGURE 2. Spatial distribution map of the CO2 search index at the city level.
After President Xi Jinping’s pledge in September 2020 to peak China’s CO2 emissions before 2030 and achieve carbon neutrality by 2060, attention on climate policy has reached new highs and turned to domestic implementation (ICAP, 2021). The public’s attention on carbon trading is also increasing over time. We comparatively searched the keywords “carbon trading” and “carbon peak” on the website of Baidu Index (https://index.baidu.com/). The trend of Keyword search (Figure 3) shows the searchers’ continued attention on carbon trading (blue line) and carbon peak (green line) from January 1, 2011 to July 31, 2021. Figure 3 shows that the search peaks for carbon trading are in November–December 2013, June–July 2014, November–December 2017, and June–July 2021. We know that Shanghai was established as the ETS pilot city on November 26, 2013, Chongqing was established as the ETS pilot city on June 19, 2014, and China’s national ETS market was launched on December 19, 2017. During the NPC and CPPCC session in 2021, “carbon peak” and “carbon neutral” were first written in the Government Work Report (The State Council, 2021). The search for “carbon neutrality is” also rising. Figure 3 shows that, since 2021 there has been a lagging positive correlation between the search trends of keywords “carbon trading” and “carbon peak”. It can be seen that the public have been paying continuous attention to carbon emissions policies, which shows that the effect of China’s ETS pilot policy has extremely important practical significance.
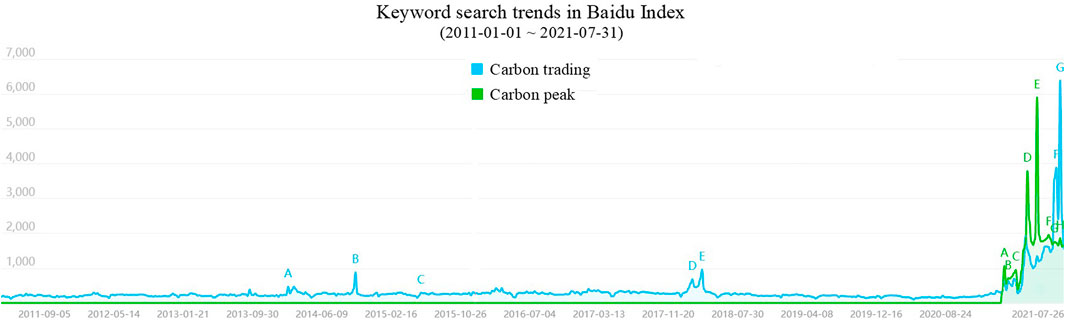
FIGURE 3. Keyword search trends in Baidu Index.
The “14th Five-Year Plan” period will be an important period for China’s energy transition. Building a national carbon emission trading market is a major institutional innovation to use market mechanisms to control and reduce greenhouse gas emissions and promote the development of a green and low-carbon economy, which is an important policy tool for achieving carbon peaks and carbon neutral. Hence, can China’s ETS pilot policy effectively improve the carbon emission performance of listed companies? Which channels do listed companies take to improve their carbon emission performance during the energy transition period? Based on this study, what can we share with the China’s ETS market? Answering these issues will have important significance for Chinese companies to reduce carbon emissions, and can play a vital role in achieving China’s carbon peak, carbon neutrality and nationally determined contribution goals.
Smith (1976) believes that price guides the demanders and suppliers in the market, promotes the equilibrium of supply and demand, finally realizes the optimal allocation of social resources and maximizes the total social benefits, just like an “invisible hand.” However, due to the existence of externalities, market failures will still occur, while buyers and sellers ignore the external effects of their actions on bystanders, resulting in that the total benefits of the entire society are not maximized when the market is in equilibrium. The concept of externality was put forward by Pigou (1920). When a person’s behavior affects the welfare of the bystander, but he does not compensate the bystander or receive compensation from the bystander, externality occurs. If the impact on bystanders is beneficial, it is called a positive externality, such as developing new technologies and getting a new coronavirus vaccine. While if the impact on bystanders is unfavorable, it is called a negative externality, such as smoking and excessive carbon emission (Li et al., 2014). Pigou proposed the “Pigou tax” in 1912 to solve the externality problem, which was later questioned by Coase. Coase (1960) believed that this problem could be solved through environmental regulations such as property right definitions and market transactions, so that the Pareto optimal state achieves through the re-allocation of resources. And carbon emission trading is a means of environmental regulation to control carbon emission through market transactions.
When the total amount of carbon emission allowances is set, carbon emission rights become a scarce resource, and scarcity is one of the driving forces of market transactions. When such rights are allowed to be traded, a carbon emission trading market has emerged. The EU has the world’s largest carbon emission trading market-EU emission trading scheme (EU ETS), which is an important reference in the construction of China’s carbon emission trading market. Whether the EU’s carbon emission trading scheme can play an expected role in China is worthy of in-depth study. Prior studies focused on the macro impact of China’s ETS pilot policy, but few studies on the micro level.
There are three main contributions of this study. 1) We extend the research to the micro level of the firms on the basis of extensive research on regional carbon emissions by predecessors. Based on the setting of quasi-natural experiments, this paper examines the impact of China’s ETS pilot policies on the carbon emission performance of listed companies in the pilot provinces, which provides evidences for China regulators to further improve ETS. 2) We explore the impact mechanism of China’s ETS on the carbon emission performance of listed companies. By investigating the mechanism effects of corporate innovation under the influence of policy, we provide an experience for companies to recognize the influencing factors of carbon emission intensity and improve their carbon emission performance, as well as support for China to formulate guiding policies. 3) More comprehensive industries are covered in this study. Listed companies in all industries have been included, in order to observe the proactive response of all industries after the implementation of the China’s ETS pilot policy, and provide forward-looking support for companies’ future development.
This paper is structured as follows: Section 2 organizes the literature on the policy effect of carbon emission trading scheme, the determinants of carbon emission intensity, the quantitative research methods on effects of China’s ETS pilot policy, and summarizes research gap. Section 3 provides the framework and hypotheses. Section 4 presents the sample, model, and descriptive statistics. Section 5 presents the empirical results and discussion. Section 6 concludes the paper and addresses the policy implications.
2 Literature Review and Research Gap
The global carbon emission trading market is in full swing. As of January 31, 2021, there are 24 ETS in force all over the world (ICAP, 2021). China’s national carbon emission trading market has been opened on July 16, 2021. Controlling and reducing greenhouse gas emissions through market mechanisms is a major institutional innovation to promote the development of a green and low-carbon economy. Scholars are enthusiastic about the research in this area. Our study intends to discuss the extant literature under three strands of research: 1) Research on policy effects of emission trading scheme; 2) Research on the determinants of carbon emission intensity; and 3) Quantitative research methods on effects of China’s ETS pilot policy.
2.1 Research on Policy Effects of Emission Trading Scheme
Taking the largest carbon emission trading scheme in the world, EU ETS, as an example, the scheme has a positive inhibitory effect on the overall carbon dioxide emissions of the region (Abrell et al., 2011), but this effect has been uneven in different countries and different industries. For example, Borghesi et al. (2015) found that the implementation of European carbon trading policy effectively reduced the carbon emissions of the Italian manufacturing sector. For the German manufacturing industry, compared with companies that have not joined the carbon emission trading scheme, the companies that have joined the carbon emission trading scheme have reduced the consumption of natural gas and petroleum products, and reduced carbon dioxide emissions by 20% between 2007 and 2010 (Petrick and Wagner, 2014). An empirical study of more than 5,000 Lithuanian companies from 2003 to 2010 by Jaraite-Kažukauske and Di Maria. (2016) shows that EU ETS did not achieve any emission reduction results during the first year of implementation, and was only effective from 2006 to 2007. the EU ETS did not represent a drag on the profitability of participating firms. Wang et al. (2021) showed that the implementation of China’s ETS pilot policies can promote the upgrading of industrial structure. However, differences in economic development and technological levels mean that different regions have different policy effects. Empirical analysis supports Porter’s hypothesis that technological innovation has an intermediary effect on the impact of emissions trading on the upgrading of industrial structure. Zhang S. et al. (2021) verified the positive effects of China’s ETS and found that China’s ETS significantly improved the efficiency of green development and regional carbon equality. Mechanism analysis further shows that China’s ETS promotes regional carbon equality by increasing green total factor productivity and reducing investment in carbon-intensive industries in pilot provinces, confirming the Porter hypothesis and the effect of investment transfer.
Other studies have shown that the carbon emission trading scheme has not yet reached a significant reduction in emissions. There is little evidence the implementation of the NZ ETS has led to any reduction in greenhouse gas emissions (Evison, 2017). Streimikiene and Roos (2009) studied the changes in carbon emissions in the Baltic countries and concluded that the EU ETS has not yet delivered its real potential to reduce emissions in a cost-effective way because of the surplus of greenhouse gas (GHG) emission allowances in first trading period. Cao et al. (2021) conducted a retrospective analysis on the effectiveness of the China’s ETS pilot policy in reducing carbon emissions in the power industry, and found that the China’s ETS pilot policy did not significantly improve the carbon efficiency of coal-fired power plants, because the production activities of power plants are subject to the instructions of the competent authorities, and the power industry in China is highly regulated. Chen et al. (2021) analyzed green patent data of listed companies in 31 provinces (municipalities or autonomous regions) from 1990 to 2018 and found that the China’s ETS pilot policy significantly reduced the proportion of green patents. In addition, companies mainly achieve emission reduction targets by reducing production. However, due to the decrease in cash flow and expected income, companies have reduced their investments in research and development, which is not conducive to green innovation.
2.2 Research on the Determinants of Carbon Emission Intensity
There are many determinants of carbon emission intensity. Researches have been deepened step by step from the national level, the regional level to the firm level. Researches are relatively mature on the national level, have been in full swing in the past 2 years on the regional level, while are relatively rare on the firm level.
On the national level, many scholars have found that political factors [such as political polarization (Aller et al., 2021)], economic factors [such as economic growth (Dong et al., 2020b), urbanization (Wang et al., 2021), industrialization (Zhang et al., 2014), and foreign direct investment (Zhang et al., 2020)], population factor [such as population growth (Dong et al., 2020b), and per capita income (Balado-Naves et al., 2018)], technological factors [such as ICT (Xuan et al., 2020), and technological innovation (Zhang et al., 2016; Lin and Zhu, 2019)], legal factors [such as carbon emissions trading scheme (Zhou et al., 2019)], and other factors [such as the expansion of natural gas infrastructure (Dong et al., 2020a), and force majeure (Zaman et al., 2017; Wang and Wang, 2020; Zhang X. et al., 2021)] will directly or indirectly affect the carbon emission intensity and efficiency of each country. Grossman and Krueger (1991) studied Mexico’s further trade liberalization and found that the reduction of trade barriers would affect the environmental quality by expanding the scale of economic activities, changing the composition of economic activities, and changing production technologies, and also described the inverted U-shaped relationship between economic growth and pollutant emissions (sulfur dioxide and “smog”), which is called the Environmental Kuznets Curve (EKC) hypothesis. This hypothesis has been verified by many scholars (Al-Mulali et al., 2015; (Balado-Naveset et al., 2018; Hao et al., 2018; Leal and Marques, 2020). However, Munir et al. (2020) considered the Cross-sectional Dependence and re-examined the relationship between CO2 emissions, energy consumption (EC) and economic growth (GDP) in the five countries of the Association of Southeast Asian Nations (ASEAN) between 1980–2016, and found that traditional research has misleading conclusions about the Granger causality between EKC and CO2, EC and GDP. The relationship between CO2, EC and GDP among the five ASEAN countries is heterogeneous. Cheng et al. (2019) used the panel quantile regression method to study the impact of economic growth, renewable energy, and increased patents on carbon emissions. The results did not support the EKC hypothesis, and the impact of increased patents on carbon emissions was not significant. It can be seen that the “black box” of the relationship between economic growth and pollutant emissions needs to be further “opened”. In terms of technical factors, Lahouel et al. (2021) confirmed that the popularization of information and communication technology (ICT) in Tunisia can promote economic growth, thereby increasing the carbon emission efficiency. Zhang X. et al. (2021)compared the effects of SARS and COVID-19 on CO2emissions, and found that COVID-19 had a much greater impact.
On the regional level, A large number of academic articles in the field of regional carbon emissions have emerged in China in recent years. Chen et al. (2018)found that the main factors contributing to the increase in carbon emissions in Macau are economic scale effect and energy structure change. Based on the research at the city level in China, using the propensity score matching-DID method (PSM-DID), Zhou and Liu (2020)found that the China’s ETS pilot policy has a significant restrictive effect on the carbon emission intensity of pilot cities. As the policy continues to be implemented, the restrictive effect becomes more obvious. Adding intermediary variables, it is found that adjustment of industrial structure and energy conservation in pilot cities are beneficial to reducing carbon emission intensity. Zhang et al. (2020) conducted a study on panel data at the city level in China from 2004 to 2015 and found that pilot areas that adopted carbon emission trading policies reduced carbon emissions by about 16.2%. This impact is particularly significant in the economically developed areas of eastern China. Based on the DID model, Wen et al. (2020)selected 10 cities in Hubei Province and Hunan Province as the treatment group and control group respectively. They found that the implementation of ETS had little significant impact on industrial carbon emission, gross domestic product (GDP), energy consumption intensity and carbon emission intensity in Hubei Province.
On the firm level, there is relatively little research on related aspects. Liu et al. (2021)found that Chinese companies with higher profit pressure will also have higher sulfur dioxide emission intensity, which reflects the conflict between financial goals and environmental goals to a certain extent. Using the panel data of Chinese A-share listed companies from 2008 to 2016, Hu et al. (2020)constructed a quasi-natural experiment based on the DDD model and found that China’s ETS has a significant positive impact on the quantity and quality of innovation. However, the impact of China’s ETS on the innovation quantity, low-quality innovations, and high-quality innovations is reduced in turn. China’s ETS only promotes the innovation quantity and high-quality innovations in State-owned enterprises, large-scale enterprises and eastern enterprises.
2.3 Quantitative Research Methods on Effects of China’s ETS Pilot Policy
Considering factors such as research objects and research conditions, Chinese scholars chose different quantitative research methods when studying effects of China’s ETS pilot policy. There are more representative of the quantitative research methods: Difference-in-Difference (DID) model, Propensity score matching and difference-in-difference (PSM-DID) model, Difference-in-Difference-in- Difference (DDD) model, and so on. DID is a classic method in the field of policy effect evaluation, and is widely used in researches on policy effects (Feng et al., 2017; Dong et al., 2019; Wen et al., 2020). When using DID we should realize that there are significant differences in the characteristics of the treatment and control groups. Non-overlapping bias and the density weighting bias could result if such differences are correlated to the dynamics of the dependent variables (Heckman et al., 1998). Compared with DID, PSM-DID eliminates the systematic differences in individual characteristics between the two groups (Zhang et al., 2019; Zhou et al., 2019; Huang et al., 2021). The parallel trend assumption of DID model is sometimes difficult to meet in actual research. In order to solve this problem, DDD model can be adopted (Gao et al., 2020; Hu et al., 2020). There are also some other methods used, such as the synthetic control approach (Cheng et al., 2019), the two-step panel quantile regression approach (Dong et al., 2020a), and the data envelopment analysis (DEA) model (Dong et al., 2019).
2.4 Literature Gap
From the previous literature review, it can be seen that scholars have done a lot of research on the policy effects of domestic and foreign carbon emission trading scheme and on the determinants of carbon emission intensity, using different research methods. However, there are still research shortcomings. First of all, on the effects of China’s ETS pilot policy, a large number of studies have focused on the regional level, from the macro perspective of provinces, regions, and cities. However, few scholars research on the firm level. After all, enterprises are cells of the economy, and macro data is also aggregated from micro data of enterprises. The agglomeration effect of corporate carbon emission intensity is reflected in the intensity of regional carbon emissions. The regional carbon emission effects have been studied by scholars from multiple perspectives, while research on the micro level is less. Secondly, the existing firm-level literatures focus on the impacts of China’s ETS pilot policy on corporate green innovation, or research on the impact of corporate carbon mitigation in a certain industry. Few literatures pay attention to the comprehensive reflection of the carbon emission performance of listed companies in all industries under the impact of policies. Thirdly, with the opening of China’s national carbon emission trading market on July 16, 2021, the government’s determination to control carbon emissions has become increasingly firm, and the measures to control emissions have become increasingly stringent. All walks of life should take precautions. So, what mechanism does the China’s ETS policy use to affect the carbon emission performance of listed companies? What measures should be taken by listed companies to improve carbon emission performance? Researches in these areas are very important, but there are very few existing literatures that need to be supplemented.
3 Hypotheses Development
The essence of carbon emission right is a legalized emission right, and carbon emission trading is to commercialize this right through market transactions. The carbon emission trading mechanism is to use environmental regulations to make up for market failures caused by externalities. Its ultimate goal is still to reduce greenhouse gas emissions. According to national conditions, China sets a total carbon emission target. According to this target, China determines their own quotas for key carbon emission management companies in each pilot city. Each company arranges carbon emissions according to the size of the quota. If the quota is exceeded, it must be purchased from other companies with surplus quotas in the market to make up for the lack of their own quota. If the quota is surplus, the company can sell it to other companies with insufficient quotas in the secondary market to obtain income. For companies, under the inevitable external policy pressure, they must find ways to improve carbon emission performance and reduce carbon emission intensity in order to obtain new life. In addition, researches have confirmed that China’s ETS negatively affected pollutant emissions in pilot cities (Zhang et al., 2019; Huang et al., 2021). And companies’ carbon emissions are an important part of urban carbon emissions, so we speculate that China’s ETS pilot policy can reduce companies’ carbon emission intensity and improve their carbon emission performance. Based on the above discussion, we propose the following hypothesis.
Hypothesis 1. China’s ETS pilot policy can improve the carbon emission performance of listed companies in the pilot provinces.The Porter hypothesis (Porter, 1991) believes that appropriate and scientific environmental regulations will have a positive externality effect on enterprises. The environmental regulations improve production technology and processes by forcing companies to transform traditional extensive business models at the expense of resources. And the increase in productivity and production efficiency brought about by technological innovation can offset the additional costs caused by environmental regulations and increase the company’s additional net income, thereby achieving social and economic development. In addition, based on corporate innovation, the company upgrades low-carbon technology, which not only can reduce the environmental pollution that may be caused by all aspects of production activities, but also reduce energy consumption, save resources, and reduce enterprise production costs, thereby making product prices more competitive. Therefore, under China’s ETS pilot policy, companies have the motivation to increase innovation investment and improve innovation capabilities. In addition, researches have confirmed that technological innovation is one of the key factors affecting carbon emissions (Zhang et al., 2016; Lin and Zhu, 2019). China’s ETS pilot policy can significantly promote technological innovation (Liu and Sun, 2021). Therefore, we propose the following hypothesis.
Hypothesis 2. China’s ETS pilot policy can improve the carbon emission performance of listed companies in the pilot provinces, through promoting corporate innovation.
4 Research Design
4.1 Sample Selection
Our sample is composed of listed companies on the Shanghai Stock Exchange (SHSE) and Shenzhen Stock Exchange (SZSE) in 293 prefecture-level cities in China from the China Stock Market and Accounting Research (CSMAR) system over the period of 2008–2018. Since the China’s ETS pilot policy started from June 2013 to June 2014, the year 2014 will be taken as the time point for external policy shocks. Listed companies registered in the pilot provinces are set as the experimental group, and listed companies registered in the non-pilot provinces are set as the control group. In order to ensure the validity of the data processing results, this article screens the samples as follows before the analysis: 1) Exclude ST or *ST companies; 2) Exclude companies with incomplete data or abnormal financial data. Finally, 105 unbalanced panel data were constructed. The sample distribution by industry is presented in Table 1.
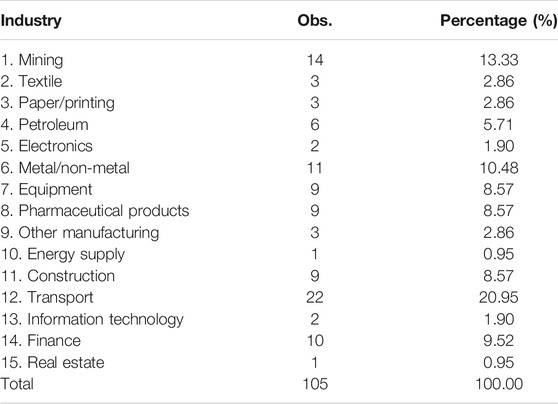
TABLE 1. Sample distribution by industry.
4.2 Model
The Difference-in-Difference method obtains the net effect of policy impact by eliminating the interference of time effect and fixed effect on the explained variables (Ashenfelter and Card, 1985), which is a classic powerful tool in the evaluation method of policy effect. Because the policy is exogenous, the DID model can avoid the endogenous problem to a great extent. At the same time, the use of fixed effect estimation can also alleviate the problem of missing variables to a certain extent. This paper regards the impact of China’s ETS pilot policy in 2014 as a quasi-natural experiment, and uses the DID model to compare the carbon emission performance and the corporate innovation level of Listed Companies in the experimental group and the control group before and after the implementation of the policy, so as to present the policy effect more intuitively. Therefore, the benchmark panel DID model is constructed as follows:
Carbon emission performance and corporate innovation are used as the dependent variables, denoted by CO2 and R&D (Ting et al., 2021), respectively.
Carbon emission intensity is a traditional measure of corporate carbon emission performance (Ding et al., 2019). On the macro level, carbon emission intensity is equal to carbon dioxide emissions per unit of GDP (Zhu and Li, 2021). By analogy with this method and considering the availability of sample data, on the firm level, we use the carbon dioxide emissions per unit of assets or income to measure carbon emission intensity. R&D is measured by R&D investment/Total assets based on input of corporate innovation (Ting et al., 2021). To control any factors that may explain the change in carbon emission performance and corporate innovation, we select the following control variables (He and Tian, 2013; Hu et al., 2020; Wen et al., 2020; Lv and Bai, 2021; Ting et al., 2021): Company Size (Size), Leverage level (Lev), Company listing year (Age), Cash flow level (CFO), Proportion of fixed assets (Tangibility), Company growth ability (Growth), Board size (Board), Proportion of independent directors (Indd), and The development of Local economic in province level (GDP). Detailed variable definitions are presented in Table 2.
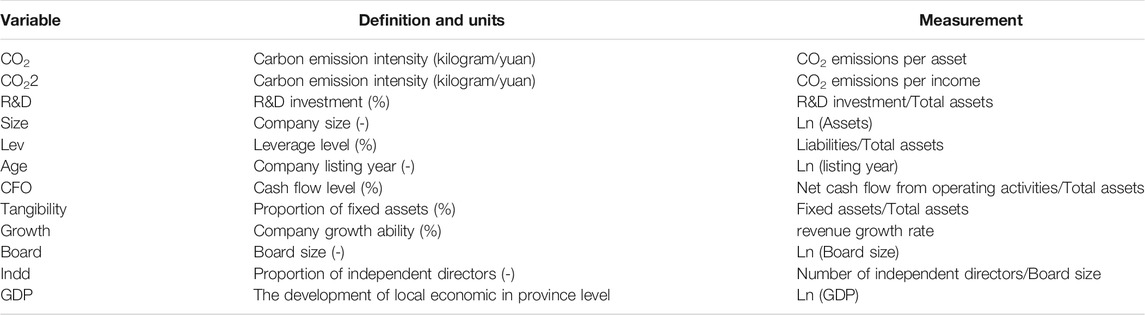
TABLE 2. Variable definition.
4.3 Descriptive Statistics
Table 3 reports the descriptive statistics of the variables. The mean value of carbon emission intensity in our sample is 0.092 kg per yuan, measured by amount CO2 emissions divided by asset, suggesting that unitary asset will generate 0.092 kg CO2. However, there is a big difference of carbon emissions among companies. The minimum value of CO2 is 0.001, the maximum value is 1.596. We have the similar finding when using CO22, measured by amount CO2 emissions divided by revenue, the mean (median) value is 0.174 (0.017). The results of other variables are consistent with prior literature.
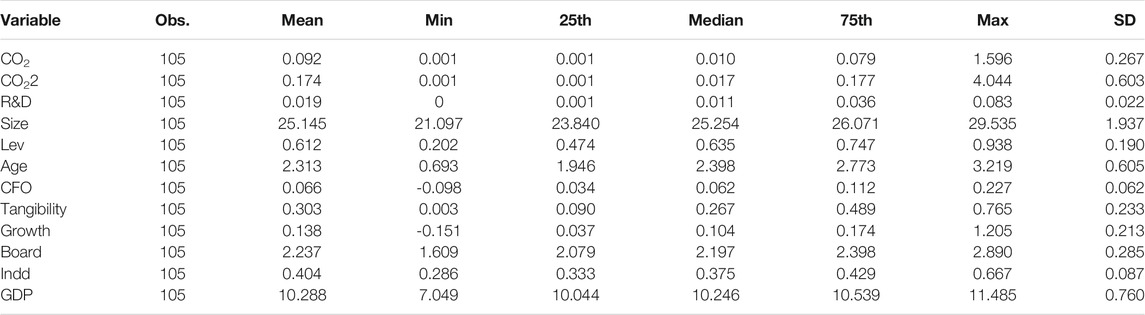
TABLE 3. Descriptive statistics of variables.
5 Empirical Results
5.1 Basic Analysis of the Difference-in-Difference Regression Results
Based on the benchmark regression analysis, we apply the DID method to investigate the average treatment effect of carbon emission performance of listed companies in the pilot provinces The results for carbon emission performance as the explained variable are reported in Table 4.
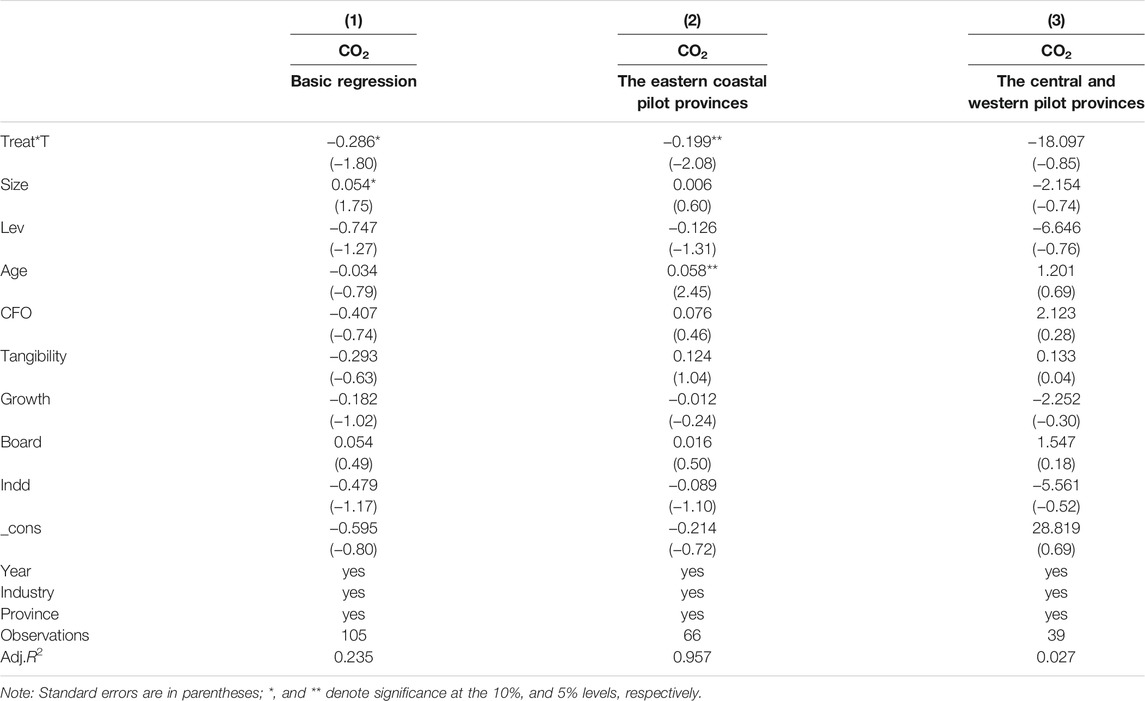
TABLE 4. The impact of China’s ETS pilot policy on carbon emission performance.
The basic regression results in the first column show that the coefficient of
Based on the basic regression analysis, a heterogeneity analysis is conducted. According to the marketization index, the samples are divided into high and low groups. The second and third columns of Table 4 show that the carbon emission performance of listed companies in the eastern coastal pilot provinces has improved significantly, but not in the central and western pilot provinces. It can be seen that the higher the degree of marketization, the better the company’s business environment and the more focused on carbon emission performance.
5.2 Mechanism Analysis
The test results of Eq. 1 for corporate innovation as the explained variable are reported in Table 5.
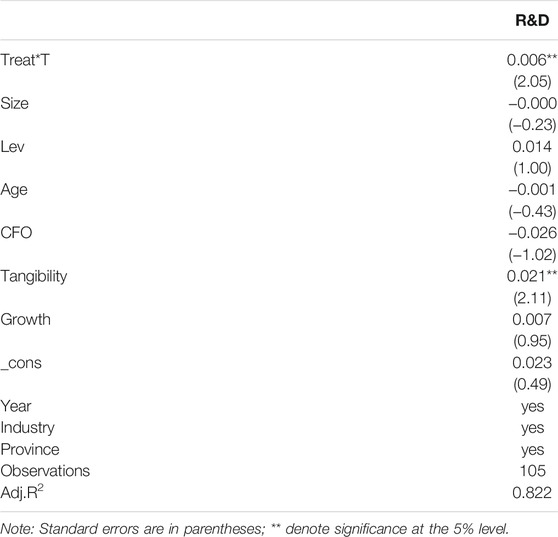
TABLE 5. The impact of China’s ETS pilot policy on innovation.
The results show that the coefficient of
5.3 Robustness Tests
Through the basic regression analysis, it is known that the China’s ETS pilot policy can reduce the carbon emission intensity of listed companies in the pilot provinces and improve their carbon emission performance. In order to reduce the error of DID estimation and ensure the reliability of the conclusion, we use different methods to conduct robustness tests. The results are shown in Table 6.
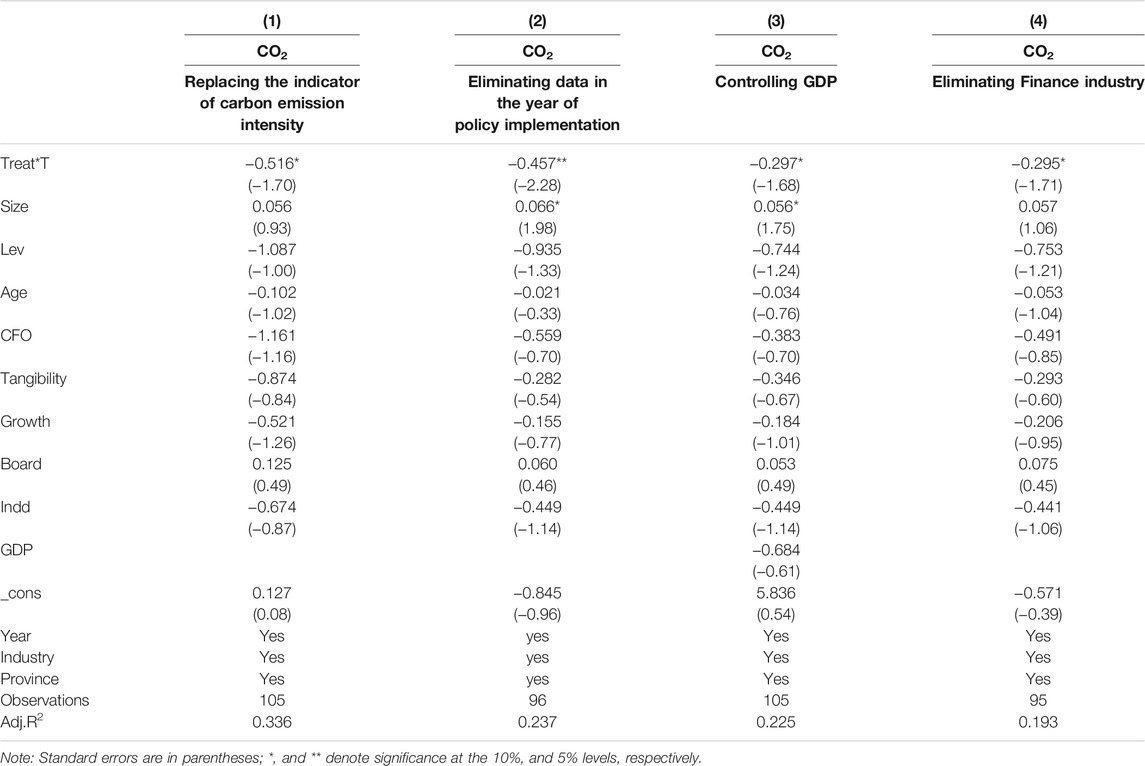
TABLE 6. Robustness test results.
Method 1: Replacing the indicator of carbon emission intensity. Carbon emission intensity is measured by CO2 emissions per unit of income (unit: kg/yuan). The first column of Table 6 shows the regression results. It can be seen intuitively that the coefficient of
Method 2: Eliminating the interference caused by the policy implementation years of 2013 and 2014. The second column of Table 6 shows the regression results. It can be seen intuitively that the coefficient of
Method 3: Controlling the variable of area characteristic. The third column of Table 6 shows the regression results. It can be seen intuitively that the coefficient of
Method 4: Eliminating Finance industry. The fourth column of Table 6 shows the regression results. It can be seen intuitively that the coefficient of
In Table 6, we find that the estimated coefficients of
6 Conclusion
In this study, based on Shanghai and Shenzhen A-share listed companies’ panel data over period of 2008–2018, we explore whether the China’s ETS pilot policy can improve carbon emission performance by using the DID model. Our study finds that 1) China’s ETS pilot policy can significantly improve the carbon emission performance of listed companies in the pilot provinces. 2) However, the carbon emission performance of listed companies in the eastern coastal pilot provinces has improved significantly, but not in the central and western pilot provinces. 3) Furthermore, we find that China’s ETS pilot policy can significantly improve innovation capabilities of listed companies, suggesting that innovation capabilities can effectively improve carbon emission performance.
Based on the above findings, several policy implications are provided as follows. 1) We suggest that China should further encourage enterprises to invest in innovation, especially low-carbon technological innovation, through tax cuts, government subsidies, etc. Innovative enterprises in the industry should take the lead, organize emission reduction alliances, and leverage the advantages of economies of scale. It is very necessary for the state to provide support through various support policies to enhance the overall low-carbon innovation strength of the industry and provide strong backing support for the introduction of low-carbon technologies for small and medium-sized enterprises. 2) With the continuous improvement of national economic strength and production efficiency, the industry is gradually diversified. Scarce resources such as carbon emission rights can also bring benefits to enterprises. In the process of market selection, enterprises will take advantage of economies of scale and continuously improve their carbon emission performance. In industries with low carbon emission efficiency, small and medium-sized enterprises will be gradually eliminated. Therefore, it is necessary for the state to formulate relevant policies to guide small and medium-sized enterprises to transform into industries with low carbon emissions (such as service industries). 3) It is proposed to “accelerate the establishment of a three-level greenhouse gas emission accounting system at the national, local and corporate levels” in the “Twelfth Five-Year Plan for Controlling Greenhouse Gas Emissions.” At present, the disclosure system of the Social Responsibility Report of listed companies is still being further improved. From the reports disclosed by various companies, it can be seen that the lack of data is serious and the continuity of the report is not strong. Although some companies continue to disclose the Social Responsibility Report, it is just a mere formality and does not really speak with the data. It can be seen that the corporate greenhouse gas emission accounting ability needs to be further improved, and government departments should increase the intensity of supervision and guidance. 4) Since the basic data on greenhouse gas emissions at the corporate level is relatively weak, and the evaluation methods for the effect of policy implementation are limited, it is difficult to evaluate the effect of China’s carbon emissions trading pilot policies at the corporate level. This can easily mislead us to objectively and comprehensively evaluate the effects of China’s ETS (pilot) policy, which hinders the optimization and improvement of the pilot ETS and even the design of the national ETS. Based on this, the government should pay attention to the evaluation of the pilot ETS policies, authorize evaluation qualifications for relevant agencies, encourage evaluation agencies to compete and supervise together, guide enterprises in scientific, effective and precise emission reduction, improve the external benefits of environmental regulations to enterprises, mobilize the enthusiasm of enterprises to fulfill their environmental responsibilities, make enterprises change from passive to active, form a virtuous cycle of economy and environment, realize the environmental and economic benefits in the “Porter Hypothesis,” assist the country in scientific decision-making, change the extensive economic development and insist on the harmonious coexistence of man and nature.
Data Availability Statement
The raw data supporting the conclusion of this article will be made available by the authors, without undue reservation.
Author Contributions
YZ: conceptualization, validation, investigation, resources, writing—original draft, writing—review and editing. XS: conceptualization, resources, writing—review and editing. CZ: validation, investigation, methodology, software, data curation, writing—original draft, and funding acquisition. DW: conceptualization and supervising. JM: resources and data curation. All authors contributed to the article and approved the submitted version.
Funding
We acknowledge financial support from the National Natural Science Foundation of China (Grant No. 71902006), the Fundamental Research Funds for the Central Universities, China (Grant No. 2018100123), the Municipal Social Science Fund of Beijing (Grant No. 19GLB015), and the Scientific Research Program of Beijing Municipal Education Commission (Grant No. SM202010011007).
Conflict of Interest
The authors declare that the research was conducted in the absence of any commercial or financial relationships that could be construed as a potential conflict of interest.
Publisher’s Note
All claims expressed in this article are solely those of the authors and do not necessarily represent those of their affiliated organizations, or those of the publisher, the editors and the reviewers. Any product that may be evaluated in this article, or claim that may be made by its manufacturer, is not guaranteed or endorsed by the publisher.
References
Abrell, J., Faye, A. N., and Zachman, G. (2011). “Assessing the impact of the EU ETS using firm level data,” in Working Papers of BETA. https://www.researchgate.net/publication/254454774.
Al-Mulali, U., Weng-Wai, C., Sheau-Ting, L., and Mohammed, A. H. (2015). Investigating the environmental Kuznets curve (EKC) hypothesis by utilizing the ecological footprint as an indicator of environmental degradation. Ecol. Indicators 48, 315–323. doi:10.1016/j.ecolind.2014.08.029
Aller, C., Ductor, L., and Grechyna, D. (2021). Robust Determinants of CO2 Emissions. Energ. Econ. 96, 105154. doi:10.1016/j.eneco.2021.105154
Ashenfelter, O., and Card, D. (1985). Using the longitudinal structure of earnings to estimate the effect of training programs. Rev. Econ. Stat. 67, 648–660. doi:10.2307/1924810
Balado-Naves, R., Baños-Pino, J. F., and Mayor, M. (2018). Do countries influence neighbouring pollution? A spatial analysis of the EKC for CO2 emissions. Energy Policy 123, 266–279. doi:10.1016/j.enpol.2018.08.059
Ben Lahouel, B., Taleb, L., Ben Zaied, Y., and Managi, S. (2021). Does ICT Change the Relationship Between Total Factor Productivity and CO2 Emissions? Evidence Based on a Nonlinear Model. Energ. Econ. 101, 105406. doi:10.1016/j.eneco.2021.105406
Borghesi, S., Cainelli, G., and Mazzanti, M. (2015). Linking emission trading to environmental innovation: Evidence from the Italian manufacturing industry. Res. Pol. 44, 669–683. doi:10.1016/j.respol.2014.10.014
Cao, J., Ho, M. S., Ma, R., and Teng, F. (2021). When carbon emission trading meets a regulated industry: Evidence from the electricity sector of China. J. Public Econ. 200, 104470. doi:10.1016/j.jpubeco.2021.104470
Chen, B., Li, J. S., Zhou, S. L., Yang, Q., and Chen, G. Q. (2018). GHG emissions embodied in Macao's internal energy consumption and external trade: Driving forces via decomposition analysis. Renew. Sust. Energ. Rev. 82, 4100–4106. doi:10.1016/j.rser.2017.10.063
Chen, Z., Zhang, X., and Chen, F. (2021). Do carbon emission trading schemes stimulate green innovation in enterprises? Evidence from China. Technol. Forecast. Soc. Change 168, 120744. doi:10.1016/j.techfore.2021.120744
Cheng, C., Ren, X., and Wang, Z. (2019). The impact of renewable energy and innovation on carbon emission: An empirical analysis for OECD countries. Energ. Proced. 158, 3506–3512. doi:10.1016/j.egypro.2019.01.919
Cheng, X., Pu, Y., and Gu, R. (2019). Effect of Shanxi pilot emission trading scheme on industrial soot and dust emissions: A synthetic control method. Energ. Environ. 31, 461–478. doi:10.1177/0958305X19876682
Coase, R. H. (1960). The problem of social cost. Classic papers in natural resource economics. London: Palgrave Macmillan.
Ding, M.-l., Li, Y.-x., Zhao, R.-q., Zhang, Z.-p., Hou, L.-p., Liu, B.-t., et al. (2019). Carbon emission performance of quota allocation simulation-oriented industry: The case study of Zhengzhou. J. Nat. Resour. 34, 1027–1040. doi:10.31497/zrzyxb.20190510
Dong, F., Dai, Y., Zhang, S., Zhang, X., and Long, R. (2019). Can a carbon emission trading scheme generate the Porter effect? Evidence from pilot areas in China. Sci. Total Environ. 653, 565–577. doi:10.1016/j.scitotenv.2018.10.395
Dong, K., Dong, X., and Ren, X. (2020a). Can Expanding Natural gas Infrastructure Mitigate CO2 Emissions? Analysis of Heterogeneous and Mediation Effects for China. Energ. Econ. 90, 104830. doi:10.1016/j.eneco.2020.104830
Dong, K., Hochman, G., and Timilsina, G. R. (2020b). Do Drivers of CO2 Emission Growth Alter Overtime and by the Stage of Economic Development? Energy Policy 140, 111420. doi:10.1016/j.enpol.2020.111420
Evison, D. (2017). The New Zealand forestry sector's experience in providing carbon sequestration services under the New Zealand Emissions Trading Scheme, 2008 to 2012. For. Pol. Econ. 75, 89–94. doi:10.1016/j.forpol.2016.10.003
Feng, C., Shi, B., and Kang, R. (2017). Does Environmental Policy Reduce Enterprise Innovation?-Evidence from China. Sustainability 9, 872. doi:10.3390/su9060872
Gao, Y., Li, M., Xue, J., and Liu, Y. (2020). Evaluation of effectiveness of China's carbon emissions trading scheme in carbon mitigation. Energ. Econ. 90, 104872. doi:10.1016/j.eneco.2020.104872
General Office of National Development and Reform Commission (2011). Circular of the General Office of National Development and Reform Commission on carrying out the pilot work of carbon emission trading. Available online at: https://www.ndrc.gov.cn/xxgk/zcfb/tz/201201/t20120113_964370.html.
Grossman, G., and Krueger, A. (1991). Environmental Impact of a North American Free Trade Agreement. Massachusetts: NBER. Working Paper. No.3914. doi:10.3386/w3914
Hao, Y., Wu, Y., Wang, L., and Huang, J. (2018). Re-examine environmental Kuznets curve in China: Spatial estimations using environmental quality index. Sust. Cities Soc. 42, 498–511. doi:10.1016/j.scs.2018.08.014
He, J., and Tian, X. (2013). The dark side of analyst coverage: The case of innovation. J. Financial Econ. 109, 856–878. doi:10.1016/j.jfineco.2013.04.001
Heckman, J. J., Ichimura, H., and Todd, P. (1998). Matching as an econometric evaluation estimator. Rev. Econ. Stud. 65, 261–294. doi:10.1111/1467-937X.00044
Hu, J., Pan, X., and Huang, Q. (2020). Quantity or quality? the impacts of environmental regulation on firms' innovation-Quasi-natural experiment based on China's carbon emissions trading pilot. Technol. Forecast. Soc. Change 158, 120122. doi:10.1016/j.techfore.2020.120122
Huang, J., Shen, J., Miao, L., and Zhang, W. (2021). The effects of emission trading scheme on industrial output and air pollution emissions under city heterogeneity in China. J. Clean. Prod. 315, 128260. doi:10.1016/j.jclepro.2021.128260
ICAP (2021). Emissions Trading Worldwide: Status Report 2021. Berlin: International Carbon Action Partnership. https://icapcarbonaction.com/en/?option=com_attach&task=download&id=723.
Jaraite-Kažukauske, J., and Di Maria, C. (2016). Did the EU ETS make a difference? An empirical assessment using Lithuanian firm-level data. Ej, 37. doi:10.5547/01956574.37.2.jjar
Leal, P. H., and Marques, A. C. (2020). Rediscovering the EKC Hypothesis for the 20 Highest CO2 Emitters Among OECD Countries by Level of Globalization. Int. Econ. 164, 36–47. doi:10.1016/j.inteco.2020.07.001
Li, B., Zhou, J., and Tian, Y. (2014). Carbon Emissions and Industrial Structure From a Global Externality Perspective. Resour. Sci. 36, 2483–2490.
Lin, B., and Zhu, J. (2019). The role of renewable energy technological innovation on climate change: Empirical evidence from China. Sci. Total Environ. 659, 1505–1512. doi:10.1016/j.scitotenv.2018.12.449
Liu, Z., Shen, H., Welker, M., Zhang, N., and Zhao, Y. (2021). Gone with the wind: An externality of earnings pressure. J. Account. Econ. 72, 101403. doi:10.1016/j.jacceco.2021.101403
Liu, Z., and Sun, H. (2021). Assessing the impact of emissions trading scheme on low-carbon technological innovation: Evidence from China. Environ. Impact Assess. Rev. 89, 106589. doi:10.1016/j.eiar.2021.106589
Lv, M., and Bai, M. (2021). Evaluation of China's carbon emission trading policy from corporate innovation. Finance Res. Lett. 39, 101565. doi:10.1016/j.frl.2020.101565
Munir, Q., Lean, H. H., and Smyth, R. (2020). CO2 Emissions, Energy Consumption and Economic Growth in the ASEAN-5 Countries: A Cross-Sectional Dependence Approach. Energ. Econ. 85, 104571. doi:10.1016/j.eneco.2019.104571
National DevelopmentReform Commission (2010). Circular of the National Development and Reform Commission on carrying out pilot work of low carbon provinces, regions and cities. Available online at: https://www.ndrc.gov.cn/xxgk/zcfb/tz/201008/t20100810_964674.html.
National DevelopmentReform Commission (2012). Circular of the National Development and Reform Commission on carrying out pilot work of the second batch of national low carbon provinces, regions and cities. Available online at: https://www.ndrc.gov.cn/xxgk/jianyitianfuwen/qgrddbjyfwgk/202107/t20210708_1287984.html?code=&state=123.
National DevelopmentReform Commission (2017). Circular of the National Development and Reform Commission on carrying out the third batch of national low carbon cities pilot work. Available online at: https://www.ndrc.gov.cn/xxgk/zcfb/tz/201701/t20170124_962888.html.
Petrick, S., and Wagner, U. J. (2014). The impact of carbon trading on industry: Evidence from German manufacturing firms. Kiel Working Pap.. http://citeseerx.ist.psu.edu/viewdoc/download?doi=10.1.1.641.8120&rep=rep1&type=pdf.
Porter, M. E. (1991). America’s Green Strategy. Sci. Am. 264, 193–246. doi:10.1038/scientificamerican0491-168
Smith, A. (1976). An Inquiry into the Nature and Causes of the Wealth of Nations. Oxford: Clarendon Press.
Streimikiene, D., and Roos, I. (2009). GHG emission trading implications on energy sector in Baltic States. Renew. Sust. Energ. Rev. 13, 854–862. doi:10.1016/j.rser.2008.02.005
The State Council (2021). The Government Work Report. Available online at: http://www.gov.cn/guowuyuan/zfgzbg.htm.
Ting, H.-I., Wang, M.-C., Yang, J. J., and Tuan, K.-W. (2021). Technical Expert CEOs and Corporate Innovation. Pacific-Basin Finance J. 68, 101603. doi:10.1016/j.pacfin.2021.101603
United Nations (1992). United Nations Framework Convention on Climate Change. Available online at: https://www.un.org/zh/documents/treaty/files/A-AC.237-18(PARTII)-ADD.1.shtml.
Wang, L., Cui, L., Weng, S., and Liu, C. (2021). Promoting Industrial Structure Advancement Through an Emission Trading Scheme: Lessons From China's Pilot Practice. Comput. Ind. Eng. 157, 107339. doi:10.1016/j.cie.2021.107339
Wang, Q., and Wang, S. (2020). Preventing carbon emission retaliatory rebound post-COVID-19 requires expanding free trade and improving energy efficiency. Sci. Total Environ. 746, 141158. doi:10.1016/j.scitotenv.2020.141158
Wang, W.-Z., Liu, L.-C., Liao, H., and Wei, Y.-M. (2021). Impacts of urbanization on carbon emissions: An empirical analysis from OECD countries. Energy Policy 151, 112171. doi:10.1016/j.enpol.2021.112171
Wen, Y., Hu, P., Li, J., Liu, Q., Shi, L., Ewing, J., et al. (2020). Does China's carbon emissions trading scheme really work? A case study of the hubei pilot. J. Clean. Prod. 277, 124151. doi:10.1016/j.jclepro.2020.124151
Xuan, D., Ma, X., and Shang, Y. (2020). Can China's policy of carbon emission trading promote carbon emission reduction? J. Clean. Prod. 270, 122383. doi:10.1016/j.jclepro.2020.122383
Zaman, K., Shamsuddin, S., and Ahmad, M. (2017). Energy-water-food nexus under financial constraint environment: good, the bad, and the ugly sustainability reforms in sub-saharan African countries. Environ. Sci. Pollut. Res. 24, 13358–13372. doi:10.1007/s11356-017-8961-1
Zhang, H., Duan, M., and Deng, Z. (2019). Have China's pilot emissions trading schemes promoted carbon emission reductions?- the evidence from industrial sub-sectors at the provincial level. J. Clean. Prod. 234, 912–924. doi:10.1016/j.jclepro.2019.06.247
Zhang, N., Wang, B., and Liu, Z. (2016). Carbon emissions dynamics, efficiency gains, and technological innovation in China's industrial sectors. Energy 99, 10–19. doi:10.1016/j.energy.2016.01.012
Zhang, S., Wang, Y., Hao, Y., and Liu, Z. (2021). Shooting two hawks with one arrow: Could China's emission trading scheme promote green development efficiency and regional carbon equality? Energ. Econ. 101, 105412. doi:10.1016/j.eneco.2021.105412
Zhang, X., Li, Z., and Wang, J. (2021). Impact of COVID-19 pandemic on energy consumption and carbon dioxide emissions in China's transportation sector. Case Stud. Therm. Eng. 26, 101091. doi:10.1016/j.csite.202110.1016/j.csite.2021.101091
Zhang, Y.-J., Liu, Z., Zhang, H., and Tan, T.-D. (2014). The impact of economic growth, industrial structure and urbanization on carbon emission intensity in China. Nat. Hazards 73, 579–595. doi:10.1007/s11069-014-1091-x
Zhang, Y., Li, S., Luo, T., and Gao, J. (2020). The effect of emission trading policy on carbon emission reduction: Evidence from an integrated study of pilot regions in China. J. Clean. Prod. 265, 121843. doi:10.1016/j.jclepro.2020.121843
Zhou, B., Zhang, C., Song, H., and Wang, Q. (2019). How does emission trading reduce China's carbon intensity? An exploration using a decomposition and difference-in-differences approach. Sci. Total Environ. 676, 514–523. doi:10.1016/j.scitotenv.2019.04.303
Zhou, D., and Liu, Y. (2020). Impact of China’s carbon emission trading policy on the performance of urban carbon emission and its mechanism. China Environ. Sci. 40, 453–464. doi:10.19674/j.cnki.issn1000-6923.2020.0050
Zhou, D., Zhou, F., and Wang, X. (2019). Impact of low-carbon pilot policy on the performance of urban carbon emissions and its mechanism. Resour. Sci. 41, 546–556. doi:10.18402/resci.2019.03.12
Keywords: emission trading scheme (ETS), carbon emission performance, corporate innovation, difference-in-difference (DID), carbon emission intensity, China
Citation: Zheng Y, Sun X, Zhang C, Wang D and Mao J (2021) Can Emission Trading Scheme Improve Carbon Emission Performance? Evidence From China. Front. Energy Res. 9:759572. doi: 10.3389/fenrg.2021.759572
Received: 16 August 2021; Accepted: 06 September 2021;
Published: 16 September 2021.
Edited by:
Kangyin Dong, University of International Business and Economics, ChinaReviewed by:
Zhaoyang Kong, University of International Business and Economics, ChinaWei Gao, China University of Mining and Technology, China
Dapeng Zhu, Shanghai Lixin University of Accounting and Finance, China
Copyright © 2021 Zheng, Sun, Zhang, Wang and Mao. This is an open-access article distributed under the terms of the Creative Commons Attribution License (CC BY). The use, distribution or reproduction in other forums is permitted, provided the original author(s) and the copyright owner(s) are credited and that the original publication in this journal is cited, in accordance with accepted academic practice. No use, distribution or reproduction is permitted which does not comply with these terms.
*Correspondence: Chenyu Zhang, zhangchenyu77@163.com