Study on Waste Heat-Driven Refrigeration System for Energy Saving and Fast Cooling of Dust Collector in Monocrystalline Silicon Manufacture
 Jiwei Hou1
  Yingjie Xu2*
- 1School of Mechanical and Energy Engineering, Zhejiang University of Science & Technology, Hangzhou, China
- 2College of Mechanical Engineering, Zhejiang University of Technology, Hangzhou, China
Single-crystal silicon is key raw material in photovoltaic industry. In its manufacture, silicon monoxide dust, a byproduct, is collected under vacuum environment. To clean the dust collector, air is recharged into the collector, reacting with the dust and causing very high temperature. Collector components may be damaged. It also takes several hours to cool down. In this paper, a cooling system based on ejection refrigeration cycle is proposed, which collects the reaction heat and simultaneously controls the collector temperature around 100°C. Then, it is driven by stored waste reaction heat and cools down the dust to a lower temperature. The designed cooling system, employing a 9.7972 m2 fin-tube heat exchanger, can simultaneously meet the cooling load of four dust collectors with 330L/S capacity. By a thermodynamic model established in this work, performance analysis is carried out. Generating temperature around 73°C and evaporating temperature around 6°C are recommended for system operation. Results also show the cooling system is able to provide 3270 kJ cooling energy that is needed by the collector, for fast cooling down the dust no longer than 620 s. It is about 92% shorter than the time of current collector, indicating the cooling system is effective and feasible.
Introduction
Today, with growing concerns on energy consumption and greenhouse gas emission in residential activity and industry process, the combustion of fossil fuels is restricted (Xu et al., 2021a). Therefore, several renewable energy alternatives have been under consideration. Among them, solar energy is regarded as one of the most promising candidates (Aligolzadeh and Hakkaki-Fard, 2019), which is mainly utilized with photovoltaic technology. As a result, photovoltaic industry develops very quickly. One of the most important key raw materials in photovoltaic industry is single-crystal silicon (monocrystalline silicon). With the burgeoning photovoltaic industry, there is an increasing demand in high purity single-crystal silicon ingots, to satisfy the need of photovoltaic cell (Kato et al., 2021).
Now, large diameter and high-quality single-crystal silicon ingots are mainly produced from the Czochralski (CZ) process (Qi et al., 2020). Firstly, silicon is melted in the crucible surrounded by annular heaters. Secondly, the seed crystal mounted at the end of pulling rod is pulled upward (Bukhari et al., 2019). Thirdly, a meniscus between the growing crystal and the molten silicon can be formed by the pulling process. Finally, high-quality single-crystal silicon ingots can be processed and exploited in the photovoltaic cell. It should be noted that, over 1400°C operating temperature in the single-crystal furnace exists, leading to the production of many oxides (mainly silicon monoxide dust). Unfortunately, the two-stage screw drought vacuum pump, which is usually employed as the auxiliary component, is very sensitive to the dust particles in the exhaust gas. It can be easily damaged when the diameter of dust is over 1 μm.
For the reliability of the vacuum pump, a dust collector is usually used in the CZ process to filter silicon monoxide. However, silicon monoxide is chemically active, being flammable in air. Therefore, when air is charged into the collector after CZ process is finished, lot of heat is generated and high temperature is created, causing probable damage of the filter bag. In order to cool down the collector, the conventional way is leaving it in a ventilated environment to cool by natural convection. This method is simple but inefficient, which often lasts more than 4 hours, leading to immeasurable potential economic losses to plants. To the best of the author’s knowledge, most manufacturers have no reasonable approaches yet. Hence, it is in urgent need of development of an efficient and energy-saving cooling system that can prevent high temperature and cool down the accumulated silicon monoxide dust to ambient temperature in short time.
The ejector refrigeration cycle (ERC) is a promising technology, as it not only offers a potential for low-temperature waste heat recovery but also produces considerable amount of cooling energy. In an ERC, the ejector is served as compression equipment which increases the pressure of secondary entrained stream and obtains the middle-pressure mixed flow (Wang et al., 2020). ERC has a lot of merits such as simple design, high energy efficiency, reliability, little maintenance, no moving parts, low initial and operating cost, and long lifespan (Vidal and Colle, 2010). Therefore, it has been widely applied in energy engineering and industry process, attracting lot of attention of research studies (Huang et al., 2020). Much investigation had been carried out on the performance of ejector refrigeration systems based on experimental and numerical studies. Ben Mansour et al. (2014) developed the thermodynamic model of hybrid ejector-compression refrigeration cycle and compared it with two different configurations of cascade systems, conventional ejector cycle, and compressor cycle. They confirmed that, with optimized pressure and temperature, the hybrid ejector system will be promising. Chen et al. (2014) analyzed a typical ejector refrigeration system based on a general mathematical model, aiming to investigate the interactions between internal and external parameters and its implication on ejector behavior and system performances. Akbari and Sorin (2020) proposed a systematic optimizing approach on the ERC, by first system-scale optimization and second component-scale optimization. The results of optimal status of a system demonstrated that the investigated ERC system can work very well. Besagni et al. (2015) investigated the influence of working fluids on the performance of heat-driven ejector refrigeration systems based on the lumped parameter model. They claimed that the system performance is enhanced by increasing the generating and evaporating temperature and decreasing the condensing temperature. Yu et al. (2007) modeled a new ERC with mechanical subcooling and compared it with conventional ERC. Theoretical analysis revealed that the new system can efficiently improve the system COP. Mwesigye et al. (2020) presented a novel ERC model which considered ejector loss coefficients. The developed mathematical model showed that the COP increases with higher area ratios, higher generator temperatures, and lower condensing temperatures. Lu et al. (2020) carried out an experiment on a freezer adopted with the ERC under −40°C low freezing temperature. The validated results showed that ERC had considerable advantages with 6.2, 21.7, and 38.9% energy consumption reduction to CRS prototype, respectively.
Besides the operating parameters, the ejector configuration is also decisive on the refrigerant system performance, which has received much attention from many studies. Zhang et al. (2017) investigated the effect of nozzle position on entrainment ratio, pressure lift ratio, and the ejector performance, based on the version of the k–ε RNG turbulence model. They showed that there exists an optimal nozzle position of 6 mm which contributed to the highest entrainment ratio and maximum COP. García del Valle et al. (2014) investigated the performance of ERC operating with refrigerant R134a, aiming at improving its expansion work recovery. They studied the influence of both the nozzle longitudinal position and the vapor superheating of the primary and secondary fluid stagnation states at meantime. Zhang et al. (2020) finished an ejector experiment and contrasted the result with three different numerical models, which includes a modified nucleation model. They also investigated the internal flow structures and ejector performance under different modes using the new nucleation model. Galindo et al. (2021) presented a jet–ejector refrigeration system adopting an adjustable spindle to enlarge its operational range. They also compared its performance with a fixed refrigeration system, finding that the adjustable system showed a significant enhancement than the fixed system during the whole year. Dong et al. (2017) discussed the effect of nozzle exit position as well as the ejector area ratio on the system performance, under a low generating temperature. The results demonstrated that ERC is a very promising technology.
It can be seen that literature studies are rare in the field of cooling system for a single-crystal silicon dust collector. And, a general conclusion can be also drawn from the above literature survey that ERC performs well with low economic cost and simple operation, consuming low-grade waste heat. Since the accumulated oxide in the bottom of the tank reacts chemically and generates excessive heat when contact with air during recharge operation, the heat can be removed and collected to decrease temperature and then the ERC can be driven to produce cooling energy. Therefore, to fill this research gap, an ERC-based cooling system, driven by the waste heat recovered from the dust collector, is proposed in this paper. The ERC is coupled and operates in special working environment for the need of collector cooling, with special driven heat temperature and power, refrigeration temperature, and heat transfer for dust. Under these circumstances, the cycle and main component are designed, and the system is analyzed to the study the performance and verify the feasibility.
Cooling System
Waste Heat-Driven Ejection Cooling Cycle
Figure 1A shows the schematic diagram of the waste heat-driven ejection cooling cycle, which consists of two parts: collector cycle and ejector refrigeration cycle. The collector cycle mainly composes water tank 1 (low temperature), water tank 2 (high temperature), a series (four in the case of this paper) of dust collectors, and two water pumps. For the ERC, it consists of three heat exchangers (a generator, a condenser, and an evaporator), an ejector, a circulation pump, and an expansion valve. Figure 1(b) shows the ejection cycle in p–h chart.
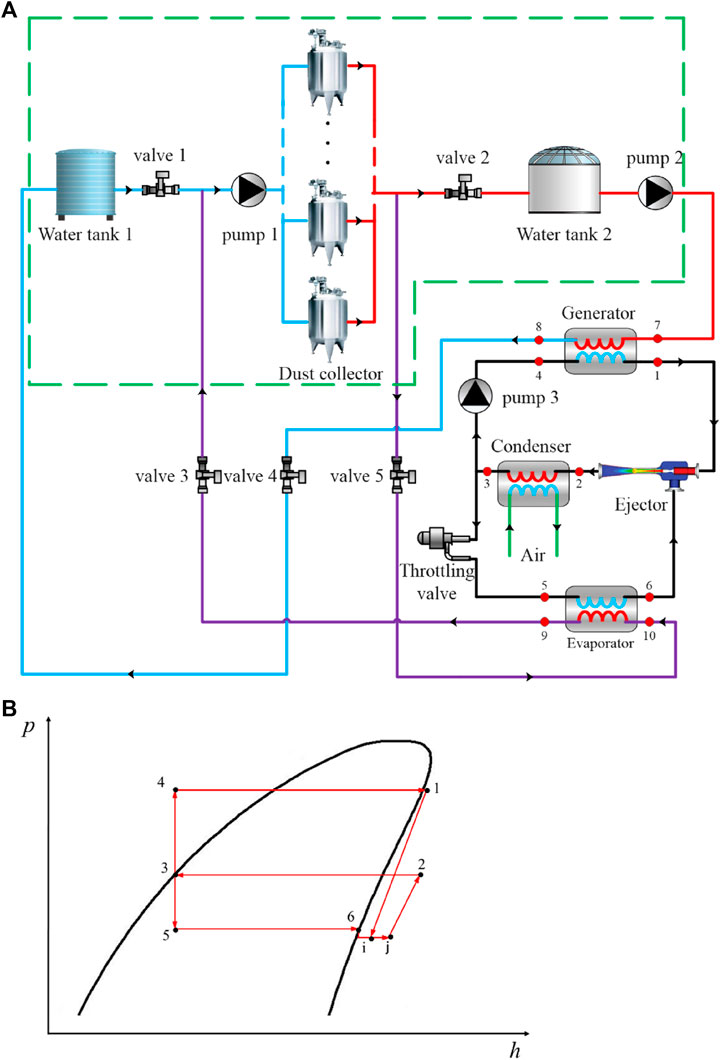
FIGURE 1. Collector cooling system. (A) The schematic diagram; (B)p–h diagram.
In the basis of ERC, the working fluid is compressed to a high-pressure state by the pump and then absorbs heat in the generator. The heat is recovered from the collector and stored in water tank 2. The primary fluid vaporised in the generator enters the ejector nozzle, so as to entrain the low-pressure secondary vapor coming from the evaporator (Akbari and Sorin, 2020). The two flows then undergo mixing and introduce shock trains in the mixing chamber, followed by pressure recovery in the diffuser of the ejector (Chen et al., 2015). The mixed middle-pressure stream enters the condenser, releasing heat into the environment. After then, the stream flows to two parts: one passes through the expansion valve and then enters the evaporator, while the other is compressed by the pump and returns to the generator to complete the cycle.
The collector cycle is boxed by green-dashed line in Figure 1. Water tank 1, where low-temperature water with a temperature of 80°C is stored, is connected to several parallelly arranged dust collectors, passing valve 1 and pump 1. Water tank 2 receives and stores high-temperature water (about 90°C) from collectors. It is connected to pump 2, which is further connected to the generator.
Operating Procedure
The temperature of the collector is controlled by water from water tank 1, and the reaction heat is simultaneously stored in water tank 2. Then, with this heat, the ERC further cools the collectors. Therefore, the cooling process of the collector system consists of two main steps.
In the first step, air is slowly charged into the dust collector, which is vacuum during the production process. It takes no shorter than 2 h to avoid violent chemical reaction (2SiO + O2 = 2SiO2) in the collector that may release a large amount of heat energy and damage collector components. To remove the heat, valve 1 and valve 2 are both open, and the system is directly cooled by water from water tank 1. The cooling water flows through the tube-fin heat exchanger at the bottom of the collector (Figure 2), maintaining the temperature in the collector around 100°C. In other words, the waste reaction heat is delivered and stored into water tank 2, carried by water.
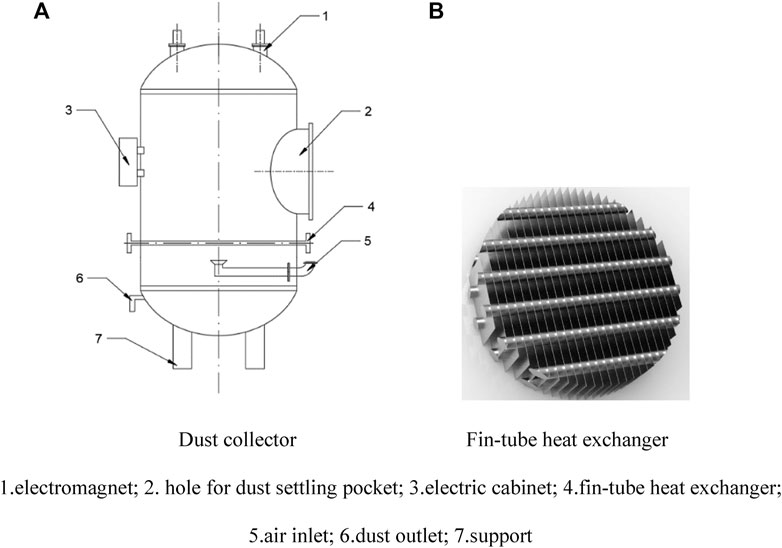
FIGURE 2. Structure of the dust collector and its components.
The second step (step 2) starts when air pressure in the collector reaches one atmospheric pressure after enough air is fed into the collector (the reaction almost ends). In this step, valve 1 and valve 2 are closed, while valve 3, valve 4, and valve 5 are all open. Driven by the low-temperature heat energy source from water tank 2, ERC works with a high efficiency. The collectors are cooled down (expected in 15 min) much faster than conventional ones (3–8 h) by water from the evaporator Figure 3until. When the reaction product temperature is lower than 20°C, step 2 ends, and the collector is ready for cleaning operation.
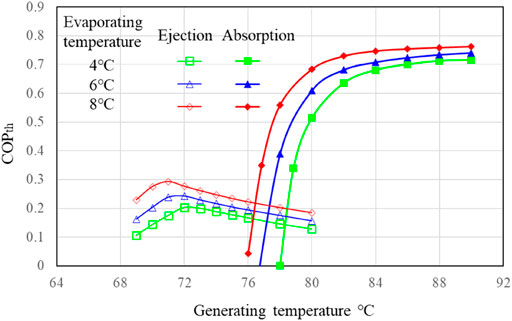
FIGURE 3. Comparison of the performance of ejection and absorption refrigeration cycles.
Design and Models
A dust collector with typical 330L/S processing capacity is chosen for this study, which can reach 99.9% dust collection efficiency. The Q235-made collector body is 1012 mm in diameter and 2323 mm in height. The upper temperature limit is 260°C. With some of the reaction heat leaking from the collector wall, the total heat released in step 1 is tested as 4.3875MJ, which is determined by Eq. 1 as water is used to remove the heat.
where mht is the mass of cooling water, cp is water isobaric specific heat, and ΔTt is temperature change of water. Since step 1 is finished in 2 hours, heat dissipating capacity can be found as 609W. Thus, the fin-tube heat exchanger is designed with tube diameter being 4 mm (0.15 mm wall thickness), tube pitch (ct) being 10mm, aluminum fin thickness (δf) being 0.13mm, and fin space (cf) being 2.2 mm. The total length of heat exchange tube and aluminum fin can be determined by
In Eq. 2, for tube, ct = 10mm, and for fin, cf = 2.6 mm. The total length is obtained as 80 and 309.1 m for tube and fin, respectively. The heat exchange area of fin can be calculated by Eq. 3.
The heat exchanger area of tube is given by
Consequently, heat exchange area AL of one tube layer can be obtained as 4.8986 m2, with 0.68 fin efficiency. Af is calculated as 5.7936 m2, and At is calculated as 0.959 m2, using Eq. 5.
With designed average temperature difference (ΔT) of 15 °C and overall estimated heat transfer coefficient (h) of 5 W/(m2K), the needed heat transfer area An can be obtained as 8.12 m2 from Eq. 6.
Therefore, choosing heat exchanger layers to be 2, the designed area Atot is now 9.7972 m2. It has a 20.7% design margin, showing the design may be suitable.
Based on the above heat exchanger, a mathematical model of the cooling system including the heat exchanger is proposed, aiming at the verification of the feasibility of the cooling system and investigation of system performance. The theoretical model is established with main equations shown in Table 1, based on the following assumptions:
1) The flow inside the ejector is steady and one-dimensional.
2) The wall surface of ejector is regarded as adiabatic.
3) The primary flow and the secondary flow are saturated, and their velocities are negligible before entering the ejector. The velocity of the mixed flow leaving the ejector is also neglected.
4) The refrigerant is assumed saturated at the exits of the condenser and the evaporator.
5) The pressure drop and heat loss in the heat exchangers and connecting pipes are negligible.
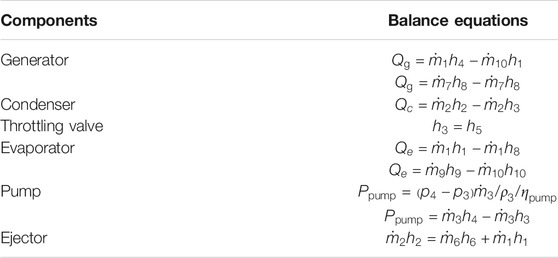
TABLE 1. Energy and mass balance equations for components of the cooling system.
Taking real gas model and constant pressure mixing assumption into account, the ejector model of this work is obtained, which is the same as the study by Xu et al. (2021b). In that work, the ejection model was employed in an ejection–compression cycle and validated by comparing against two experimental datasets. The relative average and minimum deviations with variations in condensing temperature were 13.6 and 3.0%, respectively. And, those with variations in evaporating temperature were 6.8 and 14.9%, respectively, indicating the model performance was acceptable. In step 2, dust temperature decreases as cooling system works. The relation between dust temperature and cooling temperature can be simplified using lumped parameter method, as shown in Eq. 7.
where θ is the temperature difference between dust and coolant, as shown in Eq. 8.
Tcool is simply calculated as the average of temperature of cooling water entering and exiting the heat exchanger, as the temperature increase is not large. In Eq. 7, subscript 0 indicates the parameter gives initial value of the beginning of step 2. cp is the equivalent specific heat of the cooled substance. From the experiment test, about 10% of the reaction occurs in step 2, as well as the cooling process of dust occurs from 100 to 20°C. Based on testing data, it can be calculated using Eq. 1 that total heat of step 2 is 3270.7 kJ. Assuming that the heat is uniformly released with time, equivalent specific heat can be estimated as 20.97 kJ/kg/K. With constant heat transfer coefficient h and designed area Atot, the time (t) needed for step 2 can be calculated. The working condition used in modeling and analysis is listed in Table 2.
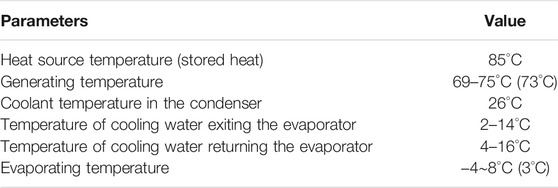
TABLE 2. Baseline working condition for analysis.
Results and Discussion
System performance is simulated and studied with generating temperature ranging from 69 to 75°C, evaporating temperature ranging from −4–8°C, and condenser temperature difference (ΔTcon) ranging from 2 to 8°C.
Before analysis, the comparison of ejection cycle and absorption cycle is shown in Figure 3, to verify the selection of ejection. The calculation of absorption cycle is based on Xu et al.’s (2017) model. In spite of high thermal COP (COPth) in most generating temperature range, the absorption refrigeration cycle almost cannot work when generating temperature is lower than 76°C. In contrast, the ejection cycle can work properly and has better performance at generating temperature around 70°C. For the safety of the collector, the temperature of waste heat is controlled relatively low. Therefore, the ejection cycle is more suitable in this paper.
Effects of Generating Temperature on System Performance
Figure 4 illustrates that the total cooling energy can be provided by the ejection refrigeration cycle, which is driven by the waste heat collected in step 1. Since the temperature of heat source (waste heat in water tank) is constant, superheating degree in generator decreases with increasing generating temperature (Figure 4). With constant ΔTcon of 2°C, as generating temperature (Tg) increases (superheating degree decreases), total cooling energy firstly increases to 3255 kJ at Tg = 73°C and then decreases. This is because when generating temperature is higher than 73°C, the ejector runs under the critical mode, whose entrainment ratio decreases as generating pressure increases. With an increasing condenser temperature difference, the maximum cooling energy reduces, while the corresponding optimization generating temperature raises. For the curve of condenser temperature difference higher than 4°C, its optimization generating temperature is beyond the studied range. Therefore, to meet the requirement of cooling load, a generating temperature not too high combining with a small condenser temperature difference is suitable for system operation.
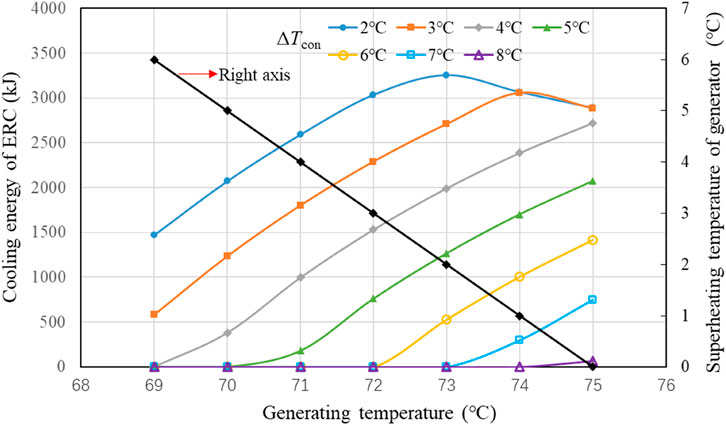
FIGURE 4. Variation in cooling energy of ERC and superheating temperature of the generator with generating temperature.
Since the system is mainly driven by recovered waste heat, which can be considered as totally free, thermal COP is no longer important, and cooling energy provided by ERC is what we focus on. However, in ERC, small quantity of electricity is still consumed by the pump, and the second variable should be carefully investigated is COPe, which is defined as the ratio of cooling energy of ERC to pump electric energy, as shown in Figure 5. The curves of COPe also have a optimizing point with low condenser temperature difference. However, comparing with the curves in Figure 4, the best generating temperature for COPe is smaller than that of cooling energy. For example, at ΔTcon = 2°C, the best generating temperature lies between 72°C and 73°C. The reason is that the pump electricity consumption decreases with decreasing generating temperature, as long as the ejector can still work. Therefore, it is better to choose generating temperature for operation, a little smaller than the best generating temperature for cooling energy.
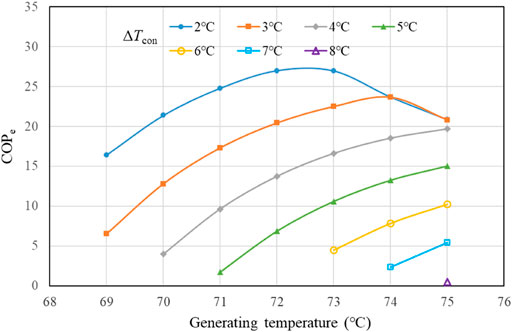
FIGURE 5. Effects of generating temperature on electricity COP (COPe).
It can also be found that the curves in Figure 4 and Figure 5 seem similar, which is again related to pump electricity cost shown in Figure 6. The reason is that the decrease in pump electricity costs with the increasing condenser temperature difference is very light (within 1% per Celsius degree), which will not change the interval between curves too much. To explain the behavior of pump electricity cost, we refer to Figure 7. Firstly, as generating temperature decreases, specific generating heat increases, but specific pump work decreases. Since the collected waste heat remains unchanged, the total refrigerant mass decreases, which leads to decrease in pump electricity consumption with the joint effect of the specific pump work. Secondly, as temperature difference in the condenser increases, total refrigerant mass and specific pump work vary in opposite ways this time. The former increases as the specific generating heat decreases, while the latter decreases, resulting in a negligible light decrease in pump electricity cost.
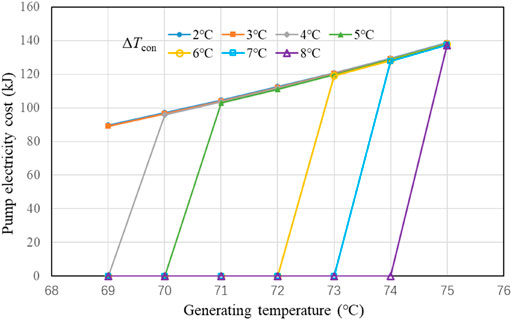
FIGURE 6. Effects of generating temperature on pump electricity consumption.
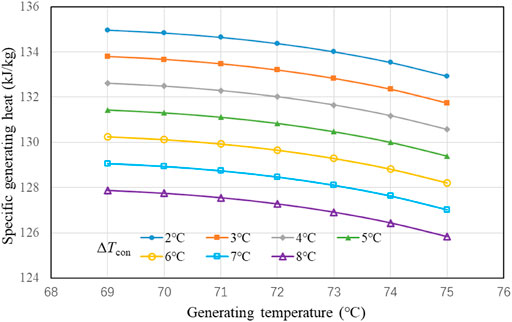
FIGURE 7. Effects of generating temperature on specific generating heat.
Effects of Evaporating Temperature on System Performance
With temperature difference in the evaporator is 7°C, cooling water temperature ranges from 2 to 14°C, and return water temperature ranges from 4 to 16°C, then studied evaporating temperature ranges from −4–8°C. Using the conclusion of the previous subsection, Tg is 73°C. For the same reason as Figure 4, cooling energy is the key parameter, which decreases with a decreased evaporating temperature and increased condenser temperature difference (Figure 8). The tested cooling energy requirement is shown as a horizontal dashed line of 3270kJ, above which the cooling energy is qualified. In the qualified region, the highest condenser temperature difference is 5°C at an evaporating temperature of 8°C and the lowest evaporating temperature is 3°C with a condenser temperature difference of 2°C. During the cooling operation, temperatures need to be controlled in this range. Another important performance parameter is the time taken to cool the dust to the desired temperature. As shown in Figure 9, the lower the evaporating temperature, the faster the cooling speed can be achieved for a larger heat exchange rate. Considering both cooling energy and speed, an evaporating temperature around 6°C may be suitable. Anyway, even with the largest evaporating temperature of 8°C, the longest cooling down time is only 620s, much faster (about 92% faster) than the conventional method (about 2 h). These results indicate the new cooling system can save a lot of time and significantly improve the producing efficiency of single-crystal silicon.
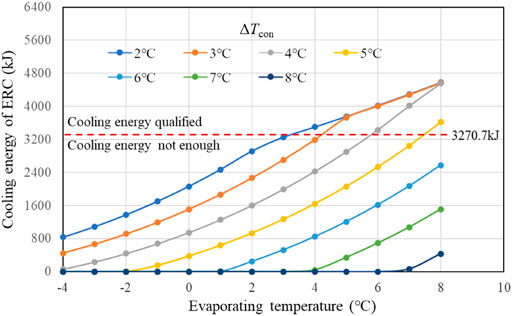
FIGURE 8. Analysis on cooling energy of ERC with variation in evaporating temperature and condenser temperature difference.
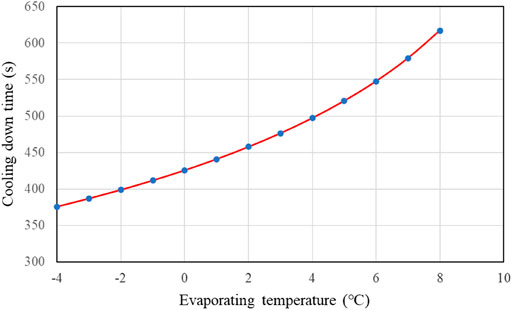
FIGURE 9. Time cost for the cooling process in step 2.
To explain the variation trends in cooling energy, Figure 10 is illustrated. With constant condensing temperature and generating temperature, the ejector entrainment ratio slowly decreases with the decrease in evaporating temperature first. When the evaporating temperature is low enough, the ejector reaches the critical point as shown in Figure 9. From then on, as the evaporating temperature goes on decreasing, the ejector works under the subcritical mode and degradation in the entrainment ratio accelerates. Based on this trend, as total cycled refrigerant mass keeps unchanged (both generating heat and specific generating heat would not change), cooling energy can be decided with specific cooling capacity shown in Figure 11. Because specific cooling capacity presents an almost linear variation with the evaporating temperature, the trends of cooling energy with evaporating temperature are similar to that of the entrainment ratio, showing the same critical point. The decrease in specific cooling capacity with the increasing condenser temperature difference is even smaller (about 1% per Celsius degree), and the trends of cooling energy with condenser temperature difference are very similar to those of the entrainment ratio.
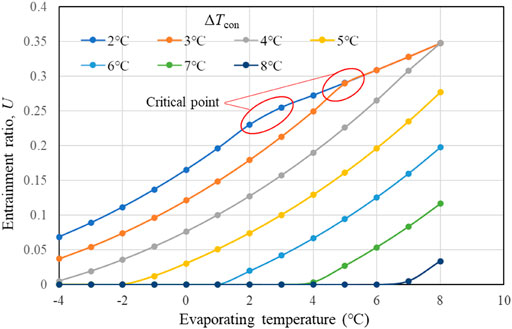
FIGURE 10. Effects of evaporating temperature on the entrainment ratio.
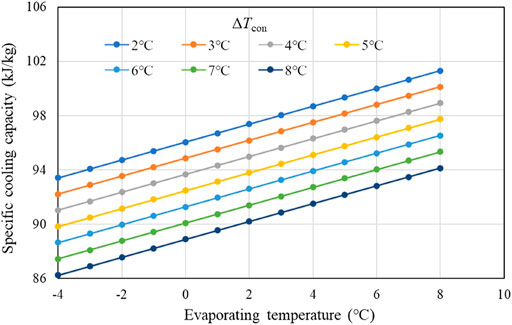
FIGURE 11. Effects of evaporating temperature on specific cooling capacity.
Figure 12 shows the total heat rejected from the condenser. The difference in total condensing heat is relatively small compared to their absolute value. At the critical point, the total condensing heat is 17231kJ, which is just 12.9% smaller than the largest total condensing heat of 19778 kJ at the largest cooling energy point. The result indicates that the size of the condenser does not need to change too much for different designs, neither does its cost. In other words, not much attention needs to be paid on the condenser.
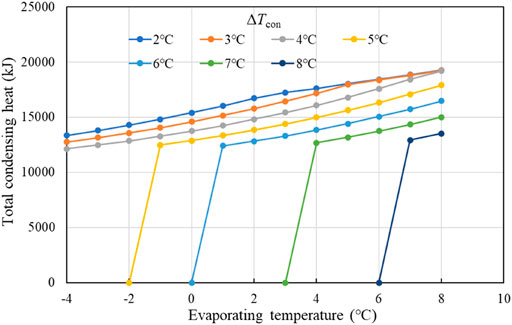
FIGURE 12. Effects of evaporating temperature on total condensing heat.
Conclusion
To recover the waste heat from collected dust and speed up the producing process for single-crystal silicon, a cooling system based on heat-driven ERC is designed and analyzed. Some important conclusions are drawn as follows:
1) Parallelly connecting with 4 330L/S dust collectors, a cooling system based on ERC is proposed, in which a two-layer fin-tube heat exchanger with 9.7972 m2 area is designed.
2) Two steps make up the whole cooling process. Reaction occurs mainly in step 1, and its heat is stored. In step 2, ERC is driven by stored heat providing cooling energy to offset heat of residual reaction and cooling the dust down to safe temperature.
3) Optimizing generating temperature with different condenser temperature difference is observed for both cooling energy and COPe. Considering their effects together, the best generating temperature is recommended around 73°C.
4) According to the amount of cooling energy, qualified region with the largest/smallest condenser temperature difference of 5/2°C and highest/lowest evaporating temperature of 8/3°C is obtained.
5) It is found that, in the studied range, cooling down time is within 620s, which is significantly shorter than currently used dust collector, indicating the proposed cooling system can improve the producing efficiency.
Data Availability Statement
The raw data supporting the conclusions of this article will be made available by the authors, without undue reservation.
Author Contributions
JH contributed to conception, testing, and proof reading; YX contributed to analysis and first draft of the manuscript.
Conflict of Interest
The authors declare that the research was conducted in the absence of any commercial or financial relationships that could be construed as a potential conflict of interest.
The reviewer (BY) declared a shared affiliation with the authors to the handling editor at the time of review.
Publisher’s Note
All claims expressed in this article are solely those of the authors and do not necessarily represent those of their affiliated organizations, or those of the publisher, the editors, and the reviewers. Any product that may be evaluated in this article, or claim that may be made by its manufacturer, is not guaranteed or endorsed by the publisher.
Acknowledgments
The authors would like to acknowledge the support from program “Development of External Online Feeding Technology for Czochralski Crystal Furnace” (No. 20180064)
References
Akbari, H., and Sorin, M. (2020). Optimal Component-Scale Design of Ejector Refrigeration Systems Based on Equivalent Temperature. Energ. Convers. Manag. 209, 112627. doi:10.1016/j.enconman.2020.112627
Aligolzadeh, F., and Hakkaki-Fard, A. (2019). A Novel Methodology for Designing a Multi-Ejector Refrigeration System. Appl. Therm. Eng. 151, 26–37. doi:10.1016/j.applthermaleng.2019.01.112
Ben Mansour, R., Ouzzane, M., and Aidoun, Z. (2014). Numerical Evaluation of Ejector-Assisted Mechanical Compression Systems for Refrigeration Applications. Int. J. Refrigeration. 43, 36–49. doi:10.1016/j.ijrefrig.2014.04.010
Besagni, G., Mereu, R., Di Leo, G., and Inzoli, F. (2015). A Study of Working Fluids for Heat Driven Ejector Refrigeration Using Lumped Parameter Models. Int. J. Refrigeration. 58, 154–171. doi:10.1016/j.ijrefrig.2015.06.015
Bukhari, H., Hovd, M., and Winkler, J. (2019). Limitations on Control Performance in the Czochralski Crystal Growth Process Using Bright Ring Measurement as a Controlled Variable. IFAC-Papers OnLine 52 (14), 129–134. doi:10.1016/j.ifacol.2019.09.176
Chen, J., Havtun, H., and Palm, B. (2015). Conventional and Advanced Exergy Analysis of an Ejector Refrigeration System. Appl. Energ. 144, 139–151. doi:10.1016/j.apenergy.2015.01.139
Chen, J., Havtun, H., and Palm, B. (2014). Parametric Analysis of Ejector Working Characteristics in the Refrigeration System. Appl. Therm. Eng. 69 (1-2), 130–142. doi:10.1016/j.applthermaleng.2014.04.047
Dong, J., Yu, M., Wang, W., Song, H., Li, C., and Pan, X. (2017). Experimental Investigation on Low-Temperature thermal Energy Driven Steam Ejector Refrigeration System for Cooling Application. Appl. Therm. Eng. 123, 167–176. doi:10.1016/j.applthermaleng.2017.05.061
Galindo, J., Dolz, V., Tiseira, A., and Ponce-Mora, A. (2021). Numerical Assessment of the Dynamic Behavior of a Solar-Driven Jet-Ejector Refrigeration System Equipped with an Adjustable Jet-Ejector. Int. J. Refrigeration. 121, 168–182. doi:10.1016/j.ijrefrig.2020.10.019
García del Valle, J., Saíz Jabardo, J. M., Castro Ruiz, F., and San José Alonso, J. F. (2014). An Experimental Investigation of a R-134a Ejector Refrigeration System. Int. J. Refrigeration. 46, 105–113. doi:10.1016/j.ijrefrig.2014.05.028
Huang, Y., Jiang, P., and Zhu, Y. (2020). Experimental and Modeling Studies of Thermally-Driven Subcritical and Transcritical Ejector Refrigeration Systems. Energ. Convers. Manag. 224, 113361. doi:10.1016/j.enconman.2020.113361
Kato, S., Kim, S., Kano, M., Fujiwara, T., and Mizuta, M. (2021). Gray-box Modeling of 300 Mm Diameter Czochralski Single-crystal Si Production Process. J. Cryst. Growth. 553, 125929. doi:10.1016/j.jcrysgro.2020.125929
Lu, Y., Bai, T., and Yu, J. (2020). Experimental Investigation on a -40 °C Low-Temperature Freezer Using Ejector-Expansion Refrigeration System. Int. J. Refrigeration. 118, 230–237. doi:10.1016/j.ijrefrig.2020.06.010
Mwesigye, A., Kiamari, A., and Dworkin, S. B. (2020). Energetic Optimization and Exergetic Performance Investigation of an Ejector Refrigeration System Using HCFO-1233Zd(E) as a Refrigerant. Int. J. Refrigeration. 112, 155–171. doi:10.1016/j.ijrefrig.2019.12.013
Qi, X., Ma, W., Dang, Y., Su, W., and Liu, L. (2020). Optimization of the Melt/crystal Interface Shape and Oxygen Concentration during the Czochralski Silicon crystal Growth Process Using an Artificial Neural Network and a Genetic Algorithm. J. Cryst. Growth. 548, 125828. doi:10.1016/j.jcrysgro.2020.125828
Vidal, H., and Colle, S. (2010). Simulation and Economic Optimization of a Solar Assisted Combined Ejector-Vapor Compression Cycle for Cooling Applications. Appl. Therm. Eng. 30 (5), 478–486. doi:10.1016/j.applthermaleng.2009.10.008
Wang, X., Yan, Y., Li, B., Hao, X., Gao, N., and Chen, G. (2020). Prospect of Solar-Driven Ejector-Compression Hybrid Refrigeration System with Low GWP Refrigerants in Summer of Guangzhou and Beijing. Int. J. Refrigeration. 117, 230–236. doi:10.1016/j.ijrefrig.2020.04.035
Xu, Y., Jiang, N., Pan, F., Wang, Q., Gao, Z., and Chen, G. (2017). Comparative Study on Two Low-Grade Heat Driven Absorption-Compression Refrigeration Cycles Based on Energy, Exergy, Economic and Environmental (4E) Analyses. Energ. Convers. Manag. 133, 535–547. doi:10.1016/j.enconman.2016.10.073
Xu, Y., Mao, C., Huang, Y., Shen, X., Xu, X., and Chen, G. (2021). Performance Evaluation and Multi-Objective Optimization of a Low-Temperature CO2 Heat Pump Water Heater Based on Artificial Neural Network and New Economic Analysis. Energy 216, 119232. doi:10.1016/j.energy.2020.119232
Xu, Y., Shi, Q., Chen, N., Shen, X., Wang, C., and Han, X. (2021). Seasonal Energy Performance Evaluation with New Perspective on Partial-Coupling Ejection-Compression Solar Cooling System for Modern City Buildings. Energ. Convers. Manag. 233, 113875. doi:10.1016/j.enconman.2021.113875
Yu, J., Ren, Y., Chen, H., and Li, Y. (2007). Applying Mechanical Subcooling to Ejector Refrigeration Cycle for Improving the Coefficient of Performance. Energ. Convers. Manag. 48 (4), 1193–1199. doi:10.1016/j.enconman.2006.10.009
Zhang, G., Dykas, S., Li, P., Li, H., and Wang, J. (2020). Accurate Condensing Steam Flow Modeling in the Ejector of the Solar-Driven Refrigeration System. Energy 212, 118690. doi:10.1016/j.energy.2020.118690
Zhang, K., Zhu, X., Ren, X., Qiu, Q., and Shen, S. (2017). Numerical Investigation on the Effect of Nozzle Position for Design of High Performance Ejector. Appl. Therm. Eng. 126, 594–601. doi:10.1016/j.applthermaleng.2017.07.085
Glossary
Nomenclature
A Heat transfer area (m2)
Atot Designed heat transfer area (m2)
Aneed Needed heat transfer area (m2)
COP Coefficient of performance
Cp Specific heat capacity (kJ/kg·K)
ct Tube pitch (mm)
cf Fin space (mm)
h Heat transfer coefficient (W/(m2K))
L Total length of the heat exchange tube
m Mass flow rate(kg/s)
n Number
P Power (W)
r Radius (mm)
T Temperature (°C)
△T Temperature difference (°C)
ΔTt Temperature change of water (°C)
U Entrainment ratio
v Specific volume (m3/kg)
Subscript
cool Coolant
con Condenser
dust Dust collector
e Evaporator
f Fin
g Generator
L Layer
pump Pump
t Tube
Greek letter
ρ Density(kg/m3)
θ Temperature difference between dust and coolant
η Efficiency
δ Fin thickness (mm)
Keywords: ejector, cooling, single-crystal silicon, waste heat, heat driven
Citation: Hou J and Xu Y (2021) Study on Waste Heat-Driven Refrigeration System for Energy Saving and Fast Cooling of Dust Collector in Monocrystalline Silicon Manufacture. Front. Energy Res. 9:735474. doi: 10.3389/fenrg.2021.735474
Received: 02 July 2021; Accepted: 19 August 2021;
Published: 16 September 2021.
Edited by:
Ning Mao, The University of Tokyo, JapanReviewed by:
Yudong Xia, Hangzhou Dianzi University, ChinaBicui Ye, Zhejiang Sci-Tech University, China
Copyright © 2021 Hou and Xu. This is an open-access article distributed under the terms of the Creative Commons Attribution License (CC BY). The use, distribution or reproduction in other forums is permitted, provided the original author(s) and the copyright owner(s) are credited and that the original publication in this journal is cited, in accordance with accepted academic practice. No use, distribution or reproduction is permitted which does not comply with these terms.
*Correspondence: Yingjie Xu, xuyingjie@zjut.edu.cn