Article

Morphometric Maps of Bilateral Asymmetry in the Human Humerus: An Implementation in the R Package Morphomap

1
PalaeoHub, Department of Archaeology, University of York, York YO10 5DD, UK
2
Department of Environmental Biology, Sapienza Università di Roma, 00185 Rome, Italy
3
Dipartimento di Scienze della Terra, Università degli Studi di Firenze, 50121 Florence, Italy
4
Dipartimento di Scienze della Terra, dell’Ambiente e delle Risorse, Università di Napoli Federico II, 80138 Naples, Italy
5
Department of Biology, University of Pisa, via Luca Ghini, 56126 Pisa, Italy
6
Centre for the Exploration of the Deep Human Journey, University of the Witwatersrand, Private Bag 3, Wits, Johannesburg 2050, South Africa
7
Hull York Medical School, University of York, York YO10 5DD, UK
*
Authors to whom correspondence should be addressed.
Co-first authorship.
Symmetry 2021, 13(9), 1711; https://doi.org/10.3390/sym13091711
Submission received: 19 August 2021 / Revised: 10 September 2021 / Accepted: 10 September 2021 / Published: 16 September 2021
(This article belongs to the Special Issue Symmetry in Human Evolution, from Biology to Behaviours)

Abstract

:
In biological anthropology, parameters relating to cross-sectional geometry are calculated in paired long bones to evaluate the degree of lateralization of anatomy and, by inference, function. Here, we describe a novel approach, newly added to the morphomap R package, to assess the lateralization of the distribution of cortical bone along the entire diaphysis. The sample comprises paired long bones belonging to 51 individuals (10 females and 41 males) from The New Mexico Decedent Image Database with known biological profile, occupational and loading histories. Both males and females show a pattern of right lateralization. In addition, males are more lateralized than females, whereas there is not a significant association between lateralization with occupation and loading history. Body weight, height and long-bone length are the major factors driving the emergence of asymmetry in the humerus, while interestingly, the degree of lateralization decreases in the oldest individuals.

1. Introduction

In bioarchaeology and anthropology, it is of interest to infer the physical activities, occupations and behaviours of past populations from skeletal material [1,2]. During life, the distribution of cortical bone is influenced by loading history [3,4,5], and bone remodelling seems to be significantly associated with high-frequency daily action [6]. Asymmetry of loading, as is common in many physical activities, occupations and behaviours, can be expected to lead to asymmetry of bone form. Thus, to fulfil the goal of inferring past lifestyles often requires the assessment of differences in bone shape and cortical thickness distributions among antimeres [5,7].
Different models have been proposed to explain how bone is remodelled in relation to loading [8,9,10,11], although bone adaptation and remodelling has a sizeable physiological and environmental (i.e., nutritional) component. The comparison of antimeric bones from the same individual offers the opportunity to identify asymmetry of loading history [12] while ignoring the confounding, presumed bilaterally equal effects of genetics and nutrition. Yet, even the comparison of paired bone elements is not entirely without issues, since inflammatory processes [13] may trigger osteogenesis in distant regions [14,15], and differences in patterns of asymmetry in the upper limb have been found with ageing [16] and long-term disuse [17], in addition to loading history per se. Despite these caveats, traditional methods that rely on calculations of the percentage change of cross-sectional geometric parameters (total area, cortical area, area moments of inertia) on the humerus have provided useful insights into activity patterns in modern [12] and archaeological populations [18,19,20,21,22,23,24], as well as in paleontological samples [25,26,27,28,29,30]. Studies of professional athletes who play unimanual or bimanual sports, such as tennis [5,31,32,33,34], throwing and swimming [34,35,36], provide an interesting natural experiment. Studies of their long bones allow assessment of the extent to which asymmetry of cortical thickness and whole-bone morphology exists between the dominant (e.g., the racket arm) and non-dominant arm. Younger starters show a higher index of “strength” than older, suggesting that intense activities during adolescence lead to greater subperiosteal expansion [37].
Current methods to evaluate asymmetry in long bones often involve comparison of shape and biomechanical parameters (cross sectional geometry) between antimeres based on a limited number of sections along the diaphysis [19,38,39]. More recently, Wei et al. [40] have extended such analyses to multiple closely placed sections along the entire diaphysis, calculating asymmetry of cortical thicknesses and polar moments of area (J) using the R software tool, morphomap [41].
Here, we assess how asymmetry in the distribution of cortical thickness in the human humerus is related to physical activity level, sex, body mass and weight based on data from recently deceased individuals, with known occupational, lifestyle and medical history curated in the New Mexico Decedent Image Database (NMDID) [42].
We tested the hypotheses that: (a) the degree of asymmetry does not differ among sexes or among three different occupation groups; (b) the difference in distribution of cortical bone and degree of asymmetry are not influenced by age, weight, height, humerus length and occupation. The hypotheses we tested have significant implications for the evaluation of asymmetry in archaeological populations and in extinct human species.

2. Materials and Methods

2.1. Data Preparation and Processing

From the New Mexico Decedent Image Database [42], we selected 51 individuals (41 males, 10 females) with known occupation, ranging in age at death from 21 to 54 years. We selected individuals who had been in the armed forces or worked in building/mining or at a desk job to test the methodology using groups with distinctly different occupational histories (likely high vs. low loading).
We extracted from NMDID metadata associated with occupational history for each individual. Then, we computed occupation scores relating activity to energy cost (see Appendix 4.1 from [43]) and duration in years for each occupation. Missing data for duration in years are estimated by calculating the expected working based on the formula, (age at death –18 years)/ the number of recorded occupations.
A total body CT scan is available for each individual at a slice resolution of 0.5 mm with 16 × 0.75 mm collimation, 120 KVp and 300 mAs. From these scans, we cropped the left and right humerus. In order to create 3D models defined by only bony material, the image stacks were automatically segmented using the Otsu algorithm available in the morphomap R package. The 102 resulting 3D models (51 left humeri and 51 right humeri) were aligned following the protocols proposed by Ruff [44].
From each 3D model, we extracted 61 cross sections from 20% to 80% of the biomechanical length along the bone shaft. At each cross section, we defined 24 paired equiangular semilandmarks on the external and internal outlines centred at the barycentre of the cross section. The production of the cross sections is automatically executed in morphomap by using the functions morphomapCore and morphomapShape (Figure 1).

2.2. Asymmetry and Cross-Sectional Geometry

On each individual, we calculated the polar moment of inertia (J mm4) at 40% of the biomechanical length on both sides using the function morphomapCSG. We avoided standardization of J (on body mass and bone length), because we analyzed the percentage of lateralization (JLAT%) using the following equation: JLAT% = (|(JR − JL)|/JM) × 100, where JM = (JR + JL)/2.

2.3. Description of the Function MorphomapAsymmetry

The new function, morphomapAsymmetry, embedded in morphomap facilitates the mapping and analysis of bilateral asymmetry in long bones (Table 1). We provide three strategies to map differences in the distribution of cortical thickness between the two sides: (i) the difference between sides (type = “diff”); (ii) the difference from the mean (type = “onMean”); (iii) the relative change in thickness (type = “relChange”) of one side with respect to the other.
The workflow implemented in morphomap is as follows:
  • Load the output of the first long bone processed with morphomapShape.
  • Load the output of the second long bone processed with morphomapShape (Figure 1).
  • Specify if one of the two input objects needs to be mirrored (Figure 2A).
  • Calculate the cortical thickness map of the entire diaphysis in both long bones (Figure 2B).
  • Standardize the cortical thicknesses by dividing the matrices of cortical thickness by the biomechanical length (optional).
  • Choose the method of visualization by setting the argument type to:
    • type = “diff”
      Calculate the differences between the cortical thickness maps of the two long bones (Figure 2C).
    • type = “onMean”
      Calculate the differences between the two cortical maps and their mean (Figure 2E).
    • type = “relChange”
      Compute a cortical map as the percentage change of one side (target) with respect to the other one (reference) (Figure 2D).
  • 2D Plot the map of differences in cortical thickness between the selected specimens. The difference map is displayed after “unrolling” the long-bone shaft to produce a 2D plot, starting and ending at the anterior (A) border passing through the lateral (L), posterior (P), and medial (M) borders (Figure 2C).

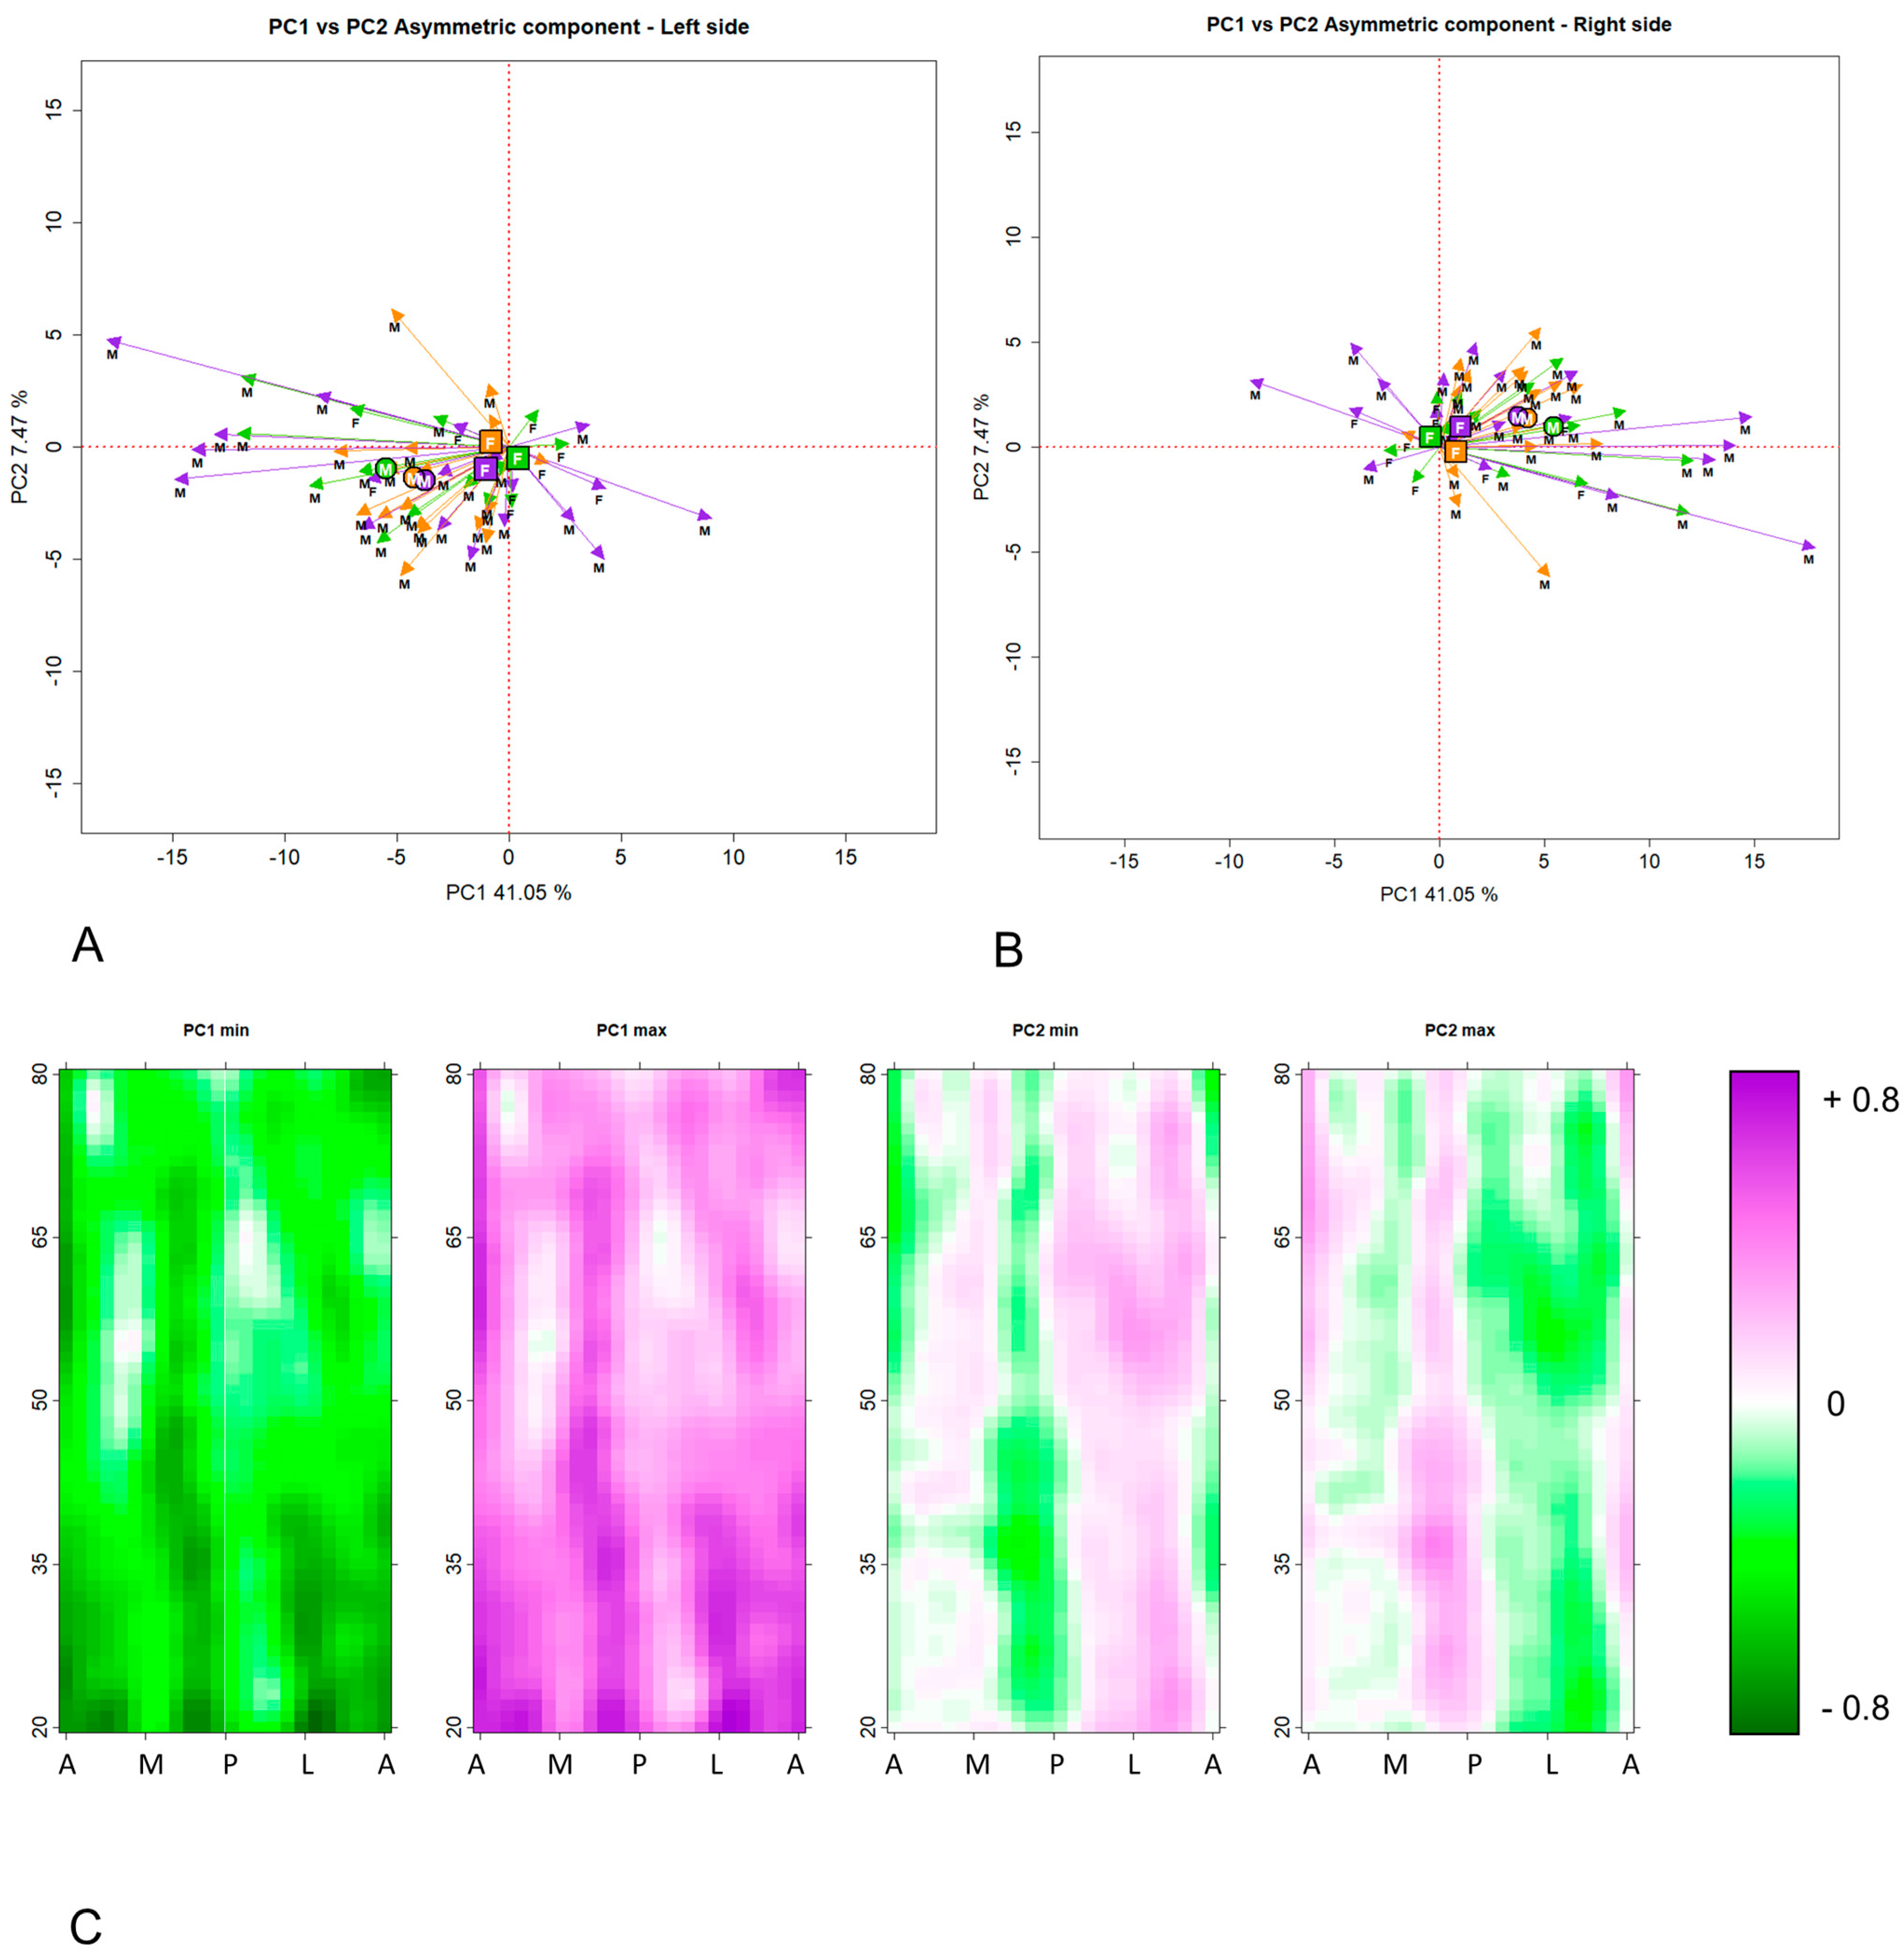
2.4. Description of the Function MorphomapMapPCA

We processed the right and left humerus in 51 individuals selected from the NMDID using the R package morphomap (Profico et al. 2021). The individuals belong to three different categories for occupation: “building-mining” (called “building” from now on), “army” and “desk”. We extracted 61 cross sections from the humeri and built a multivariate dataset of cortical thicknesses along the entire diaphysis on both sides.
To decompose the total variance of the sample into symmetric and asymmetric components, we performed two different Principal Component Analyses (PCA) on each dataset:
  • PCA of the mean morphometric maps calculated by averaging left and mirrored right side (symmetric component).
  • PCA of the matrices obtained by in each individual subtracting the mean matrix of cortical thicknesses from the matrices of cortical thicknesses of the left and mirrored right sides (asymmetric component).
The function morphomapPCA requires two inputs, the left and right sets of long-bone semilandmarks, obtained from morphomapShape. The user can select if the calculation of the symmetric and asymmetric component is performed on semilandmark coordinates or on the values of cortical thickness computed from these along the diaphysis.

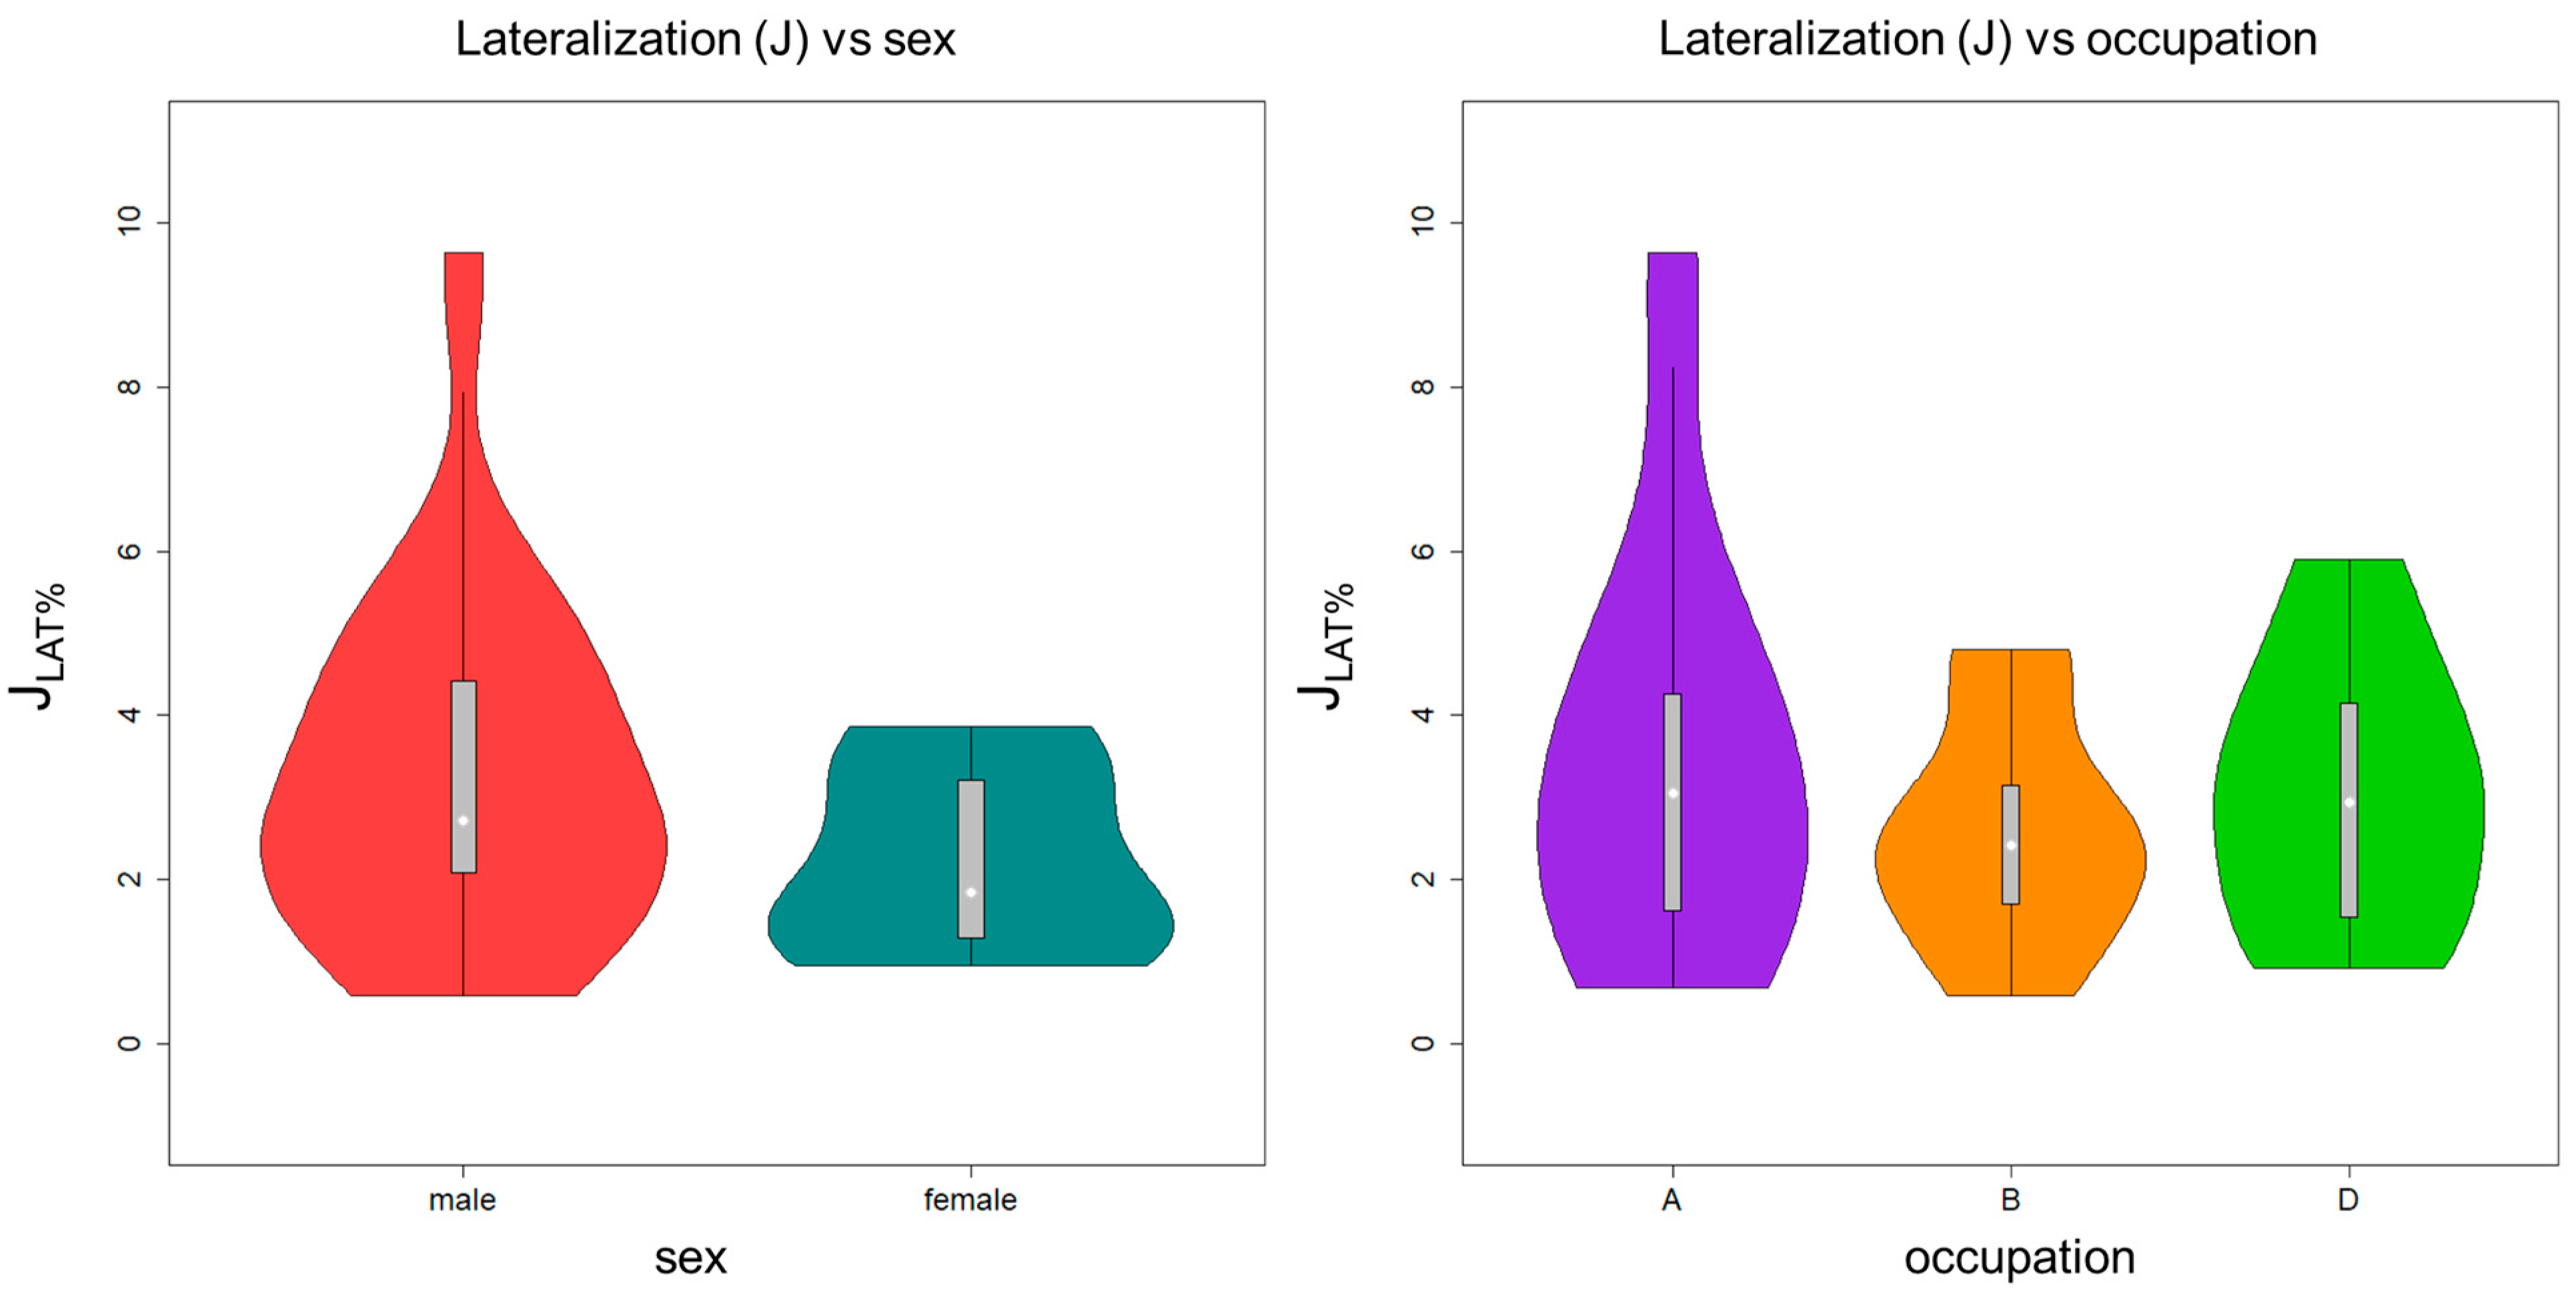
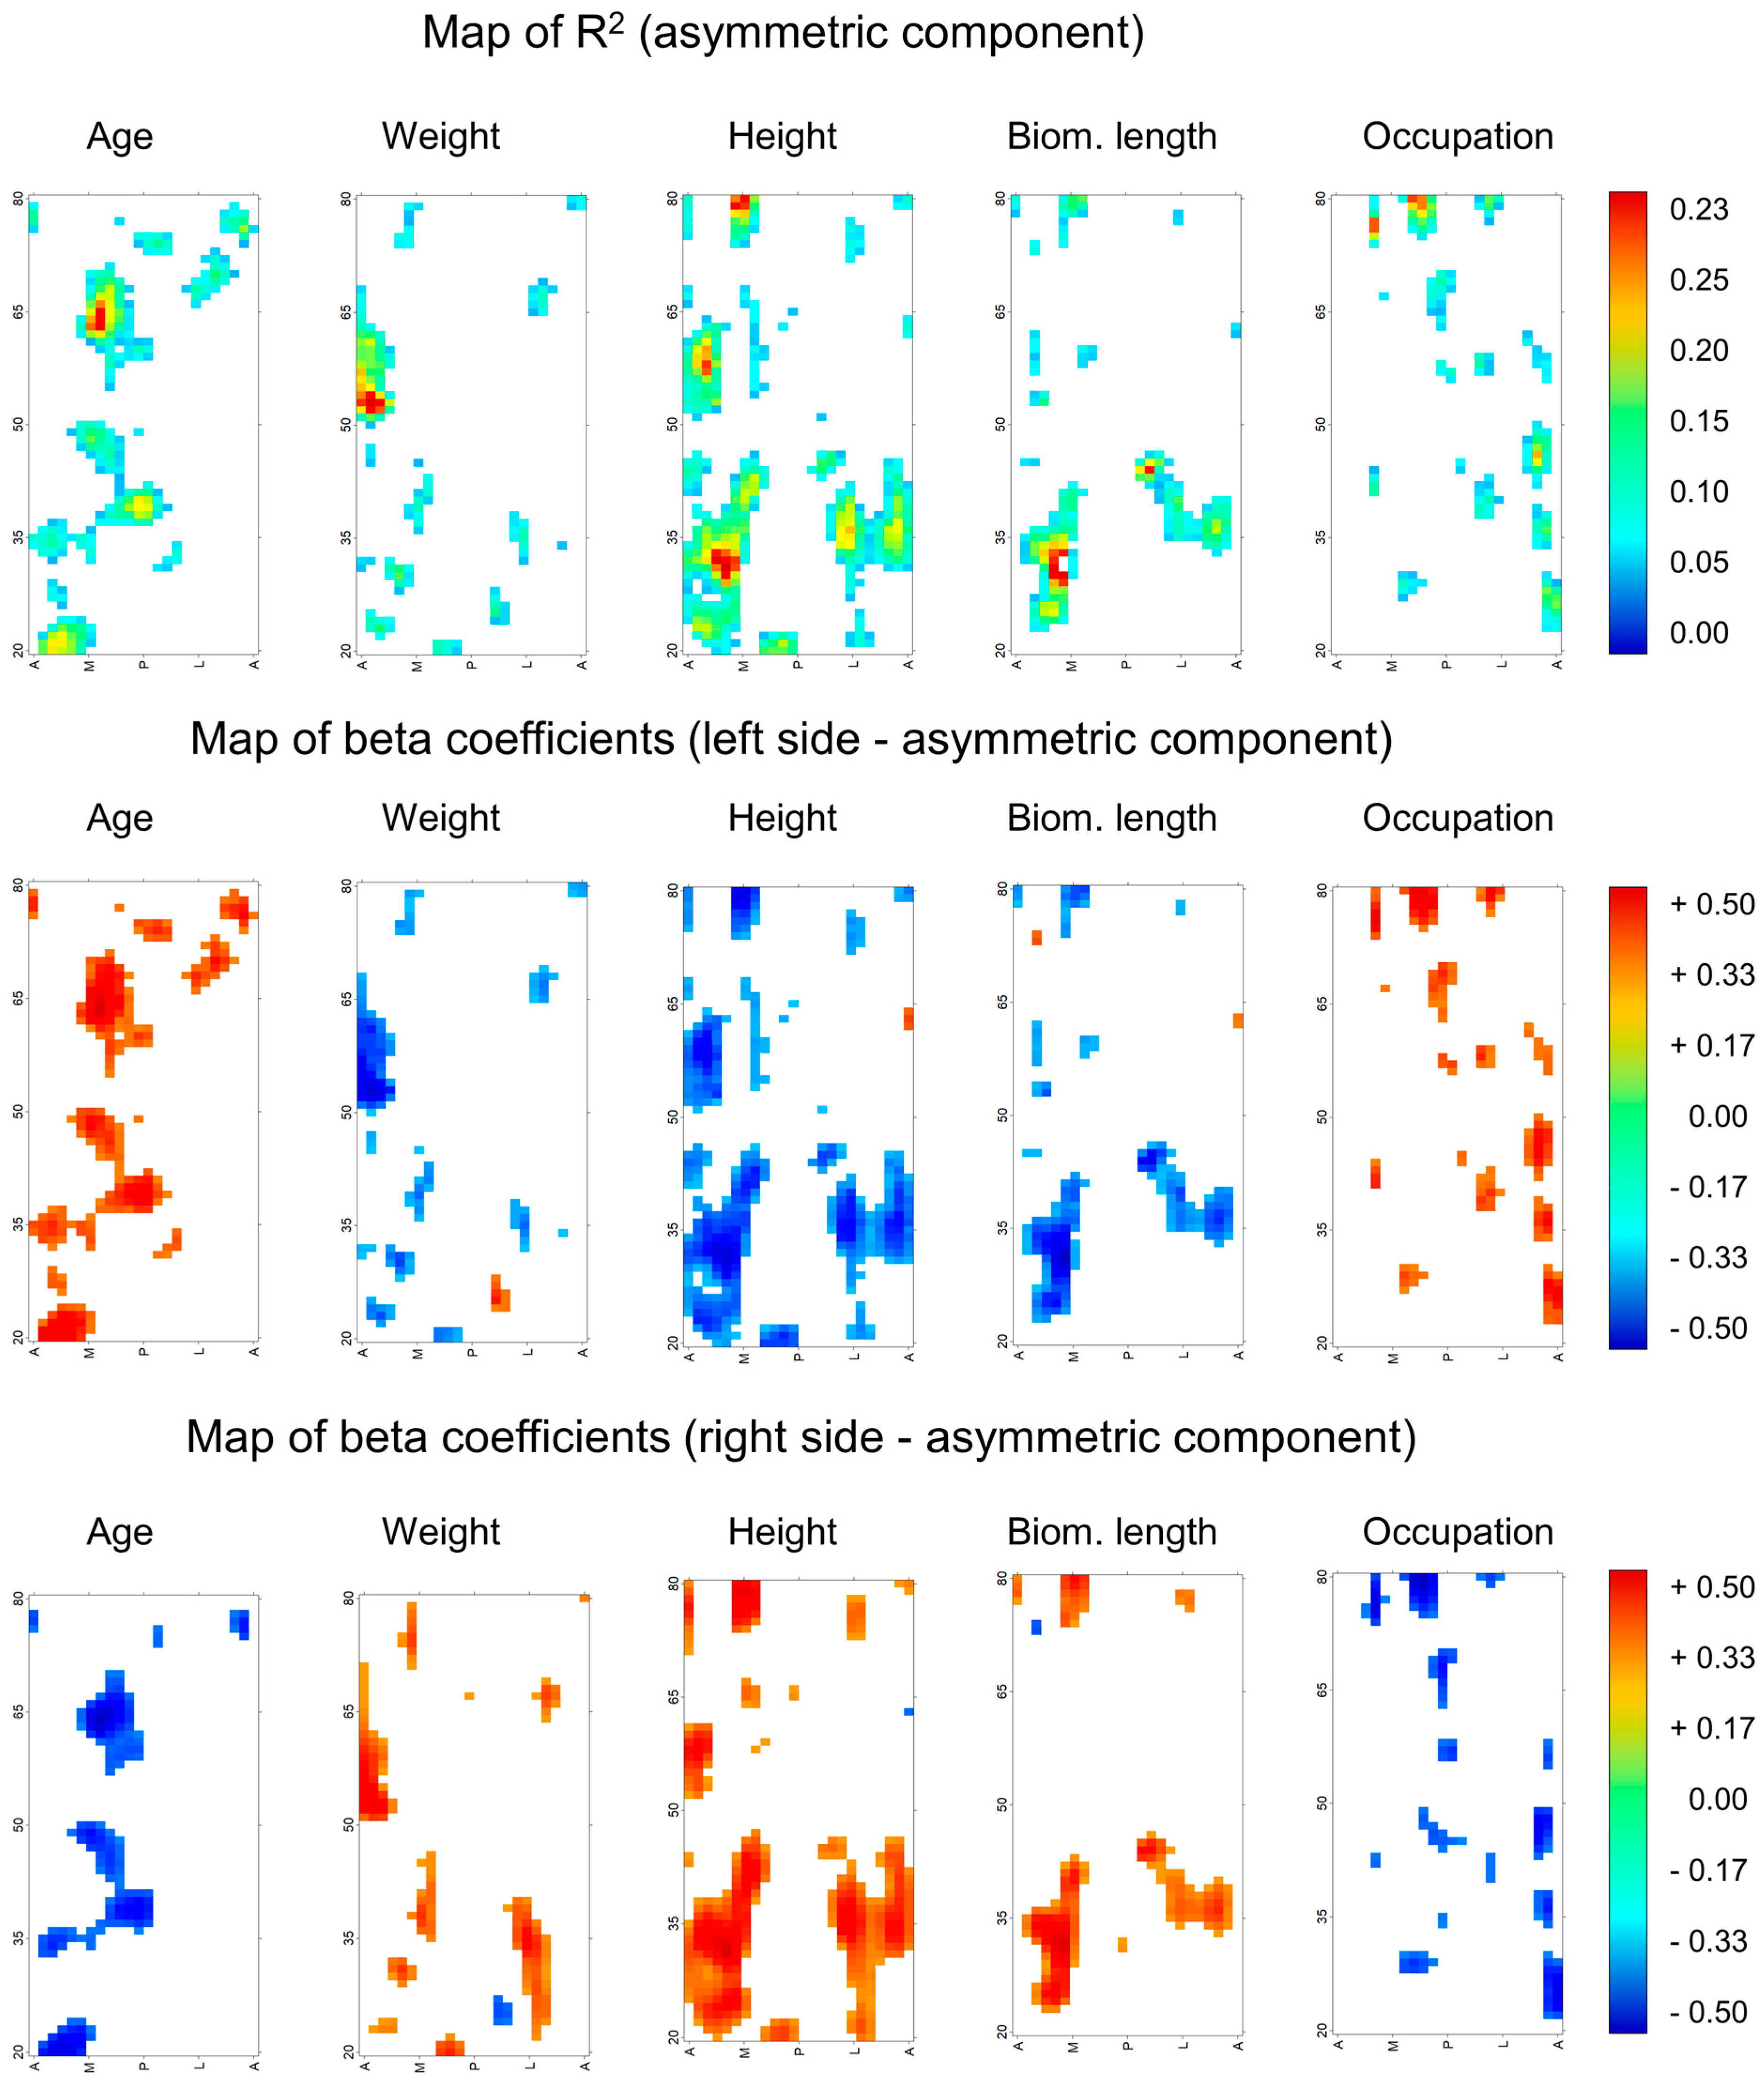
2.5. Relation between Cortical Thickness Asymmetry Humerus and Biological Variables

Commonly, some limitations apply in evaluating patterns of lateralization (i.e., asymmetry). Analyses are usually limited to a single (e.g., at 40% of the total biomechanical length) or a few cross sections. In addition, the investigation is restricted to the use of univariate and exploratory statistics. Here, we present two different strategies to evaluate the relative contribution to asymmetry of different predictors (i.e., weight, height, age and occupation).
To assess how asymmetry in the distribution of cortical thickness varies in relation to occupation, age, weight, height and biomechanical length, we performed a multiple regression with these variables as independent and maps of differences in cortical thickness between the left and right side as dependent variables. Specifically, the cortical maps of differences between sides are created by subtracting the mean matrix of cortical thicknesses from the matrices of the left and mirrored right sides from each linear regression we computed R2 and beta coefficients. R2 quantifies the strength of the relationship between the model and the dependent variable. The beta coefficient describes the rate of change of differences in cortical thickness between sides for every unit of change in the independent variables. In addition, we measured the proportion of variance in total asymmetry related to each independent variable using multivariate regression analysis. Lastly, we applied the variance partitioning method [45] to measure the portions of variance of total asymmetry shared by independent variables. The method calculates the explanatory power of different variables in relation to the same response variable (or matrix). We used redundancy analysis to determine the partial effect of each variable (i.e., weight, height, age and occupation) on the response variable (magnitude of asymmetry of cortical thickness between sides). We used alpha (significance) level = 0.05 for all statistical tests.

3. Results

The asymmetry in polar moment of inertia, J, calculated at 40% of the biomechanical length shows a general trend of lateralization ranging between 0.36% and 10.37%. In all but 4 individuals, J is larger on the right side (Table 2). There are no statistically significant differences between occupation and sex group means (Figure 3), as determined by two-way ANOVA of J among sexes or occupations.
The first two PCs of the symmetric component of cortical thicknesses account for 78% of the total variance (PC1 = 72.33%; PC2 = 5.79%) (Figure 4). On average, the two sexes are separated along PC1 with the females towards the positive limit, and males, the negative (t14.48 = 4.66, p < 0.01). The three occupation groups largely overlap but with the “building”, “army” and “desk” groups approximately distributed in this order from negative to positive limits of PC1.
The visualisations of the morphometric maps represented by the extremes of PCs 1 and 2 highlight a general increase in cortical thickness at negative values of PC1. PC2 represents a different pattern of thickening/thinning of the humeral diaphysis. With increasingly negative values of PC2, the cortical bone is thicker in the mid and distal portion of the medial and anterior margins and between the posterior and lateral margins. Conversely, with more positive values, the proximal portion of the diaphysis is thicker anteriorly (Figure 4).
The PCA of the asymmetric component (Figure 5) indicates how the cortical thickness of the entire diaphysis differs from symmetry. The distance of points from the origin indicates the degree of asymmetry represented by the first two PC scores. Following Mardia et al. [46], we found that directional (mean difference between sides) and fluctuating (average differences from the symmetric mean) components account for 16.00% and 84.00% of the total variance, respectively.
PC1 explains 41.05% of the total variance. This axis describes generalised thickening or thinning of the cortex as seen in the morphometric maps representing the extremes of this PC. Scores on PC1 indicate that the right-sided cortex tends to be thicker than the left (with a few exceptions, plausibly explained by handedness). PC2 (7.47% of the total variance) shows a different pattern of asymmetry. The morphometric maps indicate that, from positive to negative limits, this PC represents posterior and anterior thinning of the diaphysis (Figure 5).
While the differences between sexes (F = 18.40, Df = 1, p < 0.01) in asymmetry are significant, as indicated by two-way ANOVA (Figure 6), there are no statistically significant differences in asymmetry between the occupation groups.
The lengths of the vectors in Figure 5 indicate the magnitude of asymmetry of cortical thickness, represented by the first two PC scores. The sum of the vectors from the entire matrix of PC scores represents the overall magnitude of asymmetry. In this sample, it is correlated with the index of lateralization (JLAT%), calculated using the polar moment of inertia, J, (correlation = 0.58, p < 0.01).
In multivariate regressions, body weight (R2 = 0.19, b = 0.22, p < 0.01), height (R2 = 0.22, b = 0.31, p < 0.01) and biomechanical length (R2 = 0.16, b = 0.14, p < 0.01) significantly predicted asymmetry, while age and occupation score are not statistically significant predictors (Figure 7).
A variance partitioning analysis was performed to evaluate the percentage of variance in asymmetry associated with weight, height, age and occupation score. The combination of all tested variables explained 24.72% of the variance in asymmetry calculated from the PC scores of asymmetric component. Weight (2.09%) and height (2.39%), and their interaction (16.31%) explain the largest portion of asymmetry (Figure 8).
Multivariate regression was used to assess the relationship between asymmetry in cortical thickness and the independent variable of interest (i.e., weight, age, height, biomechanical length and occupation scores) at each cell of the morphometric maps (i.e., the cortical thickness measured at each semilandmark). At each cell, the explained variance (R2) and slope (Beta coefficient) can be mapped to visualise the relationship between cortical map asymmetry and the independent variables. Maps can be drawn to represent the (exactly opposite) effects of these relationships on the right or left sides. Such maps are presented in Figure 8. The maps of R2 indicate that each independent variable is associated with a different pattern of asymmetry, with different localised regions showing an association with each variable. Unsurprisingly, regressions of height and biomechanical length produce the most similar diagrams. On average, the slopes (beta coefficients) of asymmetry of cortical thickness on the independent variables indicate that cortical thicknesses tend to be greater in the right arm (likely this is a mostly right-handed sample). The maps of Figure 8 show values only for those regions where the regression is significant. Weight, height and mechanical length are associated with a larger rate of increase in cortical thickness in the right (usually the dominant) compared to the left humerus. In contrast, with increasing age, cortical thickness decreases more slowly in the dominant arm.

4. Discussion and Conclusions

Studies of patterns of lateralization in archaeological populations often suffer from the lack of a reference sample with known loading history to contextualise the findings. Additionally, the assessment of lateralization is commonly limited to the analysis of one or just a few levels along the diaphysis of paired long bones. The publication of the NMDID [42] offers the prospect of directly relating skeletal form (total body CT-scan) with known biological profile and loading history (metadata with 60 variables). The time and effort in gathering skeletal data is much reduced by the functions available in the R package morphomap [41], a recently published toolkit providing functions to extract from CT data, the segmented long bone of interest and based on that. Here, we further extend morphomap to visualize and analyze asymmetry in paired long bones. Specifically, the new implementation: (i) performs a PCA on the symmetric and asymmetric component of form variation; (ii) creates morphometric maps of symmetric and asymmetric variation on single individuals or on entire samples from PC scores; (iii) calculates the total magnitude of asymmetry of cortical bone distribution, quantifying deviations from symmetry.
PCAs of both symmetric and asymmetric components indicate that cortical bone distribution differs between sexes, but not between the occupation groups considered in our analyses. On average, male individuals possess thicker and more asymmetric humeri than females. All our measurements of magnitude of asymmetry (cross-sectional geometry and vector lengths from PC scores) present a general pattern of right lateralization. This finding is consistent with previous studies indicating 90% preference for right-handedness in modern humans [47,48,49]. Further, the analyses of morphometric maps indicate that males are more asymmetric than females. However, since males are larger on average, their more asymmetric cortical thickness might be guided by allometric effects. In contrast, the index of lateralization based on cross-sectional geometry (JLAT%) does not significantly differ between sexes. This contrast may be due to the fact that JLAT% is calculated at a single level along the diaphysis (40%v of bone biomechanical length), whereas the calculation of absolute lateralization from PC scores takes into account the entire diaphysis. In fact, JLAT% calculated at 70%, 75%, 76%, 78% and 79% of bone length is statistically different between sexes.
Regression analyses on morphometric maps show that, as body weight, height and longbone biomechanical length increase, so does asymmetry. In contrast, with increasing of age, asymmetry decreases (i.e., the oldest individuals are less asymmetric than the youngest individuals). Interestingly, loading history (occupation scores) does not affect the pattern of asymmetry. The main effect of body proportions (weight and height) as a key factor in determining the degree of asymmetry is also confirmed by the partitioning of variance analysis performed on values of total asymmetry calculated from the PCA.
This study was able to test the hypothesised relationships between loading history and cortical bone distribution in the humeral shaft using the unique and extensive collection curated in the NMDID [42]. Despite the quality of these data, our analyses do not show a significant association between occupation and asymmetry. This analysis was confined to occupations that would be expected to lead to extremely different occupational loading histories (army, building vs. desk) in order to emphasise any effect of occupation. This suggests either that there is no strong difference in the effect of these occupations on loading history, or that occupational history does not reflect the full loading history, and that our categorisation by occupation is inadequate to describe individual loading history. Further studies are required to clarify this finding, which is potentially of great importance in archaeological and forensic contexts.

Author Contributions

Conceptualization, A.P., D.M., G.M. and P.O.; data curation, A.P. and C.Z.; formal analysis, A.P., C.Z., I.M. and A.M.; funding acquisition, A.P. and P.O.; investigation, A.P. and C.Z.; methodology, A.P. and P.O.; project administration, A.P. and P.O.; resources, A.P. and C.Z.; software, A.P., P.R. and P.O.; validation, C.Z.; visualization, A.P. and A.M.; writing—original draft, A.P., C.Z., P.R. and P.O.; writing—review and editing, C.Z., I.M., A.M., P.R., D.M., G.M. and P.O. All authors have read and agreed to the published version of the manuscript.

Funding

This project has received funding from the European Union’s Horizon 2020 research and innovation program (H2020 Marie Skłodowska-Curie Actions) under grant agreement H2020-MSCA-IF-2018 No. 835571 to Antonio Profico and Paul O’Higgins.

Institutional Review Board Statement

The study was conducted according to the guidelines of the Declaration of Helsinki, and approved by the Ethics Committee of the University of York, Department of Archaeology.

Informed Consent Statement

Not applicable.

Data Availability Statement

Not applicable.

Acknowledgments

The authors are grateful to two anonymous reviewers for helpful comments.

Conflicts of Interest

The authors declare no conflict of interest.

References

  1. Jurmain, R.; Cardoso, F.A.; Henderson, C.; Villotte, S. Bioarchaeology’s holy grail: The reconstruction of activity. In A Companion to Paleopathology; Grauer, A.L., Ed.; Wiley-Blackwell: Oxford, UK, 2011; pp. 531–552. [Google Scholar]
  2. Larsen, C.S. Bioarchaeology: Interpreting Behavior from the Human Skeleton, 2nd ed.; Cambridge Studies in Biological and Evolutionary Anthropology; Cambridge University Press: Cambridge, UK, 2015. [Google Scholar]
  3. Ruff, C.; Holt, B.; Trinkaus, E. Who’s afraid of the big bad Wolff? “Wolff’s law” and bone functional adaptation. Am. J. Phys. Anthr. 2006, 129, 484–498. [Google Scholar] [CrossRef]
  4. Ruff, C.B. Biomechanical analyses of archaeological human skeletons. In Biological Anthropology of the Human Skeleton, 2nd ed.; Katzenberg, M.A., Saunders, S.R., Eds.; Alan R. Liss: New York, NY, USA, 2008; pp. 183–206. [Google Scholar]
  5. Trinkaus, E.; Churchill, S.E.; Ruff, C.B. Postcranial robusticity inHomo. II: Humeral bilateral asymmetry and bone plasticity. Am. J. Phys. Anthr. 1994, 93, 1–34. [Google Scholar] [CrossRef]
  6. Miller, B.F.; Hamilton, K.L.; Majeed, Z.R.; Abshire, S.M.; Confides, A.L.; Hayek, A.M.; Hunt, E.R.; Shipman, P.; Peelor, F.F.; Butterfield, T.A.; et al. Enhanced skeletal muscle regrowth and remodelling in massaged and contralateral non-massaged hindlimb. J. Physiol. 2017, 596, 83–103. [Google Scholar] [CrossRef] [PubMed]
  7. Trinkaus, E.; Churchill, S.E. Diaphyseal cross-sectional geometry of near eastern middle palaeolithic humans: The humerus. J. Archaeol. Sci. 1999, 26, 173–184. [Google Scholar] [CrossRef]
  8. Frost, H.M. Orthopaedic Biomechanics; Charles C. Thomas: Springfield, IL, USA, 1973. [Google Scholar]
  9. Currey, J. The many adaptations of bone. J. Biomech. 2003, 36, 1487–1495. [Google Scholar] [CrossRef]
  10. Oxnard, C.E. Thoughts on bone biomechanics. Folia Primatol. 2004, 75, 189–201. [Google Scholar] [CrossRef] [PubMed]
  11. Cardoso, F.A.; Henderson, C. Enthesopathy formation in the humerus: Data from known age-at-death and known occupation skeletal collections. Am. J. Phys. Anthr. 2009, 141, 550–560. [Google Scholar] [CrossRef] [PubMed]
  12. Weiss, E. Humeral cross-sectional morphology from 18th century Quebec prisoners of war: Limits to activity reconstruction. Am. J. Phys. Anthr. 2005, 126, 311–317. [Google Scholar] [CrossRef] [PubMed]
  13. Bertram, J.E.A.; Swartz, S.M. The ‘law of bone transformation’: A case of crying wolff? Biol. Rev. 1991, 66, 245–273. [Google Scholar] [CrossRef]
  14. Melcher, A.H.; Accursi, G.E. Transmission of an “osteogenic message” through intact bone after wounding. Anat. Rec. Adv. Integr. Anat. Evol. Biol. 1972, 173, 265–275. [Google Scholar] [CrossRef]
  15. Pearson, O.M.; Lieberman, D.E. The aging of Wolff’s “law”: Ontogeny and responses to mechanical loading in cortical bone. Am. J. Phys. Anthr. 2004, 125, 63–99. [Google Scholar] [CrossRef] [PubMed]
  16. Ruff, C.B.; Jones, H.H. Bilateral asymmetry in cortical bone of the humerus and tibia—Sex and age factors. Hum. Biol. 1981, 53, 69–86. [Google Scholar] [PubMed]
  17. Frost, H.M. An overview: Spinal tissue vital biomechanics for clinicians. In Spinal Disorders in Growth and Aging; Takahashi, H.E., Ed.; Springer: Tokyo, Japan, 1995; pp. 95–126. [Google Scholar]
  18. Sparacello, V.; Pearson, O.; Coppa, A.; Marchi, D. Changes in skeletal robusticity in an iron age agropastoral group: The samnites from the Alfedena necropolis (Abruzzo, Central Italy). Am. J. Phys. Anthr. 2010, 144, 119–130. [Google Scholar] [CrossRef]
  19. Rhodes, J.A.; Knüsel, C.J. Activity-related skeletal change in medieval humeri: Cross-sectional and architectural alterations. Am. J. Phys. Anthr. 2005, 128, 536–546. [Google Scholar] [CrossRef] [Green Version]
  20. Tur, S. Bilateral asymmetry of long bones in bronze and early iron age pastoralists of the altai. Archaeol. Ethnol. Anthr. Eurasia 2014, 42, 141–156. [Google Scholar] [CrossRef]
  21. Sládek, V.; Ruff, C.B.; Berner, M.; Holt, B.; Niskanen, M.; Schuplerová, E.; Hora, M. The impact of subsistence changes on humeral bilateral asymmetry in Terminal Pleistocene and Holocene Europe. J. Hum. Evol. 2016, 92, 37–49. [Google Scholar] [CrossRef] [Green Version]
  22. Kubicka, A.M.; Nowaczewska, W.; Balzeau, A.; Piontek, J. Bilateral asymmetry of the humerus in Neandertals, Australian aborigines and medieval humans. Am. J. Phys. Anthr. 2018, 167, 46–60. [Google Scholar] [CrossRef] [PubMed]
  23. Churchill, S.E.; Formicola, V. A case of marked bilateral asymmetry in the Upper Limbs of an Upper Palaeolithic Male from Barma Grande (Liguria). Italy Int. J. Osteoarchaeol. 1997, 7, 18–38. [Google Scholar] [CrossRef]
  24. Perchalski, B.; Placke, A.; Sukhdeo, S.M.; Shaw, C.N.; Gosman, J.H.; Raichlen, D.A.; Ryan, T.M. Asymmetry in the cortical and trabecular bone of the human humerus during development. Anat. Rec. Adv. Integr. Anat. Evol. Biol. 2018, 301, 1012–1025. [Google Scholar] [CrossRef] [Green Version]
  25. Ben-Itzhak, S.; Smith, P.; Bloom, R.A. Radiographic study of the humerus in Neandertals and Homo sapiens sapiens. Am. J. Phys. Anthr. 1988, 77, 231–242. [Google Scholar] [CrossRef]
  26. Shaw, C.N.; Hofmann, C.L.; Petraglia, M.D.; Stock, J.T.; Gottschall, J.S. Neandertal humeri may reflect adaptation to scraping tasks, but not spear thrusting. PLoS ONE 2012, 7, e40349. [Google Scholar] [CrossRef] [Green Version]
  27. Sparacello, V.S.; Villotte, S.; Shackelford, L.L.; Trinkaus, E. Patterns of humeral asymmetry among Late Pleistocene humans. C. R. Palevol 2017, 16, 680–689. [Google Scholar] [CrossRef]
  28. Vandermeersch, B.; Trinkaus, E. The postcranial remains of the Régourdou 1 Neandertal: The shoulder and arm remains. J. Hum. Evol. 1995, 28, 439–476. [Google Scholar] [CrossRef]
  29. Pérez-Criado, L.; Rosas, A.; Bastir, M.; Pastor, F. Humeral laterality in modern humans and Neanderthals: A 3D geometric morphometric analysis. Anthr. Sci. 2017, 125, 117–128. [Google Scholar] [CrossRef] [Green Version]
  30. Uomini, N.T. Handedness in Neanderthals. In Neanderthal Lifeways, Subsistence and Technology: One Hundred Fifty Years of Neanderthal Study; Conard, N.J., Richter, J., Eds.; Springer: Dordrecht, The Netherlands, 2011; pp. 139–154. [Google Scholar]
  31. Ireland, A.; Maden-Wilkinson, T.; Mcphee, J.; Cooke, K.; Narici, M.; Degens, H.; Rittweger, J. Upper limb muscle-bone asymmetries and bone adaptation in elite youth tennis players. Med. Sci. Sports Exerc. 2013, 45, 1749–1758. [Google Scholar] [CrossRef] [Green Version]
  32. Haapasalo, H.; Kontulainen, S.; Sievänen, H.; Kannus, P.; Järvinen, M.; Vuori, I. Exercise-induced bone gain is due to enlargement in bone size without a change in volumetric bone density: A peripheral quantitative computed tomography study of the upper arms of male tennis players. Bone 2000, 27, 351–357. [Google Scholar] [CrossRef] [Green Version]
  33. Kontulainen, S.; Sievänen, H.; Kannus, P.; Pasanen, M.; Vuori, I. Effect of long-term impact-loading on mass, size, and estimated strength of humerus and radius of female racquet-sports players: A peripheral quantitative computed tomography study between young and old starters and controls. J. Bone Miner. Res. 2003, 18, 352–359. [Google Scholar] [CrossRef] [PubMed]
  34. Nikander, R.; Sievänen, H.; Uusi-Rasi, K.; Heinonen, A.; Kannus, P. Loading modalities and bone structures at nonweight-bearing upper extremity and weight-bearing lower extremity: A pQCT study of adult female athletes. Bone 2006, 39, 886–894. [Google Scholar] [CrossRef]
  35. Shaw, C.N.; Stock, J.T. Habitual throwing and swimming correspond with upper limb diaphyseal strength and shape in modern human athletes. Am. J. Phys. Anthr. 2009, 140, 160–172. [Google Scholar] [CrossRef]
  36. Qu, X. Morphological effects of mechanical forces on the human humerus. Br. J. Sports Med. 1992, 26, 51–53. [Google Scholar] [CrossRef] [Green Version]
  37. Ruff, C.B.; Walker, A.; Trinkaus, E. Postcranial robusticity inHomo. III: Ontogeny. Am. J. Phys. Anthr. 1994, 93, 35–54. [Google Scholar] [CrossRef]
  38. Niinimäki, S. The relationship between musculoskeletal stress markers and biomechanical properties of the humeral diaphysis. Am. J. Phys. Anthr. 2012, 147, 618–628. [Google Scholar] [CrossRef]
  39. Ibáñez-Gimeno, P.; De Esteban-Trivigno, S.; Jordana, X.; Manyosa, J.; Malgosa, A.; Galtés, I. Functional plasticity of the human humerus: Shape, rigidity, and muscular entheses. Am. J. Phys. Anthr. 2013, 150, 609–617. [Google Scholar] [CrossRef]
  40. Wang, X.; Liu, H.; Zhao, L.; Fei, C.; Feng, X.; Chen, S.; Wang, Y. Structural properties characterized by the film thickness and annealing temperature for La2O3 films grown by atomic layer deposition. Nanoscale Res. Lett. 2017, 12, 233. [Google Scholar] [CrossRef] [Green Version]
  41. Profico, A.; Bondioli, L.; Raia, P.; O’Higgins, P.; Marchi, D. Morphomap: An R package for long bone landmarking, cortical thickness, and cross-sectional geometry mapping. Am. J. Phys. Anthr. 2020, 174, 129–139. [Google Scholar] [CrossRef]
  42. Edgar, H.J.H.; Daneshvari-Berry, S.; Moes, E.; Adolphi, N.L.; Bridges, P.; Nolte, K.B. New Mexico Decedent Image Database; Office of the Medical Investigator; University of New Mexico: Albuquerque, NM, USA, 2020. [Google Scholar]
  43. Montoye, H.J. Energy costs of exercise and sport. In Nutrition in Sport; Maughan, R.J., Ed.; Blackwell Science Ltd: Oxford, UK, 2000; pp. 53–72. [Google Scholar]
  44. Ruff, C.B. Long bone articular and diaphyseal structure in old world monkeys and apes. I: Locomotor effects. Am. J. Phys. Anthr. 2002, 119, 305–342. [Google Scholar] [CrossRef]
  45. Borcard, D.; Legendre, P.; Drapeau, P. Partialling out the spatial component of ecological variation. Ecology 1992, 73, 1045–1055. [Google Scholar] [CrossRef] [Green Version]
  46. Mardia, K.; Bookstein, F.; Moreton, I. Statistical assessment of bilateral symmetry of shapes. Biometrika 2000, 87, 285–300. [Google Scholar] [CrossRef]
  47. Perelle, I.B.; Ehrman, L. An international study of human handedness: The data. Behav. Genet. 1994, 24, 217–227. [Google Scholar] [CrossRef]
  48. McManus, I.C. The history and geography of human handedness. In Language Lateralization and Psychosis; Sommer, I.E.C., Kahn, R.S., Eds.; Cambridge University Press: Cambridge, UK, 2009; pp. 37–58. [Google Scholar]
  49. Shaw, C.N. Is ‘hand preference’ coded in the hominin skeleton? An in-vivo study of bilateral morphological variation. J. Hum. Evol. 2011, 61, 480–487. [Google Scholar] [CrossRef] [PubMed]
Figure 1. Top: morphomap extracts shape information as equiangular semilandmarks from the periosteal (blue) and endosteal surface (orange). Bottom: the cross section at 1% of the biomechanical length.
Symmetry 13 01711 g001
Figure 2. Workflow of the function morphomapAsymmetry. In (A), one of the two long bones is mirrored, and the two matrices of cortical thicknesses (MM) are computed (B). The differences between the two MMs may be computed by calculating (i) the arithmetic difference (C), (ii) the percentage change of the target with respect to the reference side (D), (iii) the difference between the two MMs and their mean (E).
Symmetry 13 01711 g002
Figure 3. Violin and box plots showing the percentage of right lateralization pooled by sex (left) and occupation (right, A = “army”, B = “building”, D = “desk”). Violin plots illustrate the density distribution of the data.
Symmetry 13 01711 g003
Figure 4. PCA of the symmetric component. Circular and square dots represent male and female individuals, respectively. Violet = “Army”, orange = “Building” and green = “Desk”. The double-sized circles and squares show the mean values of PC1 and PC2 pooled by sex and occupation. In the morphometric maps, the diaphysis is unrolled from the anterior border (on the left of the x-axis) and follows the medial, posterior, lateral and anterior borders. Violet and green respectively indicate greater or smaller values of cortical thickness. The tops and the bottoms of the morphometric maps correspond to the proximal (80% of the biomechanical length) and distal (20% of the biomechanical length) parts of the diaphysis.
Symmetry 13 01711 g004
Figure 5. PCA of the asymmetric component shown in two separated plots for the left (A) and right (B) sides. Arrows connect points representing the left (A) and right (B) sides of each individual from the origin (i.e., zero asymmetry between left and right side). Violet = “Army”, orange = “Building” and green = “Desk”. In the morphometric maps (C), violet and green palettes respectively indicate larger and smaller values of cortical thickness. In these, the diaphysis is unrolled from the anterior border (on the left of the x-axis) and follow the medial, posterior, lateral and anterior borders. Violet and green respectively indicate greater or smaller values of cortical thickness. The tops and the bottoms of the morphometric maps correspond to the proximal (80% of the biomechanical length) and distal (20% of the biomechanical length) parts of the diaphysis.
Symmetry 13 01711 g005
Figure 6. Violin plots of the total length of the displacement vectors of asymmetry in relation to sex (left) and occupation (right, A = “army”, B = “building”, D = “desk”). Violin plots illustrate the density distribution of the data.
Symmetry 13 01711 g006
Figure 7. Map of R2 and beta coefficients calculated from multivariate regression of the asymmetric component on independent variables of interest. Cortical thickness values were rank-transformed. In the first row, maps indicate which regions of the diaphysis show asymmetric variation in thickness with age, weight, height and biomechanical length. The R2 range is reported using a rainbow palette. White cells indicate statistically insignificant relationships. In the second and third rows, the beta coefficients from the multivariate regressions are mapped on the left and right sides, respectively. Warm colours describe an increase in cortical thickness, and cold colours indicate a reduction.
Symmetry 13 01711 g007
Figure 8. Variation partitioning Venn diagram. Variation in asymmetry expressed as adjusted R2 explained by weight, height, occupation and age and their intersections. Significance codes: ** = 0.001. Outside the Venn diagram are reported the total explained variances by each variable, taking into account the interactions between them. Note, the sum of the explained variance is not 100% (artefact of the variance partitioning algorithm due to the calculation of negative adjusted R2).
Symmetry 13 01711 g008
Table 1. morphomapAsymmetry: description of the main arguments.
ArgumentDefinition
mshape1First long bone processed with morphomapShape
mshape2Second long bone processed with morphomapShape
standandizeIf TRUE, the matrices of cortical thickness are standardized using the average biomechanical length between sides.
plotIf TRUE, the map of cortical thickness asymmetry is returned.
typeDefines the method to calculate the differences in cortical thickness between the two long bones: “diff” a map of arithmetic difference between reference and target is computed; “onMean” the morphometric map of asymmetry is defined by computing the differences from the mean for each long bone; “relChange” the morphometric map is computed by calculating the relative change in cortical thickness, expressed as percentage difference between reference and target long bones
referenceIf set to 1, mshape1 is defined as reference; if set on 2, mshape2 is defined as reference.
rem.outIf TRUE, outliers are removed from the matrices of cortical thickness.
scaleIf TRUE, the matrices of cortical thickness are scaled from 0 to 1.
gamMapIf TRUE, gam smoothing is applied.
Table 2. Description of the sample and calculation of lateralization. For all the individuals, we report age, weight, height and occupation. We calculated the biomechanical length of the humerus and the polar moment of inertia, J, at 40% of the biomechanical length on both sides (JL and JR) and the degree of lateralization, JLAT%, between the two sides. Values of J are multiplied by 103 (Ruff 2000). D = working at desk job; B = working in building/mining companies; A = working in the armed forces.
IDSexAgeWeightHeightOccupationJLJRJLAT%
100221male3491188D2.843.605.90
101358male2170168B1.501.571.07
101510male2686195A2.392.965.33
102253male46100183D1.621.924.26
102436male3783183D3.103.220.91
102602male3286193B2.262.401.56
103530male2273168B1.511.723.26
103862male3191191A2.112.261.76
104373male3486170B2.472.560.86
108039male3882188A1.651.923.77
114405male2779178B1.621.974.81
116546male2586184A2.822.433.72
116833male45109183A2.402.612.08
117662female2468173A1.291.503.85
118646male2684180A1.922.849.63
121289male25102184B2.742.982.10
123096male2475184B2.813.142.78
123240male3182180D1.642.055.61
125527female2650157D0.690.793.35
127137female5459158D1.381.321.20
129131male3379173A1.801.870.93
129352male3082180A1.561.864.29
130388male3768168A1.671.822.16
130964male2568175D2.873.424.42
132233male2980166B1.772.134.64
132433male2770185D2.062.302.72
139871female4961157B1.491.561.27
140368male3480185B3.173.834.74
141318male3277178B2.042.242.32
143365female4772165A1.161.101.32
143984male3091183D2.512.631.17
144071female3557160A1.041.080.94
144977male2475175D2.062.242.09
146626male2789163A0.981.164.24
147949male2991178A1.822.639.15
150608male3463158B1.812.012.64
152567male2482185A2.462.742.70
156886male2977178B1.781.972.51
158402male35109185B2.322.370.58
162065male2864170B1.561.884.76
166116female3656162B1.071.172.22
171170male32106182A2.963.755.90
171479male27100185D2.502.823.06
173218male2284163D1.952.061.36
175725male2886196B3.123.462.54
176660female2468173A0.790.841.47
177679male3877168A2.752.820.68
178078male3173168B2.102.312.32
180030male4082180A2.062.333.05
188902female2677165D1.251.122.82
190756female2448162D0.840.983.82
Publisher’s Note: MDPI stays neutral with regard to jurisdictional claims in published maps and institutional affiliations.

