
Hygroscopicity of Fresh and Aged Salt Mixtures from Saline Lakes
by
 , , , , and
Jun Li
1 ,
,
Wanyu Liu
1 ,
,
Linjie Li
2,
Wenjun Gu
3,4,
Xiying Zhang
5,6,
Mattias Hallquist
2,
Mingjin Tang
3,4,
Sen Wang
1,* and
Xiangrui Kong
2,* 1
Shaanxi Key Laboratory of Earth Surface System and Environmental Carrying Capacity, College of Urban and Environmental Sciences, Northwest University, Xi’an 710127, China
2
Department of Chemistry and Molecular Biology, Atmospheric Science, University of Gothenburg, SE-412 96 Gothenburg, Sweden
3
State Key Laboratory of Organic Geochemistry, Guangzhou Institute of Geochemistry, Chinese Academy of Sciences, Guangzhou 510640, China
4
University of Chinese Academy of Sciences, Beijing 100049, China
5
Key Laboratory of Salt Lake Resources and Chemistry, Qinghai Institute of Salt Lakes, Chinese Academy of Sciences, Xining 810008, China
6
Key Laboratory for Salt Lake Geology and Environment of Qinghai Province, Qinghai Institute of Salt Lakes, Chinese Academy of Sciences, Xining 810008, China
*
Authors to whom correspondence should be addressed.
Atmosphere 2021, 12(9), 1203; https://doi.org/10.3390/atmos12091203
Submission received: 11 August 2021
/
Revised: 10 September 2021
/
Accepted: 14 September 2021
/
Published: 16 September 2021
(This article belongs to the Special Issue Physical and Chemical Properties of Aerosols and Their Role in Weather and Climate)
Abstract
:The high hygroscopicity of salt aerosol particles makes the particles active in aerosol and cloud formations. Inland saline lakes are an important and dynamic source of salt aerosol. The salt particles can be mixed with mineral dust and transported over long distances. During transportation, these particles participate in atmospheric heterogeneous chemistry and further impact the climate and air quality on a global scale. Despite their importance and potential, relatively little research has been done on saline lake salt mixtures from atmospheric perspectives. In this study, we use experimental and model methods to evaluate the hygroscopic properties of saline lake brines, fresh salt aerosol particles, and aged salt aerosol particles. Both original samples and literature data are investigated. The original brine samples are collected from six salt lakes in Shanxi and Qinghai provinces in China. The ionic compositions of the brines are determined and the hygroscopicity measurements are performed on crystallized brines. The experimental results agree well with theoretical deliquescence relative humidity (DRH) values estimated by a thermodynamic model. The correlations between DRHs of different salt components and the correlations between DRHs and ionic concentrations are presented and discussed. Positive matrix factorization (PMF) analysis is performed on the ionic concentrations data and the hygroscopicity results, and the solutions are interpreted and discussed. The fresh and aged salt aerosol particles are analyzed in the same way as the brines, and the comparison shows that the aged salt aerosol particles completely alter their hygroscopic property, i.e., transferring from MgCl2− governed to NH4NO3− governed.
1. Introduction
Salt aerosol plays an important role in many processes related to atmospheric chemistry and climate systems [1], especially as active parts in aerosol and cloud formations [2,3] due to their high hygroscopicity [4]. The formation of salt particles has several pathways, including sea spray [5], wind erosion [6], anthropogenic processes [7], etc. An important and dynamic source is saline lakes and playas [8,9], which produce inland salt aerosol particles externally and internally mixed with mineral dust that can be transported over long distances [6,10,11,12,13,14,15,16,17]. These long-range transported aerosols can alter the radiative balance [18], influence precipitation [19], participate in atmospheric heterogeneous chemistry, and form secondary aerosol to deteriorate air quality [16,20].
The salt aerosol particles from saline lakes and playas impact the climate on a global scale [11,14,15,16,21]. Pratt and coworkers studied the cloud droplet residues over the Great Basin, where Na-K-Mg-Ca-Cl playa salt fingerprint components were identified, showing that these salt components act as active cloud condensation nuclei (CCN) [15]. Gaston et al. used thermodynamic models to describe the hygroscopicity of playa dust based on their chemical compositions [14]. Tang and coworkers studied the hygroscopicity of saline mineral dust from playa regions, and the experimental results are well described by thermodynamic models [22]. Kong and coworkers revealed that most of the playa surface salts are dominated by NaCl, regardless of the chemical compositions of the nearby saline lakes [23]. In the same work, the hygroscopicity of various sampled salts is well described by thermodynamic models, based on the ionic compositions [23].
The inland salt aerosol particles are also found to associate with haze formation in more populated regions. For example, the formation of secondary inorganic aerosol (SIA) in Shanghai is promoted by the salt aerosol after long-distance transportation from East Asian desert regions [16]. The formed haze is more harmful to human health compared to the primarily emitted dust and salt aerosol. Moreover, during transportation the salt-dust mixture can undergo heterogeneous reactions and be transformed to materials of higher hygroscopicity [24,25]. Mitroo et al. reported that the Cl-rich dust from playas can react with N2O5 and produce atmospheric reactive chlorine that facilitates tropospheric ozone formation [21]. Thus, facilitated by the long-range transportation and heterogeneous pathways, the inland salt aerosol particles impact the air quality and human health [26].
The origins of inland salt aerosol particles, i.e., saline lakes and playas, are under continuous and dynamic developments, especially in the context of climate change [27] and increased land and water use [28,29]. This makes saline lakes and playas more important due to their growing spatial extent. Despite the active and important roles of inland salt aerosol particles play in the climate system, the modern climate models have not yet taken them into account [30]. The main reasons are the relatively low abundance compared to other components (e.g., sea salt), as well as the poorly understood characteristics and mechanisms (e.g., salt-dust mixing ratio and state). In this study, we use experimental and model methods to evaluate the hygroscopic properties of saline lake brines, fresh and aged salt aerosol particles. Ionic compositions reported in the literature are extensively collected and analyzed by the model. The comparison between fresh and aged salt particles shows the change of hygroscopicity-governing components before and after ageing.
2. Methods
2.1. Sampling Sites
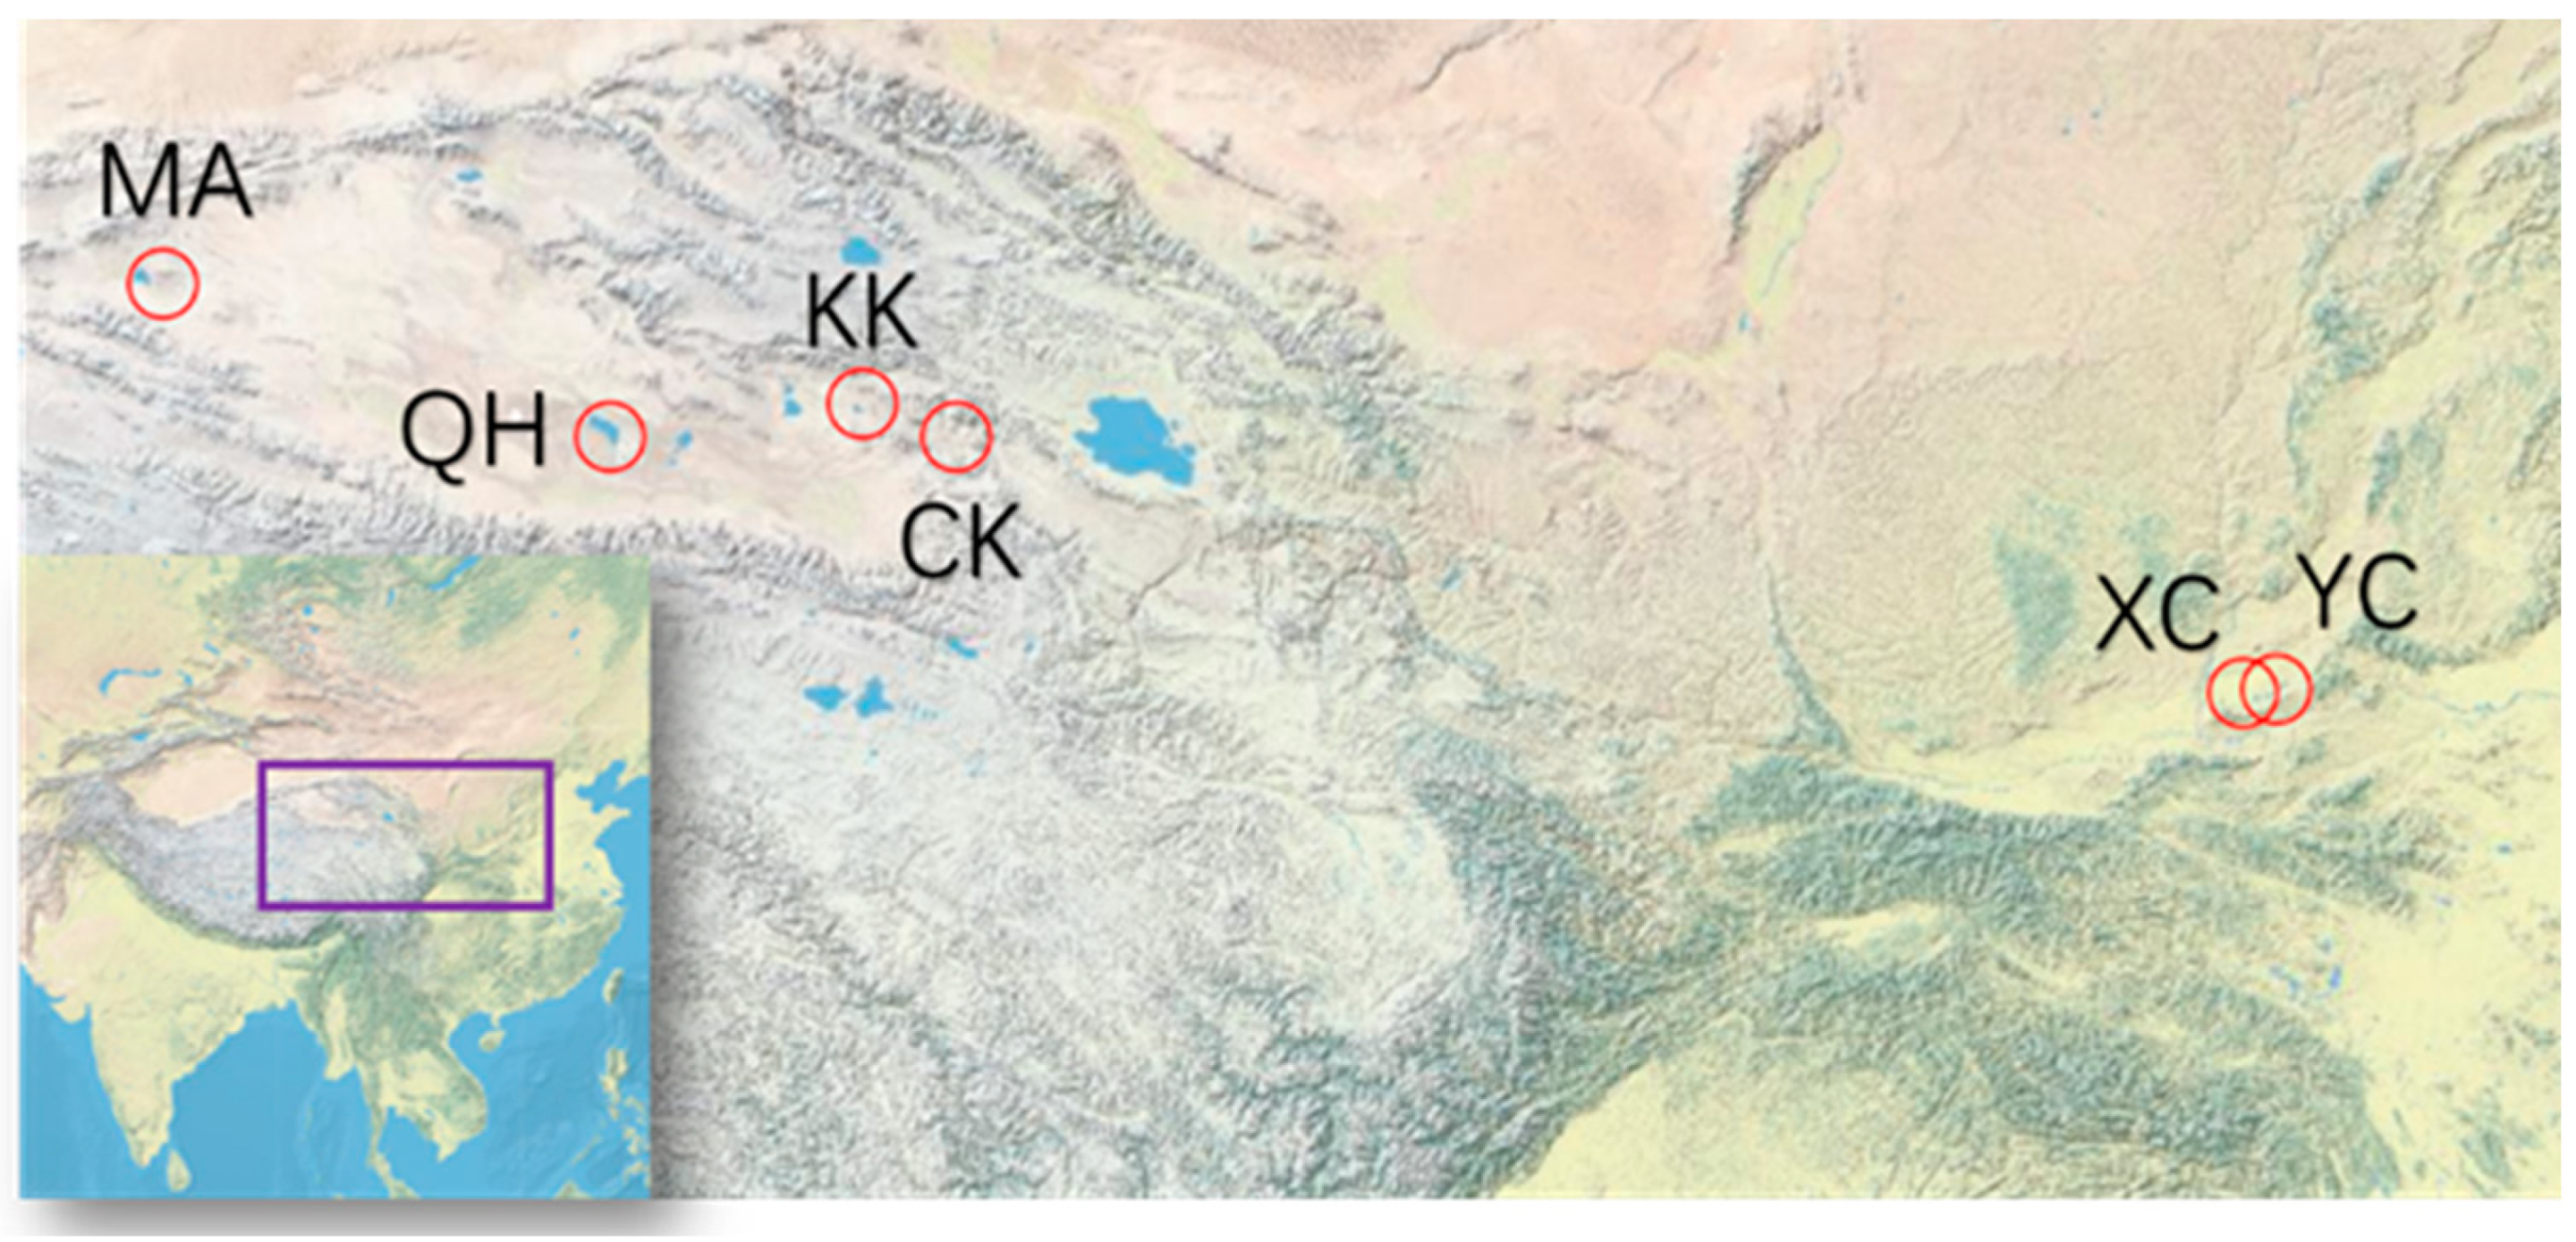
The original brine samples are collected from six salt lakes, located in Shanxi and Qinghai provinces, as shown in Figure 1.
2.1.1. Two Lakes (XC and YC) in Shanxi Province
The Yuncheng Salt Lake is in topographic depressions formed by local faults and subsidence which is situated in the southwest of Yuncheng city, Shanxi Province [31,32]. As a unique low-altitude inland salt lake in China [33], Yuncheng Salt Lake is one of the largest sodium sulfate type inland salt lakes in the world, covering an area of 132 km2, and the catchment area of the lake exceeds 120 km2. The lake is located in a monsoonal climatic region with an average temperature of 12.8 °C, its average annual precipitation is approximately 550 mm, and evapotranspiration is about 1240 mm. The lake basin has a high salinity center surrounded by low salinity and freshwater areas, and abundant salt mine is distributed at the bottom of the lake. Mirabilite, halite, and astrakhanite are the main mineral phases of the salt lake, with sulfate, chloride, and sodium as the dominant ions [33].
Two brine samples were collected from the Yuncheng Salt Lake region, Xiao Chi (XC) and Yan Chi (YC), on 2nd September 2020. The XC is the original saline lake and the YC is an evaporation pond next to the XC.
2.1.2. Four Lakes (CK, KK, QH and MA) in Qaidam Basin
The Qaidam Basin is located on the northern side of the Qinghai-Tibet Plateau and is surrounded by Qilian Mountains, Kunlun Mountains and Altun Mountains [34]. The Qaidam Basin which has a continental climate, mainly controlled by the westerly circulation, as well as influenced by India, East Asian winter, and East Asian summer monsoon is windy all year round [35]. The climate is dry and there is little vegetation in this area, mostly playas, Gobi and deserts. The total annual average precipitation is 42 mm, the average annual temperature is 5.1 °C, the average annual evaporation capacity which far exceeds the rainfall is 2597.6 mm [35]. Despite the low temperature latitude, the Qaidam Basin is far away from the ocean and the climate is extremely dry which has led to the formation of many salt lakes and playas in the basin. Basin lakes migrate from west to east, and the salt formation stage in the west is earlier than that in the east.
Chaka (CK) Salt Lake, Keke (KK) Salt Lake, Qarhan (QH) Salt Lake and Mang’ai (MA) Salt Pond are the sampling lakes in the Qaidam Basin, where the sampling was done during 11–14 September 2020. Detailed information about sampling locations can be found in a previous publication [23]. The brines from the six different salt lakes were taken 2–5 cm below the lake surface with a glass beaker and then all the samples were filtered by qualitative filter papers (pore size <20 μm) within 2 days after sampling. The samples were stored in polyethylene bottles sealed with Parafilm membrane and refrigerated at 4 °C.
2.2. Ion Chromatography
Prior to the ion chromatography measurements, the brine samples were diluted by a factor of 1000 to fulfill the detection range. The diluted brines were then filtered by 0.22 μm water filter membranes. The Dionex AQUION IC system (Thermo Fisher Scientific, MA, USA) was used to measure cations (Na+, K+, Mg2+ and Ca2+) and anions (Cl− and SO42−) simultaneously. CS12A with methanesulfonic acid eluent (30 mmol L−1) and AS11-HC with KOH eluent (20 mmol L−1) were used to measure cations and anions, respectively. All the samples were measured in duplicate with good reproducibility.
2.3. Brine Crystallization
Filtered brines were heated to evaporate water to yield crystalized brines. During heating, the brines were continuously stirred with a glass rod to prevent salt splashing especially at the late stage of boiling. When the brines completely dried up, the crystallized brines were bottled and stored in a refrigerator at 4 °C.
2.4. Hygroscopicity Measurements
The hygroscopic properties of the crystalized brines were measured by a vapor sorption analyzer (Q5000SA; TA Instruments). During experiments (at a room temperature of 25 ± 0.1 °C), the RH was elevated stepwise. The precise masses of the samples along the RH ramp were measured by a highly sensitive balance. The balance has a dynamic range of 0–100 mg and a measurement sensitivity is <0.1 µg. The detailed instrumental and operational information can be found in previous studies [36,37,38]. The masses of used samples were about 0.5–1 mg. The mass change of the empty sample holder during the RH ramp was measured as baseline, which was removed during data processing. The apparatus had been calibrated by NaCl, KCl and (NH4)2SO4 and the differences from theoretical deliquescence RH are within 1% [36]. Prior to each experiment, the sample was first dried at <1% RH, and then the RH was elevated to 90% RH with steps of 5–10% RH. At each RH step, 30 min was given for the samples to equilibrate with the environment, i.e., mass change ratio <0.05%. Three repeated samples were prepared and measured, and the average values are reported.
2.5. Thermodynamic Model
The AIOMFAC (aerosol inorganic-organic mixtures functional groups activity coefficients) model was used to simulate the deliquescence relative humidity (DRH) of the crystalized brine samples mixtures based on their activity coefficients [39,40]. The cations and anions are balanced by scaling. From the result output, the molar ion activity products (IAP) are calculated based on the calculated activities of ions. Taking MgCl2 as an example, the IAP is calculated as
where am is the activity of relevant ions. The IAP is a function of RH, and when the IAP reaches the IAP of saturated solutions (IAPsat), the corresponding salt deliquesces is the DRH. The IAPsat is calculated based on the ionic concentrations of saturated solution from literature. Figure 2 shows two example plots with the IAP versus RH. The horizontal dashed lines indicate the IAPsat of each corresponding salt, and the vertical dashed lines point to the DRH on the x-axis. The complete set of IAP figures for all samples is included in Figure S1.
2.6. Positive Matrix Factorization Analysis
The positive matrix factorization (PMF) receptor model was used to analyze the results, both the ion chromatography and the DRH results determined from the thermodynamic model. An open-source program EPA PMF 5.0 was employed for the analysis [41].
3. Results and Discussions
The ionic concentrations of brine samples (including six brines measured in this study and 90 values from literature) are presented. With the thermodynamic model, AIOMFAC, DRHs are calculated based on the ionic compositions. Correlation analysis and PMF analysis are applied on the ionic concentrations and the DRH values. In a similar way, the ionic compositions of fresh and aged salt aerosol particles, from the literature, are analyzed. The chemical and hygroscopic evolutions from brine, fresh aerosol to aged aerosol are discussed.
3.1. Saline Lake Brines
3.1.1. Ionic Concentrations
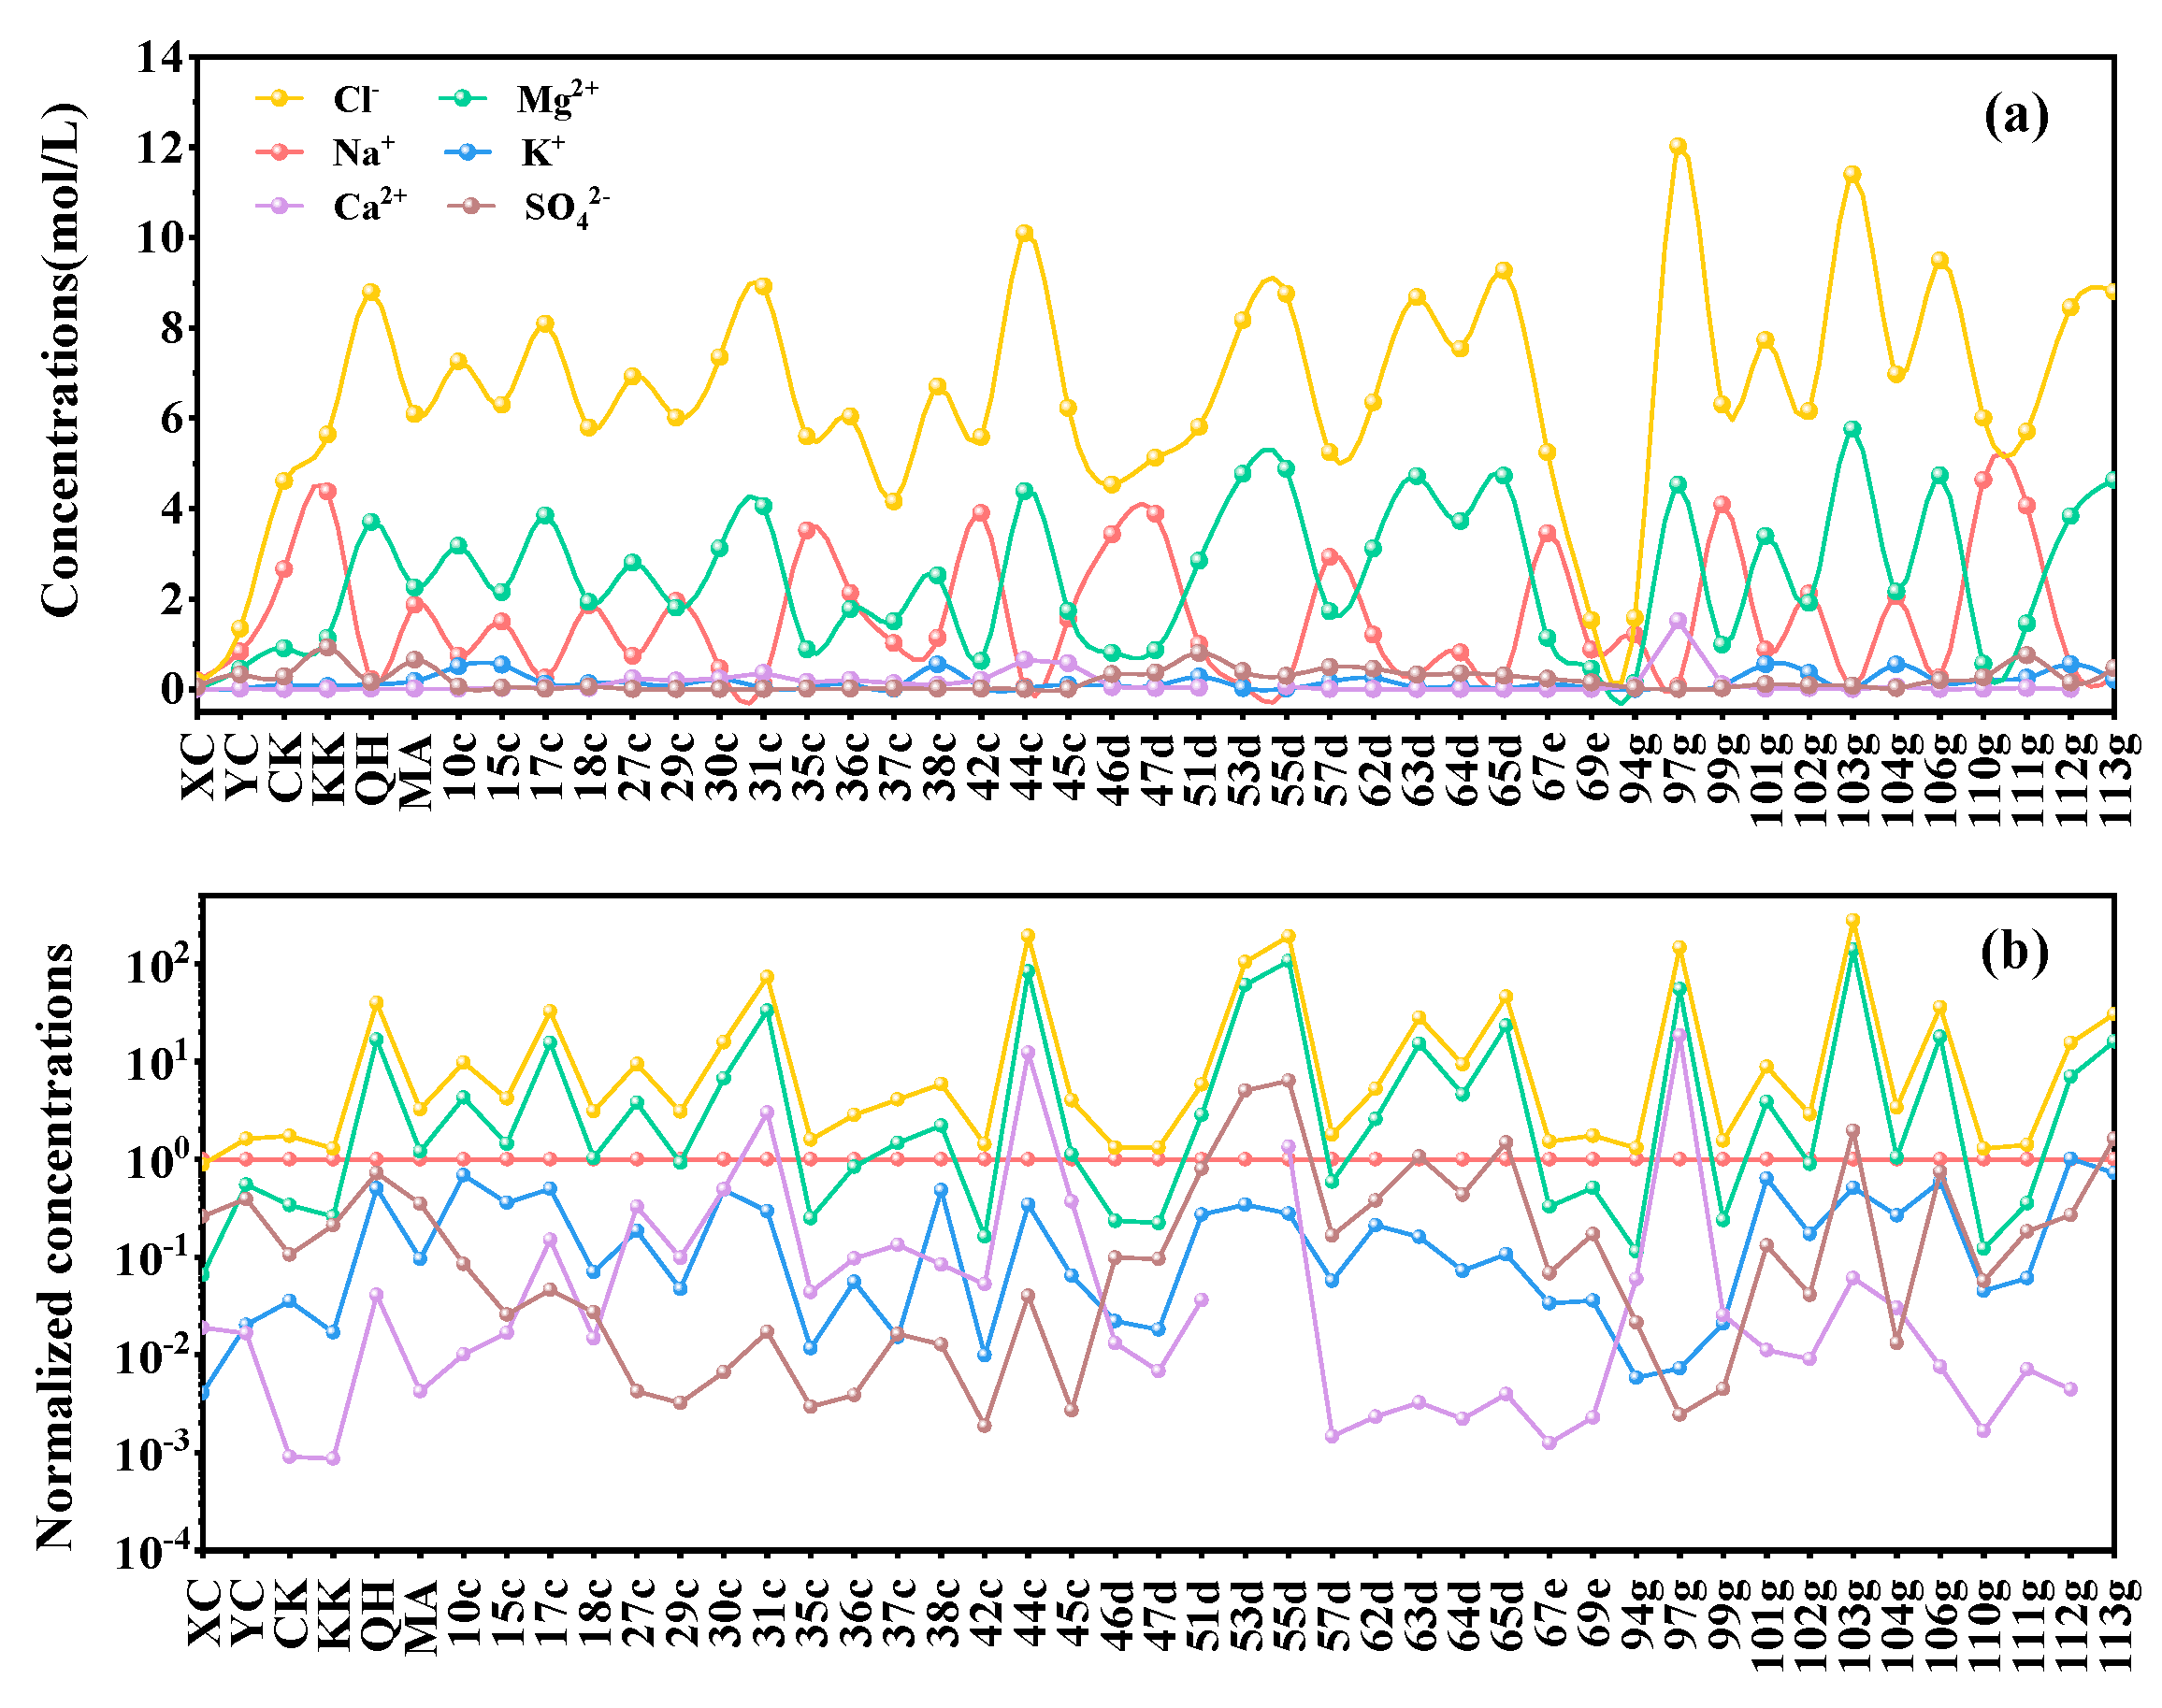
The complete collection of ionic concentrations from literature can be found in Table S1 [6,16,42,43,44,45,46,47,48], and representative values are plotted in Figure 3. Overall, the anion Cl− is most abundant in brines, followed by the cations Na+ and Mg2+ (Figure 3a). The concentrations of the other three ions (K+, Ca2+, SO42−) are relatively low, and their relative abundances are more visible in the Na-normalized log-scale Figure 3b. The concentrations of the two major cations Na+ and Mg2+ show an anti-phase oscillation, while the Mg2+ concentrations follow the Cl− concentrations (Figure 3b).
The correlations between the ions are quantified and the results are shown in Table 1. Between the major ions, Na+ and Mg2+ are competing with a negative correlation coefficient of −0.55. Mg2+ and Cl− are positively correlated with a coefficient of 0.86. As for the minor ions, K+ shows weak associations with Mg2+ (0.24) and Cl− (0.29), and a negative correlation with Na+ (−0.06) and Ca2+ (−0.21). Another noticeable negative correlation is between Ca2+ and SO42- (−0.33), as the two ions form CaSO4 that easily precipitates, leading to the low coexistence of the two ions in the aqueous phase
3.1.2. PMF Analysis of Ionic Concentrations
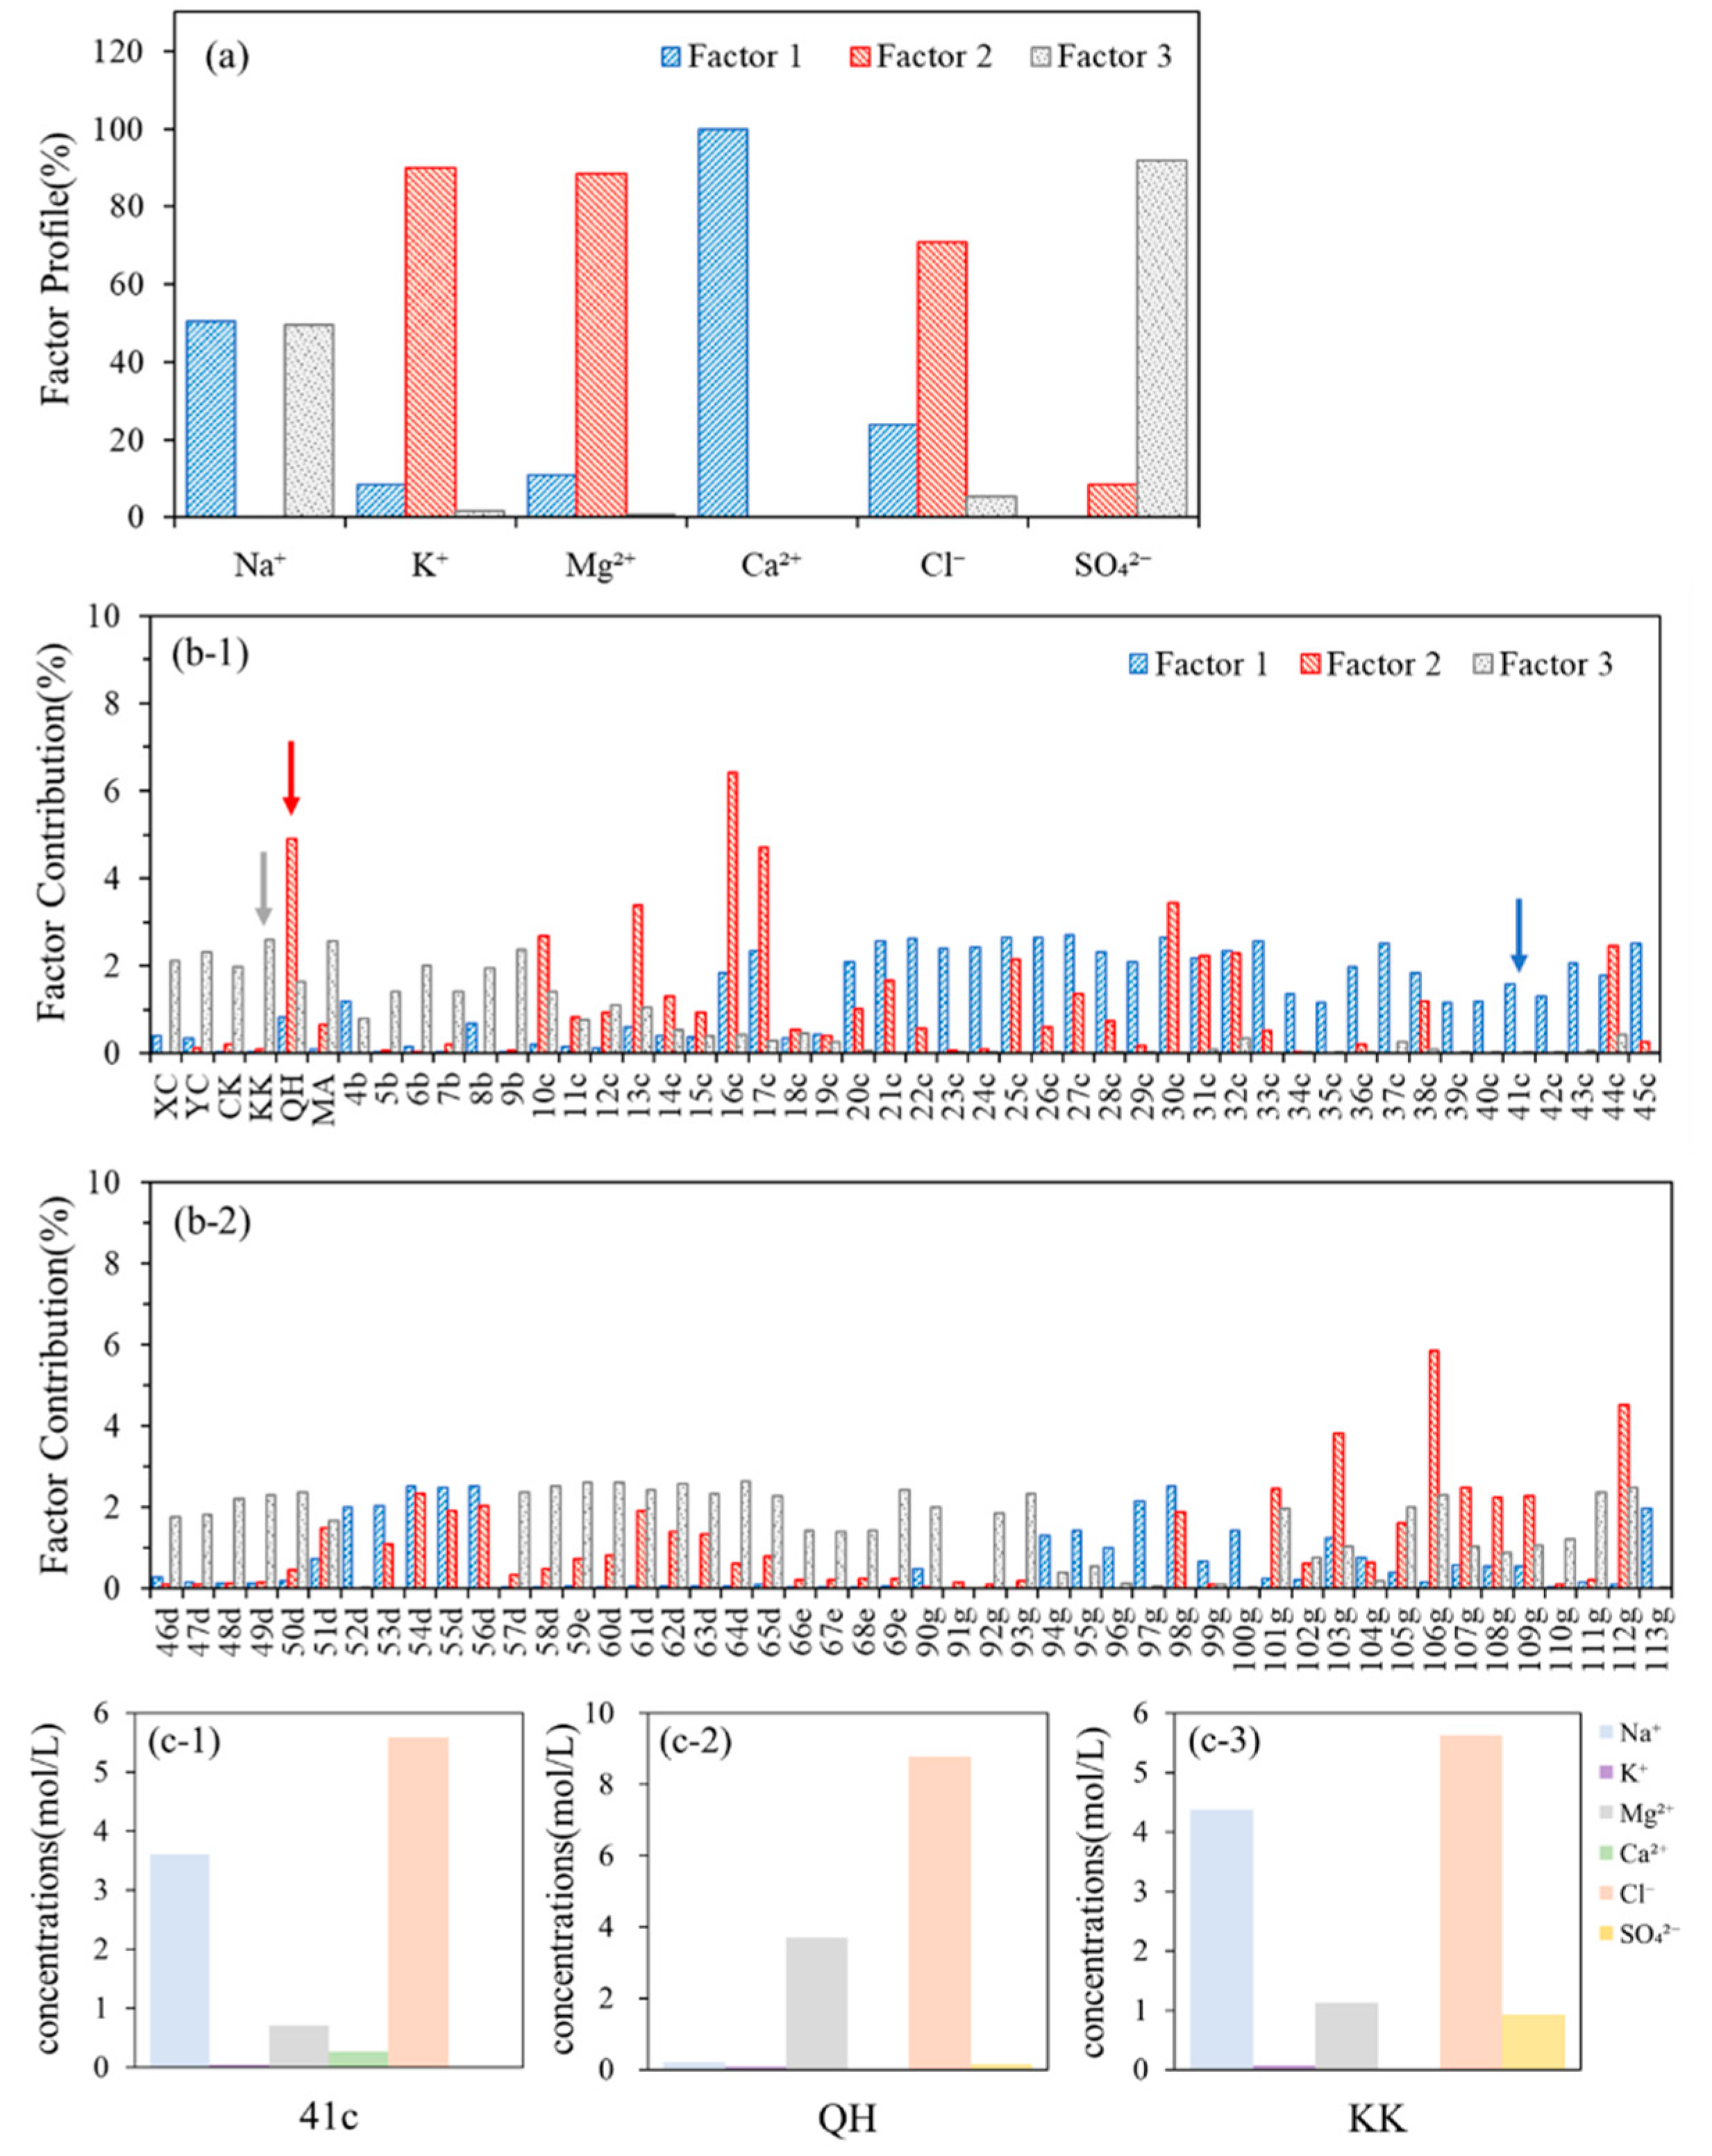
PMF analysis is performed to further investigate the relationship of the ions. The PMF analysis returns a 3-factor solution, and the factor profile is presented in Figure 4a. The three factors are led by (1) Factor 1: Ca2+, (2) Factor 2: K+, Mg2+, Cl−, and (3) Factor 3: SO42−, respectively. The major ion Na+ is evenly split into Factor 1 and 3, implying the anti-correlation between Na+ and the cations in Factor 2 (Mg2+ and K+).
The factor contributions of the PMF results are shown in Figure 4b, including three representative samples whose ionic concentrations are presented in Figure 4c. The representative sample of Factor 1 (41c) shows a high level of Cl− and Na+. Although the Ca2+ concentration (leader ion of Factor 1) is relatively low compared to the major ions (Cl−, Na+ and Mg2+) as shown in Figure 4c-1, the absolute Ca2+ concentration reaches 0.265 mol/L, which is significantly higher than the Ca2+ levels of most other samples. The QH case, representing Factor 2, shows outstandingly high level of SO42−, matching the factor profile of Factor 3, though it is still much lower than the main anion Cl−. The three-factor PMF result shows that the saline lake brines can be classified into three categories, featured with significant Ca2+, Mg2+, and SO42−, respectively.
3.1.3. Deliquescence RH
The complex chemical compositions of brines lead to complicated hygroscopic properties. Nevertheless, compared to other natural substances, saline lake brines are relatively simple due to their relatively low bioactivities and organic contents. Here, a thermodynamic model, AIOMFAC, is applied to describe the hygroscopic properties of salt mixtures with brine chemical textures. In total, there are six original brine samples from this study and 27 sets of representative literature data (22 sets of brine samples and 5 sets of aerosol samples) are analyzed. All the calculated DRHs can be found in Table S2.
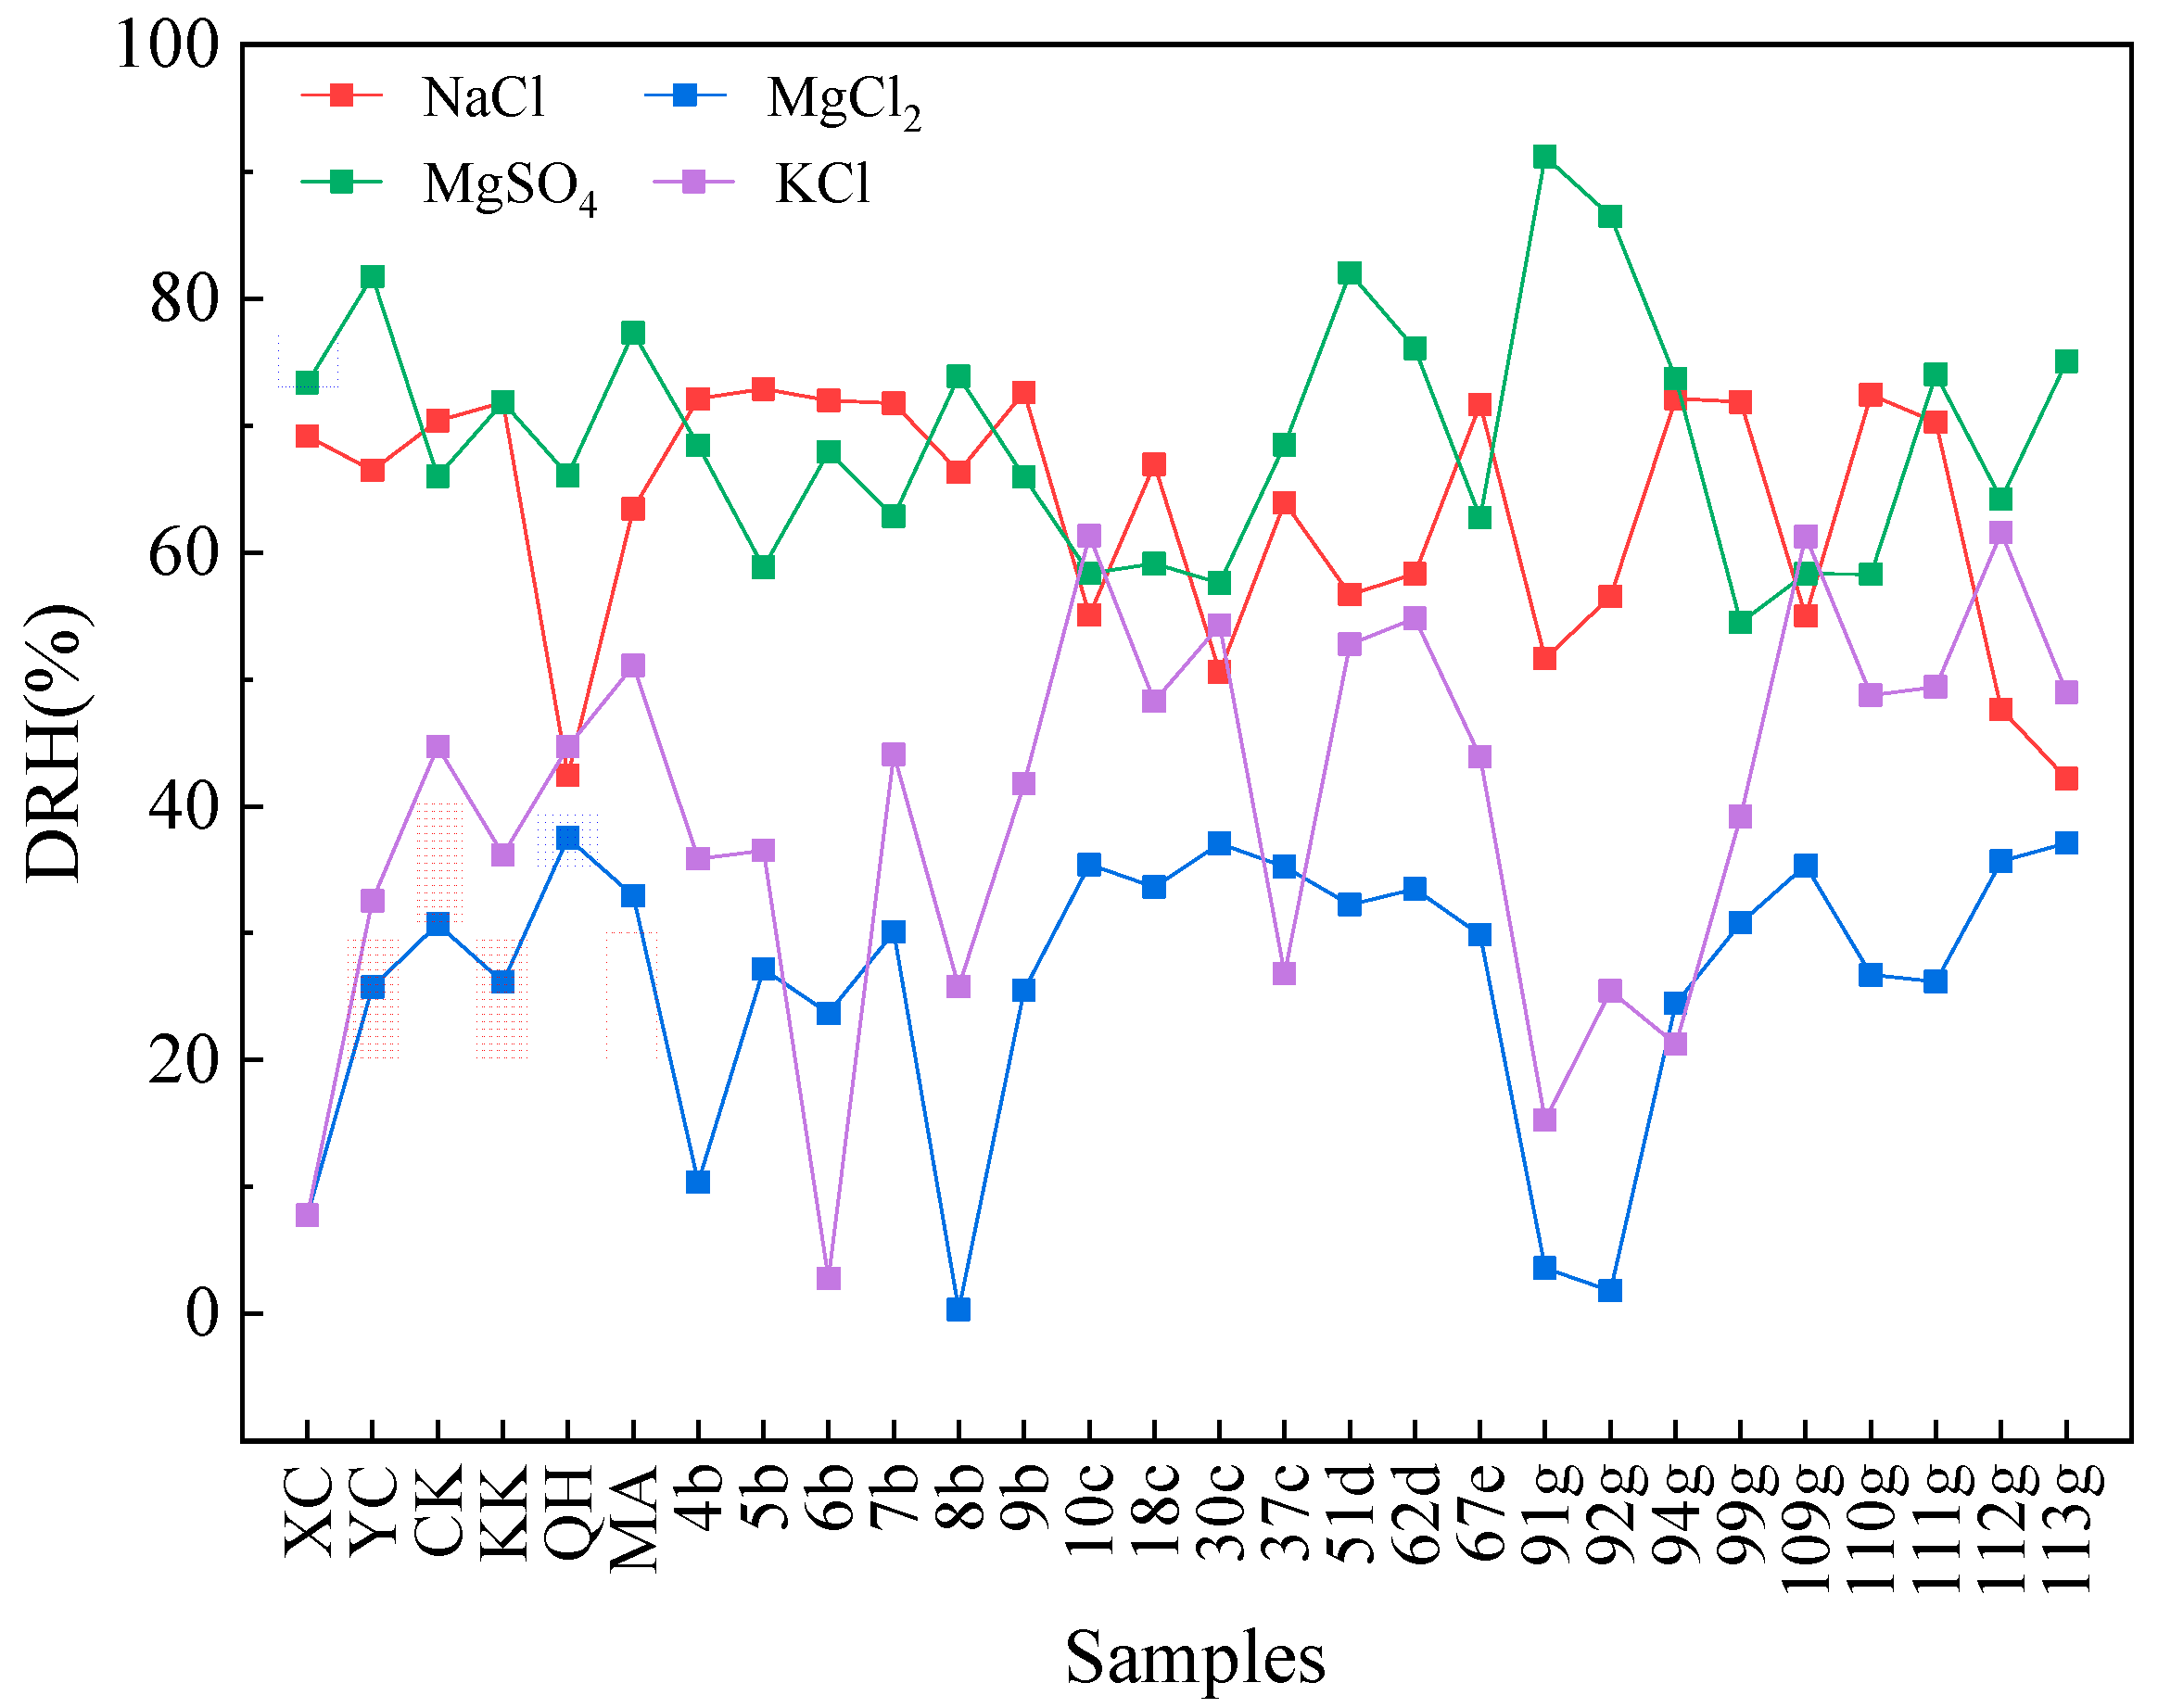
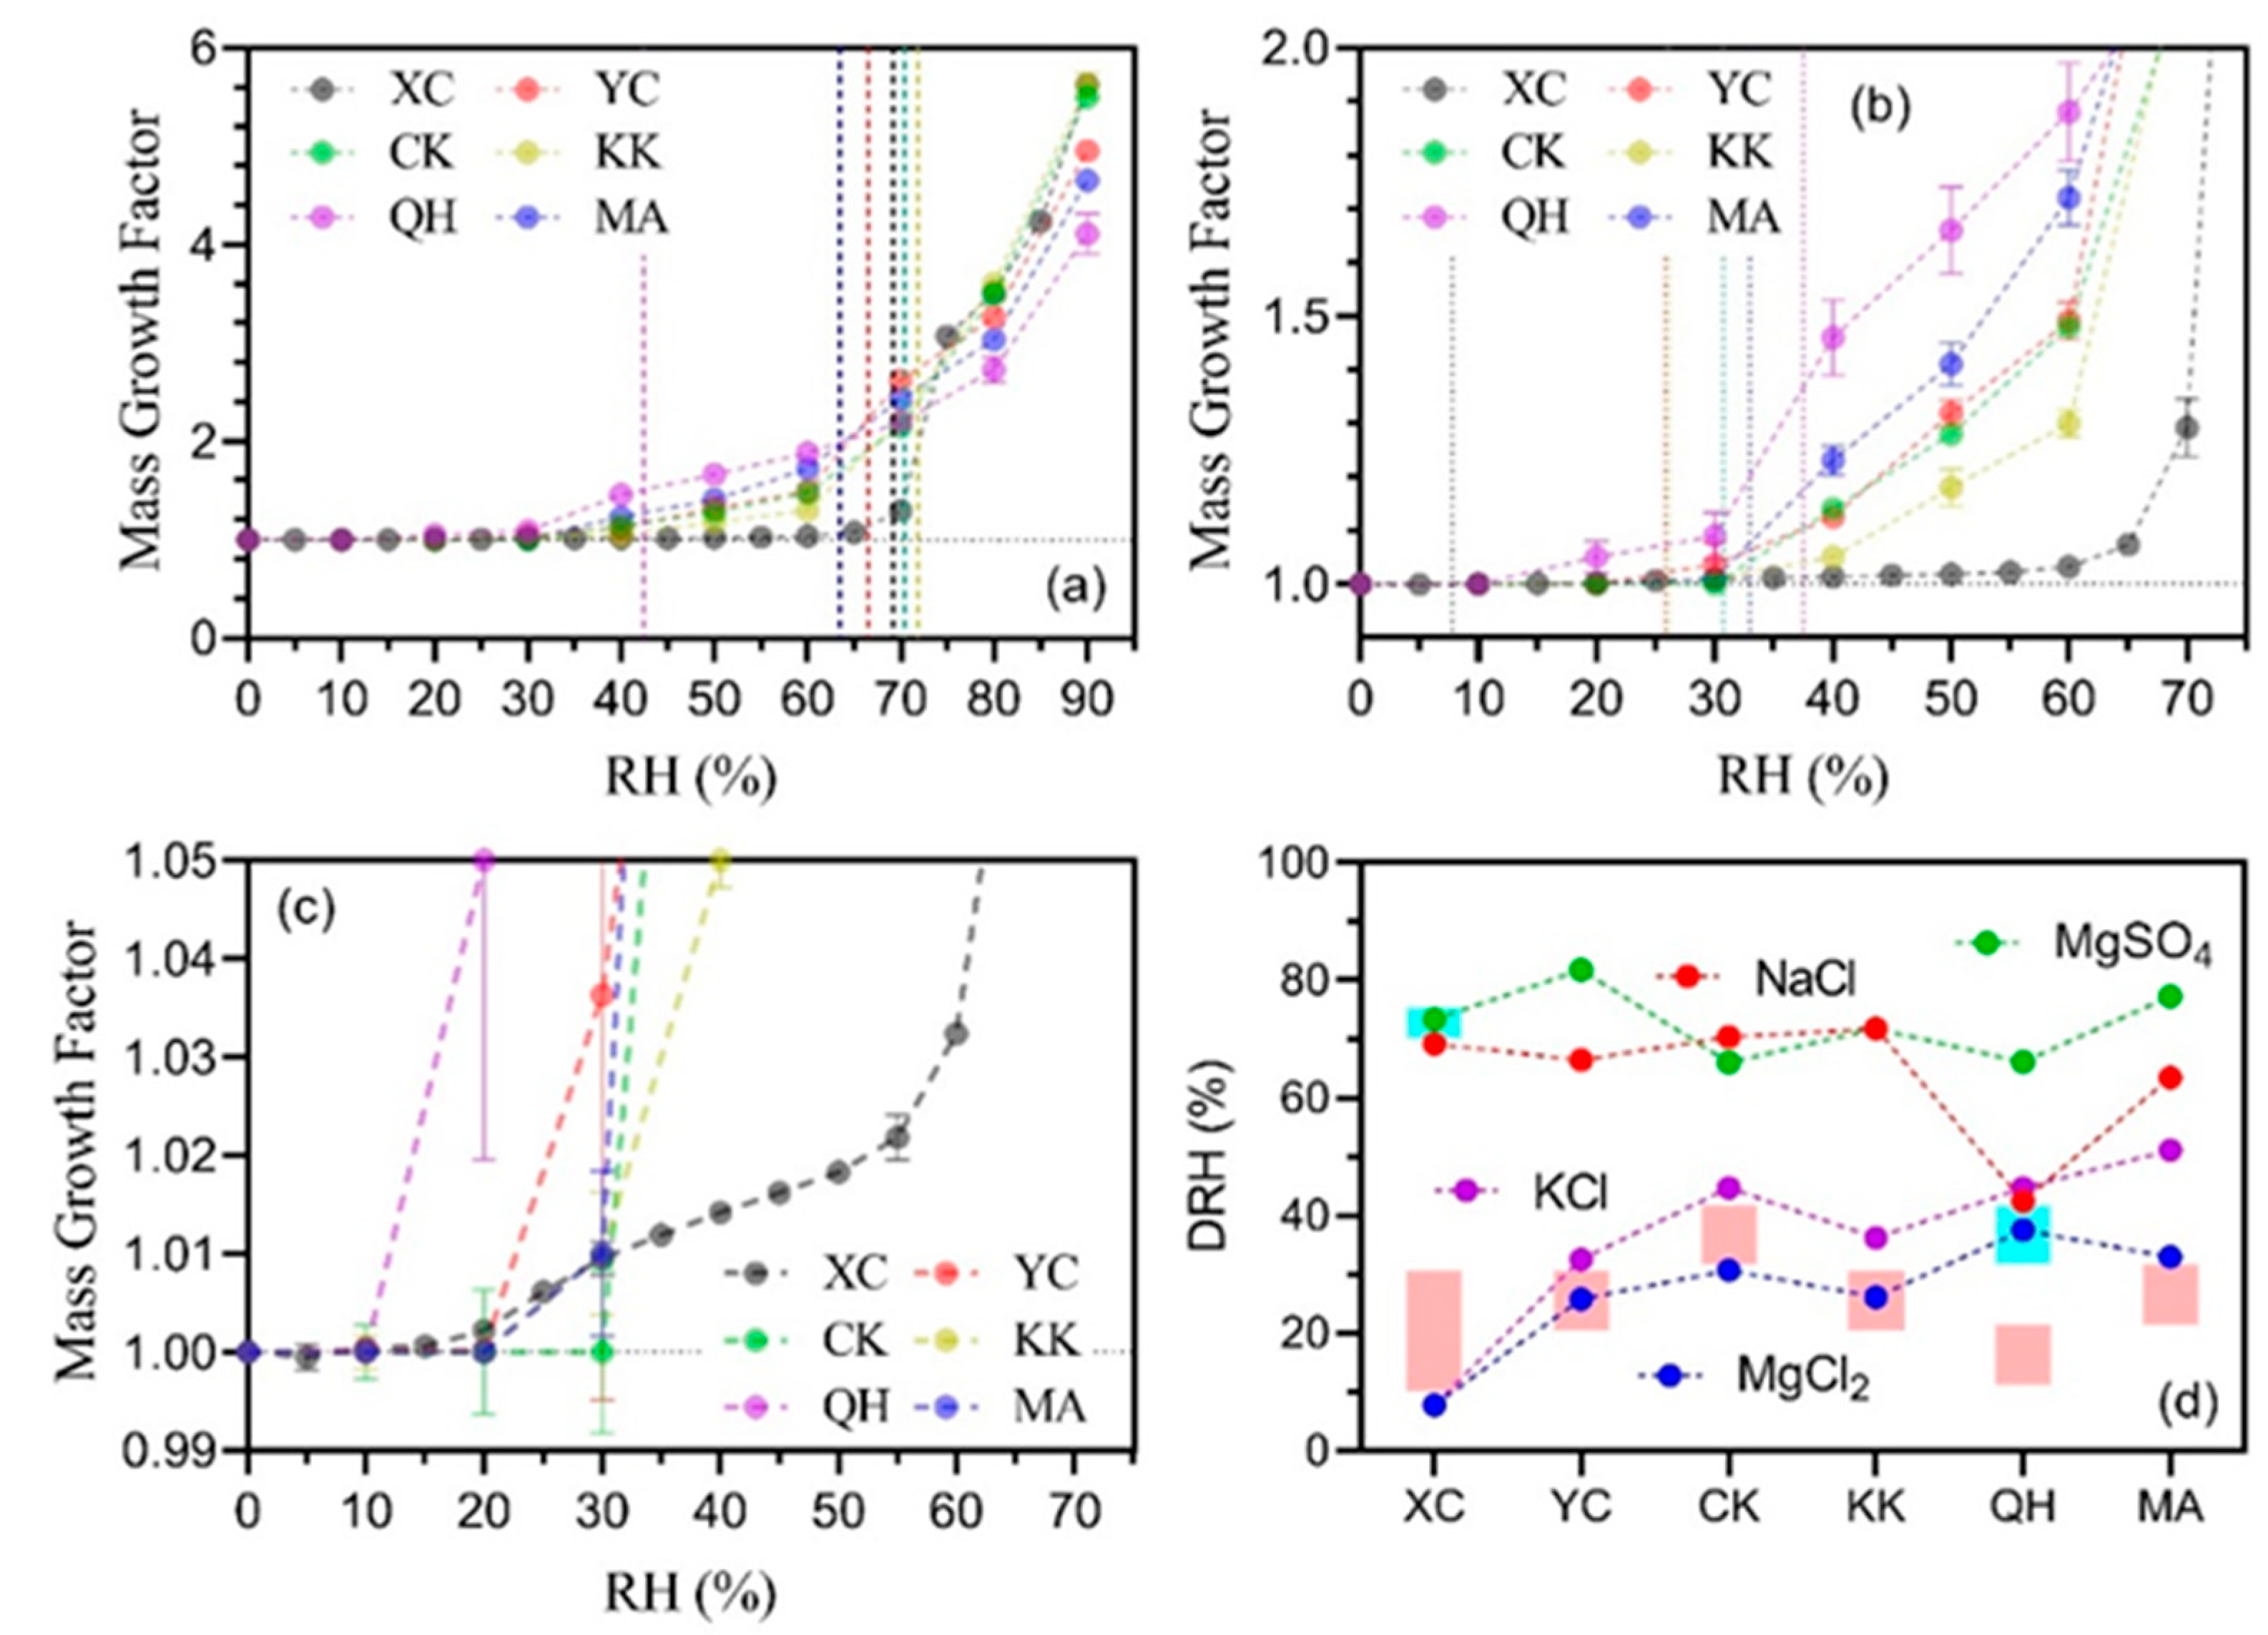
Figure 5 shows calculated DRHs of four common deliquescing salts (NaCl, MgCl2, KCl, MgSO4). Among the four components, MgCl2 in general has the lowest DRHs, i.e., the MgCl2 component most easily deliquesces. NaCl is a major component in most brines, thus its hygroscopic property strongly influences the behavior of the mixtures. MgSO4 has the highest DRH, but it is not an effective component as MgCl2 (easiest to deliquesce) and NaCl (very abundant). As for KCl, its hygroscopicity is influential in K-rich brines. Moreover, the abundance of K affects the hygroscopicity of other components. For example, in the QH sample, the high K content leads to a depressed DRHNaCl.
The red and blue squares in Figure 5 indicate the RH onsets for initial and significant water uptake that are experimentally observed, respectively. The experimental results of the six original samples are presented in Figure 6. Figure 6a–c show the growth factors as a function of RH, and Figure 6d shows the RH of water uptake onsets. In Figure 6a, the dashed lines indicate the theoretically predicted DRHsNaCl in the six samples. The dotted lines in Figure 6b are the calculated DRHsMgCl2. To visualize the initial mass change due to water update, Figure 6c zooms in on the y-axis. Identified initial water uptake onsets are indicated as red squares in Figure 6d (same as the red squares in Figure 5). Since mixtures have complicated components that result in complex water update behaviors, most of the samples show continuous mass increases along with the increasing RH. Nevertheless, the XC and QH samples present identifiable major water uptake onsets, which are indicated as blue squares in Figure 6d, the same as the blue squares in Figure 5.
As seen in Figure 6d, in most samples the initial water uptakes are comparable to the MgCl2 deliquescence onsets. However, the QH sample shows a large discrepancy between the experimental and theoretical results, where the initial water uptake is observed at 20%, which is considerably lower than the lowest calculated DRHMgCl2 at 37%. Note that the QH sample has an exceptionally high K level, which significantly lowers the DRHNaCl to 42% (DRH of pure NaCl ≈ 75%). The particularly complicated composition of the QH sample makes it very sensitive to ambient water vapor. Further, the heterogeneity of samples may be another potential reason for the derivation. Moreover, the major water uptake of the XC sample is also well described, which is largely determined by the NaCl component.
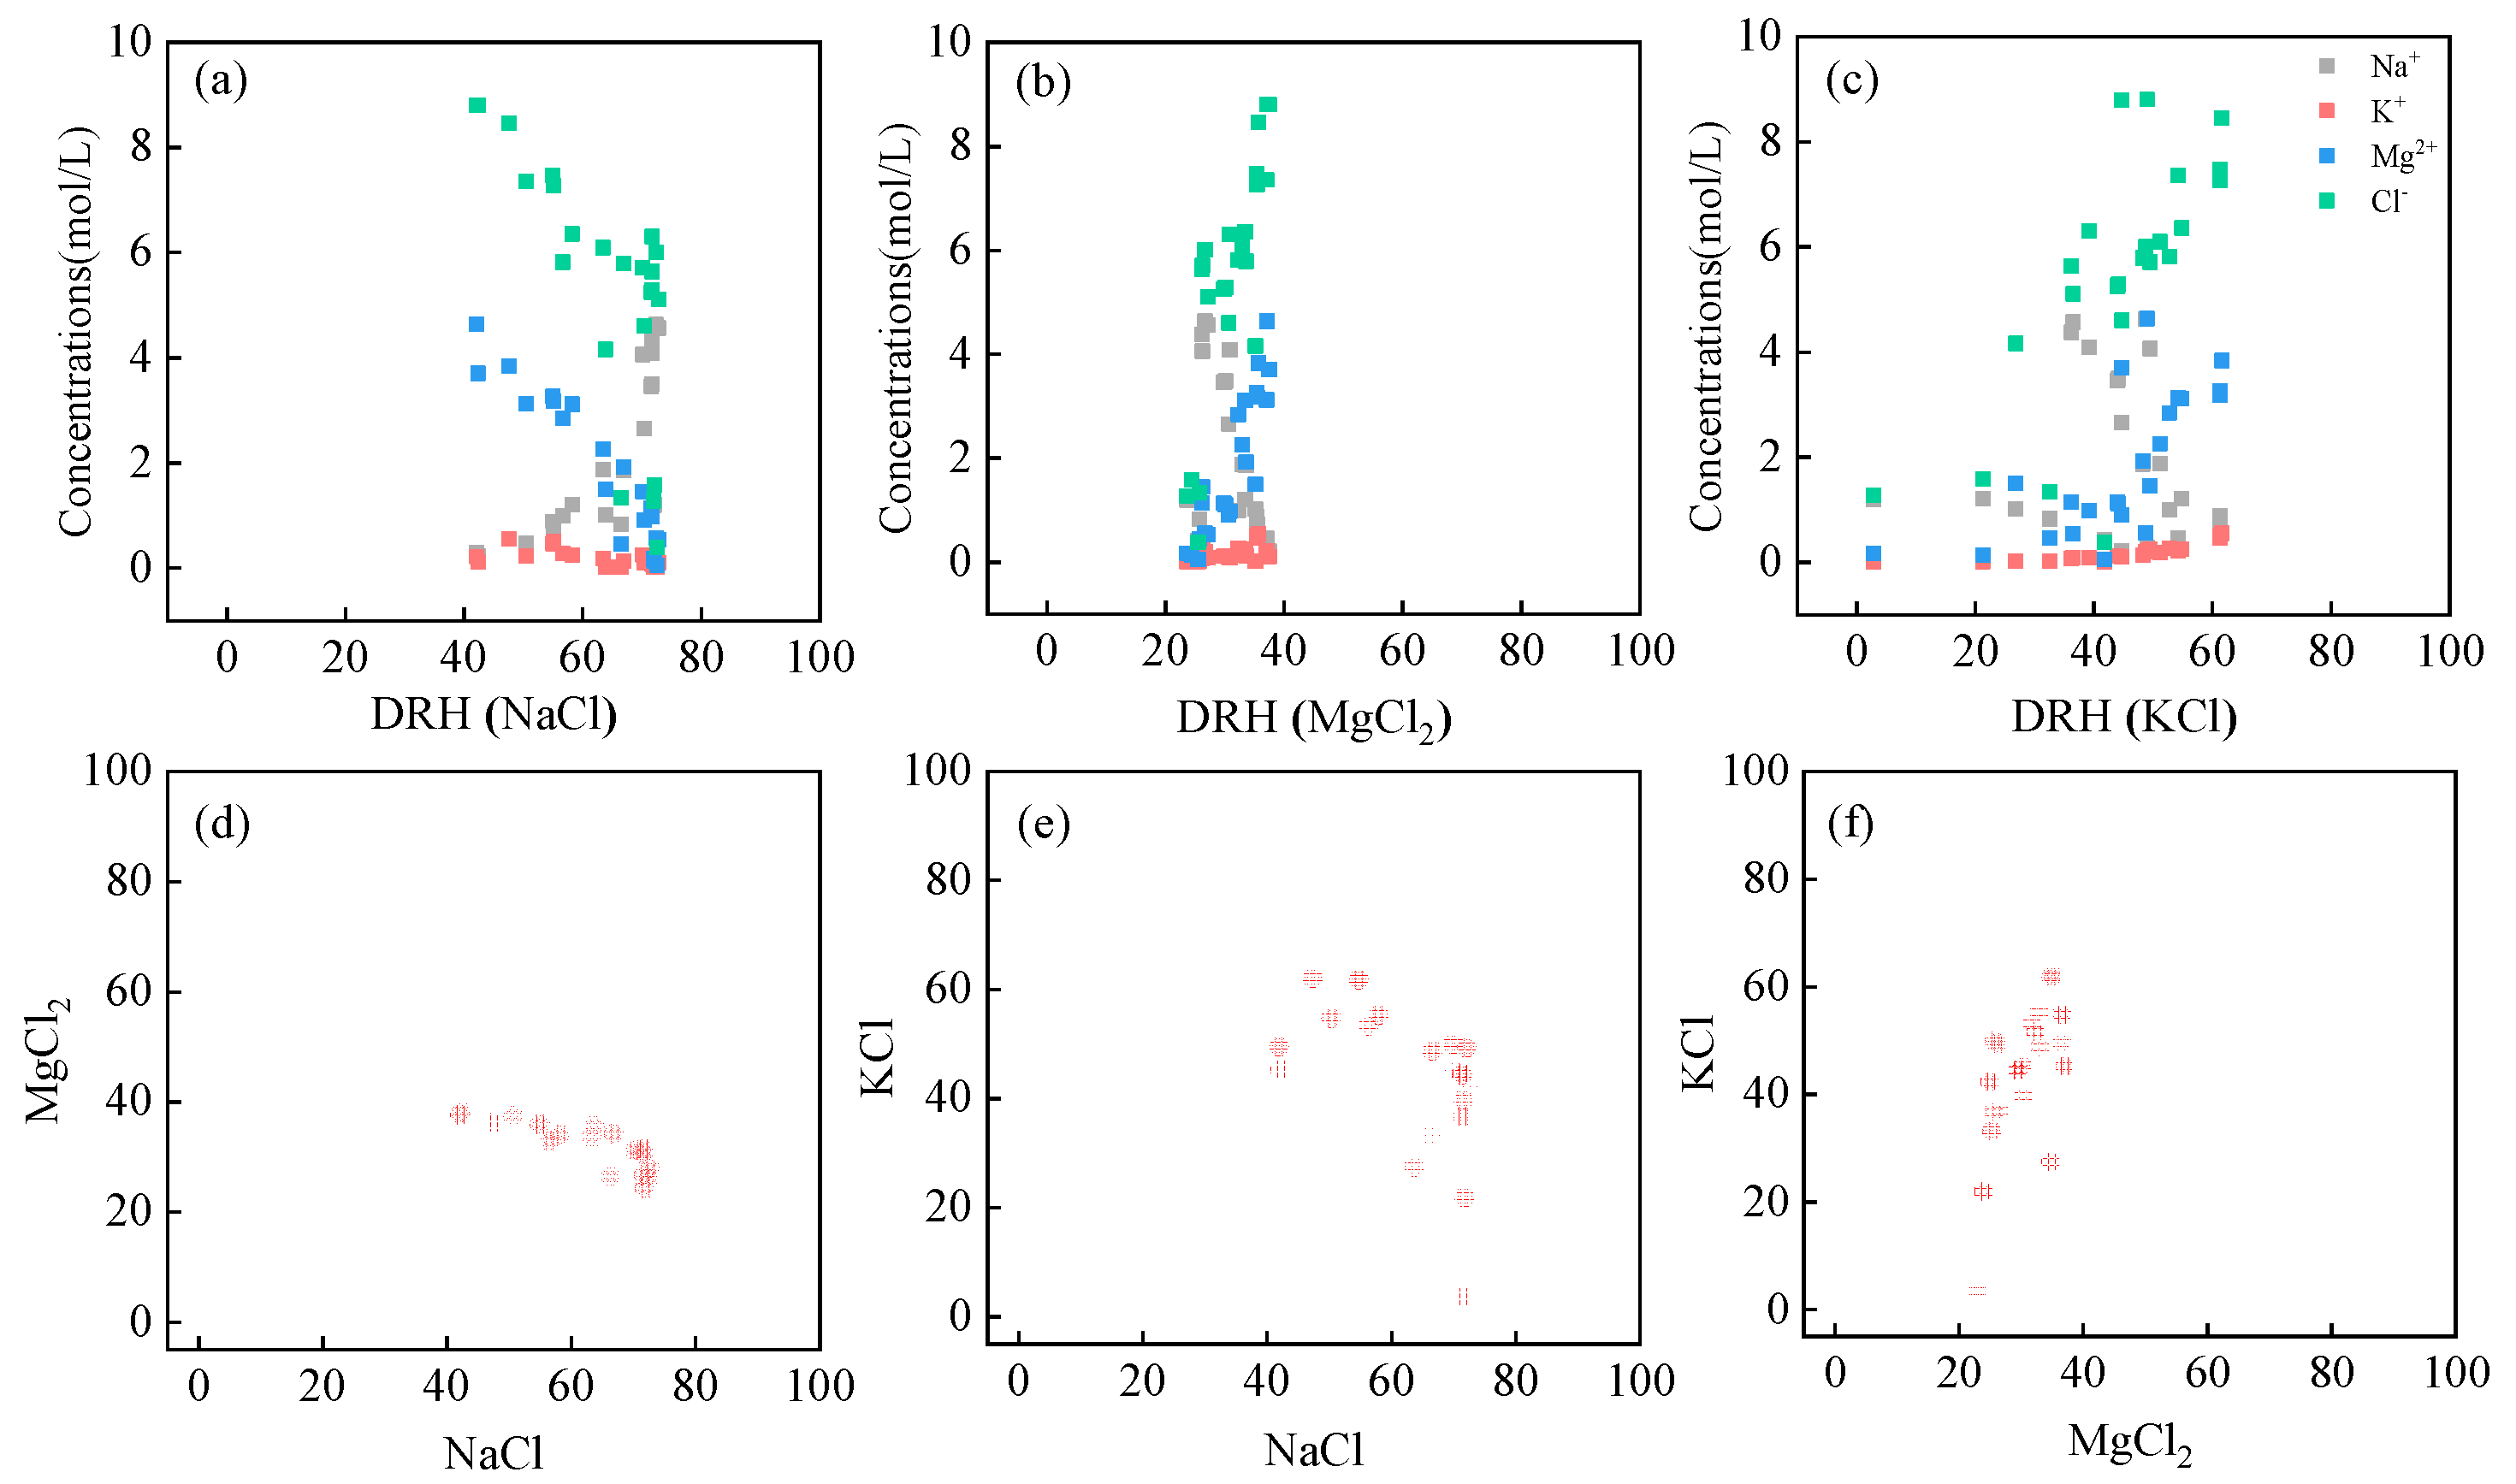
The DRHs of mixtures are complicated due to ionic interactions. To understand the relationships between ions and DRHs, Figure 7 plots the ionic concentrations against the predicted DRHs. Figure 7a shows that the DRHNaCl are positively correlated with Na+ but negatively correlated with Mg2+ and Cl−, i.e., the existence of Mg2+ lowers the DRHNaCl. The Cl− follows the Mg2+ trend as its counter-ion. In contrast, Figure 7b shows the opposite trends for MgCl2, which is negatively correlated with Na+ and positively associated with Mg2+ and Cl−. In another word, both DRHNaCl and DRHMgCl2 are lowered by the impurity cations (Mg2+ for NaCl; Na+ for MgCl2). As for KCl, the K+ concentrations are relatively low, and the DRHKCl is associated with Mg2+ and Cl− (Figure 7c), showing good coherence with DRHMgCl2. A complete correlation table between the DRHs and ion concentrations can be found in Table S3.
Figure 7d–f shows the correlations between the DRHs of three major salt components (NaCl, MgCl2 and MgSO4). The full correlation parameters can be found in Table S4. In Figure 7d, the DRHNaCl is widely distributed (between 40% to 75%), compared to MgCl2 that fluctuates between 20% to 40%. In addition, the DRH of these two components are negatively correlated, i.e., high DRHsNaCl are accompanied by low DRHsMgCl2. The KCl shows a generally positive correlation with MgCl2 (Figure 7f) and is negatively correlated with NaCl (Figure 7e).
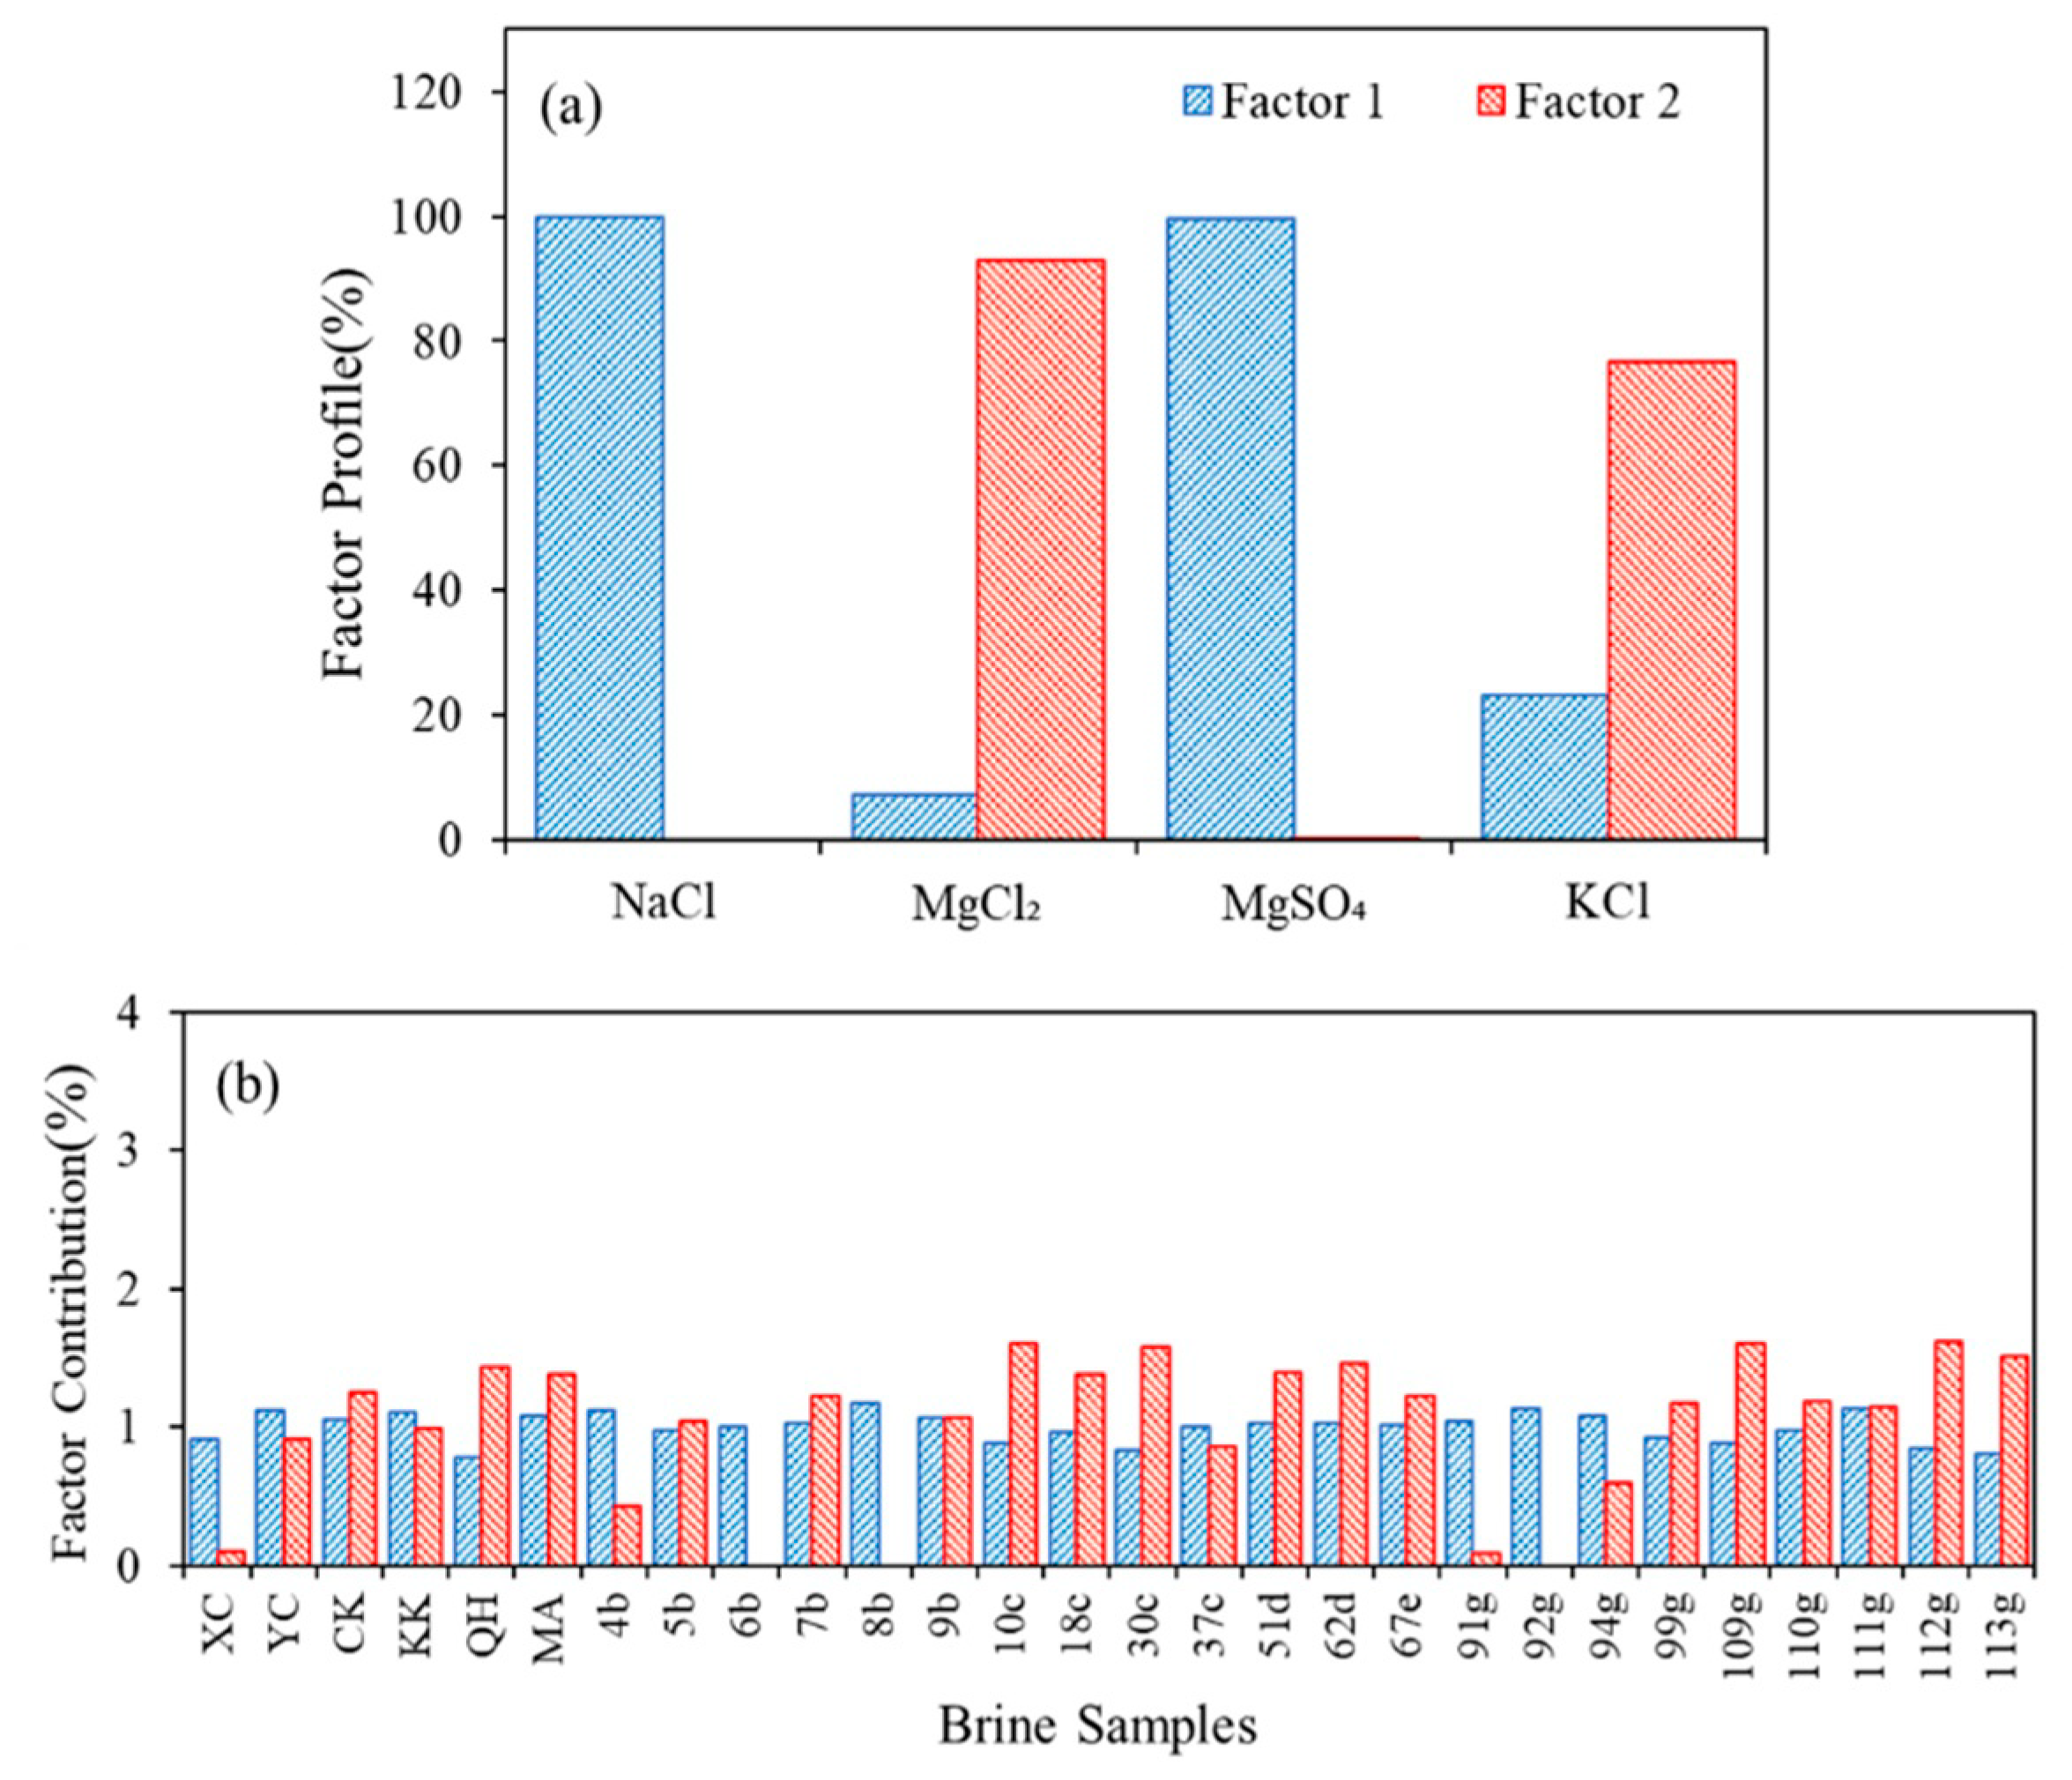
The DRH results are also analyzed by the PMF, where a 2-factor solution is converged, and the results are shown in Figure 8. Factor 1 is dominated by NaCl and MgSO4 and Factor 2 is characterized by MgCl2 and KCl. In Figure 8b, most samples show the co-existence of both factors, and only five samples are dominated by Factor 1. Comparing with the PMF analysis on ionic concentrations (previously presented in Figure 4), the current Factor 1 cases are the typical Factor 3 cases in Figure 4, i.e., of high SO42− and Na+ concentrations.
3.1.4. Aged Salt Aerosol Particles
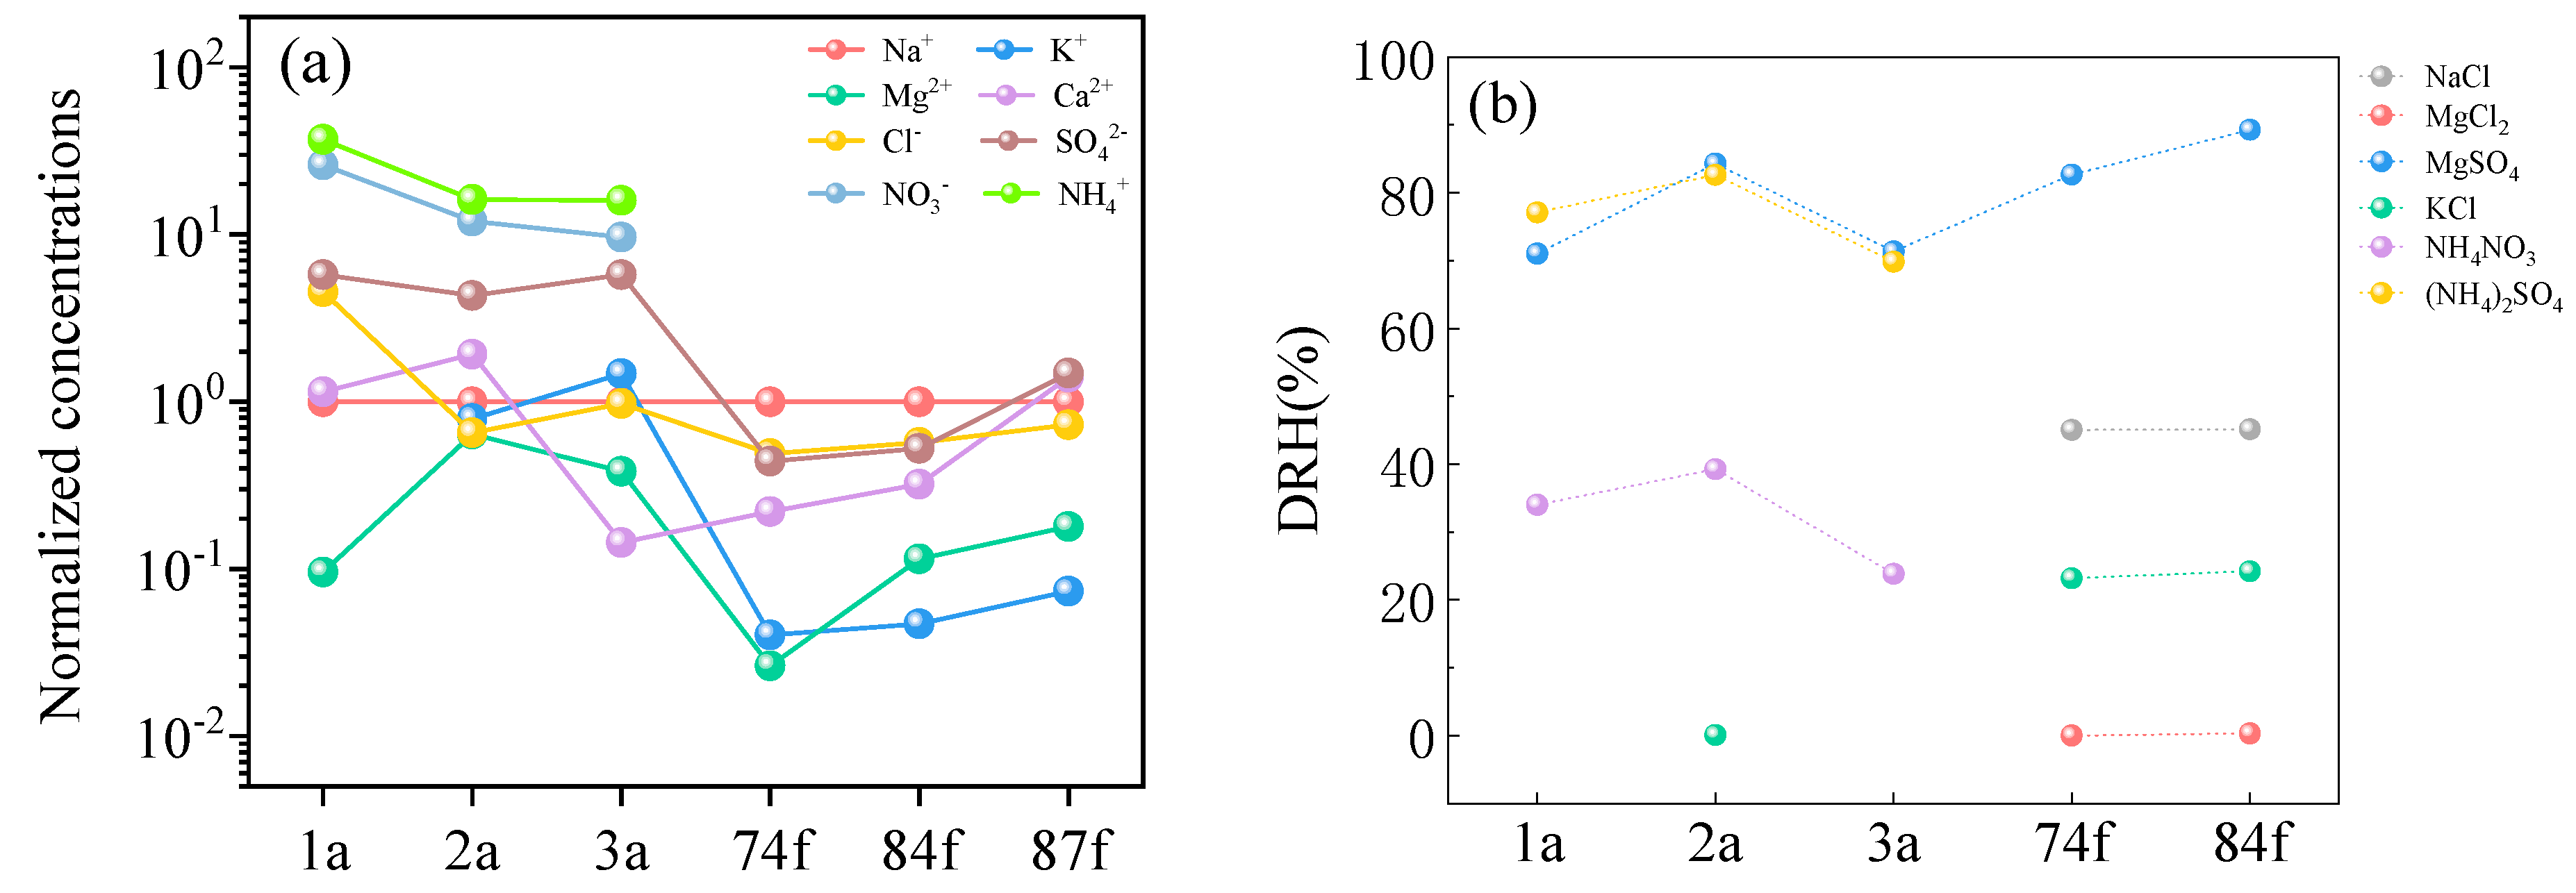
Salt aerosol particles undergo ageing along with the atmospheric transportation, which alters the chemical and hygroscopic properties of the salt particles. For example, the ageing of NaCl (fresh salt particles) can occur by reacting with nitrogen oxides and sulfur oxides in atmosphere to form Cl-depleted aged salt particles [49]. To shed light on the chemical evolution during ageing, we analyze two previously reported ionic concentrations of fresh and aged salt aerosol particles. Figure 9a shows the Na-normalized ionic concentrations of the two types of salt aerosol particles, i.e., long-range transported and aged aerosol (1a, 2a, 3a) [16], and fresh salt aerosol (74f, 84f, 87f) [6]. Compared to Na+, the aged salt aerosol particles contain high levels of NH4+, NO3− and SO42−, which are typical secondary inorganic aerosol components. On the other hand, the fresh salt aerosol has high Na+, Cl−, and Ca2+ fractions, which are common aerosol components found near playas and deserts.
Based on the ionic concentrations, the DRHs of the aged and fresh salt samples are calculated and shown in Figure 9b. The hygroscopicity of aged aerosol is dominated by the NH4NO3 component, while the fresh salt particles are regulated by MgCl2, like the brine samples. Ageing strongly alters the hygroscopic property of salt particles. Note that not all the salt components deliquesce in the aged cases, i.e., IAP never reaches IAPsat below 100% RH, e.g., MgCl2, NaCl, and KCl in the aged samples.
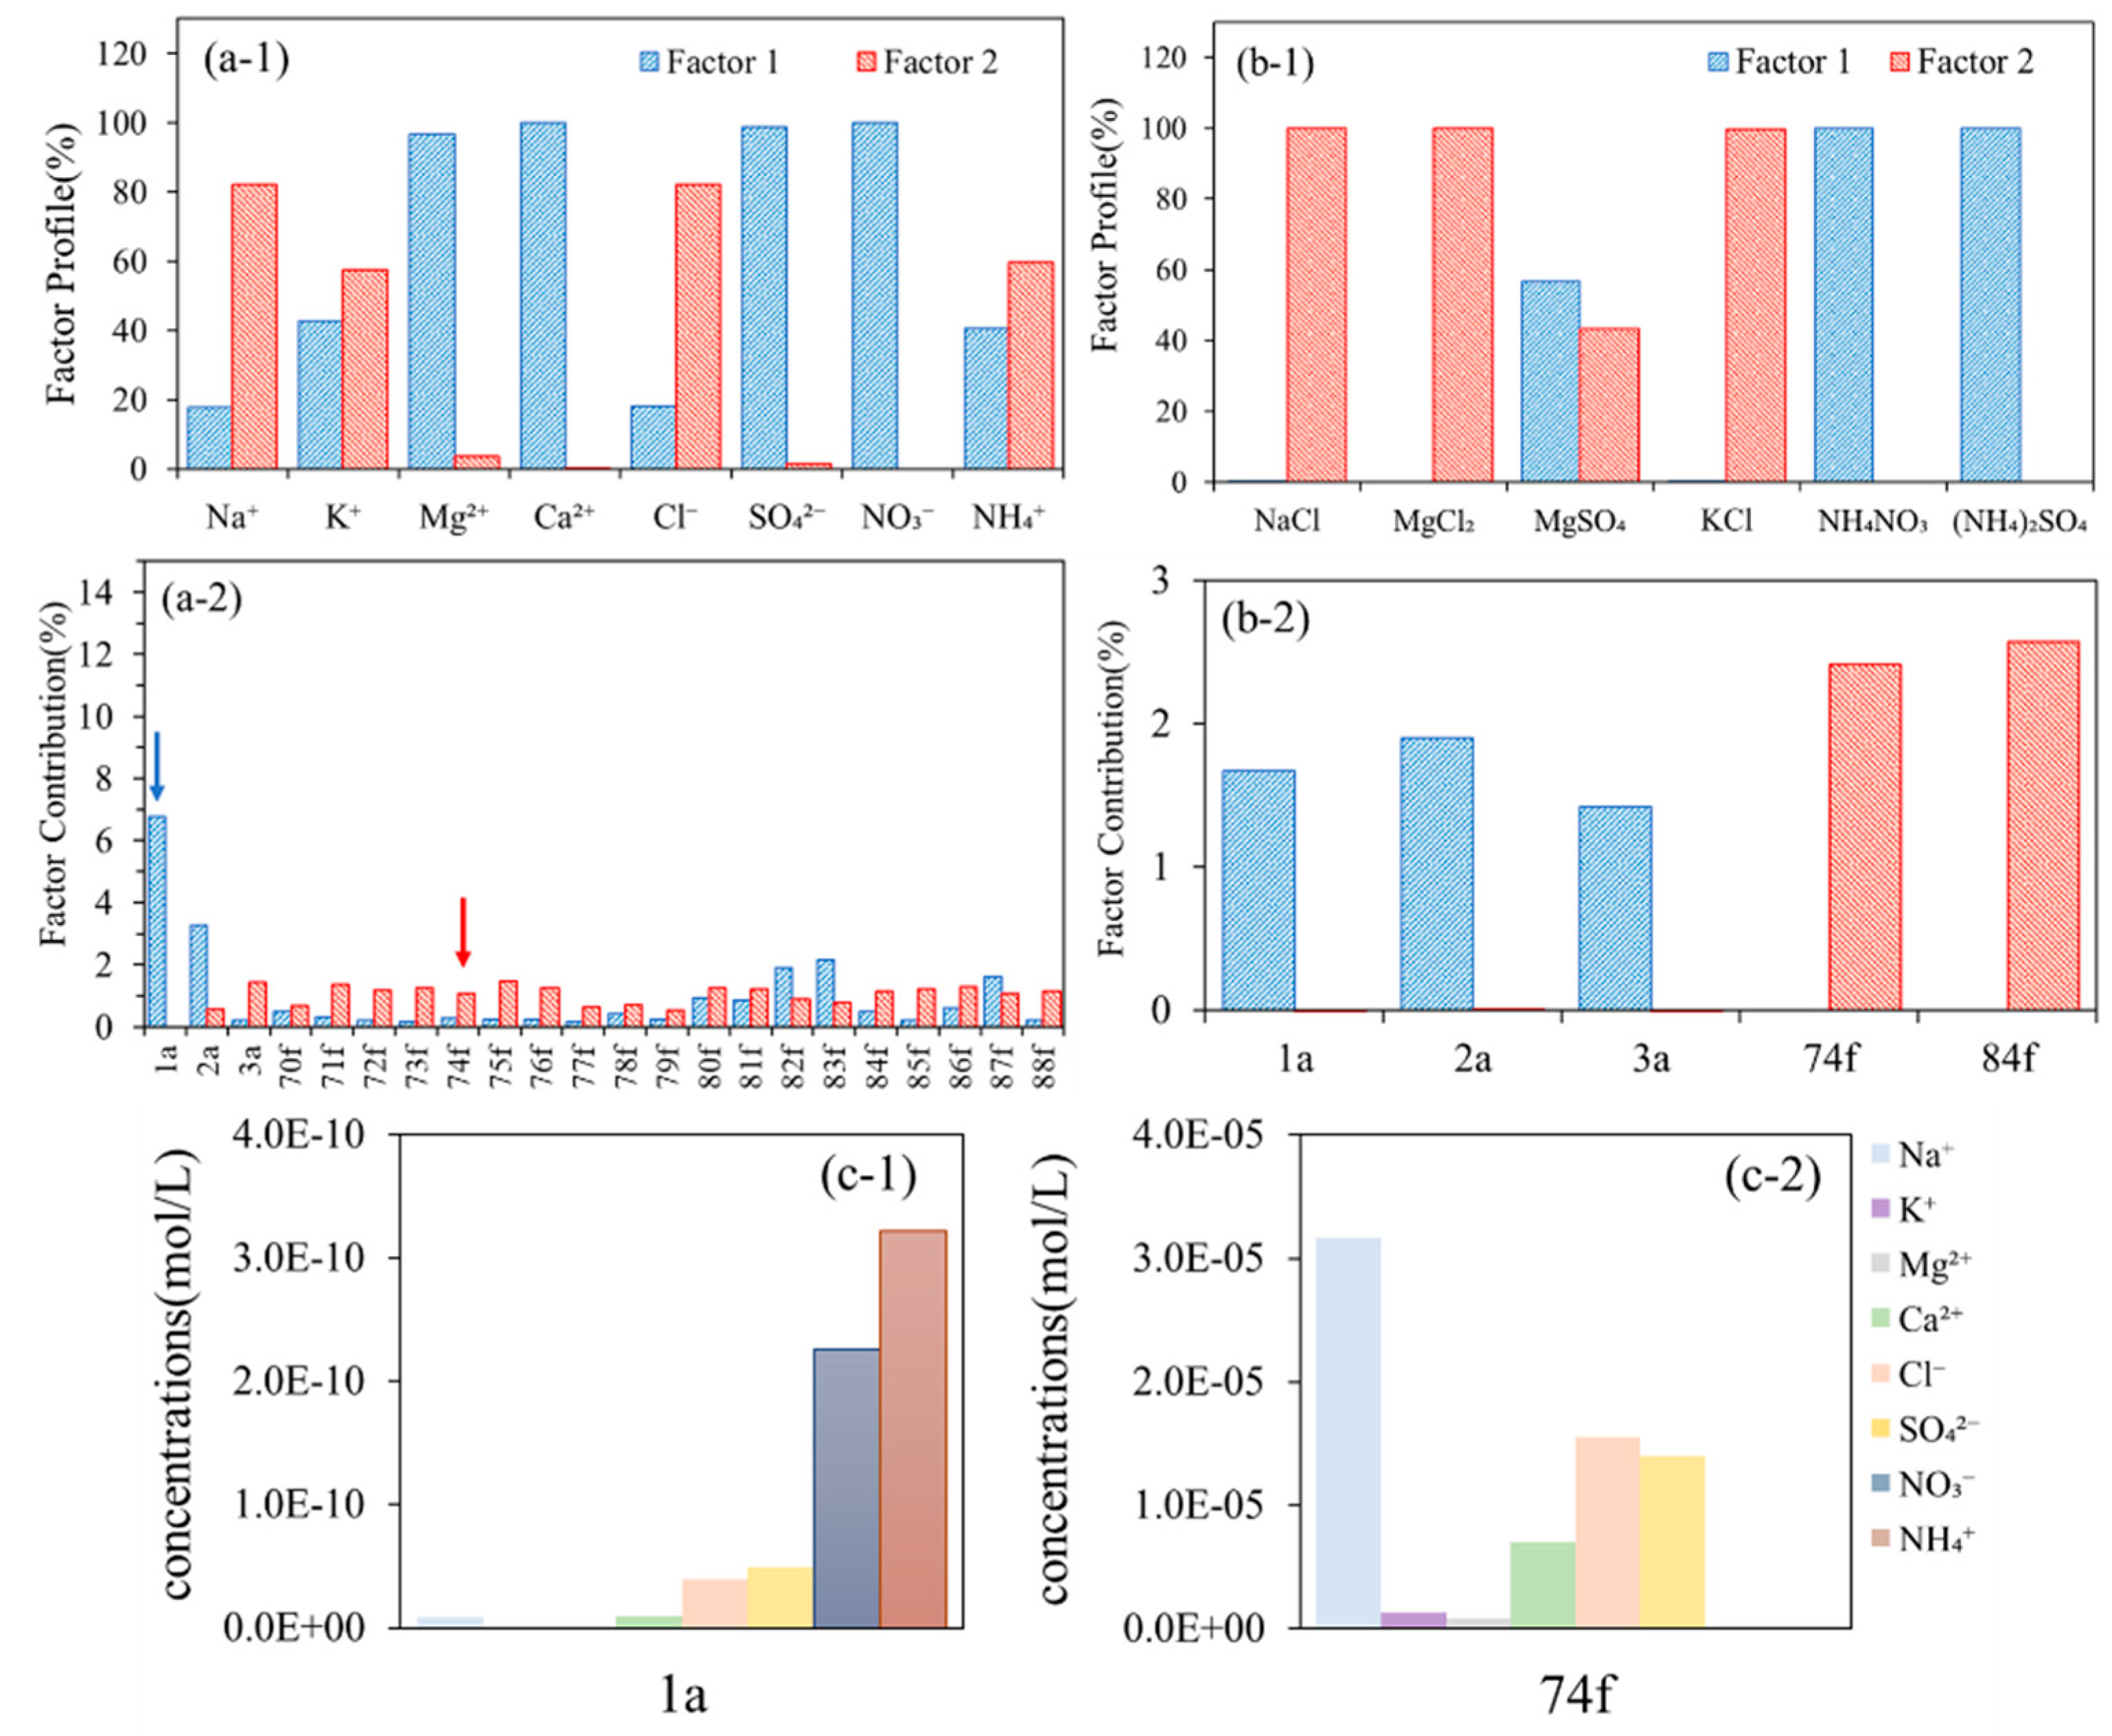
The PMF method is applied to the ionic concentrations and calculated DRHs of aerosol samples. Both datasets are resolved with 2-factor solutions, i.e., fresh and aged factors. Figure 10a-1 shows the factor profiles of ionic concentrations, where Mg2+, Ca2+, SO42− and NO3− are the dominating ions of Factor 1 (aged); Na+ and Cl− are the fingerprint ions for Factor 2 (fresh). Figure 10a-2 shows the factor contributions, which confirms that Factor 1 dominates the aged aerosol, especially 1a and 2a, and Factor 2 are important in the fresh aerosol (74f, 84f, 87f). Factor 10b shows the PMF results of calculated DRHs. Factor 1 is governed by secondary inorganic aerosol components and therefore dominates the aged samples. Factor 2 reflects the deliquescing components for fresh salt aerosol. Figure 10c shows the ionic compositions of 1a and 74f, which represent the aged and fresh aerosol factors, respectively.
4. Conclusions
In this study, we use experimental and model methods to evaluate the hygroscopic properties of saline lake brines, namely fresh and aged salt aerosol particles. The ionic compositions of the brines are measured by ion chromatography in this study. The comparison of ions measured in this study and taken from the literature shows that Na+ and Mg2+ are negatively correlated, and Mg2+ and Cl− are positively correlated. K+ shows significant associations with Mg2+ and Cl−, and a slight negative correlation with Na+. Hygroscopicity measurements were performed on the crystallized brines, and the experimental results are compared with theoretical DRH values from a thermodynamic model. The DRHs of four common deliquescing salts (NaCl, MgCl2, KCl, MgSO4) are presented. Among the four components, MgCl2 in general has the lowest DRHs, which determines the initial water uptake. NaCl is a major component in most brines, thus its hygroscopic property strongly influences the behavior of the mixtures. In addition, the presence of abundant K affects the hygroscopicity of other components, e.g., the high K content leads to a depressed DRHNaCl in the QH sample. The correlations between the DRHs and the correlation between DRHs and ionic concentrations are presented and discussed. Positive matrix factorization analysis is performed on the ionic concentrations data and the hygroscopicity results, and the solutions are interpreted and discussed. The fresh and aged salt aerosol particles are analyzed in the same way as the brines, and the comparison shows that the aged salt aerosol particles completely alter their hygroscopic property, i.e., transferring from MgCl2− governed to NH4NO3− governed.
Supplementary Materials
The following are available online at https://www.mdpi.com/article/10.3390/atmos12091203/s1, Figure S1a: AIOMFAC modelled IAPs as a function of RH (brine samples from Shan’xi and Qinghai). The horizontal dashed lines are DRH for individual salts in the corresponding salt mixture. The vertical dashed lines are the DRH found by the AIOMFAC model; Figure S1b: AIOMFAC modelled IAP as a function of RH (aerosol samples). The horizontal dashed lines are DRH for individual salts in the corresponding salt mixture. The vertical dashed lines are the DRH found by the AIOMFAC model; Figure S1c: AIOMFAC modelled IAP as a function of RH (brine samples). The horizontal dashed lines are DRH for individual salts in the corresponding salt mixture. The vertical dashed lines are the DRH found by the AIOMFAC model; Figure S1d: AIOMFAC modelled IAP as a function of RH (brine samples). The horizontal dashed lines are DRH for individual salts in the corresponding salt mixture. The vertical dashed lines are the DRH found by the AIOMFAC model; Table S1: Molar concentration (mol/l) of all samples; Table S2: DRH predicted by the AIOMFAC model; Table S3: Correlations of the DRH and ions in brine samples; Table S4: Correlations of the DRH value of four kinds of salts in brine samples.
Author Contributions
Conceptualization, X.K.; methodology, J.L., L.L. and X.K.; software, J.L. and L.L.; validation, J.L., W.L., L.L. and X.Z.; formal analysis J.L.; investigation J.L., W.L., L.L. and X.K.; resources, M.T., M.H. and X.K.; data curation, J.L., W.L., W.G. and L.L.; writing—original draft preparation, J.L., W.L., S.W. and X.K.; writing—review and editing, J.L., W.L., S.W. and X.K.; visualization, J.L. and X.K.; supervision, L.L., S.W., M.H. and X.K.; project administration, S.W. and X.K.; funding acquisition, X.Z., M.H. and X.K. All authors have read and agreed to the published version of the manuscript.
Funding
This research was funded by the National Natural Science Foundation of China (Grant No. 41975160) and the Science and Technology Plan Project of Qinghai Province (Grant No. 2021-ZJ-T07). The APC was funded by the National Natural Science Foundation of China (Grant No. 41975160).
Institutional Review Board Statement
Not applicable.
Informed Consent Statement
Not applicable.
Data Availability Statement
All data produced in this study are presented in this publication.
Acknowledgments
L.L. and M.H. acknowledge the Strategic Area MERGE (ModElling the Regional and Global Earth system).
Conflicts of Interest
The authors declare no conflict of interest.
References
- Chen, Y.; Li, J.; Lee, W.; Diner, D.J.; Garay, M.J.; Jiang, J.; Wang, Y.; Yu, J.; Kalashnikova, O.V. Evaluation of sea salt aerosols in climate systems: Global climate modeling and observation-based analyses. Environ. Res. Lett. 2020, 15, 034047. [Google Scholar] [CrossRef]
- Abbatt, J.P.; Benz, S.; Cziczo, D.J.; Kanji, Z.; Lohmann, U.; Mohler, O. Solid ammonium sulfate aerosols as ice nuclei: A pathway for cirrus cloud formation. Science 2006, 313, 1770–1773. [Google Scholar] [CrossRef] [PubMed] [Green Version]
- Cziczo, D.J.; Froyd, K.D.; Hoose, C.; Jensen, E.J.; Diao, M.; Zondlo, M.A.; Smith, J.B.; Twohy, C.H.; Murphy, D.M. Clarifying the dominant sources and mechanisms of cirrus cloud formation. Science 2013, 340, 1320–1324. [Google Scholar] [CrossRef] [PubMed] [Green Version]
- Hoose, C.; Möhler, O. Heterogeneous ice nucleation on atmospheric aerosols: A review of results from laboratory experiments. Atmos. Chem. Phys. 2012, 12, 9817–9854. [Google Scholar] [CrossRef] [Green Version]
- Grythe, H.; Ström, J.; Krejci, R.; Quinn, P.; Stohl, A. A review of sea-spray aerosol source functions using a large global set of sea salt aerosol concentration measurements. Atmos. Chem. Phys. 2014, 14, 1277–1297. [Google Scholar] [CrossRef] [Green Version]
- Wang, X.; Hua, T.; Zhang, C.; Lang, L.; Wang, H. Aeolian salts in Gobi deserts of the western region of Inner Mongolia: Gone with the dust aerosols. Atmos. Res. 2012, 118, 1–9. [Google Scholar] [CrossRef]
- Chen, J.; Li, C.; Ristovski, Z.; Milic, A.; Gu, Y.; Islam, M.S.; Wang, S.; Hao, J.; Zhang, H.; He, C.; et al. A review of biomass burning: Emissions and impacts on air quality, health and climate in China. Sci. Total Environ. 2017, 579, 1000–1034. [Google Scholar] [CrossRef] [Green Version]
- Wang, X.; Hua, T.; Zhang, C.; Qian, G.; Luo, W. Salts in the clay playas of China’s arid regions: Gone with the wind. Environ. Earth Sci. 2012, 68, 623–631. [Google Scholar] [CrossRef]
- Gill, T.E. Eolian sediments generated by anthropogenic disturbance of playas: Human impacts on the geomorphic system and geomorphic impacts on the human system. Geomorphology 1996, 17, 207–228. [Google Scholar] [CrossRef]
- Formenti, P. Chemical composition of mineral dust aerosol during the Saharan Dust Experiment (SHADE) airborne campaign in the Cape Verde region, September 2000. J. Geophys. Res. 2003, 108, D18:3–1–D18:3–17. [Google Scholar] [CrossRef] [Green Version]
- Zhang, X.; Zhuang, G.; Yuan, H.; Rahn, K.A.; Wang, Z.; An, Z. Aerosol particles from dried salt-lakes and saline soils carried on dust storms over Beijing. Terr. Atmos. Ocean. Sci. 2009, 20, 619–628. [Google Scholar] [CrossRef] [Green Version]
- Abuduwaili, J.; Gabchenko, M.V.; Junrong, X. Eolian transport of salts—A case study in the area of Lake Ebinur (Xinjiang, Northwest China). J. Arid. Environ. 2008, 72, 1843–1852. [Google Scholar] [CrossRef]
- Prospero, J.M. Environmental characterization of global sources of atmospheric soil dust identified with the NIMBUS 7 Total Ozone Mapping Spectrometer (TOMS) absorbing aerosol product. Rev. Geophys. 2002, 40, 1–2. [Google Scholar] [CrossRef]
- Gaston, C.J.; Pratt, K.A.; Suski, K.J.; May, N.W.; Gill, T.E.; Prather, K.A. Laboratory studies of the cloud droplet activation properties and corresponding chemistry of saline playa dust. Environ. Sci. Technol. 2017, 51, 1348–1356. [Google Scholar] [CrossRef] [Green Version]
- Pratt, K.A.; Twohy, C.H.; Murphy, S.M.; Moffet, R.C.; Heymsfield, A.J.; Gaston, C.J.; DeMott, P.J.; Field, P.R.; Henn, T.R.; Rogers, D.C.; et al. Observation of playa salts as nuclei in orographic wave clouds. J. Geophys. Res. 2010, 115, D15301:1–D15301:17. [Google Scholar] [CrossRef] [Green Version]
- Wu, C.; Zhang, S.; Wang, G.; Lv, S.; Li, D.; Liu, L.; Li, J.; Liu, S.; Du, W.; Meng, J.; et al. Efficient heterogeneous formation of ammonium nitrate on the saline mineral particle surface in the atmosphere of East Asia during dust storm periods. Environ. Sci. Technol. 2020, 54, 15622–15630. [Google Scholar] [CrossRef]
- Wang, G.; Cheng, C.; Huang, Y.; Tao, J.; Ren, Y.; Wu, F.; Meng, J.; Li, J.; Cheng, Y.; Cao, J.; et al. Evolution of aerosol chemistry in Xi’an, inland China, during the dust storm period of 2013—Part 1: Sources, chemical forms and formation mechanisms of nitrate and sulfate. Atmos. Chem. Phys. 2014, 14, 11571–11585. [Google Scholar] [CrossRef] [Green Version]
- Ramanathan, V.; Crutzen, P.J.; Kiehl, J.T.; Rosenfeld, D. Aerosols, climate, and the hydrological cycle. Science 2001, 294, 2119–2124. [Google Scholar] [CrossRef] [Green Version]
- Lai, H.; Chen, H.; Kukulies, J.; Ou, T.; Chen, D. Regionalization of seasonal precipitation over the Tibetan Plateau and associated large-scale atmospheric systems. J. Clim. 2021, 34, 2635–2651. [Google Scholar] [CrossRef]
- Xu, W.; Kuang, Y.; Liang, L.; He, Y.; Cheng, H.; Bian, Y.; Tao, J.; Zhang, G.; Zhao, P.; Ma, N.; et al. Dust-dominated coarse particles as a medium for rapid secondary organic and inorganic aerosol formation in highly polluted air. Environ. Sci. Technol. 2020, 54, 15710–15721. [Google Scholar] [CrossRef]
- Mitroo, D.; Gill, T.E.; Haas, S.; Pratt, K.A.; Gaston, C.J. ClNO2 Production from N2O5 uptake on saline playa dusts: New insights into potential inland sources of ClNO2. Environ. Sci. Technol. 2019, 53, 7442–7452. [Google Scholar] [CrossRef]
- Tang, M.; Zhang, H.; Gu, W.; Gao, J.; Jian, X.; Shi, G.; Zhu, B.; Xie, L.; Guo, L.; Gao, X.; et al. Hygroscopic properties of saline mineral dust from different regions in China: Geographical variations, compositional dependence, and atmospheric implications. J. Geophys. Res. Atmos. 2019, 124, 10844–10857. [Google Scholar] [CrossRef]
- Liu, W.; Li, J.; Gu, W.; Santos, L.F.E.D.; Boman, J.; Zhang, X.; Tang, M.; Wang, S.; Kong, X. Chemical and hygroscopic characterization of surface salts in the Qaidam Basin: Implications for climate impacts on Planet Earth and Mars. ACS Earth Space Chem. 2021, 5, 651–662. [Google Scholar] [CrossRef]
- Tobo, Y.; Zhang, D.; Matsuki, A.; Iwasaka, Y. Asian dust particles converted into aqueous droplets under remote marine atmospheric conditions. Proc. Natl. Acad. Sci. USA 2010, 107, 17905–17910. [Google Scholar] [CrossRef] [PubMed] [Green Version]
- Laskin, A.; Iedema, M.J.; Ichkovich, A.; Graber, E.R.; Taraniuk, I.; Rudich, Y. Direct observation of completely processed calcium carbonate dust particles. Faraday Discuss. 2005, 130, 453–468. [Google Scholar] [CrossRef] [PubMed]
- Tang, M.; Cziczo, D.J.; Grassian, V.H. Interactions of water with mineral dust aerosol: Water adsorption, hygroscopicity, cloud condensation, and ice nucleation. Chem. Rev. 2016, 116, 4205–4259. [Google Scholar] [CrossRef] [PubMed] [Green Version]
- Chen, D. Impact of climate change on sensitive marine and extreme terrestrial ecosystems: Recent progresses and future challenges: This article belongs to Ambio’s 50th Anniversary Collection. Theme: Climate change impact. Ambio 2021, 50, 1141–1144. [Google Scholar] [CrossRef] [PubMed]
- Zhang, M.; Liu, X. Climate changes in the Qaidam Basin in NW China over the past 40 kyr. Palaeogeogr. Palaeocl. 2020, 551, 109679. [Google Scholar] [CrossRef]
- Frie, A.L.; Dingle, J.H.; Ying, S.C.; Bahreini, R. The effect of a receding saline lake (the Salton Sea) on airborne particulate matter composition. Environ. Sci. Technol. 2017, 51, 8283–8292. [Google Scholar] [CrossRef] [PubMed]
- Peckham, S.; Grell, G.A.; McKeen, S.A.; Barth, M.; Pfister, G.; Wiedinmyer, C.; Fast, J.D.; Gustafson, W.I.; Zaveri, R.; Easter, R.C.; et al. WRF-Chem Version 3.3 User’s Guide; NOAA Technical Memo: Boulder, CO, USA, 2011; p. 99.
- Li, C.; Gao, X.; Liu, Y.; Wang, Y. Impact of anthropogenic activities on the enrichment of fluoride and salinity in groundwater in the Yuncheng Basin constrained by Cl/Br ratio, δ18O, δ2H, δ13C and δ7Li isotopes. J. Hydrol. 2019, 579, 124211. [Google Scholar] [CrossRef]
- Li, C.; Gao, X. Assessment of groundwater quality at Yuncheng Basin: Denotation for the water management in China. Ground Water 2019, 57, 492–503. [Google Scholar] [CrossRef]
- Gao, X.; Wang, Y.; Li, Y.; Guo, Q. Enrichment of fluoride in groundwater under the impact of saline water intrusion at the salt lake area of Yuncheng Basin, northern China. Environ. Geol. 2007, 53, 795–803. [Google Scholar] [CrossRef]
- Kezao, C.; Bowler, J.M. Late Pleistocene evolution of salt lakes in the Qaidam Basin, Qinghai province, China. Palaeogeogr. Palaeocl. 1986, 54, 87–104. [Google Scholar] [CrossRef]
- Li, C.; Dong, Z.; Cui, X.; Bao, F. Pattern analysis of simple transverse dunes in China’s Qaidam Basin, north of the Kunlun Mountains. Environ. Earth. Sci. 2016, 75, 729. [Google Scholar] [CrossRef]
- Tang, M.; Gu, W.; Ma, Q.; Li, Y.; Zhong, C.; Li, S.; Yin, X.; Huang, R.; He, H.; Wang, X. Water adsorption and hygroscopic growth of six anemophilous pollen species: The effect of temperature. Atmos. Chem. Phys. 2019, 19, 2247–2258. [Google Scholar] [CrossRef] [Green Version]
- Guo, L.; Gu, W.; Peng, C.; Wang, W.; Li, Y.; Zong, T.; Tang, Y.; Wu, Z.; Lin, Q.; Ge, M.; et al. A comprehensive study of hygroscopic properties of calcium- and magnesium-containing salts: Implication for hygroscopicity of mineral dust and sea salt aerosols. Atmos. Chem. Phys. 2019, 19, 2115–2133. [Google Scholar] [CrossRef] [Green Version]
- Gu, W.; Li, Y.; Zhu, J.; Jia, X.; Lin, Q.; Zhang, G.; Ding, X.; Song, W.; Bi, X.; Wang, X.; et al. Investigation of water adsorption and hygroscopicity of atmospherically relevant particles using a commercial vapor sorption analyzer. Atmos. Meas. Tech. 2017, 10, 3821–3832. [Google Scholar] [CrossRef] [Green Version]
- Zuend, A.; Marcolli, C.; Booth, A.M.; Lienhard, D.M.; Soonsin, V.; Krieger, U.K.; Topping, D.O.; McFiggans, G.; Peter, T.; Seinfeld, J.H. New and extended parameterization of the thermodynamic model AIOMFAC: Calculation of activity coefficients for organic-inorganic mixtures containing carboxyl, hydroxyl, carbonyl, ether, ester, alkenyl, alkyl, and aromatic functional groups. Atmos. Chem. Phys. 2011, 11, 9155–9206. [Google Scholar] [CrossRef] [Green Version]
- Zuend, A.; Marcolli, C.; Luo, B.P.; Peter, T. A thermodynamic model of mixed organic-inorganic aerosols to predict activity coefficients. Atmos. Chem. Phys. 2008, 8, 4559–4593. [Google Scholar] [CrossRef] [Green Version]
- Norris, G.; Duvall, R.; Brown, S.; Bai, S. EPA Positive Matrix Factorization (PMF) 5.0 Fundamentals and User Guide; EPA/600/R-14/108 (NTIS PB2015-105147); U.S. Environmental Protection Agency: Washington, DC, USA, 2014.
- Wu, C.; Tuo, J.; Chen, R.; Zhang, M.; Liu, Y. Relationships between source inputs and lipid geochemistry of lake sediments on the Northern Tibetan Plateau, China. Geomicrobiol. J. 2020, 37, 702–715. [Google Scholar] [CrossRef]
- Li, Q.; Fan, Q.; Wei, H.; Qin, Z.; Zhang, X.; Du, Y.; Shan, F. Sulfur isotope constraints on the formation of MgSO4-deficient evaporites in the Qarhan salt Lake, western China. J. Asian Earth Sci. 2020, 189, 104160. [Google Scholar] [CrossRef]
- Fan, Q.; Lowenstein, T.K.; Wei, H.; Yuan, Q.; Qin, Z.; Shan, F.; Ma, H. Sr isotope and major ion compositional evidence for formation of Qarhan Salt Lake, western China. Chem. Geol. 2018, 497, 128–145. [Google Scholar] [CrossRef]
- Ye, C.; Mao, J.; Ren, Y.; Li, Y.; Lin, Y.; Power, I.M.; Luo, Y. Salt crystallization sequences of nonmarine brine and their application for the formation of potassium deposits. Aquat. Geochem. 2018, 24, 209–229. [Google Scholar] [CrossRef]
- Han, R.; Zhang, X.; Liu, J.; Long, Q.; Chen, L.; Liu, D.; Zhu, D. Microbial community structure and diversity within hypersaline Keke Salt Lake environments. Can. J. Microbiol. 2017, 63, 895–908. [Google Scholar] [CrossRef]
- Zhang, P. Saline Lakes of Qaidam Basin; Science Press: Beijing, China, 1987. [Google Scholar]
- Lowenstein, T.K.; Spencer, R.J.; Pengxi, Z. Origin of ancient potash evaporites: Clues from the modem nonmarine qaidam basin of Western china. Science 1989, 245, 1090–1092. [Google Scholar] [CrossRef]
- Geng, H.; Park, Y.; Hwang, H.; Kang, S.; Ro, C.U. Elevated nitrogen-containing particles observed in Asian dust aerosol samples collected at the marine boundary layer of the Bohai Sea and the Yellow Sea. Atmos. Chem. Phys. 2009, 9, 6933–6947. [Google Scholar] [CrossRef] [Green Version]
Figure 1.
Sampling sites in Shanxi and Qinghai provinces, China.

Figure 2.
IAP as a function of RH, including four salt components in two brine samples.

Figure 3.
(a) Ionic concentrations of brine samples. (b) Na-normalized ionic concentrations of brine samples. The letters after the numbers indicate the literature source, and the detailed literature information can be found in Table S1. c from [43,44], d from [45], e from [46], g from [47,48].

Figure 4.
(a) Factor profiles of PMF 3-factor results on ionic concentrations. (b-1,b-2) PMF factor distributions of all brine samples. (c-1–c-3) Three factor-representing samples: (c-1) 41c for Factor 1, (c-2) QH for Factor 2, (c-3) KK for Factor 3. b from [42], c from [43,44], d from [45], e from [46], g from [47,48].

Figure 5.
AIOMFAC modeled DRHs of four salt components in brine samples. b from [42], c from [43,44], d from [45], e from [46], g from [47,48].

Figure 6.
(a–c) Mass growth factor as a function of RH in different y-axis scales. (d) Calculated DRHs of four key salt components for the six samples. The red squares are the experimentally observed initial water uptakes and the blue squares are the experimentally observed major water uptakes.
Figure 6.
(a–c) Mass growth factor as a function of RH in different y-axis scales. (d) Calculated DRHs of four key salt components for the six samples. The red squares are the experimentally observed initial water uptakes and the blue squares are the experimentally observed major water uptakes.

Figure 7.
(a–c) Correlations of the DRHs and ionic concentration (moL/L) of four ions. (d–f) Correlations of the DRH value of three main salt components in brine samples.
Figure 7.
(a–c) Correlations of the DRHs and ionic concentration (moL/L) of four ions. (d–f) Correlations of the DRH value of three main salt components in brine samples.

Figure 8.
(a) PMF factor profiles of DRHs of brine samples. (b) PMF factor distributions of DRHs of brine samples. b from [42], c from [43,44], d from [45], e from [46], g from [47,48].

Figure 9.
(a) Normalized concentration of ions. (b) Modeled DRHs of size salts in five aerosol samples. The 1a–3a are aged salt aerosol particles [16]; 74f, 84f, 87f are fresh salt aerosol particles [6].

Figure 10.
(a-1,a-2) PMF solution of ionic concentrations. (b-1,b-2) PMF solution of calculated DRHs. (c-1,c-2) Ionic compositions of typical cases for the two factors.
Figure 10.
(a-1,a-2) PMF solution of ionic concentrations. (b-1,b-2) PMF solution of calculated DRHs. (c-1,c-2) Ionic compositions of typical cases for the two factors.


Table 1.
Correlations coefficient of ionic concentrations of all brine samples.
| Na+ | K+ | Mg2+ | Ca2+ | Cl− | SO42− | |
|---|---|---|---|---|---|---|
| Na+ | 1.00 | |||||
| K+ | −0.06 | 1.00 | ||||
| Mg2+ | −0.55 | 0.24 | 1.00 | |||
| Ca2+ | −0.07 | −0.21 | 0.16 | 1.00 | ||
| Cl− | −0.13 | 0.29 | 0.86 | 0.35 | 1.00 | |
| SO42− | 0.25 | −0.02 | 0.11 | −0.33 | 0.05 | 1.00 |
Publisher’s Note: MDPI stays neutral with regard to jurisdictional claims in published maps and institutional affiliations. |
© 2021 by the authors. Licensee MDPI, Basel, Switzerland. This article is an open access article distributed under the terms and conditions of the Creative Commons Attribution (CC BY) license (https://creativecommons.org/licenses/by/4.0/).
Share and Cite
MDPI and ACS Style
Li, J.; Liu, W.; Li, L.; Gu, W.; Zhang, X.; Hallquist, M.; Tang, M.; Wang, S.; Kong, X. Hygroscopicity of Fresh and Aged Salt Mixtures from Saline Lakes. Atmosphere 2021, 12, 1203. https://doi.org/10.3390/atmos12091203
AMA Style
Li J, Liu W, Li L, Gu W, Zhang X, Hallquist M, Tang M, Wang S, Kong X. Hygroscopicity of Fresh and Aged Salt Mixtures from Saline Lakes. Atmosphere. 2021; 12(9):1203. https://doi.org/10.3390/atmos12091203
Chicago/Turabian StyleLi, Jun, Wanyu Liu, Linjie Li, Wenjun Gu, Xiying Zhang, Mattias Hallquist, Mingjin Tang, Sen Wang, and Xiangrui Kong. 2021. "Hygroscopicity of Fresh and Aged Salt Mixtures from Saline Lakes" Atmosphere 12, no. 9: 1203. https://doi.org/10.3390/atmos12091203
Note that from the first issue of 2016, this journal uses article numbers instead of page numbers. See further details here.