Article

Using DNDC and WHCNS_Veg to Optimize Management Strategies for Improving Potato Yield and Nitrogen Use Efficiency in Northwest China

1
Key Laboratory of Plant Nutrition and Fertilizer, Ministry of Agriculture and Rural Affairs, Institute of Agricultural Resources and Regional Planning, Chinese Academy of Agricultural Sciences, Beijing 100081, China
2
Institute of Plant Nutrition and Resources, Beijing Academy of Agriculture and Forestry Sciences, Beijing 100097, China
3
Institute of Resources and Environment and Testing Technology, Inner Mongolia Academy of Agricultural and Animal Husbandry Sciences, Hohhot 010031, China
*
Authors to whom correspondence should be addressed.
Agronomy 2021, 11(9), 1858; https://doi.org/10.3390/agronomy11091858
Submission received: 17 August 2021 / Revised: 3 September 2021 / Accepted: 4 September 2021 / Published: 16 September 2021
(This article belongs to the Special Issue Advances in Modelling Cropping Systems to Improve Yield and Quality)

Abstract

:
Excessive nitrogen (N) application rate led to low N use efficiency and environmental risks in a potato (Solanum tuberosum L.) production system in northwest China. Process-based models are effective tools in agroecosystems that can be used to optimize integrated management practices for improving potato yield and N use efficiency. The objectives of this study were (1) to calibrate and evaluate the DeNitrification-DeComposition (DNDC) and soil Water Heat Carbon Nitrogen Simulator of Vegetable (WHCNS_Veg) models using the measurements of potato yield, above-ground biomass, N uptake, soil moisture and temperature, and soil inorganic N based on a field experiment in northwest China (2017–2020) and (2) to explore optimal management practices for improving yield and N use efficiency under long-term climate variability (1981–2020). Both models overall performed well in simulating potato tuber yield (normalized root mean square error (NRMSE) = 5.4–14.9%), above-ground biomass (NRMSE = 6.0–14.7%), N uptake (NRMSE = 18.1–25.6%), daily soil temperature (index of agreement (d) > 0.9 and Nash–Sutcliffe efficiency (EF) > 0.8), and acceptable in-soil moisture and inorganic N content (d > 0.6 and EF > ‒1) for N-applied treatments. However, the two models underestimated tuber yield and soil N content for no N fertilization treatment which was partially attributed to the underestimated soil N mineralization rate under N stress conditions. The sensitivity analysis showed that the greatest tuber yield and N use efficiency were achieved at the N rate of 150–180 kg ha−1 with 2–3 splits, fertilization depth of 15–25 cm, and planting date of 25 April to 10 May in both models. This study highlights the importance of integrated management strategies in obtaining high N use efficiency and crop yield in potato production systems.

1. Introduction

Potato (Solanum tuberosum L.) is the fourth staple food in China with 4.91 million ha harvested area and 92 million tons of tuber production, which accounts for 28% and 25% of the world total in 2019, respectively, but the average yield is 12% lower than that of the world [1]. Potato yield is restricted by unbalanced fertilizer management [2]; for example, 55% of farmers applied N fertilizer at an unreasonable rate in northwest China based on a field survey [3]. Nitrogen (N) is the most yield-limiting factor for potatoes in China due to the N yield response. Compared to the no fertilizer treatment, the yield increase is about 8.6 t ha−1 under optimum N treatment, which is significantly greater than the increase of 5.9 t ha−1 and 6.6 t ha−1 under optimum phosphorus (P) and potassium (K) treatments, respectively [4]. In addition, potato is the most N intensive crop with shallow roots and low N uptake efficiency [5]. The average N recovery efficiency of a farmer’s practice was less than 30% for potato production in China [6,7] and the typical harvest index of N was 0.75 [8], which indicated that more than 78% N remained in the soil and then leached to the groundwater or was emitted to air system, resulting in low N use efficiency and environmental pollution [9].
For improving N use efficiency of potato, N management based on the “4R” nutrition management principles has been suggested by Li and Jin [2]. The tuber yield increased to 29.4 t ha−1 (increased by 57%), and the average N recovery efficiency increased to 36% for potato compared to the average farmer’s practice [7]. However, the yield gap is still greater than other dominant potato countries such as the United States (50 t ha−1) and Netherlands (42 t ha−1) [1], and N recovery efficiency is lower than that in Europe (50–60%) at 150–250 kg ha−1 N input [8]. In addition, cultivation management practices (e.g., planting date, sowing density) also had a significant effect on tuber yield [10]. Optimized planting date increased tuber yield by 13–23% due to the match of water requirement and precipitation during the growing period in northwest China [11]. Planting density of 4.4 seed m−2 (i.e., 75 cm row spacing × 30 cm plant spacing) with right rate of N application (150 kg N ha−1) gave the highest tuber yield through effective use of land in Ethiopia [12]. Although many studies have been conducted on the N fertilizer application rate and timing, and planting date and density [10,13,14], the effect of integrated management on potato tuber and N utilization is still unclear. An improved understanding of the interactions between N fertilizer and cultivation management could help develop better management practices. Jiang [15] confirmed that the integration of N and cultivation management practices could further increase yield and N use efficiency for maize in northeast China based on a modelling approach.
The process-based models are useful tools for estimating the impacts of multiple management practices on agroecosystems [16]. More than 30 potato models have been developed globally based on different structures and local conditions [16,17]. Some potato models have been applied to study the effects of N fertilizer, irrigation management, and climate change, such as soil Water Heat Carbon Nitrogen Simulator of Vegetable (WHCNS_Veg) [18] and DeNitrification-DeComposition (DNDC) [19]. A well-calibrated model could be used to explore optimal management practices (e.g., fertilizer application rate, fertilization time and placement, planting date and density) based on the sensitivity analysis [15,20]. Guo et al. [21] optimized the N application rate at 75–150 kg ha−1 for potato based on the DNDC model in north China. The DNDC model is increasingly used to estimate the impacts of management practices and climate change for crop production and soil C & N cycle [22]. The WHCNS_Veg model has improved the fresh yield calculation based on the probability distribution function [23], which is more suitable for the crops with higher water content in grain [24]. The model has been used to determined optimal N management for tomato in north China [25]. However, the DNDC and WHCNS_Veg models have not been previously validated and used for optimizing management practices for improving potato production and agronomic efficiency in northwest China.
The objectives of this study were to (1) calibrate and validate the DNDC and WHCNS_Veg model using 4-year measurements of potato tuber yield, above-ground biomass, crop N uptake, soil moisture, temperature, and inorganic N; (2) assess the two models’ advantages and weakness for simulating potato growth and soil N dynamics; (3) optimize management practices that comprised the N application rate and timing, application depth, and planting date and density to improve tuber yield and N use efficiency in northwest China.

2. Materials and Methods

2.1. Field Experiment and Measurements

A four-year field experiment was conducted from 2017 to 2020 in Wuchuan County, Inner Mongolia Autonomous Region (41°8′ N, 111°17′ E, altitude 1570 m) which is the typical one-season cropping area in northwest China. The annual and seasonal (from May to September) average precipitation were 350 mm and 296 mm (1981–2020), and the annual and seasonal average temperature were 4.2 °C and 16.5 °C, respectively (Figure S1). Potato was planted from late April to early June with normal planting date of the middle May and harvested in late September before the first frost day based on local farmer practice. The soil type is classified as Kastanozems according to World Reference Base for Soil Resource [26] and the soil texture is sandy loam based on the soil texture calculator of United State Department of Agriculture [27]. Representative soil samples were collected from the upper 0.20 m depth before planting to determine the chemical and textural properties (SOC contents, pH, bulk density, and clay fraction), which are shown in Table S1.
Experimental design was a randomized complete block with three replicates. The five N fertilizer treatments include N0 (0 kg N ha−1), N1 (50% recommended N rate), N2 (75% recommended N rate), N3 (100% recommended N rate), and N4 (150% recommended N rate). The recommended N application rate was obtained based on the potato Nutrient Expert® software (Chinese Academy of Agricultural Sciences, Beijing, China). The N fertilization rate and timing, planting and harvest dates, sowing density, and cultivar information are shown in Table 1. The N3 fertilization rates were different during the experimental years due to the fact that it was recalculated with the yield response of the last year [28]. Urea (46% N) and potassium chloride (52% K) were applied as N and K fertilizer sources. Urea was applied in banding on the ridges and immediately covered with 10 cm depths soil after application at planting and hilling stages, and the remained urea was applied at the surface soil during the tuber bulking stage. The P fertilizer was applied as diammonium phosphate (18% N and 23% P) for all treatments. The P and K fertilizer were applied as basal at the planting except for K fertilizer in 2018, which was applied 50% as basal and 50% for dressing at the emergence stage (Table S2).
The measured data include tuber yield, above-ground biomass, N uptake, soil moisture and temperature, and soil inorganic N content (0.4 m). Potatoes were harvested manually and all tubers of each plot (30 m2) were weighted. The weight of tuber yields was converted to ton per hectare. The dry matter of the above-ground biomass included stems, leaves, and tubers, which were dried at 105 °C for 30 min, and then dried to a constant weight at 75 °C in an oven (XMTD-8222; Shanghai Jing Hong Instruments Co., Ltd., Shanghai, China). The N content of the above-ground dry matter was determined with the Kjeldahl method [29] and multiplied by the dry matter to calculate the plant N uptake. Soil samples were taken at the emergence, tuber bulking, and maturity stage to determine the soil moisture and inorganic N content. The soil moisture was determined by the drying method, and the soil inorganic N was extracted with 0.01mol/L CaCl2, and the continuous segmented flow analyzer (AA3-SEAL Analytical; BL-TECH (TIANJIN) Co., Ltd., Tianjin, China) was used to determine the inorganic N concentration, and then converted to content by multiplying soil bulk density and depth. In addition, the conventional tillage with moldboard ploughing (0.20 m depth) was conducted within a week before planting in this study. Sowing, applying basal fertilizer, and ridging were manually operated, and the ridge width was generally 60 cm with two rows in a ridge. The drip irrigation system was used during the potato growth period with 200, 240, 280, and 200 mm of irrigation water for 2017−2020, respectively. The drip pipes were placed on the surface of the ridge and in the middle of two plant rows with a diameter of 16 mm and the hole spacing of 30 cm, and the water flow rate was 1.38 L h−1. The herbicides and pesticides were semi-mechanically sprayed according to the recommendations of local plant protection technicians.

2.2. DNDC and WHCNS_Veg Model Description

2.2.1. DNDC Model

The DNDC model (version 95) is a process-based biogeochemistry model for predicting crop yield, soil carbon sequestration, nitrogen leaching, and greenhouse gas (GHG) emissions in agroecosystems [30,31]. Over the past 20 years, DNDC has been improved in crop growth simulations, hydrological features, alternative farming management practices (the use of nitrification inhibitors, slow-release fertilizers, plastic film mulching, and sprinkler and drip irrigation), and greenhouse gas emissions [22]. The model consists of six sub-models [32], including the soil climate, crop growth, decomposition, nitrification, denitrification, and fermentation sub-models, which are driven by four ecological drivers (i.e., climate, soil, vegetation, and management practices). The specific geochemical or biochemical reaction employed classical laws of physics, chemistry, biology, and empirical equations.

2.2.2. WHCNS_Veg Model

The WHCNS_Veg model (version 2.0) combines a vegetable growth module of the N_ABLE model and a soil water heat carbon nitrogen simulator (WHCNS) model [24,33]. The model is driven by climate data, soil hydraulic properties, crop physiology, and field management practices [25]. The main difference from other crop models is that the fresh yield computation employs a general method of converting total dry matter to fresh marketable yield for vegetables based on a probability distribution [23]. The model includes five sub-models including soil, crop, management, weather, and nitrogen-carbon modules. The simulated processes involve soil movement, soil water evaporation, crop transpiration, soil N transport and transformation (net N mineralization, nitrification, ammonia volatilization, and denitrification), and vegetable growth [34].

2.3. Model Parameterization, Calibration, and Validation

The DNDC and WHCNS_Veg models require input parameters including daily climate (e.g., maximum and minimum air temperature, solar radiation, daily precipitation); field management practices (e.g., planting/harvest dates, tillage, fertilizer rate and timing, fertilizer types, application depth, and irrigation); soil property data (e.g., soil bulk density, texture, soil organic C, pH, and soil hydraulic parameters); crop physiology (e.g., growing degree days, biomass portioning, and maximum root depth); and initial conditions (e.g., soil temperature and moisture, inorganic N content, and organic matter). The climate data of experiment site from 2017 to 2020 were obtained from a local weather station in Wuchuan County (Figure S1).
Calibration and validation are preconditions for model application. The “trial and error” approach was used to calibrate the crop growth and soil N transformation parameters in the DNDC and WHCNS_Veg models. The optimal parameters were determined by minimizing the normalized root mean square error (NRMSE) between the simulated and measured values (tuber fresh yield, biomass, plant N uptake, soil moisture, soil temperature, and soil inorganic N) of N3 treatment from four experimental years. The remaining dataset from other four treatments were used to validate the model performance and applicability in simulating potato cropping system. The calibrated parameters were listed in Tables S3 and S4. The growing degree days (GDD) in DNDC (2100 °C) is higher than the WHCNS_Veg (1400 °C) model because the GDD were calculated from sowing to harvest in DNDC compared to the GDD calculation from emergence to maturity in WHCNS_Veg. A ten-year spin-up was run before the beginning of the experiment to stabilize water, C, and N pools in crop models in the DNDC model.

2.4. Model Performance Statistics

To evaluate the model performance, four statistics were used including normalized average relative error (NARE), normalized root mean square error (NRMSE), index of agreement (d), and Nash-Sutcliffe efficiency (EF) [35,36,37] (see Equations (1)–(4) below).
NARE = i   = 1 n ( S i M i ) nM × 100  
NRMSE = i   = 1 n ( S i M i ) 2 n   M × 100
d = 1 i   = 1 n ( S i M i ) 2 i   = 1 n ( | S i M | + | M i M | ) 2
EF = 1 i   = 1 n ( S i M i ) 2 i   = 1 n ( M i M ) 2
where n is the number of samples, Si and Mi are the simulated and measured values, and M is the average of measured values.
The NARE value can estimate if simulated values were lower or higher than the measured values. When NARE ≤ ±15%, the model performance was satisfactory for yields and biomass [38]. The NRMSE ≤15%, 15–30%, and >30%, respectively, represent “good”, “fair”, and “poor” model performance [39,40]. The d (0–1) represents the ratio of the mean square error and the potential error with higher values indicating better agreement between simulated and measured values. d ≥ 0.75 and EF ≥ 0 are the minimum threshold values for crop growth, while d ≥ 0.60 and EF ≥ −1.0 are the minimum threshold values for soil output validation [39].
One-way ANOVA and difference test (LSD) were used to check the difference between the data with the “agricolae” package (Universidad Nacional Agraria La Molina, Lima, Peru) in R (4.0.3) software (R Core Team, Vienna, Austria).

2.5. Sensitivity Analysis

The sensitivity analyses of the DNDC and WHCNS_Veg models were used to explore best management practices, including N application rate and timing, fertilization depth, planting date, and planting density (Table 2) under long-term climate variability (1981–2020) (Figure S1). The N application rate was set to 0 to 300 kg N ha−1 with a 30 kg N ha−1 interval. The N application timing include 100% basal at planting, two-splitting (planting and emergence, or planting and tuber bulking growth stages), and three-splitting fertilization (planting, emergence, and tuber bulking growth stages). The application ratio for each application scenario was shown in Table 2. The sensitivity level of the fertilization depth ranged from 0 to 30 cm with 5 cm intervals. The conventional fertilization depth was 10 cm in the N3 treatment that was the baseline scenario for compared with optimized scenarios. The planting date ranged from 20 April (110) to 5 June (156) at an interval of 5 days according to the suggestion of Tang et al. [41]. The planting density ranged from 3.5 to 7 seed m−2 with a 0.5 seed m−2 interval simulated only by the WHCNS_Veg model as the DNDC model is incapable of adjusting planting density. The best management practices were determined based on the average yield and N use efficiency results of sensitivity analysis under the 40-year historical weather conditions (Figure S1).

2.6. Nitrogen Use Efficiency

In this study, three indicators were used to evaluate N use efficiency including N partial factor productivity (PFP), N fertilizer agronomic use efficiency (AEN) and N recovery rate (REN) [42]. Calculated as follows Equations (5)–(7):
PFP = TY N N rate    
AEN = TY N TY N 0 N rate  
REN = U N U N 0 N rate × 100
where TYN is the tuber fresh yield (kg ha−1) for N-applied treatments, and TYN0 is the tuber fresh yield for N0 treatment; UN is the plant N uptake at maturity (kg N ha−1) for N-applied treatments, and UN0 is the plant N uptake for at maturity (kg N ha−1) N0 treatment. Nrate is the N application rate for one growing season.

3. Results and Discussion

3.1. Model Calibration and Validation
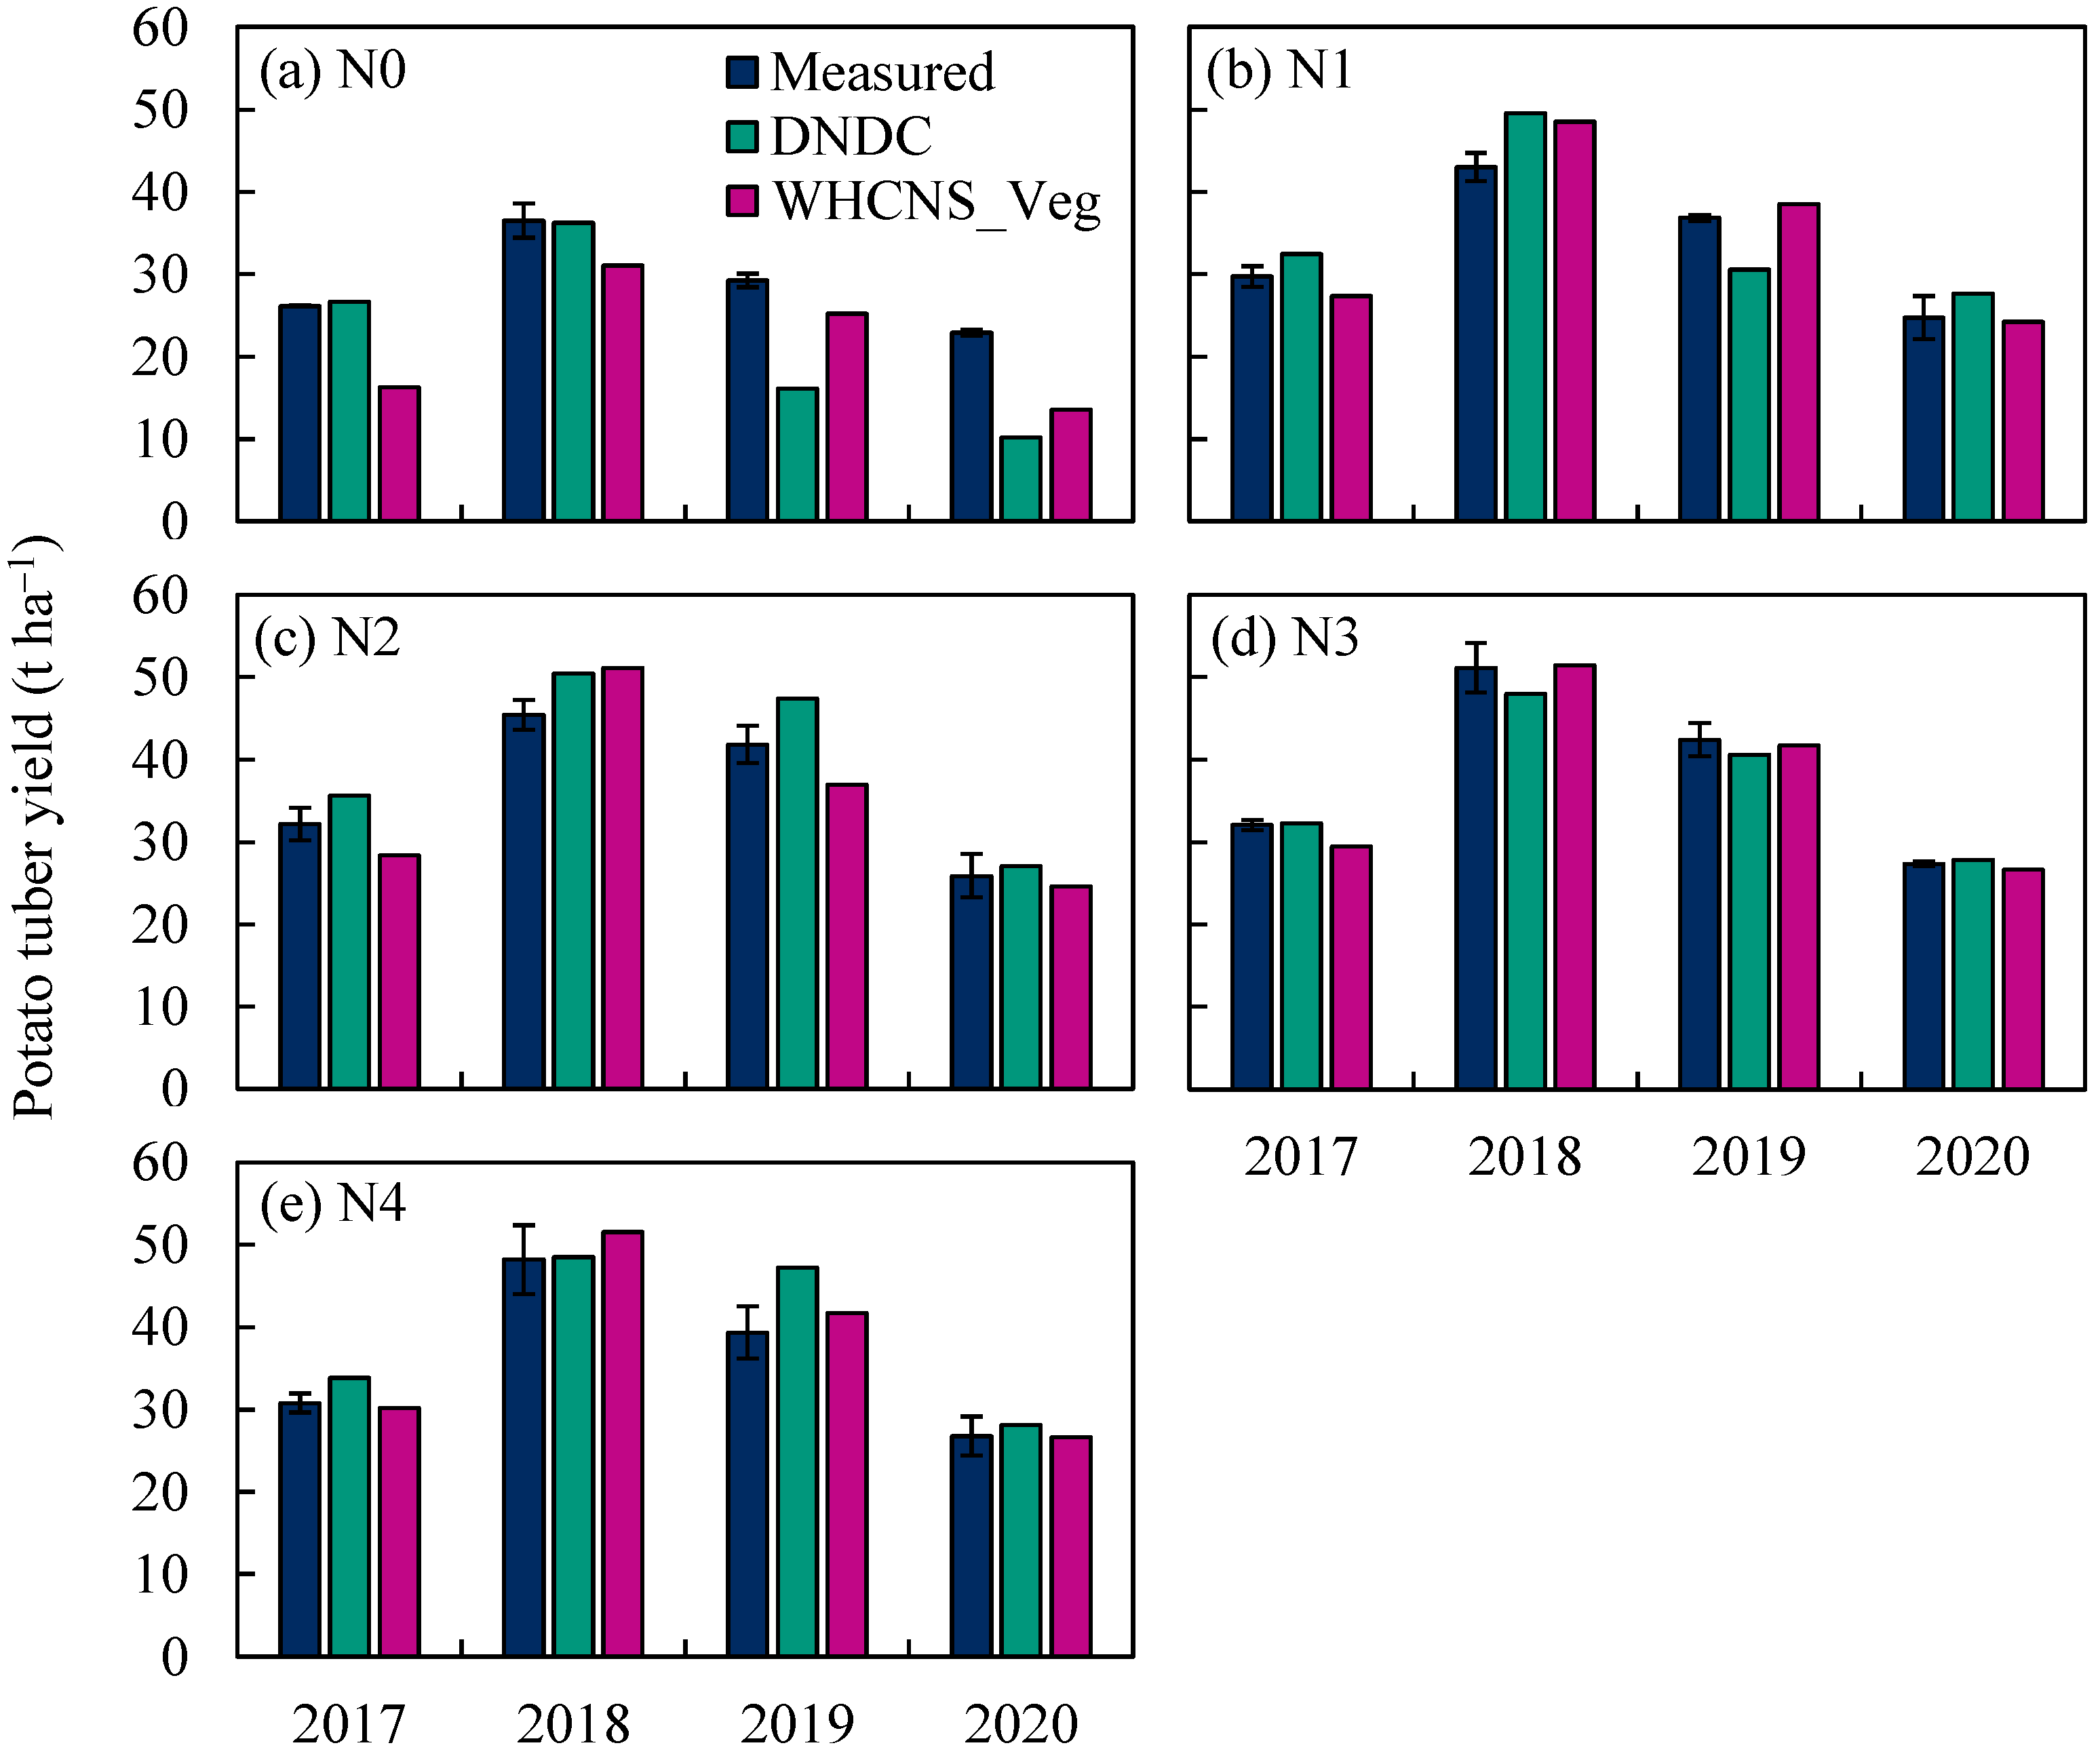
3.1.1. Crop Growth

Calibration of the DNDC and WHCNS_Veg models showed “good” agreements between the simulated and measured tuber fresh yield and above-ground biomass in the N3 treatment based on the values of NRMSE (5.4–11.6%), NARE (−6.1––2.4%) (Figure 1 and Figure S2, Table 3). For the validation, both models indicated “good” performance for the tuber yield and above-ground biomass for N-applied treatments based on the statistical values of NRMSE < 15% and NARE ≤ ±15% (Table 4). For N0 treatment, however, the DNDC model showed “poor” and “fair” performance in the simulation of yield (NRMSE = 31.6%) and biomass (NRMSE = 24.9%), and the WHCNS_Veg model indicated “fair” performance on both yield and biomass (NRMSE = 26.7–27.9%). Both models underestimated the tuber yield and above-ground biomass for N0 treatment with the NARE values ranging from −25.9% to −13.6%. Similar performance of the DNDC model for crop yield simulation under N stress conditions had been reported by Jiang et al. [15]. This could be partially due to how the crop models underestimated the soil mineralization N content under N0 treatment, which resulted in serious N stress and yield decrease. Another possibility was that the models did not consider the physiological and biochemical adaptive mechanisms of crops under N stress [16]. For example, Zhang et al. [43] reported that root/shoot ratio and main root length were increased in N stress conditions, which improved the ability to absorb water and nutrients. However, there was no correlation equation describing physiological changes which need to be further monitored and integrated into crop models.
For the plant N uptake, both models showed “fair” performance for N-applied treatments in calibration and validation based on the NRSME (18.1–25.6%) and NARE (−4.5–15.6%) values, and the DNDC and WHCNS_Veg model respectively showed “poor” (32.6%) and “fair” (20.2%) performance for the validation of N0 treatment based on the NRMSE values (Table 4, Figure 2). There was no significant difference between measurements and simulations across all the treatments (p = 0.42–0.99). It is noted that, for the N0 treatment, the yield was underestimated but the N uptake was overestimated in both models (Table 4). Similar findings were reported by Jiang et al. [15] and He et al. [44] with the DNDC model. This is possibly due to the N uptake-relative parameters (i.e., biomass C/N ratio in DNDC (Table S3) and the minimum N concentration in WHCNS_Veg (Table S4)), which were calibrated using the N uptake measurements of N3 treatment; however, the measured tuber N content of N0 treatment (1.69 and 1.75% N in straw and tuber) was significantly lower than that of the N3 treatment (1.95 and 2.15% N in straw and tuber) in this study (Table S5) and other previous field experimental results [45]. Therefore, the simulations that used the calibrated N uptake-related parameters of N3 will cause an overestimation of N uptake for N0 treatment.

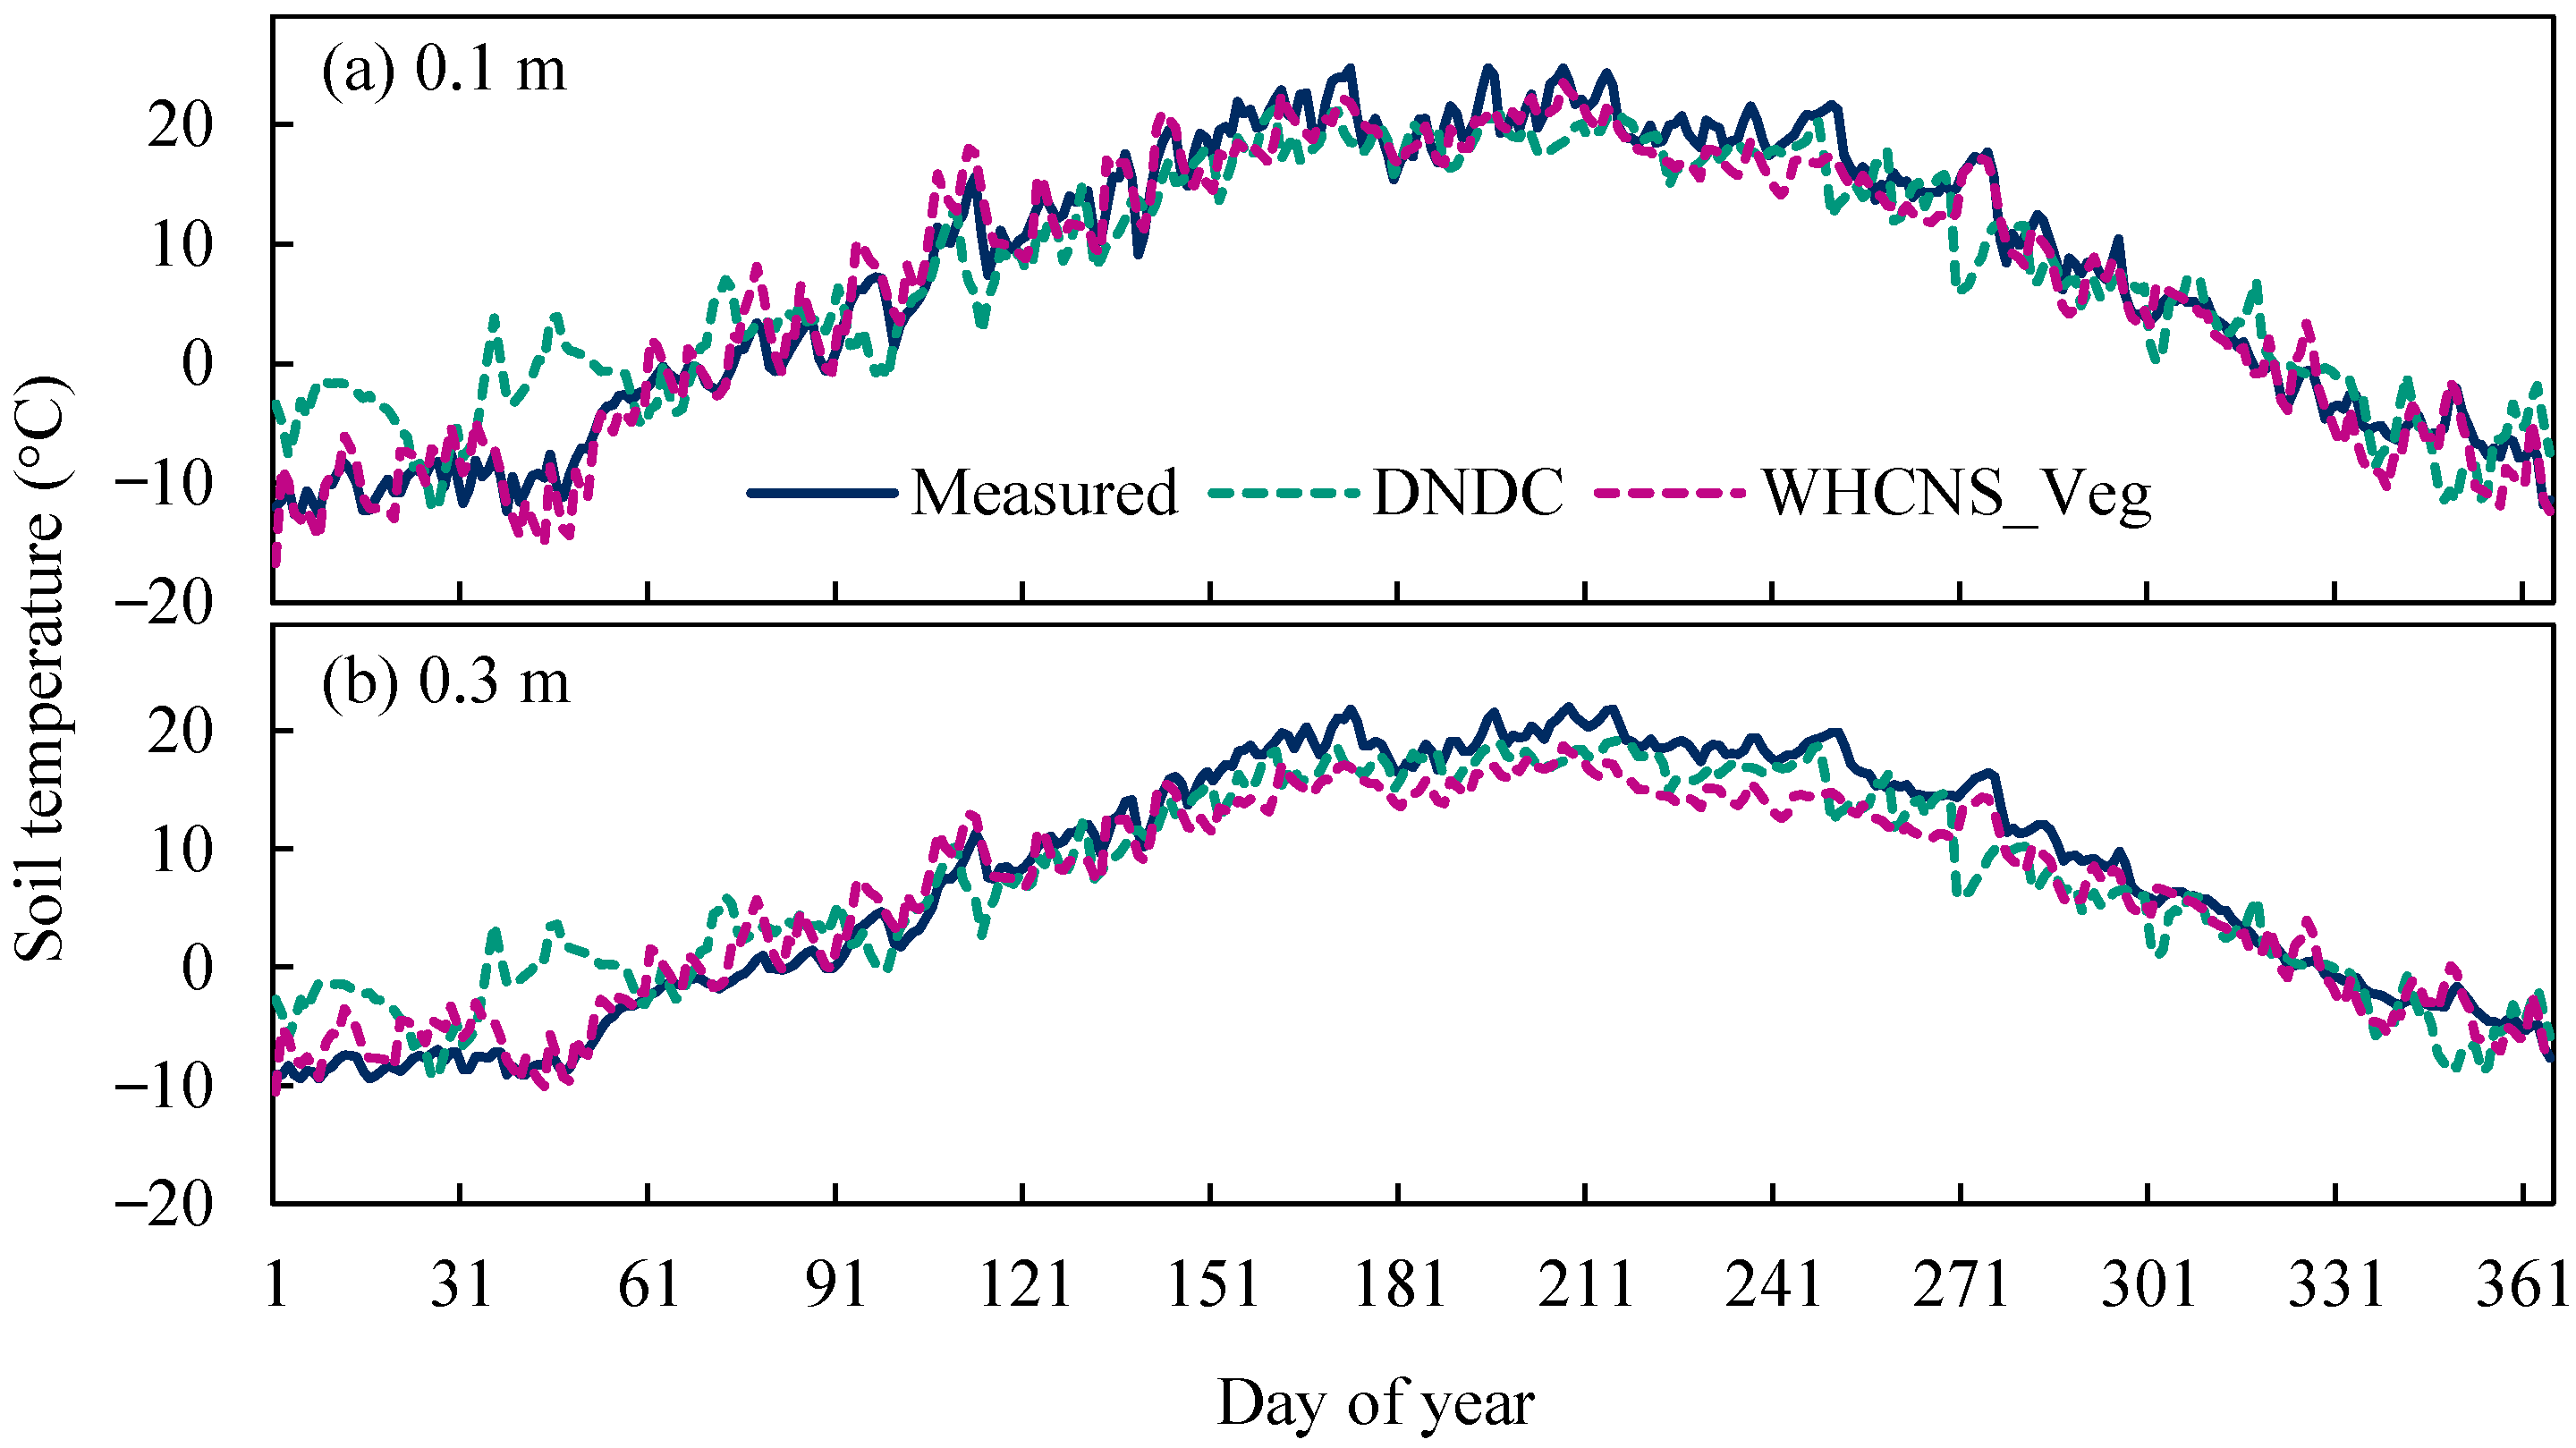
3.1.2. Soil Temperature

The simulated dynamics of soil temperature were in excellent agreement with the measurements in the 0.1 m and 0.3 m soil depths in both models (Figure 3) with the statistical values of EF > 0.8 and d > 0.9 (Table 5 and Table 6). The DNDC model overpredicted soil temperature of 0.1 m soil layer based on NARE > 0, but the WHCNS_Veg model underpredicted (NARE < 0). He et al. [20,44] previously reported the excellent performance of the DNDC model in the simulating of topsoil temperature. Both models underestimated the soil temperature at 0.3 m soil depth, and the WHCNS_Veg model (0.93) was more accurate than the DNDC model (0.87) based on the EF values (Table 6) due to the DNDC model overestimating temperature of the 0–0.3 m soil layer for the first 60 days of the year (Figure 3). Meanwhile, the linear regression results also showed a good agreement between the measured and simulated soil temperature (Figure S3), and the slopes ranged from 0.82 to 0.95 (R2 = 0.91–0.98, p < 0.001).

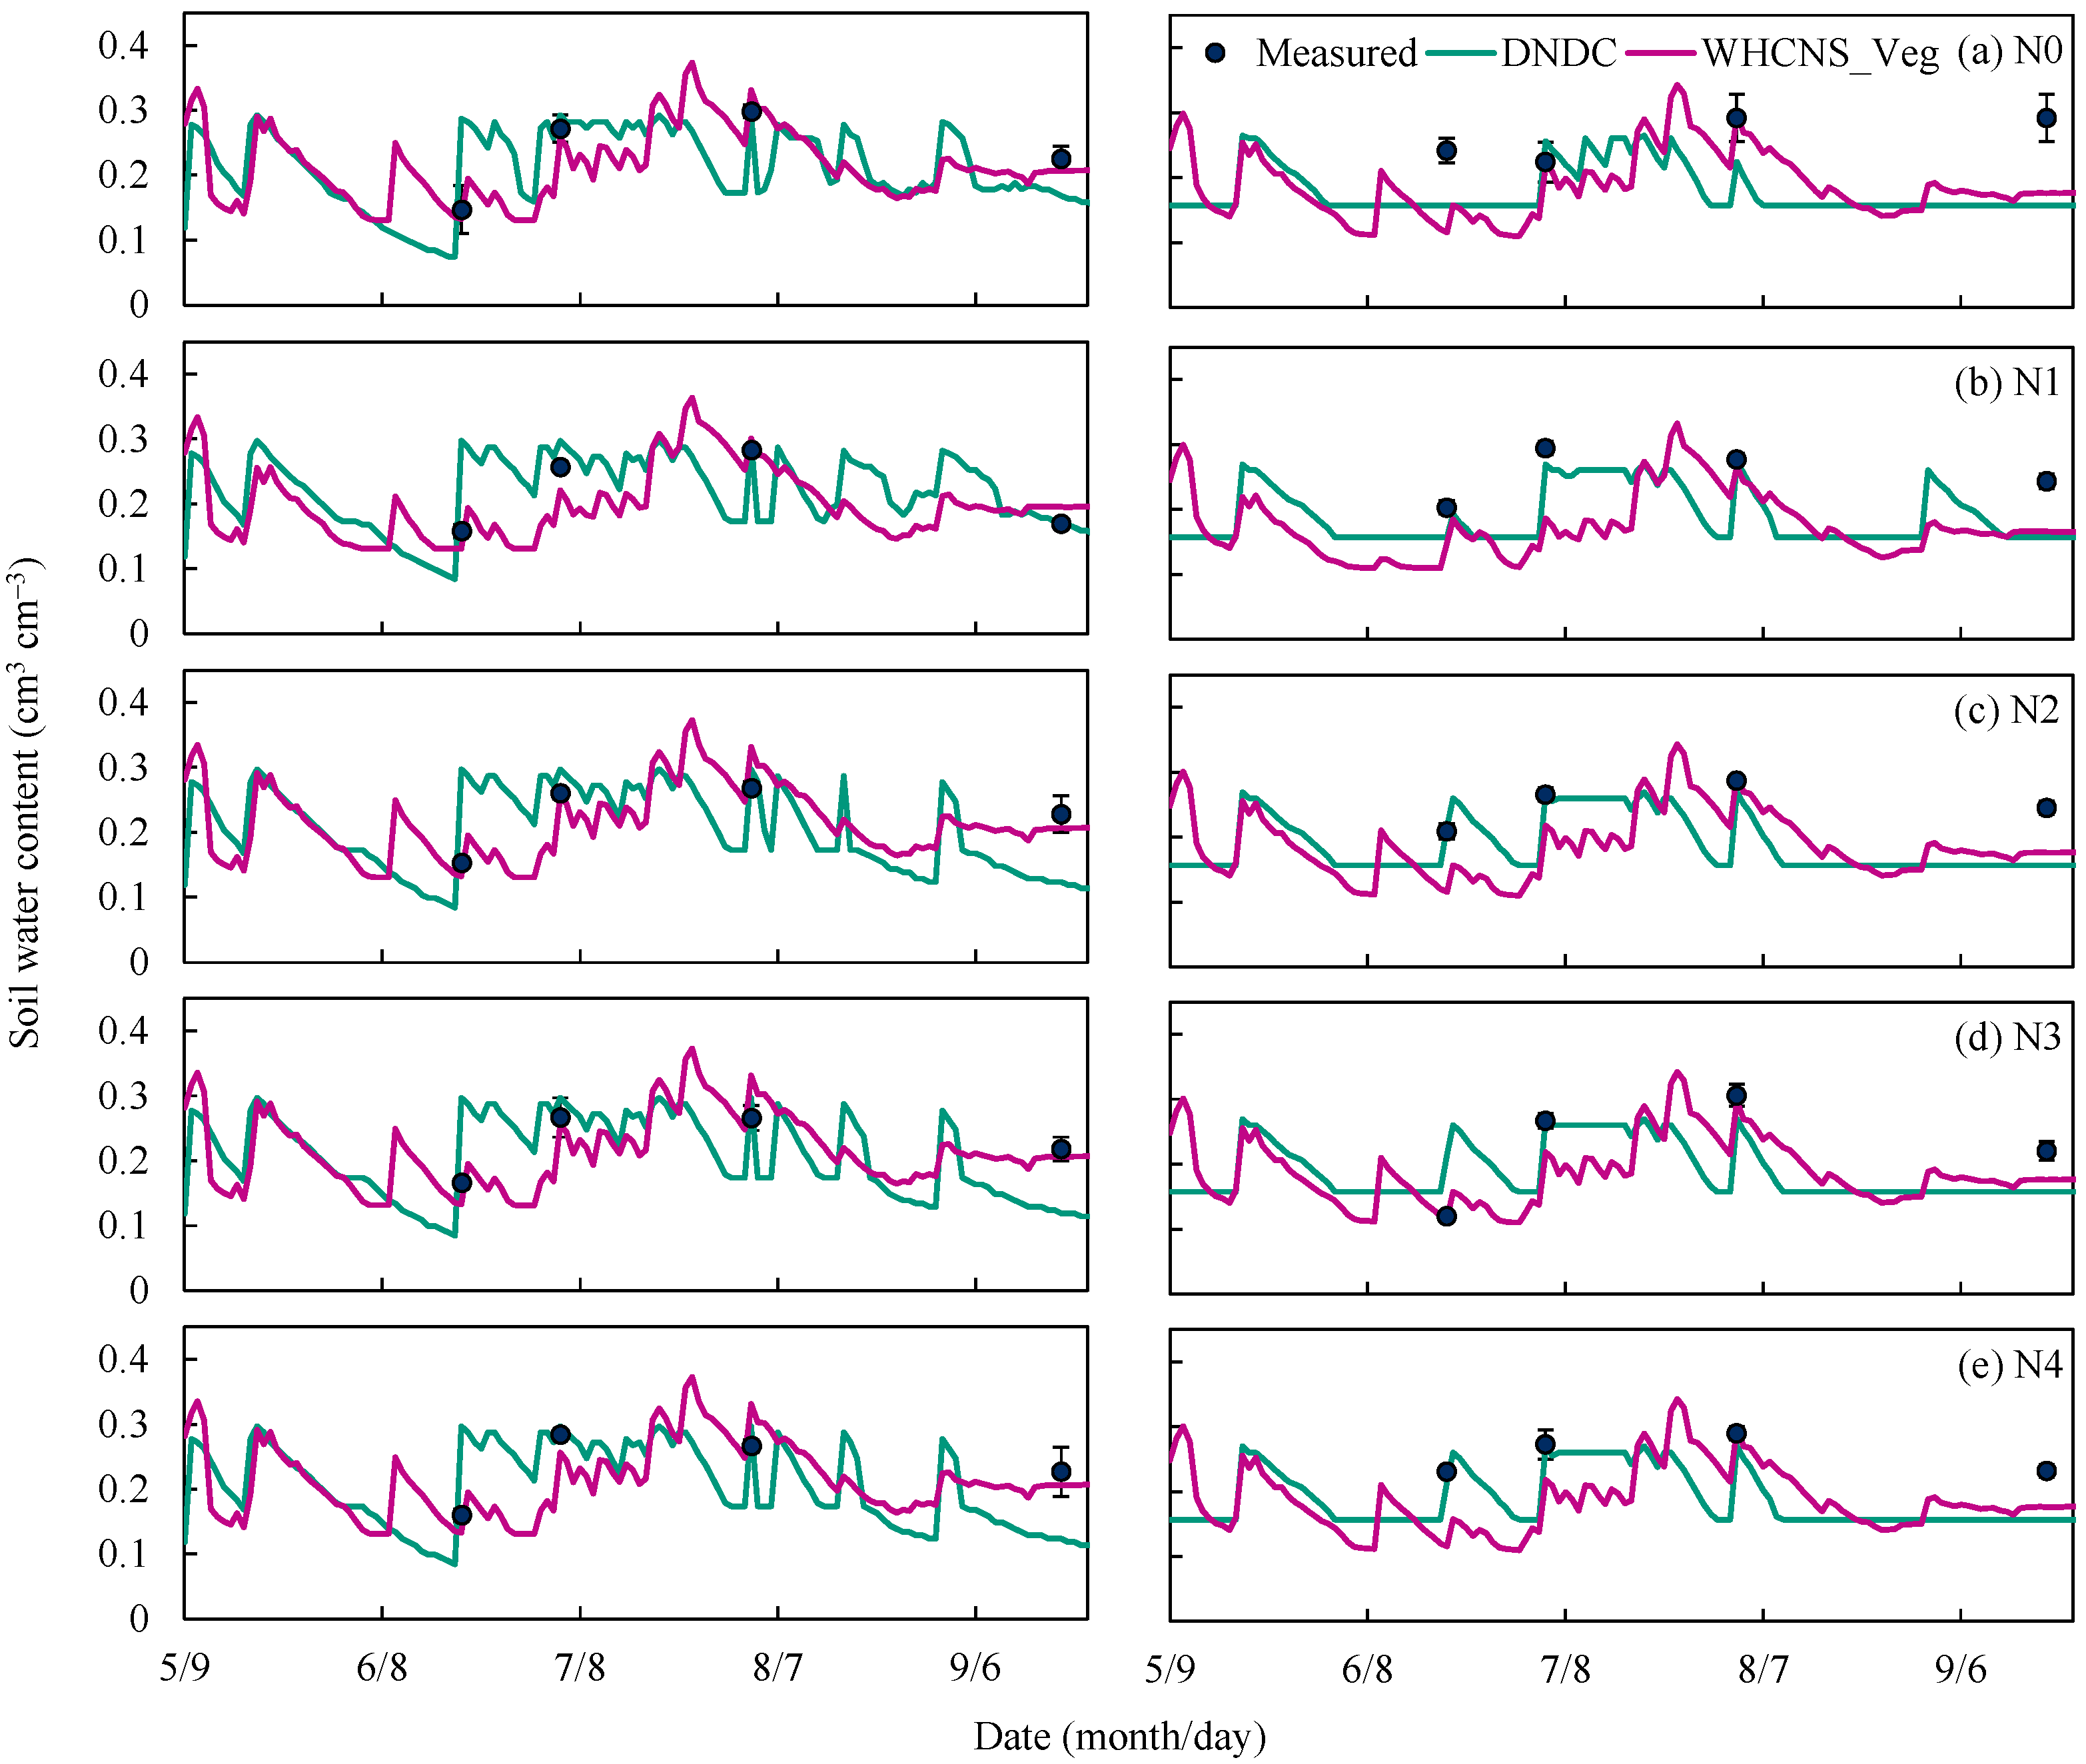
3.1.3. Soil Moisture

The simulated daily soil moisture was compared to the observations in the 0–0.2 m and 0.2–0.4 m soil layers in the 2018 potato growth season (Figure 4). Both models showed “fair” performance in simulating soil moisture for calibration and validation treatments based on the values of NRMSE (16.7–29.0%), and the values of EF > −1 and d > 0.6 (Table 5 and Table 6); in addition, the linear regression between measured and simulated soil moisture was significantly correlated (R2 = 0.93–0.97, p < 0.001) with slopes ranging from 0.83 to 0.99 for all treatments (Figure S4). The DNDC model performance can be improved in the future if the algorithms of rainfall interception and root distribution are developed [20]. Liang et al. [25] reported that the WHCNS_Veg model had a “good” performance (NRMSE < 8%) for greenhouse soil water content simulation with the inclusion of Richards equation. However, the soil spatial variability, preferential flow, and microclimate condition were not considered in WHCNS_Veg [20,25], which may lead to inaccurate simulation in this study. The performance of both models needs to be validated based on more field measurements of soil water content over a long-term period.

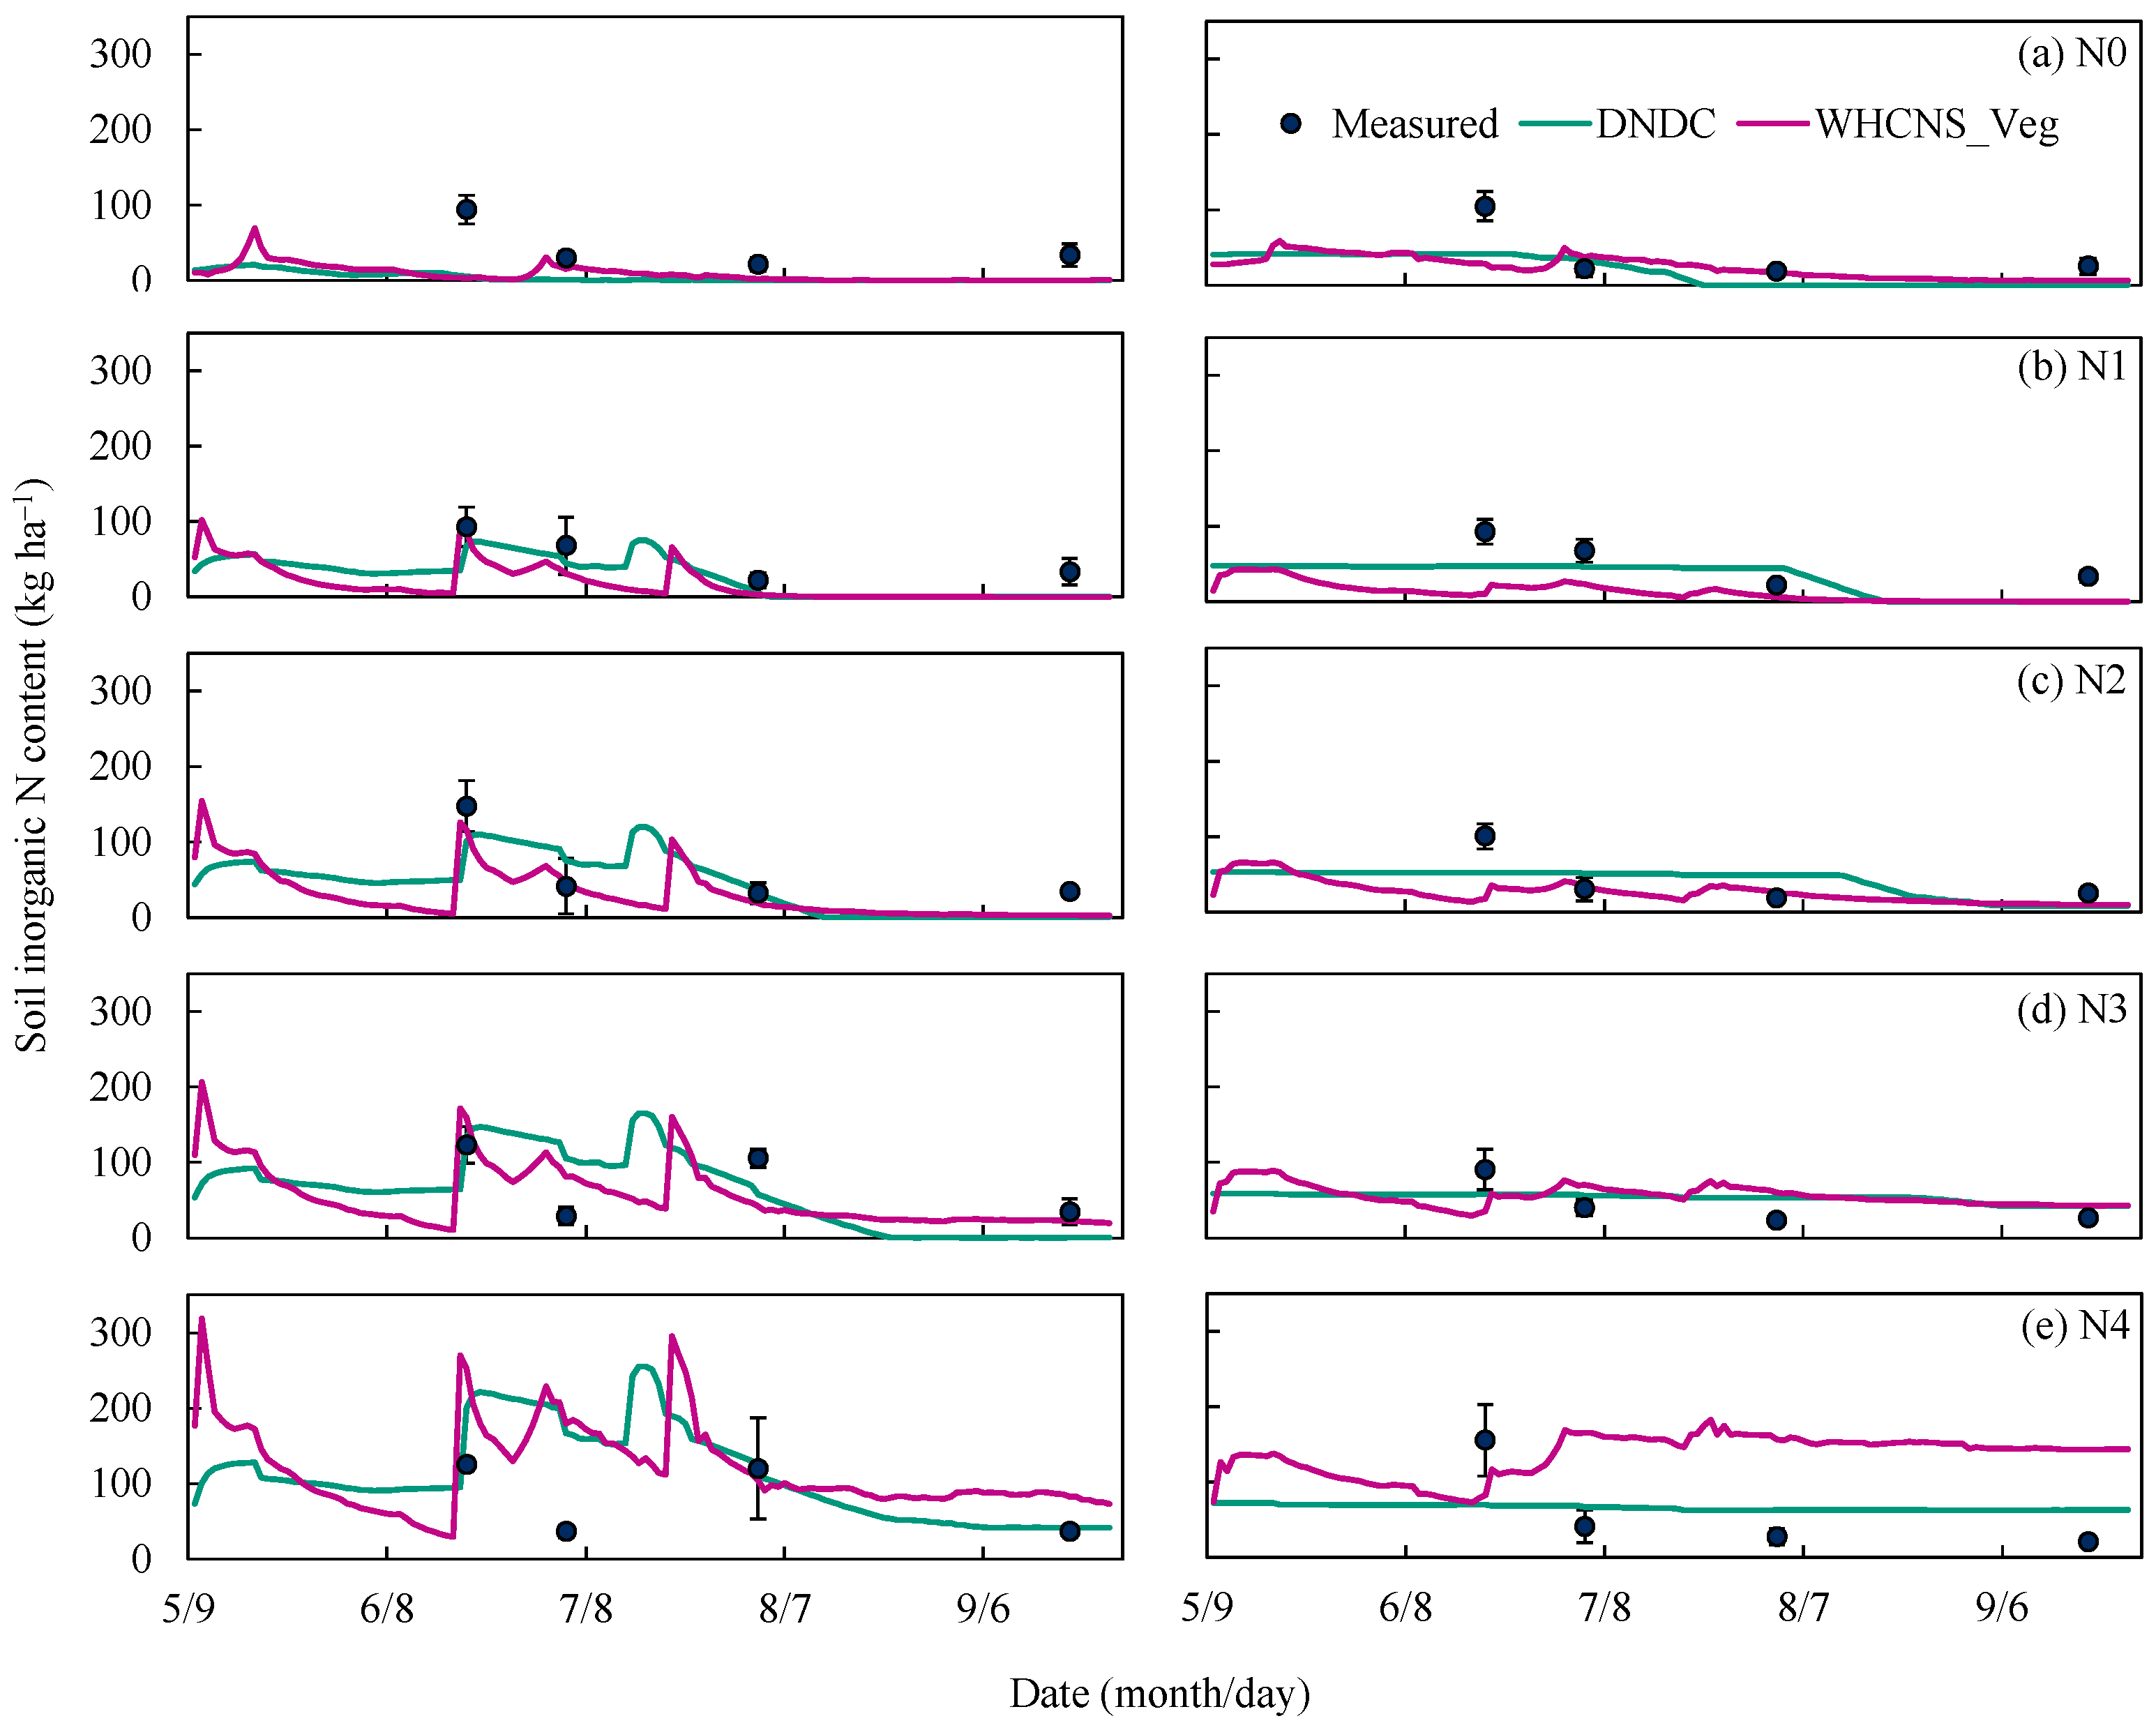
3.1.4. Soil Inorganic N

The simulated daily soil inorganic N was compared to the measurements at the 0–0.2 m and 0.2–0.4 m soil layers during the growing season in 2018 (Figure 5). For the calibration of N3 treatment, the two models’ performance was “acceptable” in simulating inorganic N content of 0–0.2 and 0.2–0.4 m soil layers based on the values of EF > −1 and d > 0.6 (Table 5). For the model validation (Table 6), the two models showed “acceptable” performance in the N1 and N2 treatments according to the values of EF (−0.54–0.37) and d (0.56–0.79), but both models showed “poor” performance for N0 (N stress) and N4 (excess N) treatments (Figure S5). The under-prediction of soil inorganic N content for N0 treatment was likely due to the over-predicted above-ground biomass and crop N uptake under N stress conditions (Table 4), which is consistent with Jiang et al. [15] and He et al. [20]. Both models over-predicted soil inorganic N for N4 treatment based on the average values of NARE (38.5–106.4%), which was mainly attributed to the underestimated N uptake (Figure 2). Thus, an improved simulation of potato growth and N uptake in crop models could contribute towards the estimation of soil inorganic N. The difference between the simulated and measured soil inorganic N for N4 treatment was not significant (p = 0.34) in DNDC with the slope of the linear regression of 0.97 (R2 = 0.61, p < 0.001, Figure S5). However, the soil inorganic N simulations in WHCNS_Veg were significantly higher than the measurements, especially in the 0.2-0.4 m soil layer (Figure 5). The slope of the linear regression between the observations and simulations was 1.24 (R2 = 0.52, p < 0.001), which showed a poor performance of the WHCNS_Veg model. This may be because the model underestimated N losses in terms of ammonia volatilization, nitrous oxide, and N leaching under excess N conditions. Liang et al. [25] reported a “poor” to “good” performance of the WHCNS_Veg model in simulating soil nitrate concentration at 0.5 and 0.9 m soil depths in over-applied N treatment based on the values of EF (−0.9–0.5) and d (0.43–0.83). Thus, the data of ammonia volatilization, nitrous oxide emissions, and N leaching response to different N applications should be observed in the field experiments for adjusting relevant model parameters and improving the simulation of soil inorganic N.

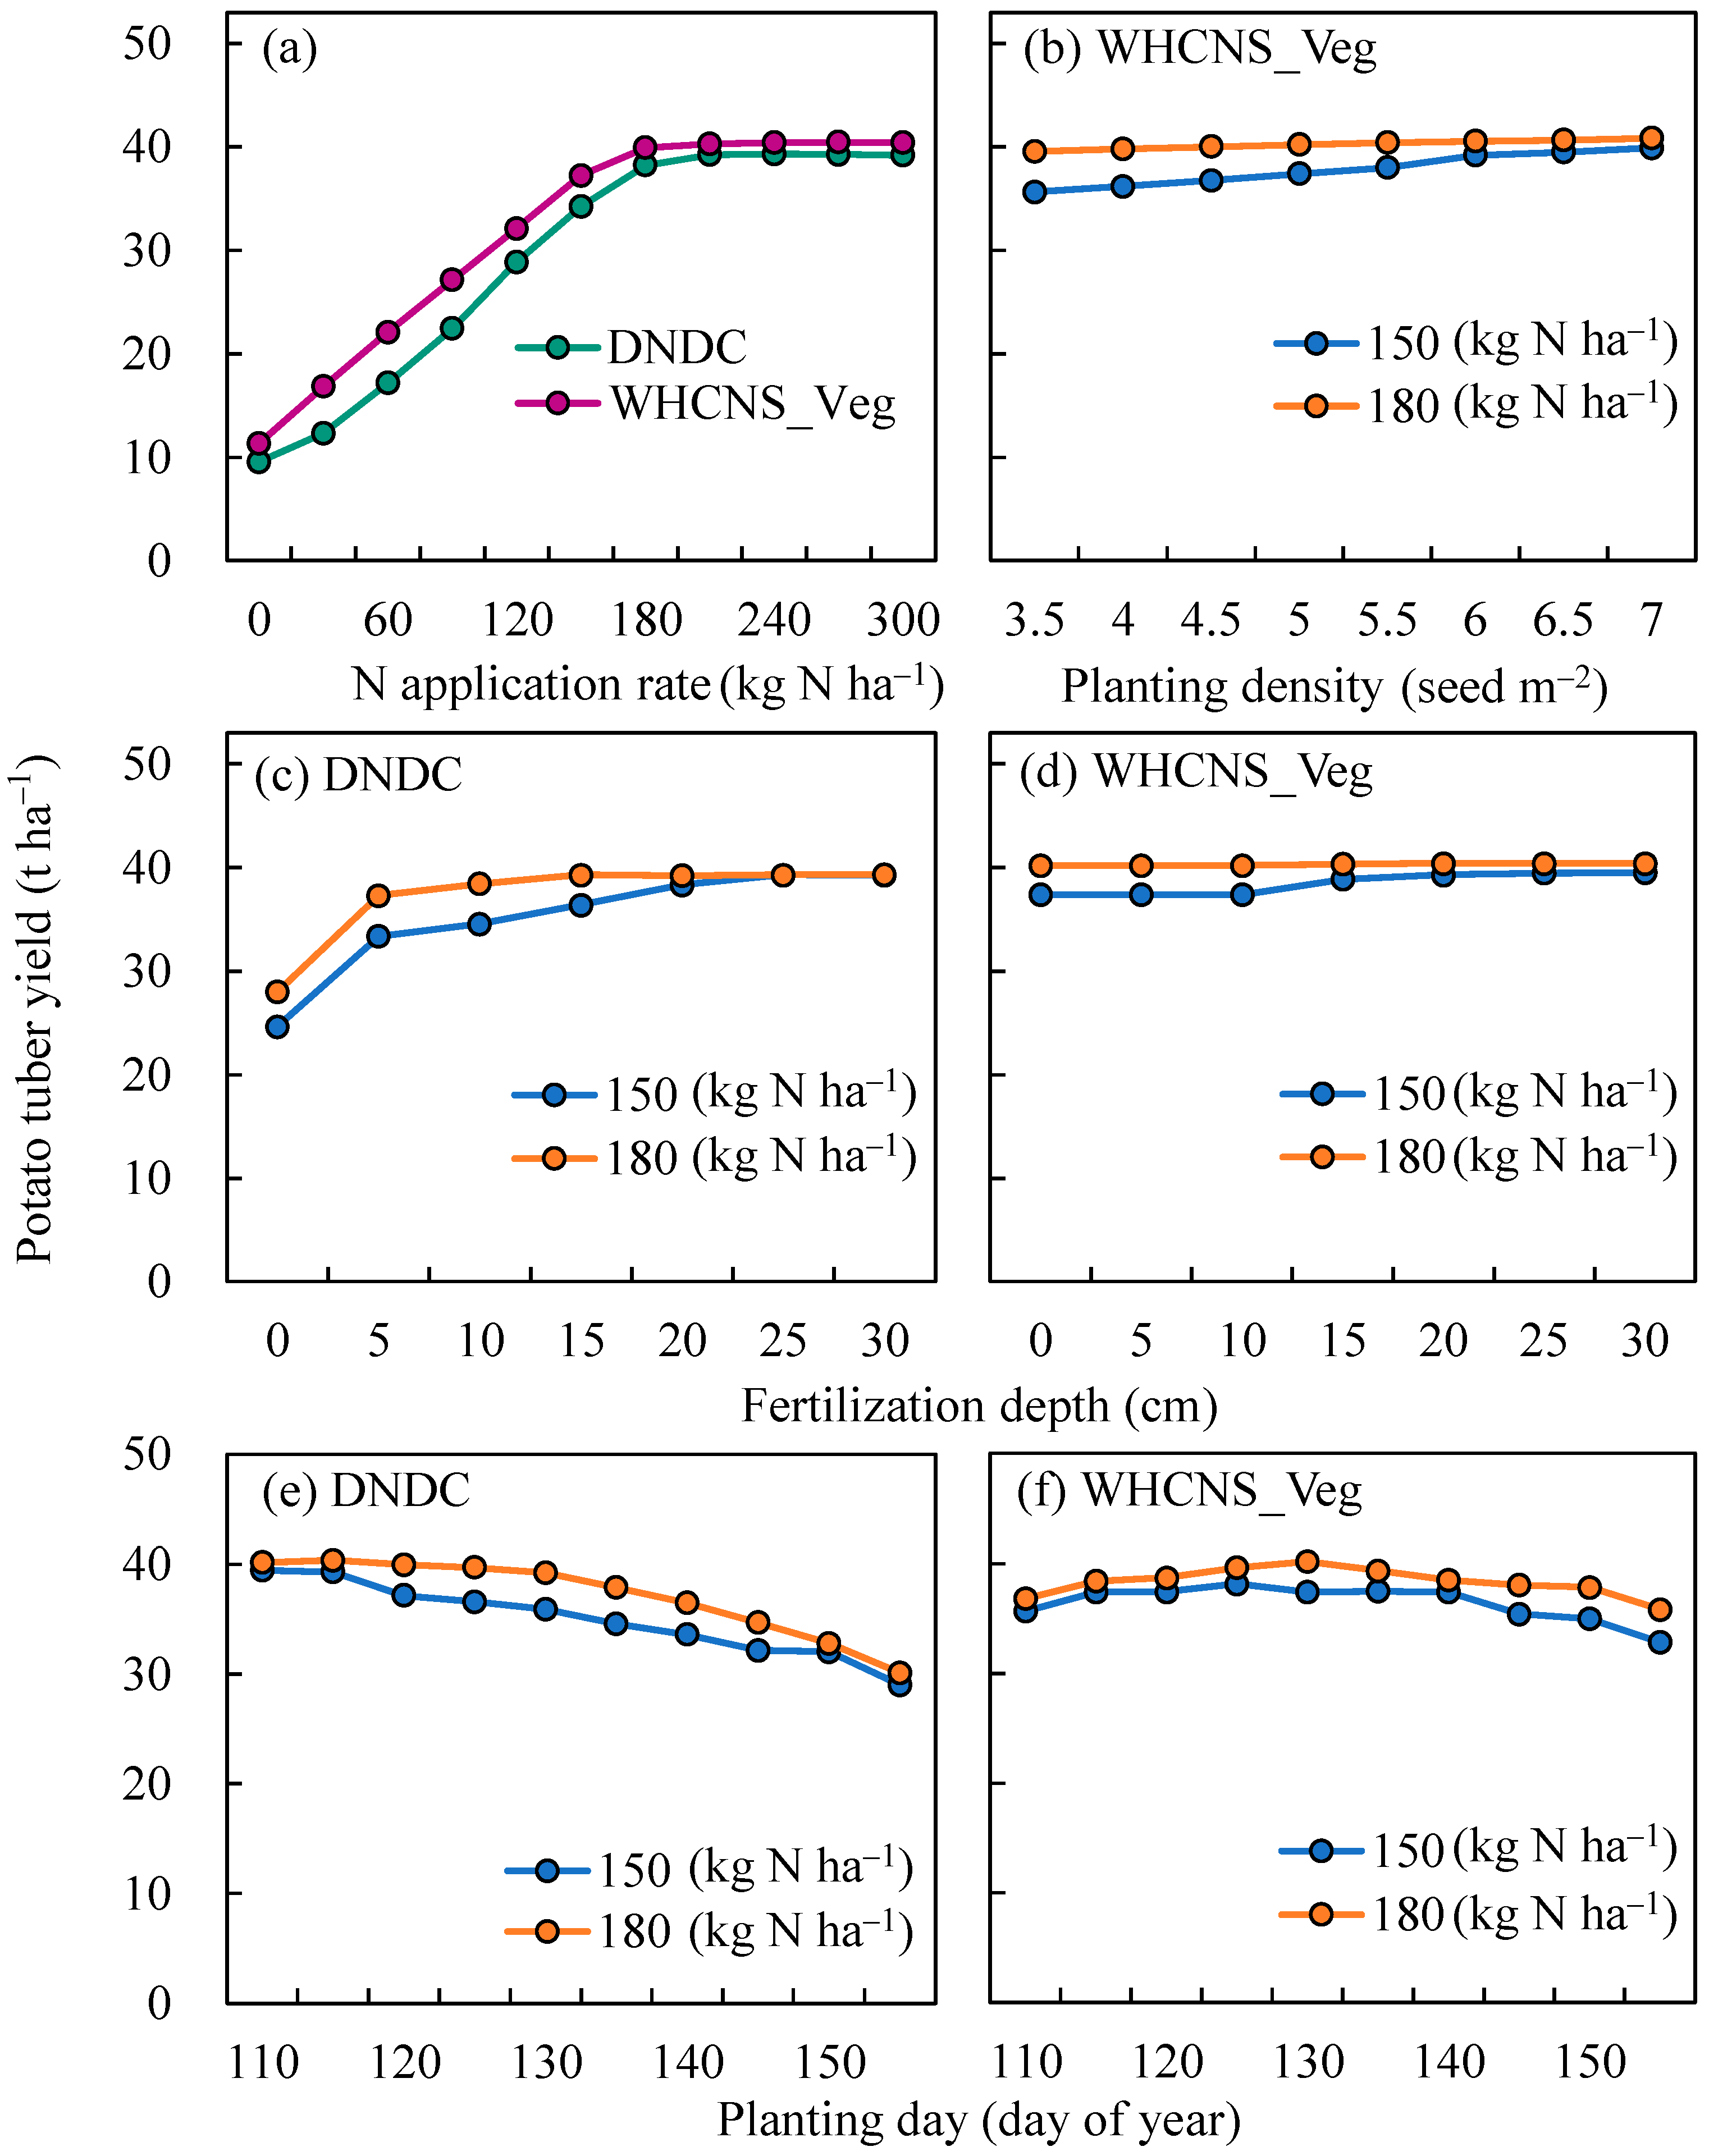
3.2. Sensitivity Analysis for Tuber Yield and Agronomic Efficiency

Sensitivity analysis was used to evaluate the response of the simulated results to the variation of the input parameters. The well-calibrated DNDC and WHCNS_Veg models were used to test how potato tuber yield was influenced by N fertilizer management (e.g., application rate, timing, and depth) and cultivation practices (planting date and density) (Table 2). The management practices of N3 treatment as baseline scenario compared with the scenarios under the situation of changing one of the input parameters while keeping the remaining parameters constant. The simulation results were observed with the response curves of the tuber yield to the different management practices (Figure 6 and Figure S7). The tested input parameters, except for plant density, had significant impacts on tuber yield.

3.2.1. Fertilizer N Application Rate and Timing

There was a linear increase and platform in potato tuber yield when the fertilizer N rates ranged from 0 to 300 kg N ha−1, and the average maximum yields (39.3 and 40.3 t ha−1) were observed at 167 and 185 kg N ha−1 fertilization in the DNDC and WHCNS_Veg model, respectively (Table S6 and Figure S6). The simulated tuber yield of DNDC was lower than that of WHCNS_Veg under the same N application rate. Especially, there was a larger difference for tuber yield at 30–180 kg ha−1 N application rate between two models (Figure 6a), which may be due to the different responses of yield to N-stress for the two models.
Split N application was recommended to increase crop fertilizer N utilization by improving the synchrony between N supply in soil and crop N demand [46,47]. In this study, the sensitivity results of the N application rate and timing were different between the two models (Figure S7). For the DNDC model, the maximum tuber yield and AEN was obtained at 180 kg N ha−1 with the 1/4:1/4:1/2 applied ratio at planting, emergence, and tuber bulking (Table 7), which reduced 30 kg ha−1 N input and achieved increased N recovery efficiency by 12% than that under the baseline scenario. Overall, three-split N fertilization had a higher yield and N use efficiency compared to two-split (Table 7). Li and Jin [2] advised that three or four splits application could improve yield and N use efficiency for potato in high irrigation or precipitation areas. For the WHCNS_Veg model, the maximum tuber yield and N use efficiency were obtained at 150 kg N ha−1 application rate with the 2/3:1/3 applied ratio and two-splitting application at planting and emergence stages. Rens et al. [47] reported that the N application at emergence had a large impact on tuber yield, which supported the simulated result of the WHCNS_Veg model. However, Li and Jin [2] indicate that N was accumulated rapidly during the tuber bulking stage, and the recommended application ratios were 2/5 and 3/5 of total N amount at the planting and tuber bulking stage, respectively. The different response of N stress on potato growth in the two models resulted in the difference of fertilizer N application rate and timing. The actual N uptake is limited by the difference in availability of N with demand N that is calculated based on the optimum daily crop growth and the plant C/N ratio in DNDC [32]. In contrast, N uptake was simulated based on the function of GDD, and crop actual, critical and minimum N content in WHCNS_Veg [48]. Thus, more field experiments need to be conducted to verify the modelling results and provide data for further model development.

3.2.2. Fertilization Depth

The DNDC model had greater sensitivity for the N fertilization depth than the WHCNS_Veg model (Figure 6c,d). Urea surface fertilization largely reduced the potato tuber yield based on the DNDC modelling. In contrast, the yield sharply increased when the fertilization depth was 5 cm and then gradually increased when N fertilization depth ≥ 10 cm. Interestingly, when the N fertilization depth ≥ 20 cm, the potato tuber yield of 150 kg N ha−1 application was close to the yield of 180 kg N ha−1 application, which indicated that optimizing N applied depth could reduce N application rate. For the WHCNS_Veg model simulations, the tuber yield at 180 kg ha−1 N application was not affected by fertilization depth, but the tuber yield of 150 kg ha−1 N application was close to the yield of 180 kg ha−1 N fertilization when fertilization depth ≥ 15 cm. Haque [49] also indicated that the tuber yield under urea deep fertilization (7 cm depth) increased by 38% compared with the broadcast. Nkebiwe et al. [50] used meta-analysis to illustrate that the urea applied observed a 9.4% yield increase for tuber crops at > 10 cm depth than the broadcast fertilization. In our study, the yield of deep fertilization averagely increased by 24.1% (ranging from 0.5 to 59.3%) compared to that of surface fertilization. This is mainly due to how the urea deep placement prolonged the duration of N availability for about 2 months and effectively minimized NH3 volatilization losses [51]. Overall, this study suggested urea fertilization depth at 15–25 cm for potato.

3.2.3. Planting Density

The sensitivity analysis indicated that the potato tuber yield was not sensitive to planting density as N applied rate at 180 kg ha−1 with the WHCNS_Veg model. However, the tuber yield raised gradually with the planting density from 3.5 to 6 seed m−2 at 150 kg ha−1 N applied rate, and when planting density ≥ 6 seed m−2, the yield almost approached the yield of 180 kg ha−1 N applied rate (Figure 6b). Getie et al. [52] revealed that a planting density of 6.67 seed m−2 obtained the optimum yield (36 t ha−1) with 110 kg ha−1 N application rate based on the experiment results in Eastern Ethiopia. Previous report indicated that leaf type could affect potato planting density. For example, Duan et al. [53] suggested that the planting density for types of spreading-leaf and uprush-leaf were 5.7 and 7.1 seed m−2, respectively, which had a reasonable canopy structure and a higher commodity rate and yield. The WHCNS_Veg model did not consider the impact of leaf type on planting density, which was a limitation of the current model. In addition, the DNDC model is not able to simulate the impacts of planting density on crop growth, which needs to be developed in the future based on more field experiments.

3.2.4. Planting Date

Optimizing planting date had a large potential in increasing yield and N use efficiency by adjusting thermal time and precipitation [11,54]. According to the sensitivity analysis, the simulated yields based on the two models responded differently to the planting dates (Figure 6e,f), and the maximum yield was recorded at the planting date of day 115 (25 April) and 130 (10 May) with the DNDC and WHCNS_Veg model, respectively. The optimal planting date of the DNDC model was 15 days earlier than that of the baseline scenario. Hospers-Brands et al. [55] reported that the early planting date in the Netherlands (29 March to 1 April) and the United Kindom (10 April to 3 May) obtained a higher yield than the late planting date (1 May to 17 May). The optimal planting date of the WHCNS_Veg model was comparable to the planting date of the baseline scenario. Tang et al. [41] reported that the optimized planting date was day 140 (May 20) in the same area based on the simulation of the APSIM-potato model. This inconsistency may be partially due to the different potato growth responses to planting dates in different models. The crop growth is simulated driven by the accumulative temperature, N uptake, and water stress in DNDC [32], while the accumulated daily dry matter is calculated according to the Monteith function [56] which is related to the leaf area, radiation, and energy conversion coefficient in WHCNS_Veg.

3.3. Combination of Optimized Management Practices

Based on sensitivity analysis, the optimized management practices were combined to simulate yield and N use efficiency. The optimized N application rate and depth were 150–180 kg N ha−1 and 25 cm for both models (Table 7). The recommended N fertilization split ratio was 1/4:1/4:1/2 at the planting, emergence, and tuber bulking, respectively, and potato seeding date was at day 115 for the DNDC model. For the WHCNS_Veg model, the optimal N fertilizer was applied at planting and emergence with a 2/3:1/3 ratio, and potato seeding date was at day 130 with 6 seed m−2 planting density. Potato tuber yield and N use efficiency increased when all optimized management practices were combined (Table 7). The simulations of both models under the combined optimal management practices could reduce 30–60 kg N ha−1 N fertilizer rate, and increase the tuber yield, PFPN, AEN and REN by 1.1–3.0%, 21.2–44.2, 45.7–56.0 kg kg−1, and 7.3–10%, compared with the baseline scenario. Getie et al. [52] also demonstrated that the optimized N rate of 110 kg N ha−1 combined planting density of 6.67 seed m−2 obtained the maximum tuber yield, PFP, and AEN. Therefore, integrated management practices have great potential in achieving high yield and N use efficiency with reduction of N fertilizer input.

4. Conclusions

The DNDC and WHCNS_Veg models were tested based on a four-year potato experiment in the northwestern China. The models performed well in simulating potato tuber yield, above-ground biomass, crop N uptake, and soil temperature in N-applied treatments, and showed reasonable performance in simulating soil moisture and inorganic N content. However, both models performed “poor” or “fair” in simulating soil inorganic N under N0 and N4 treatments, which was likely due to the underestimation of soil N mineralization under N stress and under-predicted crop N uptake under excess N conditions. This is related to the shortage of the response of the physiological changes of crops under stress conditions in current models. The suggestion for further studies is that the effect of different N application rates on the responses of the physiological characteristics and potato yield based on long-term field experiments should be explored and incorporated into the model for improving the performance. Furthermore, a specific-site measurement for assessing the performance of crop models is usually limited; thus, additional multi-location experimental datasets over a range of climate variability need to be conducted for understanding the model performance at the regional level. The sensitivity analyses of different variables and interaction effect of multiple variables (fertilizer application rate, timing and depth, and planting date and density) on yield and N uptake based on the validated models indicated that the potato yield and N use efficiency could be further improved with integrated fertilizer and cultivation management practices. This study illustrates a modeling approach is an effective way for optimizing multiple management practices, which is useful to provide fertilization management recommendations for policy decisions.

Supplementary Materials

The following are available online at https://www.mdpi.com/article/10.3390/agronomy11091858/s1, Figure S1: Annual and seasonal average climate conditions of the experimental site across the years from 1981 to 2020. Figure S2: Measured and simulated potato above-ground biomass from 2017 to 2020 under different N application treatments using the DNDC and WHCNS_Veg models in Wuchuan, China. Figure S3: The linear regression between measured and simulated soil temperature (n = 365) using the DNDC and WHCNS_Veg models at (a) 0.1 m and (b) 0.3 m soil depths. Figure S4: The linear regression between simulated and measured soil moisture (n = 24) with (a) DNDC model and (b) WHCNS_Veg model for different treatments. Figure S5: The linear regression between simulated and measured soil inorganic nitrogen content (n = 24) with (a) DNDC and (b) WHCNS_Veg models for different treatments. Figure S6: The linear plus platform regression between N application rate and simulated potato tuber yield using the DNDC and WHCNS_Veg model. Figure S7: Sensitivity of potato tuber yields to N fertilizer application ratio of (a1,b1) two-time splitting (fertilization at planting and emergence or tuber bulking stage) and (a2,b2) three-time splitting (fertilization at planting, emergence and tuber bulking stage) in the (a1–2) DNDC and (b1–2) WHCNS_Veg model. Table S1: Soil physical and chemical properties at 0–0.6 layer in the experimental site. Table S2: Fertilizer application rate of nitrogen (N), phosphorus (P), and potassium (K) across all the treatments from 2017 to 2020. Table S3: The default and calibrated parameters of the DNDC model for potato at experimental site. Table S4: The default and calibrated parameters of the WHCNS_Veg model for potato at experimental site. Table S5: Potato straw and tuber N content in different treatments across 4-year experiment. Table S6: Statistical analysis of potato tuber yield and plant nitrogen uptake for different treatments across the 4-year experiment.

Author Contributions

Conceptualization, L.J., W.H., R.J. and P.H.; Formal analysis, L.J.; Funding acquisition, P.H.; Investigation, J.Z. and Y.D.; Methodology, L.J., W.H., R.J., J.Z. and Y.D.; Project administration, P.H.; Resources, P.H.; Software, W.H.; Supervision, P.H.; Writing—original draft, L.J.; Writing—review & editing, W.H., R.J. and P.H. All authors have read and agreed to the published version of the manuscript.

Funding

This research was support by the National Natural Science Foundation of China (No.31972515) and National Key Research and Development Program of China (No. 2016YFD0200101) and Agriculture Research System of China (CARS-09-P31) and Science and Technology Major Project of Inner Mongolia (No. 2021GG0010).

Institutional Review Board Statement

Not applicable.

Informed Consent Statement

Not applicable.

Data Availability Statement

Relevant data applicable to this research are within the paper.

Acknowledgments

The authors gratefully acknowledge Hao Liang and Yang Li from the College of Resources and Environmental Sciences in China Agricultural University for the contribution to the WHCNS_Veg (2.0) model and the daily soil temperature value data.

Conflicts of Interest

The authors declare no conflict of interest.

References

  1. Food and Agricultural Organization of the United Nation. FAOSTAT Statistical; FAO: Rome, Italy, 2021. [Google Scholar]
  2. Li, S.; Jin, J. 4R Nutrient Management Practices for Potato Production in China. Better Crops 2012, 96, 20–23. [Google Scholar]
  3. Qin, Y.; Yu, J.; Chen, Y.; Jia, L.; Qiqige, S.; Fan, M. Situation of Fertilization and Fertilizer Use Efficiency on Irrigated Potato in Inner Mongolia. China Veg. 2019, 11, 75–79. [Google Scholar]
  4. Xu, Y.; He, P.; Qiu, S.; Xu, X.; Ma, J.; Ding, W.; Zhao, S.; Gao, Q.; Zhou, W. Regional variation of yield and fertilizer use efficiency of potato in China. J. Plant Nutr. Fertitizer 2019, 25, 22–35. [Google Scholar]
  5. Gao, X.; Li, C.; Zhang, M.; Wang, R.; Chen, B. Controlled release urea improved the nitrogen use efficiency, yield and quality of potato (Solanum tuberosum L.) on silt loamy soil. Field Crop. Res. 2015, 181, 60–68. [Google Scholar] [CrossRef]
  6. Jiao, F.; Wu, J.; Yu, L.; Zhai, R. 15N tracer technique analysis of the absorption and utilisation of nitrogen fertiliser by potatoes. Nutr. Cycl. Agroecosyst. 2013, 95, 345–351. [Google Scholar] [CrossRef]
  7. Xu, Y. Methodology of Fertilizer Recommendation Based on Yield Response and Agronomic Efficiency for Potato. Master’s Thesis, Jilin Agricultural University, Jilin, China, 2018. [Google Scholar]
  8. Vos, J. Nitrogen Responses and Nitrogen Management in Potato. Potato Res. 2010, 52, 305–317. [Google Scholar] [CrossRef]
  9. Cui, Z.; Zhang, H.; Chen, X.; Zhang, C.; Ma, W.; Huang, C.; Zhang, W.; Mi, G.; Miao, Y.; Li, X.; et al. Pursuing sustainable productivity with millions of smallholder farmers. Nature 2018, 555, 363–366. [Google Scholar] [CrossRef] [PubMed]
  10. Taheri, S.; Shamabadi, Z. Effect of planting date and plant density on potato yield, approach energy efficiency. Int. J. Agric. Crop. Sci. IJACS 2013, 5, 747–754. [Google Scholar]
  11. Tang, J.; Wang, J.; Wang, E.; Yu, Q.; Yin, H.; He, D.; Pan, X. Identifying key meteorological factors to yield variation of potato and the optimal planting date in the agro-pastoral ecotone in North China. Agric. For. Meteorol. 2018, 256, 283–291. [Google Scholar] [CrossRef]
  12. Fayera, W.N. Yield and yield components of potato (Solanum tuberosum L.) as influenced by planting density and rate of nitrogen application at Holeta, West Oromia region of Ethiopia. Afr. J. Agric. Res. 2017, 12, 2242–2254. [Google Scholar] [CrossRef] [Green Version]
  13. Wang, C.; Zang, H.; Liu, J.; Shi, X.; Li, S.; Chen, F.; Chu, Q. Optimum nitrogen rate to maintain sustainable potato production and improve nitrogen use efficiency at a regional scale in China. A meta-analysis. Agron. Sustain. Dev. 2020, 40, 1–14. [Google Scholar] [CrossRef]
  14. Kim, Y.U.; Lee, B.W.; Heu, S.; Shim, K.B.; Kim, S. Potato Yield Gaps in North Korea and Strategies to Close the Gaps. Agronomy 2020, 10, 1605. [Google Scholar] [CrossRef]
  15. Jiang, R.; He, W.; Zhou, W.; Hou, Y.; Yang, J.Y.; He, P. Exploring management strategies to improve maize yield and nitrogen use efficiency in northeast China using the DNDC and DSSAT models. Comput. Electron. Agric. 2019, 166, 104988. [Google Scholar] [CrossRef]
  16. Divya, K.L.; Mhatre, P.H.; Venkatasalam, E.P.; Sudha, R. Crop Simulation Models as Decision-Supporting Tools for Sustainable Potato Production: A Review. Potato Res. 2021, 64, 387–419. [Google Scholar] [CrossRef]
  17. Raymundo, R.; Asseng, S.; Cammarano, D.; Quiroz, R. Potato, sweet potato, and yam models for climate change: A review. Field Crop. Res. 2014, 166, 173–185. [Google Scholar] [CrossRef]
  18. Wang, H.; Cheng, J.; Zhao, H.; Wang, Z. Optimum Management of Water and Fertilizer for Potato in Soft Rock and Sand Compound Soil Based on WHCNS Model: Model Calibration and Validation. IOP Conf. Ser. Earth Environ. Sci. 2018, 170, 022170. [Google Scholar] [CrossRef] [Green Version]
  19. Wang, L.; Guo, K.; Li, M.; Xu, Q.; Tian, J.; Zhang, K.; Guo, Y.; Gao, X. Research on the Effect of Multifactor of DNDC Model on N2O Emission and Yield of Potato Field. Ecol. Environ. Sci. 2019, 28, 1141–1151. [Google Scholar]
  20. He, W.; Dutta, B.; Grant, B.B.; Chantigny, M.H.; Hunt, D.; Bittman, S.; Tenuta, M.; Worth, D.; VanderZaag, A.; Desjardins, R.L.; et al. Assessing the effects of manure application rate and timing on nitrous oxide emissions from managed grasslands under contrasting climate in Canada. Sci. Total Environ. 2020, 716, 135374. [Google Scholar] [CrossRef]
  21. Guo, K.; Hou, Y.; Wang, L.; Gao, X.; Li, M.; Guo, S. Study on the Optimal Nitrogen Application Rate with N2O Emission Reducing and Yield Increasing under Mulching in Potato Field Based on DNDC Model. Ecol. Environ. Sci. 2018, 27, 1658–1664. [Google Scholar]
  22. Gilhespy, S.L.; Anthony, S.; Cardenas, L.; Chadwick, D.; del Prado, A.; Li, C.; Misselbrook, T.; Rees, R.M.; Salas, W.; Sanz-Cobena, A.; et al. First 20 years of DNDC (DeNitrification DeComposition): Model evolution. Ecol. Model. 2014, 292, 51–62. [Google Scholar] [CrossRef] [Green Version]
  23. Nendel, C.; Schmutz, U.; Venezia, A.; Piro, F.; Rahn, C.R. Converting simulated total dry matter to fresh marketable yield for field vegetables at a range of nitrogen supply levels. Plant Soil 2009, 325, 319–334. [Google Scholar] [CrossRef] [Green Version]
  24. Liang, H.; Hu, K.; Batchelor, W.D.; Qin, W.; Li, B. Developing a water and nitrogen management model for greenhouse vegetable production in China: Sensitivity analysis and evaluation. Ecol. Model. 2018, 367, 24–33. [Google Scholar] [CrossRef]
  25. Liang, H.; Hu, K.L.; Batchelor, W.D.; Chen, Q.; Liang, B.; Li, B.G. Modeling dissolved organic nitrogen dynamics under different N management practices for intensive greenhouse production using an improved WHCNS_veg model. Geoderma 2019, 337, 1039–1050. [Google Scholar] [CrossRef]
  26. IUSS Working Group, WRB World Reference Base for Soil Resources. International Soil Classification System for Naming Soils and Creating Legends for Soil Maps; World Soil Resources Report No. 106; Food and Agriculture Organization of The United Nations: Rome, Italy, 2015. [Google Scholar]
  27. United States Department of Agriculture. Soil Texture Calculator. 2021. Available online: https://www.nrcs.usda.gov/wps/portal/nrcs/detail/?cid=nrcs142p2_054167 (accessed on 29 July 2021).
  28. He, P.; Jin, J.; Pampolino, M.F.; Johnston, A.M. Approach and decision support system based on crop yield response and agronomic efficiency. Plant Nutr. Fertitizer Sci. 2012, 18, 499–505. [Google Scholar]
  29. Bao, S. Soil Agrochemical Analysis, 3rd ed.; Agriculture Press: Beijing, China, 2000. [Google Scholar]
  30. Li, C.; Frolking, S.; Frolking, T.A. A model of nitrous oxide evolution from soil driven by rainfall events: 1. Model structure and sensitivity. J. Geophys. Res. Atmos. 1992, 97, 9759–9776. [Google Scholar] [CrossRef]
  31. Li, C.; Farahbakhshazad, N.; Jaynes, D.B.; Dinnes, D.L.; Salas, W.; McLaughlin, D. Modeling nitrate leaching with a biogeochemical model modified based on observations in a row-crop field in Iowa. Ecol. Model. 2006, 196, 116–130. [Google Scholar] [CrossRef]
  32. Li, C.; Frolking, S.; Harriss, R. User’s Guide for the DNDC Model; Institute for the Study of Earth, Oceans and Space, University of New Hampshire: Durham, NH, USA, 2012. [Google Scholar]
  33. Liang, H.; Hu, K.; Sun, Y.; Lu, H.; Lin, S. Integrated water and nitrogen management model of WHCNS_Veg for greenhouse vegetable production system. Trans. Chin. Soc. Agric. Eng. 2020, 36, 96–105. [Google Scholar]
  34. Liang, H.; Hu, K.; Li, B.; Liu, H. Coupled simulation of soil water heat carbon nitrogen process and crop growth at soil-plant-atmosphere continuum system. Trans. Chin. Soc. Agric. Eng. 2014, 30, 54–66. [Google Scholar]
  35. Nash, J.E.; Sutcliffe, J.V. River flow forecasting through conceptual models part I—A discussion of principles. J. Hydrol. 1970, 10, 282–290. [Google Scholar] [CrossRef]
  36. Willmott, C.J.; Ackleson, S.G.; Davis, R.E.; Feddema, J.J.; Klink, K.M.; Legates, D.R.; O’Donnell, J.; Rowe, C.M. Statistics for the evaluation and comparison of models. J. Geophys. Res. 1985, 90, 8995–9005. [Google Scholar] [CrossRef] [Green Version]
  37. Moriasi, D.N.; Arnold, J.G.; Van Liew, M.W.; Bingner, R.L.; Harmel, R.D.; Veith, T.L. Model evaluation guidelines for systematic quantification of accuracy in watershed simulations. Trans. Asabe 2007, 50, 885–900. [Google Scholar] [CrossRef]
  38. Ahuja, L.R.; Rojas, K.W.; Hanson, J.D.; Shaffer, M.J.; Ma, L. Root Zone Water Quality Model: Modelling Management Effects on Water Quality and Crop Production; Water Resources Publications: Highlands Ranch, CO, USA, 2000. [Google Scholar]
  39. Yang, J.M.; Yang, J.Y.; Liu, S.; Hoogenboom, G. An evaluation of the statistical methods for testing the performance of crop models with observed data. Agric. Syst. 2014, 127, 81–89. [Google Scholar] [CrossRef]
  40. Liang, H.; Lv, H.; Batchelor, W.D.; Lian, X.; Wang, Z.; Lin, S.; Hu, K. Simulating nitrate and DON leaching to optimize water and N management practices for greenhouse vegetable production systems. Agric. Water Manag. 2020, 241, 106377. [Google Scholar] [CrossRef]
  41. Tang, J.; Wang, J.; Fang, Q.; Wang, E.; Yin, H.; Pan, X. Optimizing planting date and supplemental irrigation for potato across the agro-pastoral ecotone in North China. Eur. J. Agron. 2018, 98, 82–94. [Google Scholar] [CrossRef]
  42. Xu, X.; He, P.; Pampolino, M.F.; Li, Y.; Liu, S.; Xie, J.; Hou, Y.; Zhou, W. Narrowing yield gaps and increasing nutrient use efficiencies using the Nutrient Expert system for maize in Northeast China. Field Crop. Res. 2016, 194, 75–82. [Google Scholar] [CrossRef]
  43. Zhang, C.; Zhang, Y.; Lu, Z.; Liu, L.; Yang, C. Effect of low nitrogen stress on the seedling growth and root physiological traits of Fagopyrum tataricum cultivars with different low-N treatments. Acta Bot. Boreali-Occident. Sinica 2017, 37, 1331–1339. [Google Scholar]
  44. He, W.; Smith, W.N.; Grant, B.B.; VanderZaag, A.C.; Schwager, E.A.; Qi, Z.; Reynolds, D.; Wagner-Riddle, C. Understanding the Fertilizer Management Impacts on Water and Nitrogen Dynamics for a Corn Silage Tile-Drained System in Canada. J. Environ. Qual. 2019, 48, 1016–1028. [Google Scholar] [CrossRef] [Green Version]
  45. Ruža, A.; Skrabule, I.; Vaivode, A. Influence of Nitrogen on Potato Productivity and Nutrient Use Efficiency. Proc. Latv. Acad. Sci. Sect. B. Nat. Exact Appl. Sci. 2013, 67, 247–253. [Google Scholar] [CrossRef] [Green Version]
  46. Zebarth, B.J.; Rosen, C.J. Research perspective on nitrogen bmp development for potato. Am. J. Potato Res. 2007, 84, 3–18. [Google Scholar] [CrossRef]
  47. Rens, L.R.; Zotarelli, L.; Rowland, D.L.; Morgan, K.T. Optimizing nitrogen fertilizer rates and time of application for potatoes under seepage irrigation. Field Crop. Res. 2018, 215, 49–58. [Google Scholar] [CrossRef]
  48. Liang, H. Establishing Soil Water-Carbon-Nitrogen Process and Crop Growth Joint Model and Its Application of Water and Nitrogen Management. Ph.D. Thesis, China Agricultural University, Beijing, China, 2017. [Google Scholar]
  49. Haque, S.A. Efficiency of Urea Super Granule Point Placement on Potato. Bull. Inst. Trop. Agric. Kyushu Univ. 2005, 28, 21–24. [Google Scholar]
  50. Nkebiwe, P.M.; Weinmann, M.; Bar-Tal, A.; Müller, T. Fertilizer placement to improve crop nutrient acquisition and yield: A review and meta-analysis. Field Crop. Res. 2016, 196, 389–401. [Google Scholar] [CrossRef]
  51. Yao, Y.; Zhang, M.; Tian, Y.; Zhao, M.; Zhang, B.; Zhao, M.; Zeng, K.; Yin, B. Urea deep placement for minimizing NH3 loss in an intensive rice cropping system. Field Crop. Res. 2018, 218, 254–266. [Google Scholar] [CrossRef]
  52. Getie, A.T.; Dechassa, N.; Tana, T. Response of potato (Solanum tuberosum L.) yield and yield components to nitrogen fertilizer and planting density at Haramaya, Eastern Ethiopia. J. Plant Sci. 2015, 3, 320. [Google Scholar]
  53. Duan, H.; Lu, X.; Zhou, X.; Li, G.; Wen, G.; Wang, Y.; Cheng, L.; Zhang, F. Effects of Potato Leaf Type and Planting Density on Yield Components. Crops 2021, 1, 160–167. [Google Scholar]
  54. Hu, Q.; Yang, N.; Pan, F.; Pan, X.; Wang, X.; Yang, P. Adjusting Sowing Dates Improved Potato Adaptation to Climate Change in Semiarid Region, China. Sustainability 2017, 9, 615. [Google Scholar] [CrossRef] [Green Version]
  55. Hospers-Brands, A.J.T.M.; Ghorbani, R.; Bremer, E.; Bain, R.; Litterick, A.; Halder, F.; Leifert, C.; Wilcockson, S.J. Effects of Presprouting, Planting Date, Plant Population and Configuration on Late Blight and Yield of Organic Potato Crops Grown with Different Cultivars. Potato Res. 2008, 51, 131–150. [Google Scholar] [CrossRef]
  56. Monteith, J.L.; Moss, C.J. Climate and the efficiency of crop production in Britain. Philos. Trans. R. Soc. Lond. B Biol. Sci. 1997, 281, 277–294. [Google Scholar]
Figure 1. Measured and simulated potato tuber fresh yield from 2017 to 2020 for different N application treatments using the DNDC and WHCNS_Veg models in Wuchuan, China. (a) N0 treatment; (b) N1 treatment (c) N2 treatment (d) N3 treatment (e) N4 treatment. Vertical bars are standard deviations (n = 3). The N3 treatment was used to the calibrate the model parameters.
Agronomy 11 01858 g001
Figure 2. Measured and simulated potato plant N uptake from 2017 to 2020 for different N application treatments using the DNDC and WHCNS_Veg models in Wuchuan, China. (a) N0 treatment; (b) N1 treatment (c) N2 treatment (d) N3 treatment (e) N4 treatment. Vertical bars are standard deviations (n = 3).
Agronomy 11 01858 g002
Figure 3. Daily soil temperature was compared to measurements at (a) 0.1 m and (b) 0.3 m soil depths using the DNDC and WHCNS_Veg models in Wuchuan, China.
Agronomy 11 01858 g003
Figure 4. Daily simulated and measured soil moisture in the 0–0.2 m (the left of the figure) and 0.2–0.4 m (the right of the figure) in Wuchuan, China. (a) N0 treatment; (b) N1 treatment (c) N2 treatment (d) N3 treatment (e) N4 treatment. Vertical bars represent standard deviations (n = 3).
Agronomy 11 01858 g004
Figure 5. Daily simulated and measured soil inorganic N content at soil layer of 0–0.2 m (the left of the figure) and 0.2–0.4 m (the right of the figure) in Wuchuan, China. (a) N0 treatment; (b) N1 treatment (c) N2 treatment (d) N3 treatment (e) N4 treatment. Vertical bars represent standard deviations (n = 3).
Agronomy 11 01858 g005
Figure 6. Sensitivity of potato tuber yield to (a) N application rate, (b) planting density, (c,d) fertilization depth, and (e,f) planting day from 1981 to 2020 using the DNDC and WHCNS_Veg models in Wuchuan, China.
Agronomy 11 01858 g006
Table 1. The management practices information for potato from 2017 to 2020 at experimental site.
YearTreatmentCultivarPlantingHarvestDensity
(seed m−2)
Seeds
(kg ha−1)
N application Rate (kg ha−1)
(Day of Year)BasalEmergenceTuber Bulking
2017N0Connebeck13225852250000
N1Connebeck13225852250273627
N2Connebeck13225852250415441
N3Connebeck13225852250547254
N4Connebeck132258522508110881
2018N0Jizhang 1213025952250000
N1Jizhang 1213025952250364836
N2Jizhang 1213025952250547254
N3Jizhang 1213025952250729672
N4Jizhang 1213025952250108144108
2019N0Jizhang 1213025941800000
N1Jizhang 1213025941800262652
N2Jizhang 1213025941800393978
N3Jizhang 12130259418005252105
N4Jizhang 12130259418007878157
2020N0Huasong 713126041800000
N1Huasong 713126041800222245
N2Huasong 713126041800333367
N3Huasong 713126041800454589
N4Huasong 7131260418006767134
Table 2. The variable levels for sensitivity analysis.
LevelsFertilizer RateN application RatioPlanting DayFertilizer DepthDensity
(kg N ha−1)BasalEmergenceTuber Bulking(Day of Year)(cm)(seed m−2)
101--11003.5
2301/21/2-11554.0
3601/2-1/2120104.5
4901/32/3-125155.0
51201/3-2/3130205.5
61502/31/3-135256.0
71802/3-1/3140306.5
82101/31/31/3145 7.0
92401/41/41/2150
102701/41/21/4156
113001/21/41/4
Table 3. Statistical calibration between the simulated and measured potato tuber yield, above-ground biomass and nitrogen uptake of N3 treatment using the DNDC and WHCNS_Veg models in Wuchuan, China.
IndexModelMeasuredSimulatedSample No. 1NRMSE (%)NARE (%)
Yield (t ha−1)DNDC38.2537.18125.61−2.61
WHCNS_Veg38.2537.32125.43−2.44
Above-ground biomass
(kg ha−1)
DNDC907585191211.63−6.13
WHCNS_Veg90758717125.99−3.95
N uptake (kg ha−1)DNDC192.6183.91220.76−4.51
WHCNS_Veg192.6183.01222.33−4.99
1 Sample No., number of measurements; NRMSE, normalized root mean square error; NARE, normalized average relative error.
Table 4. Statistical validation between the simulated and measured potato tuber yield, above-ground biomass and nitrogen uptake using the DNDC and WHCNS_Veg models in Wuchuan, China.
IndexTreatmentModelMeasuredSimulatedSample No. 1NRMSE (%)NARE (%)
Yield
(t ha−1)
N0DNDC28.7022.311231.57−21.94
N1DNDC33.5835.071214.904.98
N2DNDC36.3340.131213.4410.38
N4DNDC36.2839.411213.718.46
N0WHCNS_Veg28.7021.521226.71−25.03
N1WHCNS_Veg33.5834.671210.143.23
N2WHCNS_Veg36.3335.271212.77−2.90
N4WHCNS_Veg36.2837.54128.743.45
Above-ground biomass
(kg ha−1)
N0DNDC655456631224.87−13.60
N1DNDC767279581214.703.73
N2DNDC82618556128.693.57
N4DNDC799984711212.115.90
N0WHCNS_Veg655448581227.93−25.88
N1WHCNS_Veg767278581210.952.42
N2WHCNS_Veg826180441213.95−2.64
N4WHCNS_Veg799982461211.933.09
N uptake
(kg ha−1)
N0DNDC116.8134.61232.6315.25
N1DNDC150.4173.91225.6315.63
N2DNDC174.6184.61218.105.70
N4DNDC183.0183.01223.530.02
N0WHCNS_Veg116.8134.21220.2414.91
N1WHCNS_Veg150.4150.21224.75−0.14
N2WHCNS_Veg174.6172.61219.50−1.17
N4WHCNS_Veg183.0183.71225.100.37
1 Sample No., number of measurements; NRMSE, normalized root mean square error; NARE, normalized average relative error.
Table 5. Statistical calibration between the simulated and measured soil temperature, soil moisture and soil inorganic nitrogen using the DNDC and WHCNS_Veg models in Wuchuan, China.
IndexDepth
(m)
ModelMeasuredSimulatedSample
No. 1
NRMSE
(%)
NARE
(%)
EFd
Soil temperature (°C)0.1DNDC7.197.2336559.248.130.860.96
0.1WHCNS_Veg7.196.5536530.34−8.860.960.99
Soil moisture (cm3 cm−3)0–0.2, 0.2–0.4DNDC0.230.232429.011.88−0.260.69
0–0.2, 0.2–0.4WHCNS_Veg0.230.222416.70−5.160.580.91
Soil inorganic N (kg ha−1)0–0.2, 0.2–0.4DNDC59.2263.432469.067.12−0.040.68
0–0.2, 0.2–0.4WHCNS_Veg59.2264.162473.718.35−0.190.67
1 Sample No., number of measurements; NRMSE, normalized root mean square error; NARE, normalized average relative error; EF, Nash–Sutcliffe efficiency; d, index of agreement.
Table 6. Statistical validation between the simulated and measured soil temperature, soil moisture and soil inorganic nitrogen under different N treatments using the DNDC and WHCNS_Veg models in Wuchuan, China.
IndexDepth
(m)
TreatmentModelMeasuredSimulatedSample No. 1NRMSE
(%)
NARE
(%)
EFd
Soil temperature (°C)0.3N3DNDC7.136.9036551.57−3.240.870.96
0.3N3WHCNS_Veg7.136.0436538.78−15.260.930.98
Soil moisture
(cm3 cm−3)
0–0.2, 0.2–0.4N0DNDC0.240.212422.98−10.41−0.180.72
0–0.2, 0.2–0.4N1DNDC0.240.222418.92−6.12−0.100.79
0–0.2, 0.2–0.4N2DNDC0.240.222423.28−8.80−0.840.71
0–0.2, 0.2–0.4N4DNDC0.250.232421.65−4.90−0.60.67
0–0.2, 0.2–0.4N0WHCNS_Veg0.240.222422.12−9.17−0.090.80
0–0.2, 0.2–0.4N1WHCNS_Veg0.240.212423.48−12.22−0.700.64
0–0.2, 0.2–0.4N2WHCNS_Veg0.240.222421.58−9.55−0.580.78
0–0.2, 0.2–0.4N4WHCNS_Veg0.250.222423.63−11.57−0.910.73
Soil inorganic N
(kg ha−1)
0–0.2, 0.2–0.4N0DNDC43.7610.2224103.2−76.65−0.740.51
0–0.2, 0.2–0.4N1DNDC50.5031.952464.37−36.740.100.69
0–0.2, 0.2–0.4N2DNDC53.8346.022467.49−14.520.370.75
0–0.2, 0.2–0.4N4DNDC70.6197.802498.4638.51−0.540.53
0–0.2, 0.2–0.4N0WHCNS_Veg43.7613.5724105.9−68.99−0.830.44
0–0.2, 0.2–0.4N1WHCNS_Veg50.5020.032484.08−60.33−0.540.65
0–0.2, 0.2–0.4N2WHCNS_Veg53.8333.852470.28−37.120.310.79
0–0.2, 0.2–0.4N4WHCNS_Veg70.61145.824155.2106.44−2.820.35
1 Sample No., number of measurements; NRMSE, normalized root mean square error; NARE, normalized average relative error; EF, Nash–Sutcliffe efficiency; d, index of agreement.
Table 7. Recommendations of field management practices based on the sensitivity analyses using the DNDC and WHCNS_Veg models in Wuchuan, China.
ModelIndex 1DefaultNitrogen Fertilizer Ratio and DepthCombined Optimization
1/2:0:1/2 21/4:1/4:1/225 (cm)
DNDCN application rate (kg N ha−1)210150180150180150180150180
Tuber yield (t ha−1)39.2334.6338.4235.9039.2239.2939.3140.3940.42
PFP (kg N kg−1)186.8230.9213.5239.4217.9261.9218.4269.3224.6
AEN (kg N kg−1)48.737.552.346.056.868.657.376.063.5
REN (%)36.741.741.444.342.851.542.952.743.9
2/3:1/3:01/2:1/4:1/425 (cm)
WHCNS_VegN application rate (kg N ha−1)210150180150180150180150180
Tuber yield (t ha−1)40.2840.4740.5140.3940.5040.5140.5240.7440.64
PFP (kg N kg−1)224.1269.8225.1269.3225.0270.0225.1271.6225.8
AEN (kg N kg−1)53.776.464.075.963.976.764.078.364.6
REN (%)34.347.940.247.840.148.240.344.338.8
1 PFP: partial factor productivity; AEN: agronomic efficiency of N; REN: recovery efficiency of N. 2 Nitrogen fertilizer ratio of 1/2:0:1/2 indicates the 1/2, 0 and 1/2 of total N input rate and application at planting, emergence and tuber bulking stage.
Publisher’s Note: MDPI stays neutral with regard to jurisdictional claims in published maps and institutional affiliations.

