Article

An Economic Model of Sustainable Development in the Russian Arctic: The Idea of Building Vertical Farms

1
Institute of Industrial Management, Economics and Trade, Peter the Great St. Petersburg Polytechnic University, 195251 St. Petersburg, Russia
2
Graduate School of Management, St. Petersburg State University, Volkhovskiy Per., 3, 199004 St. Petersburg, Russia
3
Department of Economics, Organization and Production Management, Baltic State Technical University “Voenmekh” Named after D.F. Ustinov, 1st Krasnoarmejskaya Street 1, 190005 St. Petersburg, Russia
4
Humanitarian Institute, Peter the Great St. Petersburg Polytechnic University, 195251 St. Petersburg, Russia
*
Author to whom correspondence should be addressed.
Agronomy 2021, 11(9), 1863; https://doi.org/10.3390/agronomy11091863
Submission received: 21 August 2021 / Revised: 5 September 2021 / Accepted: 13 September 2021 / Published: 16 September 2021
(This article belongs to the Special Issue Economy and Sociology in Sustainable Agriculture)

Abstract

:
The main aim of the article is to find out the key factors of sustainable development of the Russian Arctic, which is strategically significant for Russia. The academic literature was reviewed to find out the time dynamics of the references to the economic models suitable for achieving the goals of sustainable development, and there has been hyperbolic growth in the attention paid to similar problems all around the world. The article compares three relatively new economic models in order to understand which of them is the most applicable to the promotion of sustainable development in the Russian Arctic: (a) bioeconomy, (b) green economy and (c) circular economy. The analysis of the relevant sources shows that the model of the circular economy is preferable for the Russian Arctic. Most of the article is dedicated to understanding the sources and mechanisms of the circular economy. The schematic description of vertical greenhouses and possibility of using vertical farms are presented in the paper as an example of organization of local food production according to the principles of the circular economy. The article considers a modeled project of creating a vertical farm in the Russian Arctic and a simulated indicator—profit of the vertical farm.

1. Introduction

The Arctic region of Russia has an important meaning for the country, both from the economic and geopolitical point of view [1,2,3]. Russia is now in the process of updating its Arctic strategy [4]. Today, the Russian mass media do not have so many sources as there used to be [5]. Thus, it is far from easy to find a detailed analysis of the new official government documents concerning the fundamental policy of the Russian Federation in the Arctic until 2035, apart from some projections [6], conference reports [7], research notes [3,8,9] and news commentaries [10,11]. The comparison of Russia’s national interests in the Arctic, as they are put in the 2020 Main Principles and 2035 Main Principles [12], respectively, demonstrates the influence of the latest amendments to the Constitution of the Russian Federation. Moreover, one can see a noticeable criticism and very cautious and controversial judgements with regard to the strategic areas of development of the Russian Arctic [13]. The main attitude and trends of the above review are quite well reflected in the following quotation: “Today’s Russian Arctic strategy pursues two goals: to outline the national interests of Russia in the Russian Arctic zone and identify the threats or challenges to the national security of Russia in the region” [13] (p. 2).
Indisputably, the enormous significance of the Russian Arctic for the future of Russia can be proven by the following brief but impressive points. Russia has the largest coastline of over 17,500 km; the surface area administratively defined as the Russian Arctic (officially called the Arctic Zone of the Russian Federation) amounts to 1455.47 thousand square miles; and it has the largest Arctic population among other subpolar countries, being around 2378 thousand [14]. The Russian Arctic creates about 12.5% of Russia’s GDP (mostly due to gas and oil production), while its population is just about 1.6% of the total population of the Russian Federation. In order to govern a vast and heterogeneous region such as the Russian Arctic, it is essential to define its boundaries [15]. Things are far from being definitive in this respect. One of the important reasons for that is the lack of precise definition of the territorial units that are part of the Russian Arctic. This has a negative effect when statistics on different periods of time are compared [16]. Moreover, there are virtually no uninterrupted statistical series on these remote regions of Russia. The main problem is that the management decisions taken to implement the concept of sustainable development in the Russian Arctic could be distorted due to ill statistics presented by local responsible officials of administrative units [17]. It seems that the above concept is in the center of the new strategy and program of development of the Russian Arctic, which are about to be adopted [18]. However, despite the fact that today’s Russian Arctic policy declares commitment to the postulates of sustainable development, there are a lot of problems on the way to this goal. First of all, it is necessary to highlight not only the very important problems of financing [19] and institutionalization [20], but also the problems related to the development of the concept of sustainable development of the Russian Arctic [21,22,23]. It is possible to find the roots of these problems in the long-term hibernation of the Russian policy and actions in the Arctic in the first post-Soviet decades. To a large extent, it is true with regard to sustainable development as such and to the Arctic, in particular, as well as to new economic models [24], which should be tailored for the Arctic. This is why studying the theory and practice of sustainable development in the Arctic, primarily applied by well-developed subpolar countries, is of paramount interest.
The representatives of the sustainable development schools often consider that environmental and social problems correspond to the “three legs” in allegorical terms of a three-leg stool model, seeing it as a symbol of sustainability, which is sometimes criticized [25,26] and superimposed on social ecological systems [27,28,29]. However, these systems depend on the maturity of business, and sometimes on geopolitical problems, such as social, human and environmental ones. In effect, according to the 3P paradigm of sustainable development (People–Planet–Profit) [30] and when using a 4C model [31,32] (commerce, community, culture and conservation) or a 5C model (plus financial capital [33]), it is necessary to recognize that the operation of the first two capitals (commerce and community) is based on the investments of the conservation capital. Given the above ideas, the best way to learn about, monitor and tackle the problems we face today when implementing the concept of sustainable development can be found in a geo–socio–economic system (GSE system) [34] or a socio–economic–geographic system [35]. The sets of interconnections between the three mega-domains (People–Planet–Profit) of the above GSE system seem very complex and inconsistent. It is a well-known fact [36,37,38] that any solutions in a closed system aimed at improving the state of one of these mega-domains must lead to a somewhat aggravated state of at least one of the remaining mega-domains, according to Pareto.
The reference to Sustainable Development Goal (SDG) 12 (according to the recently revised version [39]—“Ensuring sustainable consumption and production patterns”) shows a clear formula: sustainable consumption and production is an effective promotion of resources and energy, sustainable infrastructure and main services, environmentally clean and worthy workplaces and a better life quality for everybody [39]. This statement must be emphasized by the very specific and nasty weather in the Arctic. Historically, the structure of consumption in the Arctic and the USSR was fully defined by the system of the so-called “Northern import” (supply to the North), which represented a supply chain supported by sea transportation at a time when the Northern Sea Route was free from heavy ice. The consumers of the Soviet Arctic did not have consumer sovereignty or freedom in choosing their everyday basket and public services. The improved supply logistics and a much higher paycheck now give people more freedom, but lead to unsustainable consumption. While pilotless Arctic technologies exist only in science fiction, resolving the contradiction between unsustainable consumption and a hypothetical sustainable consumption pattern is a vital problem both for the scientists and the experts working on the sustainable consumption pattern in the Arctic.
Supposedly, studying the transformation of the consumer sovereignty model in the sustainable consumption pattern, in the context of transition to new economic models, should lead to sustainable development in the Arctic.
On the basis of the above assumption, Figure 1 shows the structural logic of the article.
The first section of the article substantiates that the Russian Arctic was chosen as an example to apply the model of the circular economy because of a practical rule—it is easier to implement a new model in an empty space, rather than reconstruct something traditional that has been there for a long time. Based on the anthropocentric approach intrinsic to the concept of sustainable development, it is possible to confirm that the consumer is the starting and ending point of any marketing cycle. Consequently, when pursuing Sustainable Development Goal 12 in the Arctic, it is necessary [40] to reach the vital objectives of regional development, related to sustainable development and improvement of the life quality of those living and working in the Russian Arctic, which should be achieved by promoting effective, responsible and clean production systems and a sustainable way of living. However, in order to achieve this goal, we have to transfer from the model of consumer sovereignty, traditional for the market economy, to the model of sustainable consumption as a model of new consumer ethics [41,42] or responsible consumption [43].
Section 2 presents the tools and algorithm for analyzing the economic models that are believed to be suitable for the implementation of sustainable development, as well as the graphs showing the time appearance of these concepts. Section 3 illustrates three conceptual models of the economy for the concept of sustainable development in the Arctic and proves that the circular economy is the most preferable model. Moreover, a multi-dimension analytical description of various opinions about the circular economy is suggested. Section 4 introduces the discussion of the role and place of individual consumption in the circular economy and the ways to include this consumption in the structure of food chains of the economy [44]. Finally, Section 5 contains the conclusions and appeals to further trans-disciplinary research studies in the field of organization of the circular economy and change in the consumption patterns in the Arctic influenced by the sustainability mindset.

2. Research Methods

The research study includes two parts: a theoretical and a practical one.
The theoretical part of the research study includes a review of secondary data and concepts extracted from relevant academic journals, textbooks, reports of international (mostly the UNO) and national organizations, as well as some blogs, critically judged and selected by the authors.
Throughout 2018–2020 the authors identified and analyzed quite a few publications (about 200), referring mostly to the key words of this paper and their logically compiled combinations using Google and Yandex search engines for English and Russian, respectively. To analyze the state and prospects of further development of the research subject, Boolean combinations based on the above-mentioned words and their sequences were chosen as guidelines to select the articles to be purposefully analyzed; namely, (1) (“sustainable development” OR “sustainability” OR “sustainable production” OR “sustainable consumption”) AND (“consumer behavior” OR “consumption pattern”); (2) (“linear economy” OR “green economy” OR “bioeconomy” OR “circular economy”) AND (“Arctic” OR “Arctic environment”); (3) (“sustainability logistics” OR “sustainable logistics”) AND (“circular economy” OR “Arctic” OR “Russian Arctic”); (4) “industrial symbiosis” AND “circular economy”; and (5) “sustainable development AND (“education for sustainability” OR “sustainability literacy”).
This approach to search was adopted following the aim of the article—to review the existing vision of needs in the transformation of the consumption model according to the concept of sustainable development within the circular economy, which will, supposedly, be implemented in the Arctic. Willing to obtain a “fresh flow” of concepts, our literature review was not limited by the sources indexed by Scopus/WoS, but included so-called “grey” literature, which items can be found in the References. Moreover, the Dimensions platform (https://app.dimensions.ai/discover/publication, accessed on 25 November 2020) was used to build the graphs of the new models of the economy (green economy, bioeconomy and circular economy) against the number of publications on sustainable development per year (Figure 2). By and large, it correlates with the most detailed bibliographic analysis that we have found [45], and represents a sort of quantitative evidence for the preference of the circular economy models in our case.
The practical part includes the determination of quantitative estimates of the indicators of the food production process in Arctic conditions using vertical farms. These indicators include the following: costs and duration of creating a vertical farm, the price of products grown, the profit of one farm and others. Analytical methods are usually used to determine quantitative estimates of the economic indicators of various technical and economic systems. Traditional methods of determining the indicators of technical and economic systems consist of an analytical calculation based on average expected indicators. However, this method for vertical farms is imprecise, too complicated and impossible, since there is no initial information for the designed vertical farms, the system is complex, and its behavior is determined by random characteristics. Therefore, simulation modeling is used. Compared to analytical calculations, simulation modeling allows much better consideration of all the complexity and stochastics of a vertical farm, since it allows one to reproduce the behavior of the system with a certain degree of accuracy. In addition, the simulation model automatically provides confirmation of the calculated data by numerical experiment.
The process of creating vertical farms for producing groceries as a factor of sustainable consumption was modeled by an alternative graph. When modeling the process in which a complex technical system is created, directed alternative graphs can be used. In our case, the creation of a vertical farm was reflected in the form of a directed acyclic graph. A directed acyclic graph is a digraph that lacks directed cycles, but can have “parallel” ways going out from the same node and coming into the end node in various ways. As the process of creating the vertical farm for food production is simulated, the type of the vertical farm can be selected, including factors such as the duration of creation, the cost of creation and the technical parameters of the vertical farm, such as productivity. The simulation method was used for quantitative evaluation of individual parameters of the vertical farm. One of the methodologies of simulation—system dynamics—was chosen. The simulation methodology of system dynamics was chosen because it implies a very high level of abstraction of the projected profit of the vertical farm. The simulation was carried out using the AnyLogic program. System dynamics is the simulation methodology which suggests that graphic charts are built to demonstrate the causal links and global impacts of some parameters on some others in time, and then, the model, created on the basis of these charts, is imitated on a computer. In this case, the simulation method is virtually the only research tool that we apply, since there is no information about the use of vertical farms for meeting the need for food products in Arctic conditions.

3. Results

3.1. Analyzing the Theoretical Features of the Bioeconomy, Green Economy and Circular Economy in Terms of Sustainable Development of the Russian Arctic

The declarations of the UNO summits, scientific papers, conference reports and other works lack any convincing proof of the practical use of sustainable development (or, which is more obvious, inclusive and sustainable development [46] for business). At the same time, along with the opportunities that are so good for sustainable development, there is a point of doubt, skepticism and criticism [26,47,48,49]. It is not necessary to consider the “dark side” of sustainable development [50]. It is possible to find a far more precise and “wise” judgement about sustainable development among the general public in [37] (p. 1): sustainable development is the term that everybody knows, but nobody knows what it means (anyway, it sounds better than “unsustainable development”). A civilized human being wants to have essential resources such as clean air, spring water and organic food. At the same time, he or she is also willing to use the fruits of modern civilization, such as, for example, the internet, TV, air travel, videogames, mobile digital devices, etc., whose production damages the environment and limits the consumption of clean air, spring water and organic food, necessary for quality life. Not touching upon the fundamentals of today’s socio-economic systems, we need to pay attention to new economic models, which, in our opinion, reflect the objectives of the practical implementation of sustainable development. Such new economic models include the bioeconomy, the green economy and the circular economy.
The bioeconomy can be defined as an economy where the main building blocks for materials, chemicals and energy are obtained from renewable biological resources [51]. The bioeconomy is seen as a “greener” alternative to previous unsustainable models of economy, where resources (materials, chemical substances, energy) are presented by renewable biological resources, such as genetic resources, organisms or their parts, populations, or any other biotic components of ecosystems, which have real or potential value for humankind. The conceptual grounds of the bioeconomy are presented as a new epistemic paradigm inextricably entwined with sustainable development [52]. However, in comparison with the green economy, the bioeconomy in the Arctic should be seen as a narrower domain, where the concept of sustainable development can be put into practice. This happens thanks to the contrasting of the scale of activity of animated and inanimate nature in favor of the latter due to the harsh climate. The main difficulty in developing the bioeconomy in the Arctic, we believe, is the natural essence of the value carriers in bioeconomic systems, which create a set of obstacles in bioeconomic supply chains (extraction/production, processing, transportation, storage of biological objects). Differently from the obstacles for the development of the bioeconomy in Europe [53], they have to consider the harsh climate and excessively long supply chains as the major serious handicap to the growth of the bioeconomy in the Arctic.
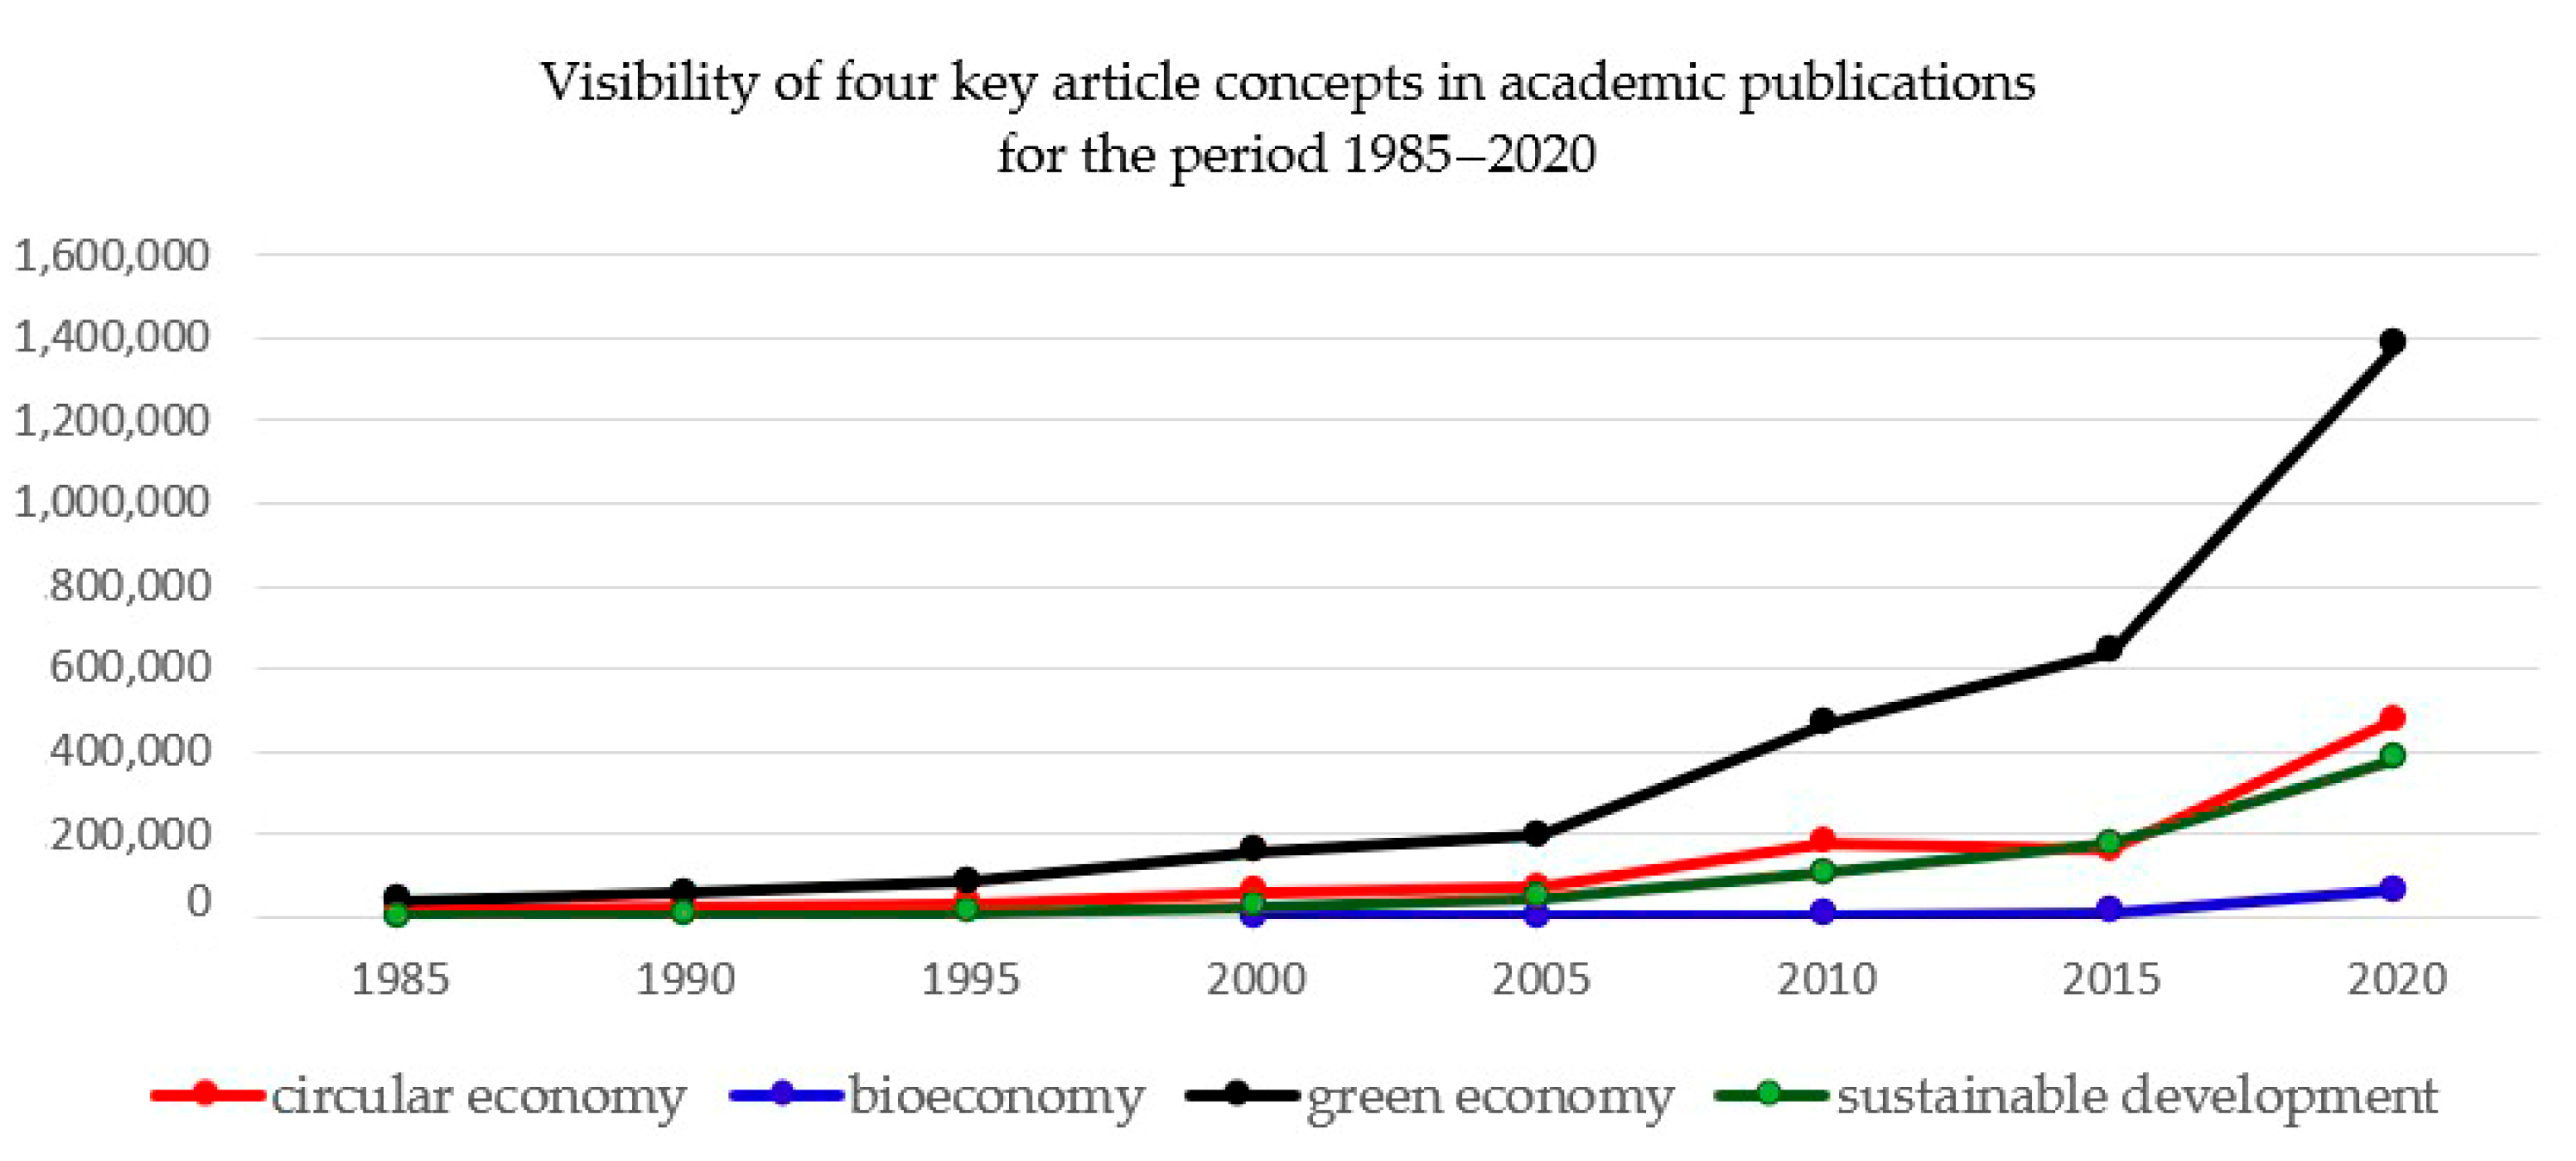
Talking of the prospects of the model of the green economy in the Arctic, above all, it should be mentioned that politics has had a considerable influence on this matter [54]. This phenomenon is demonstrated in the form of the trajectory of the upper gray graph in Figure 2. Then, content analysis (Section 2) shows that the number of papers discussing “green” economy or its goals is much greater than the number of articles suggesting methods for building the green economy. Moreover, it is possible to see direct contradictions between the socio-economic goals of the green economy and the constraints for building this economy (Table 1). What is more, the concept of the “green” economy itself is sometimes criticized as an inadequate response to the unsustainability and inequality that appeared at the previous historical stages of capitalism [55]. At the same time, it is worth highlighting the very rational approach of the EU towards the green economy, which includes the following vectors [56]: (1) using technological, organizational and social innovations; (2) resource efficiency; (3) waste treatment; (4) managing water resources; and (5) maintaining the sustainable system of consumption and production. Transferring from the common issues of the green economy in today’s world to its implementation in the Arctic, we should note that the ambitious plans of sustainable development in the Russian Arctic also demonstrate the features of the green economy [57]. Here, the “green” political motive of sustainable development prevails too, defining the objectives, rather than the methods of pursuing the Russian Arctic policy.
The concept of the circular economy offers business new opportunities in the Arctic. The circular economy is usually presented in the light of the economy using the so-called 5R mnemonic (reduce + reuse + renovate + repair + recycle) [61,62] (Figure 3).
A good metaphor for demonstrating the circular economy is a live cell, which through effective metabolism processes many materials inside the cell wall and reduces exchange with the external environment [63].
The circular economy, the idea of which comes from nature itself, where, for example, food chains or natural water circulation can be the prototypes, implies that the practices of enterprises and households are transferred to create a sustainable system of production and consumption. This is the reason why a couple of definitions—industrial symbiosis [64,65] and socio-economic metabolism [66] (pp. 9–10), which are so popular in discussions about the matters of the circular economy—have been borrowed from the discipline of nature. On the way to the conceptualization of this rather new model of the economy, the authors of the study present their own generalized definition (Table 2) for better understanding the major problems of the circular economy. In turn, analyzing Table 3, it is seen that the concept of the circular economy can be applied to the Arctic regions and is not limited by the nature of value (product/service) carriers.
On the one hand, when the two concepts of the bioeconomy and circular economy are compared, there is evidence [45] that both of them consider development based on economic growth. On the other hand, they reasonably point out [67] that the concept of the bioeconomy is not about being directly cyclic or resource efficient, but focuses mostly on substituting non-renewable sources of energy for renewable ones. Consequently, both concepts have their own problems in terms of coordinating reliability with sustainability [67] (p. 13), and they do not compete with each other.
It has been mentioned multiple times [68] that the concept of circular economy is still open for interpretation. However, the same author [68] came up with such a good definition of the circular economy model, which is aimed at using resources efficiently through minimizing waste, long-term protection of value, reduction in primary resources and a closed cycle of products, parts of products and materials in the field of conservation of the environment and socio-economic benefits, that we are ready to accept this definition à la lettre.
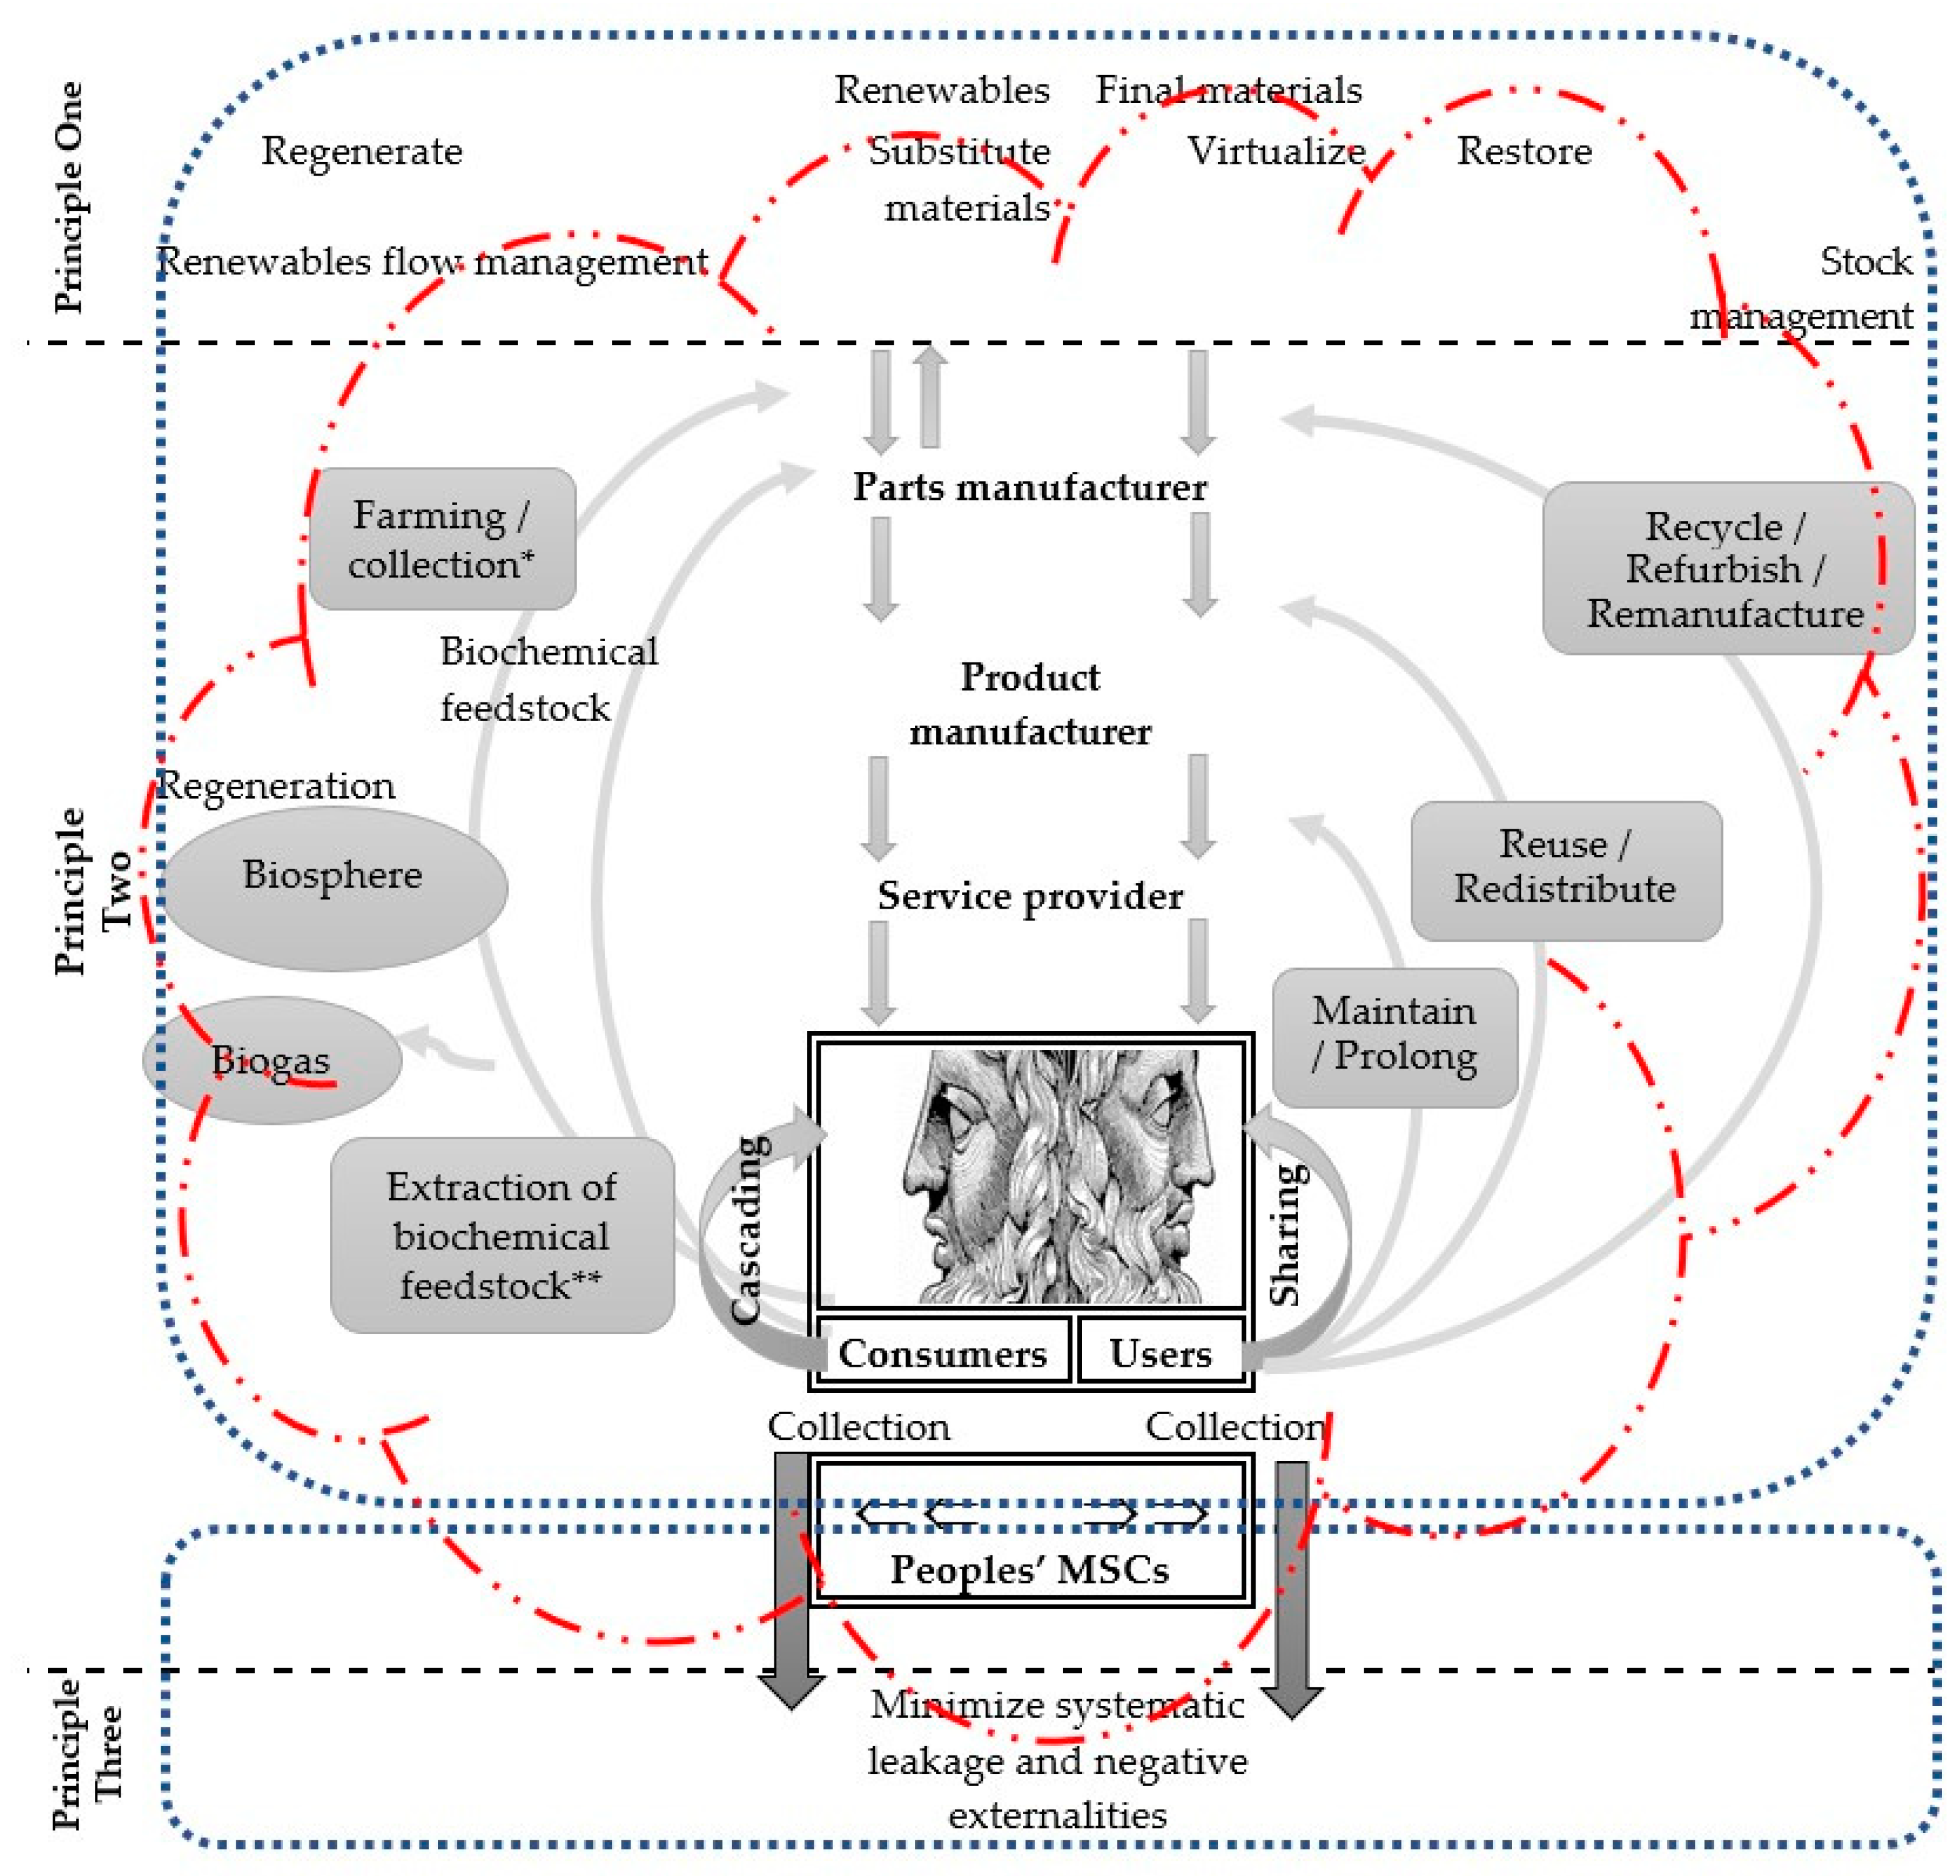
The general model of the circular economy can be presented as a complex combination of related closed and semi-closed circuits of material flows distributed between production units, social/state organizations and households. Finally, when the above flows lose any of their value in the near future, they end up in dumps and landfills, which totally contrasts with the traditional model of the linear economy (take–make–consume/use–dispose). The main principles of the circular economy (Figure 4) were laid down in the first report of the Ellen McArthur Foundation [70] in the following way:
(1)
“Proper design” that puts forward solutions that exclude waste from being buried in landfills, helping to preserve natural resources due to the regulated consumption of limited stock and focusing on renewable resources;
(2)
Defining two classes of materials (“technical” and “nutrients”) and two types of circulation, respectively: (a) sharing, restoring, reusing and recycling of technical materials, and (b) bringing nutrients or biological nutrients to the biosphere or their cascading for subsequent reuse;
(3)
Increasing the efficiency of the system due to identifying the factors negative for humans/nature, using renewable sources of energy and reducing the consumption of fossil energy.
The principles of the circular economy are quite well discussed in the available academic papers, reports and even textbooks. Transferring from the linear model of the economy to the circular one is a very complex problem that has no comprehensive practical solution and is not resolved completely on the conceptual level [73]. The number and details of the main principles that we mentioned above vary from author to author, from 3 to 7. However, four principles [74] (p. 15)—(1) waste equals food; (2) resilience through diversity; (3) energy from renewable resources; and (4) think in systems—are found in the so-called [75] “butterfly graph”, either explicitly (1 and 3) or implicitly (2 and 4). The five-principle variant [76] is different from the previous one due to the lack of the explicit (4). The following system consisting of six principles [77]—(1) prompt thinking; (2) innovation; (3) management; (4) cooperation; (5) value engineering; and (6) transparency (a relative novelty, in our opinion)—are marked in bold. The search for these principles will stop at the “lucky number”, seven [78], and just list them:
(1)
Correcting the inputs in the system according to the regeneration rates;
(2)
Correcting the outputs of the system according to the consumption rates;
(3)
Closing the system;
(4)
Maintaining the value of the resources in the system;
(5)
Diminishing the size of the system;
(6)
Designing the system completeness;
(7)
Learning the system circularity (pay specific attention to this principle).
Finally, the biggest number of principles of the circular economy (31 items, sic), grouped into six “convergent” sets [79], where “products and services” look relatively new, proves the exceptional difficulty of the research subject. The results of the SWOT analysis are the most interesting. In order to obtain a more diverse picture and understand the idea of the circular economy with the use of various approaches, as well as to evaluate the relatively low level of its current conceptualization, we present Table 4 (the order of the concepts is from top to bottom, which corresponds to the time they appeared).
Technically, the general task of designing and building the circular economy looks similar to an old transportation problem [80]. However, it is complicated due to the scale of applications, the number of involved subjects and the host of conditions and trends in the logistic chain. For example, the general material flow of the logistic chain, measured in MT*mile, must be minimized; the number of participants in the logistic chain, where waste of the previous production unit are the expandable materials of the further production unit, must be maximized; the reverse logistics must tend to zero flow, etc. The complexity of the problem of building the logistic infrastructure in the Arctic [81] and further distribution of logistic flows according to the circular economy model calls for digital modeling and flexible management. Consequently, such a great many problems to be solved for dynamic monitoring of the hypothetical Arctic circular economy must have a powerful digital support [71,72]. This conclusion is consistent with last year’s research of the modern state of the circular economy [82] (pp. 29–31) [83], which lists eight digital technologies needed for the concept of the circular economy: (1) artificial intelligence (AI); (2) Internet of Things (IoT); (3) additive production/3D printing; (4) robotic technology; (5) blockchain; (6) drones; (7) virtual reality (VR); and (8) augmented reality (AR). All of them are switched to digital transformation and can be integrated via the existing and designed digital communication networks (Figure 4 “Red Cloud”) to monitor and manage a diverse group of objects/processes for the implementation of the concept of the circular economy.
At the end of this section of the article, a rough visualization of the intersection between the subject areas of concepts such as bioeconomy, green economy and circular economy is presented (Figure 5). The concept of the green economy is probably popular due to its fame in political circles. In addition, most of the characteristics of the bioeconomy (for example, renewable sources of energy, biodegradable packaging) are included in the concept of the green economy. In turn, the circular economy relies on the principle of the food chain. It is enough to read carefully the papers of the recent (year 2021) collection “Sustainable Development” [98], to make sure that all the three concepts are closely related. However, following from the organizational standpoint, it is the principles of the circular economy that organically fit in the mechanisms that are needed to implement the concept of sustainable development in the Arctic.

3.2. Resolving Practical Consumption Problems in the Russian Arctic in the Context of Sustainable Development: Creating Vertical Agricultural Farms

The most acute problem in reclaiming the Russian Arctic is to ensure food security for the population. The climatic conditions in the Arctic, the lack of local food production facilities, the delivery of food using complex supply chains and the costly food basket have always negatively affected the physical and mental health of the public. The food basket is expensive in the Northern regions of Russia because groceries are imported into the region along the Northern Sea Route during the period when navigation is possible. Food security is a situation when all people can have access to a sufficient quantity of safe and nutritious foods at any time to meet their dietary needs and dietary preferences, so as to enjoy an active and healthy life [99].
The northern and Arctic regions of Russia still cannot offer a vitamin-rich diet to the population due to the lack of fresh vegetables and herbs [100]. Importing from the southern regions of Russia and from abroad can hardly be seen as a satisfactory solution, neither in terms of quality (too long a supply chain) nor in terms of price (in the case of air transportation). Solutions should be looked for directly in the Russian Arctic. The article presents an example of how the principles of bio- and green economies can be integrated into the structure of the food chain of the circular economy [101]. It is the Arctic vertical agriculture [102] in the regions where hydrocarbon resources are extracted.
Dickson D. Despommier originally saw the benefits of vertical farming [103] as a world full of skyscrapers with several levels that would grow crops continuously throughout the year. In addition to creating a large amount of farmland on one ground level, this world of vertical farming was meant to reduce the transportation costs and carbon emissions caused by the need to ship groceries over long distances. It would also reduce the food spoilage that inevitably occurs during transportation. Introducing his innovative concept, Dickson D. Despommier set out several reasons why vertical farming could become very attractive to policymakers: year-round production of agricultural crops; higher yields (six times or more), prevention of drought, floods and pest control; recirculation of water; restoration of eco-systems; reduction in pathogens; provision of energy systems thanks to methane built up from compost; less fossil fuels as tractors; agricultural machinery and shipping would not be needed; and new jobs would be created [103,104,105]. Moreover, completely fantastic horizons would open up thanks to the progress in space research; a closed environment would, probably, be suitable for transforming new food products into other planetary conditions in the context of space exploration [106]. The declared advantages of vertical farming can be categorized and generalized in terms of economic, environmental, social and political aspects [107,108].
The economic benefits of vertical farming are multiple and include the prestige of marketing premium CGG food products with high export sales potential and a lower cost base because there is flood, drought and sun damage protection. In essence, no special requirements are imposed on fertilizers, herbicides or pesticides. When hydroponics are used, no soil is needed, just nutrients and water. There is no need for long-distance transportation since production is local and no agricultural machinery such as tractors, trucks or harvesters are needed. There are no seasonality issues because crop production is continuous, occurs year round and can be programmed to meet demand. Economic benefits can result from redistributing large rural farms to generate energy from solar and wind sources. Vertical farming can provide a competitive edge by combining extensive research and development with farming expertise, big data and modern technology to increase productivity.
The environmental benefits would be significant, including a supply of food that is healthy, organic and free from chemical contamination. Fossil fuels would sharply decline in use because transportation from rural areas to the urban customer base would not be required. Burning fossil fuels could be minimized if solar panels, rooftop wind turbines and storage batteries were used. This would lead to lower carbon levels in eco-systems. There would be more fresh water due to the evaporation of “black and gray” water, while water resources would be conserved. Additionally, there would be a potential for the national eco-system to regenerate if rural lands were reclaimed for green vegetation. Additionally, most importantly, vertical farming would support environmental sustainability.
The social benefits would be also numerous, as vertical agriculture provides new jobs in biochemistry, biotechnology, mechanical engineering, agriculture, construction, technical maintenance, as well as new opportunities for research and development aimed at improving and enhancing the technology. Increased productivity could lead to lower food production and energy costs and generate higher revenue. The surplus of apartments in high-rise buildings and warehouses that are not used could be reduced by using empty buildings for multi-story farms located close to their consumers and, thus, abandoned areas could be regenerated. The social benefits derive from the fact that the vertical farming model would help solve the problem of social isolation in remote rural communities by retraining workers and teaching them how to use vertical farming technologies locally in the cities and towns where they live.
The political benefits of vertical farming would mean that commitments to fight climate change would be easier to meet, while new technologies would support the adaptation and mitigate harmful effects. The technological approach that uses a closed system would maintain bio-security due to effective protection against aggressive pest species. A distributed network of vertical farms would face fewer risks of power cuts, being less dependent on a few large power plants that can be vulnerable to earthquakes or terrorist attacks.
Despite the many advantages of vertical farming, disadvantages are also there. Despommier’s original vision of vertical farming [103] is criticized because the range of crops suitable for this business model is limited, including mostly plants such as lettuce, strawberries and tomatoes. Only a small proportion of the population can be served in this way and at the same time energy costs are high. Stan Cox [109] argued that only the plants at the top level would really benefit from solar radiation in a greenhouse environment, while the energy supplied by photovoltaic systems would be limited because plants cannot be stacked in vertical layers. Stan Cox’s arguments have become less powerful due to constant advances in the technology. For example, solar panels are now more efficient in generating energy and exposure to light is less expensive because new low-cost and energy-efficient LED lighting is available. Additional exposure to light is possible when layers of plants are rotated one above the other inside a high-rise building. The cost of batteries is going down quickly. New LED sources significantly increase the yield in greenhouse conditions because the spectral characteristics can be coordinated with the type and physiology [110]. More specific problems of vertical farming are about dealing with irregularities in the rural sector, attracting investment capital and training skilled manpower. As Kurt Benke and Bruce Tomkins [111] have shown, for a hypothetical 10-level vertical farm, “infrastructure depreciation and improved productivity will eventually lead to parity with the annual running costs of outdoor agriculture, but it is not clear when this will happen. If the yield per hectare for indoor farming is much higher than rural outdoor farming, perhaps as much as up to 50 times, this factor will eventually outweigh the initial cost of land acquisition. The break-even point is the number of years from startup, and this will largely determine when the availability of CGG food is not hampered by the cost structure. In the case of Victoria, comparing the previously stated urban and rural prices, and assuming 50-fold improved productivity, the break-even point may well be an estimated 6–7 years” [111], p. 21.
Potential problems for organic farming include EU Regulations (Directive 834/2007 and EU Directive 889/2008), which include the current requirements for the production, processing, sale and import of organic food within the European Union. To ensure that organic products produced in non-EU countries also meet the requirements of these regulations and undergo controls comparable to European requirements, it is necessary to follow the control method for imported products.
Figure 6 shows a schematic solution to the food security problem in the Russian Arctic using vertical greenhouses.
It is true that the Russian Arctic has lots of locations with oil and gas enterprises. Therefore, the solutions with vertical greenhouses, which could also be called a multi-chain system of sustainable consumption and production [34], can be useful for supplementing the daily menu of people working in the Arctic and their families. Vertical greenhouses offer the following advantages: (1) no logistic risks (such as delayed delivery and/or damage or loss of cargo); and (2) minimized production costs due to cheap production resources (natural gas can be used as the main source of energy practically free of charge; waste processing [112] instead of using fertilizers; sea containers can be reused/reconstructed instead of delivering special structures; new jobs are created). The market offers small gas power-generating units (<1 MW) [113], which are good for supplying container greenhouse modules with light and heat.
Maintaining the sustainability of the Arctic ecosystem is a must for the sustainable development of both Arctic territories with sparse population [114] and the entire Arctic region, which needs a long-term comprehensive sustainability policy.
The statement [115] that the governments of the North European countries have not been able to effectively address the factors that end up in unsustainable consumption and production patterns can be especially true in the case of the Russian Arctic. These include lack of commitment, prices that do not factor in true resources, environmental and social costs and limited shell life, slow transition to greener business models, limited incentives to prevent waste through reuse and other ways and no sustainable alternatives to heavy consumption [116,117]. Finally, the Arctic, as a remote and still relatively underdeveloped region that has no deep-rooted patterns of unsustainable consumption or a complex supply system, has fewer obstacles to reaching SDG 12 than the central and more densely populated regions with traditional consumption.
Let us consider a simulated project of vertical farm technology to be introduced in the Russian Arctic, using the example of a vertical lettuce farm. The vertical lettuce farm is going to be located in the Yamalo-Nenets Autonomous Okrug. It is a multi-level farm with a cultivation area of 4000 m2. At the same time, the area of the premises is 1000 m2 and the ceiling height must be at least 5 m. The number of workers is about 25 people. The production capacity is 10,000 kg per month (Table 5).
The main elements of the vertical farm are:
-
Multi-layer iron structures;
-
Equipment (LED lighting and power supplies for lamps, a solution unit, industrial osmotic water treatment plants, trays and covers for them, IoT sensors, surveillance cameras, etc.);
-
A germination chamber;
-
Consumables (seeds, peat, fertilizers, cups, etc.).
A graph is a visual image that offers the best insight into creating a vertical agricultural farm. A graph is one of the flexible mathematical objects that can easily be adapted to any specific model of a vertical farm.
To present the life cycle of a vertical lettuce farm in the form of a graph, the following stages of the cycle have been considered: R&D; production; and commissioning.
Table 6 includes the specification of the tasks of the project of the alternative graph.
Figure 7 shows the alternative graph of the project of creating a vertical agricultural farm with several technical levels.
The options for carrying out the project of a vertical farm with several technical levels are presented in Table 7.
Based on the presented project options, we will show on a graph the distribution of options depending on their cost, duration and technical level (Figure 8). We highlight the options of the first technical level in blue, and those of the second technical level in red.
The set of effective options includes options 1 and three for technical level 1; and options 7, 8 and 12 for technical level 2.
Table 8 contains the specifications of the chosen options.
Option 8, whose specification is given below, was chosen as the project option to be implemented (Table 9).
This option was chosen as a compromise between options 7 and 12, given the cost and duration of its creation. Figure 9 shows the deterministic graph of the project for creating the system, based on the selected option.

3.3. Simulating the Profit Indicator of the Vertical Farm

The Arctic consumer must be provided, on the one hand, with a high-quality range of goods/services (essential for ensuring a fulfilling life and activity in such harsh conditions). On the other hand, the producer must be able to have economically feasible indicators to operate vertical farms in a sustainable way. This last condition is partially ensured by a certain profit margin. Profit is an important economic category that determines the operation of vertical farms and the prospects for their further development in the Arctic. A simulation method was chosen for a quantitative assessment of the profit generated by the vertical farm.
Simulation modeling differs from other types and technologies of modeling because it allows users to create dynamic models. Such a model is developed over time, and its status is updated either constantly or at a given frequency. Creating a simulation model implies that a set of rules is defined according to which the model will be changed over time [118].
An important advantage of simulation models is that stochastics are taken into consideration. Any characteristic of the simulation model can be specified as a probability distribution with given parameters; for example, the duration of execution and the costs required for completing the tasks of the project. Each time the model is run, this parameter will be assigned a random value generated according to the given probability distribution. If the model is run many times, then the simulation result (for example, the execution time of a project task) can be considered as a stochastic value, a histogram or diagram can be built for it and the average value and deviations from it can be estimated. Thus, variances, reflecting the risk of overspending time or budget, can be taken into account [119].
Modern simulation modeling uses three approaches (methodologies): discrete-event modeling, agent-based modeling and system dynamics. Each method is applied within a certain range of abstraction. System dynamics implies a very high level of abstraction and is typically used for strategic modeling. Discrete-event modeling supports medium and low levels of abstraction. Between them there are agent-based models, which can be either very detailed, when the agents represent physical objects, or extremely abstract, when the agents are used to model competing companies or state governments [120].
The method of statistical dynamics was chosen for this work, since projecting the profit of an agricultural farm is a strategic task. The AnyLogic program was used for modeling.
The main element for modeling the profit is a diagram with drives, flows and variables. The drives characterize the state of the system. They contain the memory of the system. The model works only with a totality of objects: the individual elements contained in the drive are not perceptible. Flows represent the intensity at which these states of the system are changing [121].
Profit can be defined as the difference between revenue and costs or the difference between the total cost of production and the value of goods actually sold. Thus, profit (P) is influenced by: X1 (revenue of the agricultural farm, RUB per month) and X2 (costs of the farm, RUB per month). Since one month is taken for one complete production cycle, the values of the factors are taken for one month. The revenue and costs of the farm also include a number of factors that can be divided into two groups: those forming the value of the price (C) for goods and those forming the demand for goods. Table 10 contains the factors affecting the value of the price.
Table 11 presents the factors that affect the demand for the goods.
Table 12 shows endogenous variables and exogenous variables.
The connection between the endogenous and exogenous variables is shown below.
The profit is determined by formula: P = X 1 X 2 . The revenue is calculated using the following formula: X 1 = C · D . In order to calculate the price of 1 kg of goods, the formula below is used: C = c 1 + c 2 + c 3 + c 4 + c 5 + c 6 c 7 · c 8 . The formula for estimating the demand is: D = d 1 · d 10 . The formula for estimating the number of customers is: d 1 = d d 1 d t   = d 3 . The formula for estimating the purchase intensity is: d 3 = d 4 + d 5 . The formula for estimating the number of purchases after watching the advertisement is: d 4 = d 2 · d 7 . The formula for estimating the number of purchases following positive reviews on the goods: d 5 = d 1 · d 2 · d 8 · d 9 d 6 . The number of prospects is set as equal to the size of the population in the region: d 2 = d 6 ; The formula for estimating the costs of the farm is: X 1 = c 1 + c 2 + c 3 + c 4 + c 5 + c 6 .
Table 13 shows the values of the statistical variables. The presented data illustrate that the largest cost items of the vertical farm are wages, rent of the premises and electricity bills. It can also be seen that growing positive reviews bring more customers than product advertising.
The sequence of simulation based on the “system dynamics” methodology is as follows. A model named “Ferma12” was created in the AnyLogic program. The unit of model time was set as a month. The elements of modeling can be seen on the open “system dynamics” palette: drive, flow, dynamic variable, relationship, parameter, table function, cycle, copy and dimension.
The model is aimed at predicting the profit of the vertical farm. Therefore, we set the profit as a drive, with an incoming flow being revenue and an outgoing flow being costs (Figure 10).
In the model, projecting the demand of the market, the drive-prospect goes to the drive-customer through the purchase intensity flow (Figure 11). In other words, the purchase intensity is characterized by the number of purchases made after watching the advertisement and following positive reviews on the goods.
Having created the variables affecting the revenue and costs of the farm, we can see the model for projecting the profit (Figure 12).
Figure 12 shows the connections between all the variables and with the flows. The blue color demonstrates the connections between the variables affecting the pricing, the green one shows the connections affecting the costs and the red one shows the connections influencing the revenue.
The polarities of the connections are indicated in the model. All connections, apart from C and c7, have a positive polarity. The positive polarity means that two elements of the system dynamics change their values in the same direction, i.e., if the value of the element from which the connection is directed is reducing, the value of the other element is going down too. In case the polarity is negative, two elements have oppositely changing values.
One reinforcing and two balancing cycles are identified in the model. The balancing cycle is designated as B, the reinforcing one as R. The reinforcing feedback occurs when the effect in the system is transmitted to the input of the system and the initial change is reinforced, leading to even bigger changes in the same direction. The balancing feedback occurs when changes in the system reduce the initial impact [122].
The reinforcing cycle is characterized by communication. The goods purchase flow increases the number of product consumers, which raises the intensity of goods purchasing under the influence of communication with product consumers, and, consequently, increases the intensity at which goods are purchased. The balancing cycles are characterized by the saturation of the sales market through advertising. The goods purchase flow reduces the number of prospects, which, in turn, reduces the goods purchase intensity. The balancing cycles are also characterized by the saturation of the sales market due to positive reviews.
The launch of the model is characterized by the fact that it was set for the model to stop the launch after 15 years. Figure 13 shows a graph illustrating the dynamics of profits over 15 years of operation of the vertical agricultural farm.
The profit margin as of the fifteenth year of operation of the farm amounts to RUB 12,614,122.12, at the price of RUB 68.44 for 1 kg of goods, and a number of customers equal to 388,090 people.
Based on the graph shown in Figure 13, the agricultural farm operated at a loss for the first five years. This suggests that the demand on the market is going to be insufficient to make a profit.
According to the simulation results, the costs of building the vertical farm, with a cultivation area equal to 4000 m2 and average yield of greens being 10,000 kg, are going to amount to RUB 11,000,000.
Thus, the model demonstrates that 15 years is enough to recoup the costs of building a vertical agricultural farm in the Russian Arctic. In order to diminish the payback period, the area of the agricultural farm can be enlarged, which will lead to lower investment and operating costs per unit of cost of an agricultural product. Alternatively, the sales market can be expanded, taking into account the specifics of the territories in the Russian Arctic.

4. Discussion Individual Consumption in the Context of Sustainable Development

4.1. The Specifics of Individual Consumption in the Circular Economy

As a starting point, let us take a well-known and, perhaps, indisputable statement: the consumer is both the beginning and the end of a repetitive marketing cycle: {consumption (demand), production (supply), consumption (demand)}. The transition from a linear economy model to a circular economy model in the context of sustainable development must be followed by a transformed consumption model, consistent with the requirements of SDG 12. This transformation raises an important economic and ethical problem concerning freedom of choice for the consumer [41,42]. Classical political economy assumes that a product should be completely depreciated during its life cycle. However, under the influence of aggressive marketing, the functional wear and tear of the product leaves far behind its physical wear and tear in consumer societies. As a result, the product life cycle in the primary market diminishes and an accelerated use of resources is stimulated. This scenario corresponds to the development of “unsustainable consumption” and is in conflict with SDG 12. It was highlighted that this and many other obstacles lie in the way to building the circular economy [123] (pp. 38–45). It seems strange that among 22 obstacles—financial (5), institutional (6), infrastructural (4), social (3) and technological ones (4) [123]—the lack of literacy in the field of sustainable development is not mentioned as an obstacle [124,125], the same as the sustainability mindset, which should be created through educating people so that sustainability can be ensured by those taking part in the implementation of the concept of the circular economy. The concept of the above construct mostly resembles a mental landscape that is seen as an element of sustainable design [126].
The next statement—"The principles of a circular economy, including systems thinking inspired by nature, should become an integral part of educational programs, especially MBA programs in economics, engineering disciplines, academies of design and politics, but also in leadership, programs for business executives” [126]—corresponds to our definition of the starting point and main driver of resilience: people, and teaching them about resilience. Along with this statement, a recent bibliographic study [127] divided the obstacles to the circular economy into hard and soft ones and understood the latter as human barriers, including the lack of interest in the environment among consumers, and the lack of skilled personnel to manage the environment. Filling the gaps might be the first important step towards sustainable development [128]. We believe that the above judgements should be interpreted in such a way that we could logically conclude that overcoming all these barriers depends on the psychological resilience of all the people that are involved in building the circular economy [100,129]. The model of individual sustainable consumption [101] or responsible consumption [102] is the most important component of this structure.
SDG 12 declares the provision of sustainable consumption and production patterns. In our opinion, this is the most important for the planet, and the purpose of our civilization is related to the Arctic, especially because the polar region is extremely important for the future of the Earth [112]. However, in order to promote sustainable consumption and production patterns, the existing consumption patterns of individuals/households must be transformed in accordance with the principles of the circular economy [63] (p. 16), [113,114]. The literature-explosive nature of the growth (Figure 3) in publications on the concept of sustainable development and the mechanisms of its implementation (where, after our critical literature review, we consider the circular economy model as the most promising) supports the imperative of sustainable development. The very idea of copying the principles of wildlife to build production consumption systems that contribute to sustainable development is uncontroversial. However, as it was rightly said long ago [115]: the relations between the nodes in production–consumption systems are formed not only by the economy and material flows, but also by culture, values and power. All of them will have to be considered in the transition to sustainable development. The carriers of these three factors (culture, values and power) are people, and the purposeful use of these factors in favor of building a sustainable circular economy depends on their mindset. The materialization of this mindset determines the type of an individual consumption model, which ultimately shapes the production consumption model.

4.2. The Current State of Consumption in the Russian Arctic Using an Example of Food Products

The most difficult problem in the reclamation of the Russian Arctic is the need to ensure the food security of the population. The climatic conditions in the Arctic, the lack of local food production, the fact that food is delivered through complex supply chains and the high cost of the food basket have always negatively affected the physical and mental health of the population. The food basket is expensive in the Northern regions of Russia due to the fact that a significant proportion of the groceries is imported into the region along the Northern Sea Route during a certain period when navigation is possible. Food security is a situation when all people can have access to a sufficient quantity of safe and nutritious foods at any time to meet their dietary needs and dietary preferences so as to enjoy an active and healthy life [130].
If there is no access to food like that or if it is limited, it is bad for health. If food shortages persist throughout life, cognitive deficits appear, physical labor productivity reduces and, at a later age, people suffer from diseases, including chronic ones such as cardiovascular diseases, diabetes and others. At the same time, the quality of food, which contains the microelements adequate for the human body, is very important [131]. Poor quality of groceries, malnutrition and inability to buy food whenever necessary has a negative impact on man and is defined in the scientific literature as food insecurity.
Agriculture in the unfavorable climatic conditions of the Arctic regions is extremely difficult, so the population’s need for food is met mainly through importing. The import of products is hampered due to the regions’ remoteness and the lack of interregional ground communications. Local authorities are trying to tackle the problem by allocating a subsidy from the regional budget every year to import groceries.
Changing climatic and socio-cultural conditions have led to an increased dependence on groceries bought in stores in the Arctic, especially over recent years. This has a significant negative impact on the physical and mental health of the population at the community level [132]. The extreme weather conditions in the Far North aggravate the health of the population. The human body experiences constant oxygen starvation, and suffers from the effect of magnetic storms. The polar night is followed by the polar day, and the level of radiation is forever high, the same as the electric field. Compared with a temperate climate, greater energy costs are needed to perform physical labor. As for the low-income category of the population, the main foods in their diet are bread, cereals and pasta, while in the villages of the Northern coast of the Arctic it is fish and the meat of marine mammals. The actual diet of the adult population of the Northern regions is unhealthy and unbalanced, as shown by medical sociological research studies. The actual diet, together with harsh climatic and difficult socio-economic conditions, determines the circumstances in which an unfavorable and uncomfortable nutritional status of the population of the Northern regions is formed. This diet is characterized by insufficient consumption of meat and meat products, fish and seafood, milk and dairy products, unsaturated fats, phospholipids, dietary fiber, methionine, a number of vitamins and bioelements (such as selenium, calcium) combined with great fat content, excessive consumption of saturated fats and flour products. There is a deficit in consuming potatoes and other vegetables, fruits and eggs [133].
According to a sociological survey conducted in the Yamalo-Nenets Autonomous Okrug in the spring of 2019 (sample n = 1610, sampling error by one attribute Δ = 2.8%), the basis of the food basket (the first food group) of residents in this Northern region (more than 50% of weekly purchases) is bread (92%), milk and dairy products (76%), poultry and products of its processing (59%), processed foods and pasta (52%) (percentages indicate the number of cases in which this function was mentioned by respondents) [133]. These results are consistent with other empirical studies that had been carried out earlier [116]. The indigenous inhabitants of the Arctic consumed more bakery products, fatty foods, fish, canned milk and meat, and less vegetables, milk and fermented milk products than the settlers. It was found that the North demonstrates the greatest deficit from the recommended consumption rates as follows: 48% for potatoes; 33% for other vegetables and melons; 21% for fruits and berries; about 14% for eggs, milk and dairy products; and 17% for bakery products. In addition, the carbohydrate load on the organism of the inhabitants of the Arctic zone is high, with the level of sugar consumption exceeding the norm by 44% [134]. In the literature, it is noted that the expensive and relatively poor diet in the remote Northern settlements is a long-term and insurmountable problem of those living in the Northern regions of all countries around the world [135].
Let us give an example of some basic food products consumed in the regions of the Russian Arctic and compare them to Russia as a whole. Per capita consumption of potatoes and sugar in the Arctic regions is not much more different from the national average. The residents of the Russian Arctic consume a lot less meat, milk, vegetables, cheese, fish and other valuable foods [133]. They made up for the lack of calories by increasing the proportion of bread, pasta and sugar and consume far more alcoholic beverages, including homemade ones. However, there are exceptions to this rule. The diet structure of the inhabitants of the Murmansk region and Yakutia is much more balanced. For example, the consumption of dairy products and meat in Yakutia is much higher than the average in Russia.
Sociological studies looking into the actual diet of the population in the Arctic regions of Russia show that the real diet of adults in some Arctic regions is unhealthy, unbalanced and characterized by insufficient consumption of meat and meat products, fish and seafood, milk and dairy products and unsaturated fats, with excessive consumption of oils and fats, baked goods and sterols, while the quality of foods is relatively stable.

5. Conclusions

The concept of sustainable development is an imperative that should be applied to the Russian Arctic. It should be implemented according to the new Russian program and strategy that will be in effect until 2035. Content analysis of relevant sources has shown that there is quite a gap between the high-profile political declarations of needs and the reality. It is impossible to quickly and universally implement this concept and move to real economic actions while standing at the crossroads of conflicting interests. The point is that it is important to move on and search for and develop mechanisms for implementing the concept of sustainable development. After the circular economy model was presented and compared to the main features of the green and bioeconomies through the prism of its applicability to the concept of sustainable development in the Arctic, the following hypothesis was formulated: a real step forward should be the transition from a linear model to the new one synthesized from the concepts/solutions borrowed from the three economic models discussed here (green economy, bioeconomy and circular economy), whose principles are suitable for achieving the SDGs. At the same time, this synthesized model of the circular economy for the Russian Arctic should be based on the principles of such socio-technical systems that would make it possible to rationally combine both production and individual consumption. A vertical agricultural farm and greenhouse modules can be an example of such a socio-technical system for the Arctic. We believe that these socio-technical systems as elements of the circular economy can transform the consumption patterns of the Arctic population
The impossibility of growing agricultural products in open sown areas leads to the fact that residents of the Arctic regions have access to lower quality and more expensive agricultural products, in contrast to residents of other cities. Vertical farming will be one of the solutions to this problem.
When establishing a sustainable consumption pattern, the inevitable violation of consumer sovereignty must be compensated for by using a scientific approach to determining the range of goods/services provided (offered) to them, which must meet a high living standard. The expected “price–quality” conflict can be resolved, for example, with the help of local Arctic production (vertical agricultural farms, greenhouse modules).
Evaluation of vertical farm performance by simulation modeling, such as product price, profit and payback period of investment in a vertical farm, showed acceptable results that can satisfy both the buyer and the investor/farmer.
There are not only climatic and technological, but also socio-psychological barriers on the way to the introduction of sustainable consumption patterns. Therefore, the transformation of the consumption patterns of the population in the Russian Arctic may be accompanied by the processes in which socio-technical systems are formed as elements of the circular economy (for example, vertical agricultural farms, greenhouse modules), which will make it possible to overcome these obstacles.
At the same time, it is clear that encouraging consumer literacy on the way to sustainable consumption, by spreading knowledge on sustainability, is the basis for making a sustainable consumption pattern possible in the Arctic. All of the above provides evidence that further transdisciplinary research is required in the field of the circular economy and in the search for ways to change consumption patterns in the Arctic.

Author Contributions

Conceptualization, N.D. and D.S.; methodology, I.I., V.C. and A.T.; software, I.I. and A.T.; formal analysis, N.D., I.I., D.S., V.C. and S.V.K.; investigation, N.D., I.I., D.S., V.C., A.T. and S.V.K.; resources, N.D., I.I. and S.V.K.; data curation, N.D. and V.C.; writing—original draft preparation, N.D., I.I., D.S. and V.C.; writing—review and editing, N.D. and D.S.; visualization, V.C.; supervision, N.D.; project administration, I.I. and V.C. All authors have read and agreed to the published version of the manuscript.

Funding

The research is partially funded by the Ministry of Science and Higher Education of the Russian Federation as part of the world-class Research Center program: Advanced Digital Technologies (contract No. 075-15-2020-934 as of 17 November 2020).

Institutional Review Board Statement

Not applicable.

Informed Consent Statement

Informed consent was obtained from all subjects involved in the study.

Data Availability Statement

The data presented in this study are available on request from the corresponding author.

Acknowledgments

The authors would like to extend their sincere appreciation to the reviewers whose comments helped to improve the paper.

Conflicts of Interest

The authors declare no conflict of interest.

References

  1. Peimani, H. Is the Arctic Melting? In Energy Security and Geopolitics in The Arctic: Challenges and Opportunities in the 21st Century; Peimani, H., Ed.; World Scientific: Singapore, 2012; pp. 101–105. Available online: http://www.worldscientific.com/worldscibooks/10.1142/8448 (accessed on 27 October 2020).
  2. Didenko, N.I.; Cherenkov, V.I. Economic and geopolitical aspects of developing the Northern Sea Route. IOP Conf. Ser. Earth Environ. Sci. 2018, 180, 012012. [Google Scholar] [CrossRef]
  3. McGee, R. Russia’s Arctic Development: Problems and Priorities. Geohistory. 12 January 2012. Available online: https://geohistory.today/russia-arctic-development-power (accessed on 27 October 2020).
  4. Davis, A.; Vest, R. Foundations of State Policy of the Russian Federation in the Arctic in the Period to 2035; Russia Maritime Studies Institute, U.S. Naval War College: Newport, RI, USA, 2020; Available online: https://dnnlgwick.blob.core.windows.net/portals/0/NWCDepartments/Russia%20Maritime%20Studies%20Institute/ArcticPolicyFoundations2035_English_FINAL_21July2020.pdf?sr=b&si=DNNFileManagerPolicy&sig=DSkBpDNhHsgjOAvPILTRoxIfV%2FO02gR81NJSokwx2EM%3D (accessed on 20 October 2020).
  5. Zhuravel, V.P. Russia in the Arctic. Will the State Commission be its helmsman? Arct. North 2016, 23, 5–14. (In Russian) [Google Scholar] [CrossRef]
  6. Zaikov, K.S.; Kondratov, N.; Kudryashova, E.; Arturovna, L.S.; Chistobaev, A. Scenarios for the development of the Arctic region (2020–2035). Arct. North 2019, 35, 5–24. (In Russian) [Google Scholar] [CrossRef]
  7. Badylevich, R. Analysis and improvement of the directions of strategic regulation of the process of ensuring the security of the Arctic zone of the Russian Federation. IOP Conf. Ser. Earth Environ. Sci. 2020, 539, 012054. Available online: https://iopscience.iop.org/article/10.1088/1755-1315/539/1/012054/pdf (accessed on 20 October 2020). [CrossRef]
  8. Draft strategy for the development of Russia’s Arctic through 2035 to Be Presented to VVP by Year End. Portnews. 14 December 2019. Available online: https://en.portnews.ru/news/288635/ (accessed on 27 October 2020).
  9. Grinyaev, S.N.; Zhuravel, V.P. Integrated Security Issues in the Basic Principles of Russian Federation State Policy in the Arctic to 2035: Experience and Prospects for Implementation. Arct. North 2020, 39, 52–74. (In Russian) [Google Scholar] [CrossRef]
  10. Ilinova, A.; Solovyova, V.; Yudin, S. Scenario-based forecasting of Russian Arctic energy shelf development. Energy Rep. 2020, 6, 1349–1355. [Google Scholar] [CrossRef]
  11. Liu, C.Y.; Fan, H.M.; Zhang, X. The Arctic policy and port development along the Northern Sea Route: Evidence from Russia’s Arctic strategy. Ocean Coast. Manag. 2020, 201, 105422. [Google Scholar] [CrossRef]
  12. Klimenko, E. Russia’s New Arctic Policy Document Signals Continuity Rather than Change. Stockholm International Peace Research Institute (SIPRI). 6 April 2020. Available online: https://www.sipri.org/commentary/essay/2020/russias-new-arctic-policy-document-signals-continuity-rather-change (accessed on 27 October 2020).
  13. Buchanan, E. The Overhaul of Russian Strategic Planning for the Arctic Zone to 2035. Review of: Foundations of State Policy of the Russian Federation in the Arctic in the Period to 2035; Strategy of Development of the Arctic Zone of the Russian Federation and the Provision of National Security for the Period to 2035; State Programme “Socio-Economic Development of the Arctic Zone of the Russian Federation” Public Affairs Office, NATO Defense College. 19 May 2020. Available online: https://www.ndc.nato.int/research/research.php?icode=641 (accessed on 27 October 2020).
  14. Baklanov, P.Y.; Moshkov, A.V. Spatial differentiation of the economic structure of the Russian regions of the Arctic Zone. R-Econ. Electron. Sci. Econ. J. 2015, 1, 47–56. Available online: https://journals.urfu.ru/index.php/r-economy/article/view/2809 (accessed on 27 October 2020).
  15. Heininen, L.; Sergunin, A.; Yarovoy, G. Russian Strategies in the Arctic: Avoiding a New Cold War, Valdai Discussion Club Grantees Report, Russian Federation. 2014. Available online: https://www.researchgate.net/publication/272495425_RUSSIAN_STRATEGIES_IN_THE_ARCTIC_AVOIDING_A_NEW_COLD_WAR (accessed on 27 October 2020).
  16. Glinskiy, V.; Serga, L.; Zaykov, K. Identification Method of the Russian Federation Arctic Zone Regions Statistical Aggregate as the Object of Strategy Development and a Source of Sustainable Growth. Procedia Manuf. 2017, 8, 308–314. [Google Scholar] [CrossRef]
  17. Evseev, A.; Krasovskaya, T.; Slipenchuk, M. Advanced economic development of the Russian Arctic: Sustainable nature management. In Sustainable Development in the Arctic Zone, Proceedings of the 4th International Conference “Arctic: History and present day”, Saint-Petersburg, Russia, 19–21 April 2019; IOP Publishing: Bristol, UK; Available online: https://www.researchgate.net/publication/334637921_Advanced_economic_development_of_the_Russian_Arctic_sustainable_nature_management (accessed on 27 October 2020).
  18. Gritsenko, D.; Efimova, E. Is there Arctic resource curse? Evidence from the Russian Arctic regions. Resour. Policy 2020, 65, 101547. [Google Scholar] [CrossRef]
  19. Zakharchuk, E.A.; Pasynkov, A.F. Financial Development of the Russian Arctic: An Assessment and Opportunities. Probl. Econ. Transit. 2018, 60, 730–743. [Google Scholar] [CrossRef]
  20. Lerner, A.M.; Koshurina, V.; Chistanova, O.; Wheeler, A. Mitigating the Risks of Resource Extraction for Industrial Actors and Northern Indigenous Peoples. Arct. Rev. Law Politics 2017, 8, 23–51. [Google Scholar]
  21. Katorin, I.V. Features of Institutionalization of Russia’s Arctic Zone. Probl. Territ. Dev. 2016, 5, 191–200. [Google Scholar]
  22. Konyshev, V.; Sergunin, A.; Subbotin, S.V. Sustainable development of the Russian Arctic is a priority of the State. Natl. Interests Priorities Secur. 2017, 13, 416–430. [Google Scholar] [CrossRef]
  23. Stepanova, N.; Gritsenko, D.; Gavrilyeva, T.; Belokur, A. Sustainable Development in Sparsely Populated Territories: Case of the Russian Arctic and Far East. Sustainability 2020, 12, 2367. [Google Scholar] [CrossRef] [Green Version]
  24. The Future Is Now: Science for Achieving Sustainable Development, 2019. Global Sustainable Development Report. Available online: https://sustainabledevelopment.un.org/content/documents/24797GSDR_report_2019.pdf (accessed on 10 October 2020).
  25. Dawe, N.K.; Ryan, K.L. The Faulty Three-Legged-Stool Model of Sustainable Development. Conserv. Biol. 2003, 17, 58–60. [Google Scholar] [CrossRef]
  26. Cheever, F.; Dernbach, J.C. Sustainable Development and its Discontents. J. Transnatl. Environ. Law 2015, 4, 247–287. Available online: https://digitalcommons.du.edu/cgi/viewcontent.cgi?article=1021&context=law_facpub (accessed on 27 October 2020).
  27. Forbes, B.C. Equity, vulnerability, and resilience in social-ecological systems: A contemporary example from Russian Arctic. In Equity and the Environment Research in Social Problems and Public Policy; Emerald Group Publishing Limited: Bingley, UK, 2008; Volume 15, pp. 203–236. [Google Scholar] [CrossRef]
  28. Fabinyi, M.; Evans, L.; Foale, S.J. Social-ecological systems, social diversity, and power: Insights from anthropology and political ecology. Ecol. Soc. 2014, 19, 28. [Google Scholar] [CrossRef] [Green Version]
  29. Eisenmenger, N.; Giljum, S.; Lutter, S.; Marques, A.; Theurl, M.C.; Pereira, H.M.; Tukker, A. Towards a Conceptual Framework for Social-Ecological Systems Integrating Biodiversity and Ecosystem Services with Resource Efficiency Indicators. Sustainability 2016, 8, 201. [Google Scholar] [CrossRef] [Green Version]
  30. Elkington, J. Towards the sustainable corporation: Win-Win-Win business strategies for sustainable development. Calif. Manag. Rev. 1994, 36, 90–100. [Google Scholar] [CrossRef]
  31. Muldera, K.; Costanzaa, R.; Erickson, J. The contribution of built, human, social and natural capital to quality of life in intentional and unintentional communities. Ecol. Econ. 2006, 59, 13–23. [Google Scholar] [CrossRef]
  32. Ekins, P.; Dresner, S.; Dahlström, K. The four-capital method of Sustainable Development Evaluation, European Environment. J. Eur. Environ. Policy 2008, 18, 63–80. [Google Scholar] [CrossRef]
  33. Maack, M.; Davidsdottir, M. Five capital impact assessment: Appraisal framework based on theory of sustainable well-being. Renew. Sustain. Energy Rev. 2015, 50, 1338–1351. [Google Scholar] [CrossRef]
  34. Karpova, S.V.; Cherenkov, V.I.; Cherenkova, N.I. A sustainable consumers’ consumption in the context of Arctic circular economy. IOP Conf. Ser. Mater. Sci. Eng. 2020, 940, 012125. [Google Scholar] [CrossRef]
  35. Yakovenko, N.V.; Komov, I.V.; Didenko, O.V.; Drobyshev, E.A.; Khudyakova, T.M. Regional Socio-economic-geographical System: Definition Concepts. Indian J. Sci. Technol. 2016, 9, 90614. [Google Scholar] [CrossRef] [Green Version]
  36. Pareto, V. The Circulation of Elites. In Theories of Society: Foundations of Modern Sociological Theory; Parsons, T., Shils, E., Naegele, K.D., Pitts, J.R., Eds.; The Free Press of Glencoe: New York, NY, USA, 1961; Volume 2. [Google Scholar]
  37. Daly, H.E. Beyond Growth: The Economics of Sustainable Development; Beacon Press: Boston, MA, USA, 1996; Available online: http://pinguet.free.fr/daly1996.pdf (accessed on 10 October 2020).
  38. Baldassarre, B.; Schepers, M.; Bocken, N.; Cuppen, E.; Korevaar, G.; Calabretta, G. Industrial Symbiosis: Towards a design process for eco-industrial clusters by integrating Circular Economy and Industrial Ecology perspectives. J. Clean. Prod. 2019, 216, 446–460. [Google Scholar] [CrossRef]
  39. SDG Report 2019. In The Sustainable Development Agenda. Available online: https://www.un.org/sustainabledevelopment/development-agenda/ (accessed on 30 October 2020).
  40. Bauer, B.; Watson, D.; Gylling, A.C. Sustainable Consumption and Production: An analysis of Nordic Progress towards SDG12, and the Way Ahead. Nordic Council of Ministers. 2018. Available online: http://dx.doi.org/10.6027/ANP2018-798 (accessed on 30 October 2020).
  41. Hansen, U.; Schrader, U.A. Modem Model of Consumption for a Sustainable Society. J. Consum. Policy 1997, 20, 443–468. [Google Scholar] [CrossRef]
  42. Yarimoglu, E.; Binboga, G. Understanding sustainable consumption in an emerging country: The antecedents and consequences of the ecologically conscious consumer behavior model. Bus. Strat. Environ. 2019, 28, 642–651. [Google Scholar] [CrossRef]
  43. Chan, S.; Weitz, N.; Persson, A.; Trimmer, C. SDG 12: Responsible Consumption and Production. A Review of Research Needs. Technical Annex to the Formas Report Forskning för Agenda 2030: Översikt av Forskningsbehov och Vägar Framåt; Environment Institute: Stockholm, Sweden, 2018; Available online: https://cdn.sei.org/wp-content/uploads/2018/11/sdg-12-responsible-consumption-and-production-review-of-research-needs.pdf (accessed on 10 April 2021).
  44. Jurgilevich, A.; Birge, T.; Kentala-Lehtonen, J.; Korho-nen-Kurki, K.; Pietikäinen, J.; Saikku, L.; Schösler, H. Transition towards Circular Economy in the Food System. Sustainability 2016, 8, 69. [Google Scholar] [CrossRef] [Green Version]
  45. D’Amato, D.; Droste, N.; Allen, B.; Kettunen, M.; Lähtinen, K.; Korhonen, J.; Leskinen, P.; Matthies, B.D.; Toppinen, A. Green, circular, bio economy: A comparative analysis of sustainability avenues. J. Clean. Prod. 2017, 168, 716–734. [Google Scholar] [CrossRef]
  46. Gupta, J.; Vegelin, C. Sustainable development goals and inclusive development. Int. Environ. Agreem. Politics Law Econ. 2016, 16, 433–448. [Google Scholar] [CrossRef] [Green Version]
  47. Daly, H.E. Sustainable Growth: An Impossibility Theorem. In Clearinghouse Bull; Carrying Capacity Network: Washington, DC, USA, 1994; Available online: https://link.springer.com/book/10.1007%2F1-4020-4908-0 (accessed on 31 October 2020).
  48. Seidl, I. A step to endorse sustainability: Thoughts on a council on sustainable development. Int. J. Soc. Econ. 2000, 27, 768–787. [Google Scholar] [CrossRef]
  49. Klarin, T. The Concept of Sustainable Development: From its Beginning to the Contemporary Issues. Zagreb Int. Rev. Econ. Bus. 2018, 21, 67–94. [Google Scholar] [CrossRef] [Green Version]
  50. Porter, M.E.; Kramer, M.R. Creating shared value: How to reinvent capitalism—And unleash a wave of innovation and growth. Harv. Bus. Rev. 2011, 64–77. [Google Scholar]
  51. McCormick, K.; Kautto, N. The Bioeconomy in Europe: An Overview. Sustainability 2013, 5, 2589–2608. [Google Scholar] [CrossRef] [Green Version]
  52. Vargas-Hernandez, J.G.; Pallagst, K.; Hammer, P. Bio economía en la encrucijada del desarrollo sostenible. Rev. Iberoam. Bioeconom. Cambio Clim. 2018, 4, 800–815. [Google Scholar] [CrossRef] [Green Version]
  53. Bio-Based Economy for Europe: State of Play and Future Potential 2011. Part 2: Summary of Position Papers Received in Response to the European Commission’s Public On-Line Consultation, Directorate-General for Research and Innovation Food, Agriculture & Fisheries, & Biotechnology, Brussels. Available online: https://ec.europa.eu/research/consultations/bioeconomy/bio-based-economy-for-europe-part2.pdf (accessed on 9 November 2020).
  54. Kenis, A.; Lievens, M. The Limits of the Green Economy: From Re-Inventing Capitalism to Re-Politicising, the Present; Routledge Studies in Environmental Policy; Routledge: London, UK, 2015; ISBN 9781138781702. Available online: https://www.routledge.com/The-Limits-of-the-Green-Economy-From-re-inventing-capitalism-to-re-politicising/Kenis-Lievens/p/book/9781138055681 (accessed on 9 November 2020).
  55. Kothari, A.; Demaria, F.; Acosta, A. Buen Vivir Degrowth and Ecological Swaraj: Alternatives to sustainable development and the Green Economy. Development 2014, 57, 362–375. [Google Scholar] [CrossRef]
  56. Sustainable Development in the Arctic. European Union External Action Service. 20 February 2017. Available online: https://eeas.europa.eu/headquarters/headquarters-homepage_en/20952/Sustainable%20Development%20in%20the%20Arctic#Green+economy (accessed on 9 November 2020).
  57. Li, L.; Msaad, H.; Sun, H.; Tan, M.X.; Lu, Y.; Lau, A.K.W. Green Innovation and Business Sustainability: New Evidence from Energy Intensive Industry in China. Int. J. Environ. Res. Public Health 2020, 17, 7826. [Google Scholar] [CrossRef] [PubMed]
  58. UNEP. Green Economy Reports 2010. Section 1 Advancing an Inclusive Green Economy: Rationale and Context, Definitions for Green Economy. Available online: https://unitar.org/sites/default/files/uploads/egp/Section1/PDFs/1.3%20Definitions%20for%20Green%20Economy.pdf (accessed on 11 November 2020).
  59. OECD Towards Green Growth: A Summary for Policy Makers 2011. Available online: https://www.oecd.org/greengrowth/48012345.pdf (accessed on 11 November 2020).
  60. The 5 Principles of Green Economy 2019. The Green Economy Coalition. Available online: https://www.greeneconomycoalition.org/news-analysis/the-5-principles-of-green-economy#:~:text=Our%20vision%20of%20a%20green,economic%20reform%20in%20diverse%20contexts (accessed on 11 November 2020).
  61. Vermeulen, W.J.V.; Reike, D.; Witjes, S. Circular Economy 3.0: Getting beyond the Messy Conceptualization of Circularity and 3R’s, 4R’s and More. 2018. Available online: https://www.cec4europe.eu/wp-content/uploads/2018/09/Chapter-1.4._W.J.V.-Vermeulen-et-al._Circular-Economy-3.0-getting-beyond-the-messy-conceptualization-of-circularity-and-the-3Rs-4-Rs-and-more.pdf (accessed on 11 November 2020).
  62. Muizniece, I.; Kubule, A.; Blumberga, D. Towards understanding the transdisciplinary approach of the bioeconomy nexus. Energy Procedia 2018, 147, 175–180. [Google Scholar] [CrossRef]
  63. International Institute for Applied Systems Analysis. TWI2050—The World in 2050 Transformations to Achieve the Sustainable Development Goals. Report Prepared by The World in 2050 Initiative; International Institute for Applied Systems Analysis: Laxenburg, Austria, 2018; Available online:www.twi2050.org (accessed on 11 November 2020).
  64. Chertow, M.R. Industrial symbiosis: Literature and taxonomy. Annu. Rev. Energy Environ. 2000, 25, 313–337. [Google Scholar] [CrossRef] [Green Version]
  65. Nevesa, A.; Godinac, R.; Azevedob, S.G.; Matiase, J.C.O. A Comprehensive Review of Industrial Symbiosis. J. Clean. Prod. 2020, 247, 119113. [Google Scholar] [CrossRef]
  66. Clift, R.; Druckman, A. (Eds.) Taking Stock of Industrial Ecology; Springer: New York, NY, USA, 2016. [Google Scholar] [CrossRef]
  67. Kirchherr, J.; Reike, D.; Hekkert, M. Conceptualizing the circular economy: An analysis of 114 definitions. Resour. Conserv. Recycl. 2017, 127, 221–232. [Google Scholar] [CrossRef]
  68. Hauggaard-Nielsen, H.; Christensen, T.B. Circular Economy: Practices, Knowledge Bases and Novelty. J. Transdiscipl. Environ. Stud. 2020, 18, 2–16. [Google Scholar]
  69. Szeremlei, A.K.; Robert, M. Sustainable production and consumption. Visegr. J. Bioecon. Sustain. Dev. 2015, 4, 57–61. [Google Scholar] [CrossRef] [Green Version]
  70. Ellen MacArthur Foundation. Towards the Circular Economy; Ellen Macarthur Foundation: Coase, UK, 2012; Available online: http://www.ellenmacarthurfoundation.org/business/reports8 (accessed on 12 November 2020).
  71. Wilts, H.; Berg, H. The Digital Circular Economy: Can the Digital Transformation Pave the Way for Resource-Efficient Materials Cycles? Int. J. Environ. Sci. Nat. Resour. 2017, 7, 135–138. [Google Scholar] [CrossRef] [Green Version]
  72. Hedberg, A.; Šipka, S. The Circular Economy: Going Digital; Aalto University, Natural Resources Institute Finland, EIT Climate-KIC, Orgalim; European Policy Central: Helsinki, Finland, 2020; Available online: https://circulareconomy.europa.eu/platform/sites/default/files/going_digital.pdf (accessed on 12 November 2020).
  73. Reikea, D.; Vermeulen, W.J.V.; Witjes, S. The circular economy: New or Refurbished as CE 3.0?—Exploring Controversies in the Conceptualization of the Circular Economy through a Focus on History and Resource Value Retention Options. Resour. Conserv. Recycl. 2018, 135, 246–264. [Google Scholar] [CrossRef]
  74. Crul, M.; Joore, P.; Selok, S. (Eds.) Teaching a Circular Design: A Learning Guide for Designers; Erasmus + Programme of the European Union: Brussels, Belgium, 2019; Available online: http://circulardesigneurope.eu/wp-content/uploads/2020/01/Handbook-in-IDfS.pdf (accessed on 12 November 2020).
  75. Borrello, M.; Pascucci, S.; Cembalo, L. Three Propositions to Unify Circular Economy Research: A Review. Sustainability 2020, 12, 4069. [Google Scholar] [CrossRef]
  76. Let’s Help SMEs to Go Circular. Part of the Project: Boosting the Circular Economy amongst SMEs in Europe, Collaborating with KPMG. 2018. Available online: https://ec.europa.eu/environment/sme/pdf/Training%20materials_English.pdf (accessed on 12 November 2020).
  77. Fact Sheet Information on Circular Economy 2016. Project Co-Funded by European Union funds (ERDF, IPA), Interreg. 2016. Available online: http://www.interreg-danube.eu/uploads/media/approved_project_output/0001/14/6691d3d2f8942db0c10a0bb9fb1926c139a0b9a4.pdf (accessed on 12 November 2020).
  78. Suarez-Eiroa, B.; Fernandez, E.; Mendez-Martínez, G.; Soto-Onate, D. Operational principles of circular economy for sustainable development: Linking theory and practice. J. Clean. Prod. 2019, 214, 952–961. [Google Scholar] [CrossRef]
  79. Pesce, M.; Tamai, I.; Guo, D.; Critto, A.; Brombal, D.; Wang, X.; Cheng, H. Circular Economy in China: Translating Principles into Practice. Sustainability 2020, 12, 832. [Google Scholar] [CrossRef] [Green Version]
  80. Yukhimenko, B.I.; Malyutin, S.V. Mathematical formalization of certain problems of transport logistics. Econ. Time Real. 2015, 4, 186–191. Available online: http://economics.opu.ua/files/archive/2015/n4.html (accessed on 20 November 2020).
  81. Cherenkov, V.I.; Skripnuk, D.F.; Tanichev, F.D.; Safonova, A.S. A conceptual framework of logistics infrastructure for implementing the circular economy model in the Russian Arctic. IOP Conf. Ser. Earth Environ. Sci. 2020, 539, 012077. [Google Scholar] [CrossRef]
  82. The Road To Circularity: Why a Circular Economy Is Becoming the New Normal. PricewaterhouseCoopers B.V. 2019. Available online: https://www.pwc.de/de/nachhaltigkeit/pwc-circular-economy-study-2019.pdf (accessed on 20 November 2020).
  83. Basu, D. Underconsumption, Capitalist Investment and Crisis. Rev. Keynes. Econ. 2015, 4, 208–218. [Google Scholar] [CrossRef]
  84. Commoner, B. The Closing Circle: Nature, Man, and Technology; Random House Inc.: New York, NY, USA, 1971; ISBN 978-0394423500. [Google Scholar]
  85. Tibbs, H. Industrial Ecology: An Environmental Agenda for Industry. Report, GBN. 1993. Available online: https://www.researchgate.net/publication/285589929_Industrial_Ecology_an_environmental_agenda_for_industry (accessed on 20 November 2020).
  86. Sharfman, M.; Graedel, T.E.; Allenby, B.R. Industrial Ecology. Acad. Manag. Rev. 1995, 20, 1090–1094. [Google Scholar] [CrossRef]
  87. O’Rourke, D.; Connelly, L.; Koshland, C. Industrial Ecology: A Critical Review. Int. J. Environ. Pollut. 1996, 6, 89–112. [Google Scholar] [CrossRef]
  88. Hawken, P.; Lovins, H.; Lovins, A. Natural Capitalism: Creating the Next Industrial Revolution. 1999. Quoted by Environment & Society Portal. Available online: http://www.environmentandsociety.org/mml/natural-capitalism-creating-next-industrial-revolution (accessed on 20 November 2020).
  89. Benyus, J.M. Biomimicry: Innovation Inspired by Nature; New York Times Book Review: New York, NY, USA, 2002; ISBN 0-688-10699-9. [Google Scholar]
  90. Balkau, A. International Frameworks for Environmental Solutions. Environ. Solut. 2005, 14, 401–434. [Google Scholar] [CrossRef]
  91. Sherratt, A. Cradle to Cradle. In Encyclopedia of Corporate Social Responsibility; Idowu, S.O., Capaldi, N., Zu, L., Das Gupta, A., Eds.; Springer: Berlin/Heidelberg, Germany, 2013. [Google Scholar] [CrossRef]
  92. Rhodes, C.J. Permaculture: Regenerative—Not Merely Sustainable. Sci. Prog. 2015, 98, 403–412. [Google Scholar] [CrossRef] [PubMed]
  93. Pauliuk, S. Critical appraisal of the circular economy standard BS 8001:2017 and a dashboard of quantitative system indicators for its implementation in organizations. Resour. Conserv. Recycl. 2018, 129, 81–92. [Google Scholar] [CrossRef]
  94. Smith-Godfrey, S. Defining the Blue Economy, Defining the Blue Economy. Marit. Aff. J. Natl. Marit. Found. India 2016, 12, 58–64. [Google Scholar] [CrossRef]
  95. Brown, M.; Haselsteiner, E.; Apró, D.; Kopeva, D.; Luca, E.; Pulkkinen, K.; Vula Rizvanolli, B. (Eds.) Sustainability, Restorative to Regenerative. 2018. Available online: https://www.eurestore.eu/wp-content/uploads/2018/05/RESTORE_booklet_print_END.pdf (accessed on 15 November 2020).
  96. Gómez, A.M.M.; González, F.A.; Bárcena, M.M. Smart eco-industrial parks: A circular economy implementation based on industrial metabolism. Resour. Conserv. Recy. 2018, 135, 58–69. [Google Scholar] [CrossRef]
  97. Baldassarrea, B.; Keskin, D.; Diehla, J.C.; Bockenc, N.; Calabretta, G. Implementing sustainable design theory in business practice: A call to action. J. Clean. Prod. 2020, 273, 123113. [Google Scholar] [CrossRef]
  98. Achillas, C.; Bochtis, D. (Eds.) Green, Closed Loop, Circular Bio-Economy; MDPI: Basel, Switzerland, 2021; p. 288. [Google Scholar]
  99. Food and Agriculture Organization (FAO). The State of Food Insecurity in the World 2001; FAO: Rome, Italy, 2002. [Google Scholar]
  100. Mateo-Marín, N.; Isla, R.; Guillén, M.; Quílez, D. Agronomic and Environmental Implications of Substituting Pig Slurry for Synthetic Nitrogen in Mediterranean Wheat Systems. Agronomy 2020, 10, 1498. [Google Scholar] [CrossRef]
  101. Bengtsson, M.; Alfredsson, E.; Cohen, M.; Lorek, S.; Schroede, P. Transforming systems of consumption and production for achieving the sustainable development goals: Moving beyond efficiency. Sustain. Sci. 2018, 13, 1533–1547. [Google Scholar] [CrossRef] [PubMed]
  102. Council of Europe Publishing. Rethinking Consumer Behaviour for the Well-Being of All—Reflections on Individual Consumer Responsibility; Council of Europe Publishing: Strasbourg, France, 2008; ISBN 978-92-871-6482-7. Available online: https://book.coe.int/en/social-co-operation-in-europe/4151-rethinking-consumer-behaviour-for-the-well-being-of-all-reflections-on-individual-consumer-responsibility.html (accessed on 20 November 2020).
  103. Despommier, D. The Vertical Farm: Feeding the World in the 21st Century; Thomas Dunne Books/St. Martin’s Press: New York, NY, USA, 2010; p. 305. [Google Scholar]
  104. Despommier, D. Farming up the city: The rise of urban vertical farms. Trends Biotechnol. 2013, 31, 388–389. [Google Scholar] [CrossRef]
  105. Despommier, D. Vertical Farms in Horticulture. In Book Encyclopedia of Food and Agricultural Ethics; Thompson, P.B., Kaplan, D.M., Eds.; Springer: Dordrecht, The Netherlands, 2014; p. 1860. [Google Scholar]
  106. Giroux, R.; Berinstain, A.; Braham, S.; Graham, T.; Bamsey, M.; Boyd, K.; Cowing, K. Greenhouses in Extreme Environments: The Arthur Clarke Mars Greenhouse Design and Operation Overview. Adv. Space Res. 2006, 38, 1248–1259. [Google Scholar] [CrossRef]
  107. Fitz-Rodriguez, E.; Kubota, C.; Giacomelli, G.; Tignor, M.; Wilson, S.; McMahon, M. Dynamic Modeling and Simulation of Greenhouse Environments Under Several Scenarios: A Web-based Application. Comput. Electron. Agric. 2010, 70, 105–116. [Google Scholar] [CrossRef]
  108. Kozai, T. Resource use efficiency of closed plant production system with artificial light: Concept, estimation and application to plant factory. Proc. Jpn. Acad. Ser. B Phys. Biol. Sci. 2013, 89, 447–461. [Google Scholar] [CrossRef] [PubMed] [Green Version]
  109. Cox, S. Enough with the Vertical Farming Fantasies: There Are Still Too Many Unanswered Questions about the Trendy Practice. 2016. Available online: https://cityfarmer.info/enough-with-the-vertical-farming-fantasies-there-are-still-too-many-unanswered-questions-about-the-trendy-practice/ (accessed on 15 June 2020).
  110. Kopsell, D.; Sams, C.; Morrow, R. Blue Wavelengths from LED Lighting Increase Nutritionally Important Metabolites in Specialty Crops. HortScience 2015, 50, 1285–1288. [Google Scholar] [CrossRef] [Green Version]
  111. Benke, K.; Tompkins, B. Future food-production systems: Vertical farming and controlled-environment agriculture. J. Sustain. Sci. Pract. Policy 2017, 13, 13–26. [Google Scholar] [CrossRef] [Green Version]
  112. Owens, N. The polar regions may be at the ends of the Earth but what happens there affects us all. In Polar Science for Planet Earth; British Antarctic Survey Science Programme: Cambridge, UK, 2009; Available online: https://eies.ats.aq/Ats.IE/FwdPlans/2010_41_pspe.pdf (accessed on 20 November 2020).
  113. Garces-Ayerbe, C.; Rivera-Torres, P.; Suarez-Perales, I. Is It Possible to Change from a Linear to a Circular Economy? An Overview of Opportunities and Barriers for European Small and Medium-Sized Enterprise Companies. Int. J. Environ. Res. Public Health 2019, 16, 851. [Google Scholar] [CrossRef] [Green Version]
  114. Luis Ruiz-Real, J.; Uribe-Toril, J.; De Pablo Valenciano, J. Worldwide Research on Circular Economy and Environment: A Bibliometric Analysis. Int. J. Environ. Res. Public Health 2018, 15, 2699. [Google Scholar] [CrossRef] [PubMed] [Green Version]
  115. Lebel, L. Transitions to Sustainability in Production-Consumption Systems. J. Ind. Ecol. 2005, 9, 11–13. [Google Scholar] [CrossRef]
  116. Krasnoyarova, B.A.; Orlova, I.V. YANAO—As a model territory of providing food security in the Arctic regions. In Proceedings of the Conference “Global Problems of Arctic and Antarctic”, Arkhangelsk, Russia, 2–5 November 2020; pp. 1082–1087. [Google Scholar]
  117. Pascucci, S. Building Natural Resource Networks: Urban Agriculture and the Circular Economy; Burleigh Dodds Science Publishing Limited: Cambridge, UK, 2020. [Google Scholar]
  118. Suslov, S. Application of Simulation Modeling in Complex Project Management. Available online: https://www.anylogic.ru/resources/books/modelling-and-simulation-in-complex-project-management/ (accessed on 15 February 2021).
  119. Borshchev, A.; Karpov, Y.; Kharitonov, V. Distributed simulation of hybrid systems with AnyLogic and HLA. Future Gener. Comput. Syst. 2002, 18, 829–839. [Google Scholar] [CrossRef]
  120. Turner, B.L. Model laboratories: A quick-start guide for design of simulation experiments for dynamic systems models. Ecol. Model. 2020, 434, 109246. [Google Scholar] [CrossRef]
  121. Mueller, C.; Tsvetkov, P. A review of heat-pipe modeling and simulation approaches in nuclear systems design and analysis. Ann. Nucl. Energy 2021, 160, 108393. [Google Scholar] [CrossRef]
  122. Karpov, Y.G. System Simulation; BXV-Petersburg: St. Petersburg, Russia, 2006; p. 400. [Google Scholar]
  123. IMSA. Unleashing the Power of the Circular Economy; Report by IMSA Amsterdam for Circle Economy; IMSA: Amsterdam, Netherlands, 2013; Available online: http://circular-future.eu/wp-content/uploads/2015/08/Unleashing_the_Power_of_the_Circular_Economy-Circle_Economy.pdf (accessed on 20 November 2020).
  124. Murray, P.; Cotgrave, A.J. Sustainability literacy: The future paradigm for construction education? Struct. Surv. 2007, 25, 7–23. [Google Scholar] [CrossRef]
  125. Bergmann, I. The handbook of sustainability literacy: Skills for exchanging world. Environ. Educ. Res. 2012, 18, 719–722. [Google Scholar] [CrossRef]
  126. Engwicht, D. Mental Landscape—The Forgotten Element in Sustainable Design. Environment Design Guide. 2003, pp. 1–6. Available online: http://www.jstor.org/stable/26148847 (accessed on 20 November 2020).
  127. Duque-Acevedo, M.; Belmonte-Ureña, L.J.; Toresano-Sánchez, F.; Camacho-Ferre, F. Biodegradable Raffia as a Sustainable and Cost-Effective Alternative to Improve the Management of Agricultural Waste Biomass. Agronomy 2020, 10, 1261. [Google Scholar] [CrossRef]
  128. Tortorella, M.M.; Di Leo, S.; Cosmi, C.A. Methodological Integrated Approach to Analyse Climate Change Effects in Agri-Food Sector: The TIMES Water-Energy-Food Module. Int. J. Environ. Res. Public Health 2020, 17, 7703. [Google Scholar] [CrossRef]
  129. Olguin-Maciel, E.; Singh, A.; Chable-Villacis, R.; Tapia-Tussell, R.; Ruiz, H.A. Consolidated Bioprocessing, an Innovative Strategy towards Sustainability for Biofuels Production from Crop Residues: An Overview. Agronomy 2020, 10, 1834. [Google Scholar] [CrossRef]
  130. Agarwal, B. Food security, productivity, and gender inequality. In The Oxford Handbook of Food, Politics, and Society; Ronald, J.H., Ed.; Oxford University Press: New York, NY, USA, 2015; Volume 861, pp. 273–301. [Google Scholar]
  131. Loring, P.A.; Gerlach, S. Food, culture, and human health in Alaska: An integrative health approach to food security. Environ. Sci. Policy 2009, 12, 466–478. [Google Scholar] [CrossRef]
  132. Aftanas, L.I.; Voevoda, M.I.; Puzyrev, V.P. Arctic Medicine: Challenges of the XXI Century. In Scientific and Technical Problems of Arctic Exploration; Publisher Nauka: Moscow, Russia, 2014; pp. 104–110. [Google Scholar]
  133. Didenko, N.I.; Davydenko, V.A.; Magaril, E.R.; Romashkina, G.F.; Skripnuk, D.F.; Kulik, S.V. The Nutrition and Health Status of Residents of the Northern Regions of Russia: Outlook of Vertical Agricultural Farms. Int. J. Environ. Res. Public Health 2021, 18, 414. [Google Scholar] [CrossRef] [PubMed]
  134. State Report: “On the Sanitary-Epidemiological Safety of the Population in the Russian Federation in 2016”. The Federal Service for Surveillance on Consumer Rights Protection and Human Wellbeing. Available online: www.rospotrebnadzor.ru/documents/details.php?ELEMENT_ID=10145 (accessed on 15 March 2020).
  135. Food Insecurity in Nunavut ‘Should Be Considered a National Crisis’ Expert Says. 2017. Available online: www.cbc.ca/news/health/food-insecurity-1.4122103 (accessed on 25 March 2020).
Figure 1. The structural logic of the article.
Agronomy 11 01863 g001
Figure 2. The bibliographic visibility of the concepts in the models of the new economy, compared to the concept of sustainable development. Legend: the x-axis is the years; the y-axis is the number of references to the four above-listed concepts; the graphs for the three models of the economy are scaled 10:1. Source: compiled by the authors based on the data from the following web platform: https://app.dimensions.ai/discover/publication (accessed on 25 November 2020).
Agronomy 11 01863 g002
Figure 3. “R-house”, representing various aspects of the concept of circular economy. Legend: shaded blocs belong to the 5R paradigm of circular economy [61]. Source: designed by the authors based on [61] (p. 1).
Agronomy 11 01863 g003
Figure 4. Two circulation flows (consumption and use) under the influence of people’s sustainability mental constructs (MSCs) on implementing the concept of the circular economy. Legend: Principle One is to preserve and enhance natural resources by controlling short supplies and balancing renewable resource flows; Principle Two is to optimize resource yields by circulating products, components and materials in use at the highest utility anytime in both technical and biological cycles; Principle Three is to promote system effectiveness by revealing the negative environmental factors for people/nature; Cascading is to use materials and components in different ways after end-of-life across different value streams; *—hunting and fishing; **—can take both post-harvest and post-consumer waste as an input; MSC is people’s mental sustainability construct, the all-encompassing influence of which is displayed by two blue point contours; “red cloud” is the digital replica of a socio-economic region that should be used on the way to implementing the circular economy model. Source: designed by the authors based on [67,70,71,72] (Figure 4).
Agronomy 11 01863 g004
Figure 5. Visualization of the relative representation of the three economic models under consideration in the relevant literature in quantitative and qualitative dimensions. Legend: the sizes of figures above show relative dissimilarities only. Source: designed by authors based on sources referenced in the present article and data displayed in Figure 2 above.
Agronomy 11 01863 g005
Figure 6. Vertical greenhouses are the solution to the problem of food security and a fragment of the food chain of the circular economy. Legend: G is natural gas; E is electric power; C is sea containers; GH is greenhouse module; OF is organic fertilizer; W is waste; M is money. Source: designed by authors.
Agronomy 11 01863 g006
Figure 7. An alternative graph of the project of creating a vertical farm system with several technical levels. Source: designed by authors.
Agronomy 11 01863 g007
Figure 8. The graph showing the dependence of costs on the duration and technical level of the option. Source: designed by authors.
Agronomy 11 01863 g008
Figure 9. The deterministic graph of option 8 for creating a vertical farm. Source: designed by authors.
Agronomy 11 01863 g009
Figure 10. Creating the flows and the drive. Source: designed by authors.
Agronomy 11 01863 g010
Figure 11. The model of demand on the market. Source: designed by authors.
Agronomy 11 01863 g011
Figure 12. Model for projecting the profit of the farm. Source: designed by authors.
Agronomy 11 01863 g012
Figure 13. The graph showing how the profit of the vertical farm changes during the simulation process, RUB. Source: designed by authors.
Agronomy 11 01863 g013
Table 1. Semantic highlighting of immanent contradictions in some definitions of the green economy.
Sources of Definitions Below:
[58] (pp. 4–5)[59] (p. 9)[60]
The green economy is the one that results in improved human well-being and social equity, while significantly reducing environmental risks and ecological scarcities.Green growth means fostering economic growth and development while ensuring that natural assets continue to provide the resources and environmental services on which our well-being relies.Economy that provides prosperity for all within the ecological limits of the planet.
Legend: in order to emphasize the contradiction of the declarative goals of green economy with environmental constraints, the first one is highlighted in bold and the other one in italics, respectively. Source: compiled and partially highlighted by the authors based on the definitions of green economy in [57,58,59].
Table 2. The analysis of some definitions of the circular economy.
Aims of Creating CEPl/SCLevels/Nodes of an Industrial-Marketing System
Kind of process—See Figure 3environment quality;
economic prosperity;
social equity;
benefit of current and future generations
PnMacro/city, region, nation and beyond: a basis for formulating general policies of sustainable development
DnMeso/smart logistics infrastructure: “production–consumption” closing cycles are especially important since society must adapt to the increasing limitations in fossil energy and other resources’ supply, and the imperative of decreasing pollution in the environment
CnMicro/products, companies, consumers: strategies for designing sustainable products and processes for companies, organizations and their suppliers, as well as formatting the responsible individual/household consumption
Legend: CE is the circular economy; Pl/SC is the position in the supply chain; Pn is the production; Dn is the distribution; Cn is the consumption; Source: designed by the authors based on [67].
Table 3. Forecasting conditions for sustainable consumption and production in the Arctic, which is related to the model of the circular economy.
Conditions:
SocialEnvironmentalEconomic
Production
-
consideration of the consumption needs of local communities (especially the native Arctic population)
-
consideration of landscape protection and recreational needs
-
sustainable production energy efficiency
-
crop selection and production based on technologies suitable for Arctic cultivation
-
protection of natural Arctic habitats
-
profitability and competitiveness
-
flexible production structures allowing to create circular economy
-
local renewable energy
-
food storage innovations
Logistics
-
utilization of the mode of transport that least disturbs local communities and traditional lifestyle
-
reducing traffic stream within a logistic chain
-
using environmentally friendly means of transport
-
efficient and safe transport
-
CO2-free technologies
-
Arctic drone systems
Processing
-
consideration of the needs of local communities of energy autonomy and job creation
-
the most appropriate Arctic technologies characterized by energy efficiency and environmental protection
-
profitability
-
full-capacity production
-
creating areas of circular economy
Utilization
-
raising awareness on sustainable use of energy, water cleaning and hygiene of products, and other expandable materials
-
unmanned production, transportation, warehousing
-
creating the environmentally friendly Arctic logistics infrastructure
-
general use and disposal of waste
-
affordable technologies
-
Arctic-oriented user-friendly technologies
-
creation of technological chains corresponding to the principles of the circular economy
Source: compiled by the authors based on the idea stemming from [69].
Table 4. Different approaches to understanding the concept of circular economy.
ConceptShort DescriptionRefs
laws of ecology“complete retention and disposal of wastes … essentially complete recycling of all reusable metal, glass, and paper products; [and] ecologically safe planning to land management”.[84]
(p. 283)
industrial ecologyDesigning industrial infrastructures as if they were a series of interconnected anthropogenic ecosystems interfacing with the natural global ecosystem and using the pattern of the natural environment as a model for solving environmental problems.[85,86,87]
natural capitalismThe way to natural capitalism involves four major shifts in business practices, all vitally interlinked: (1) radically increase the productivity of natural resources; (2) shift to biologically inspired production models and materials; (3) move to a “service-and-flow” business model; (4) reinvest into natural capital.[88]
biomimicryRunning on sunlight; using only the energy it needs; fitting forms to functions; recycling everything; multiplying cooperation; banking on diversity; demanding local expertise; curbing excesses from within; tapping the power of limits.[89]
the natural step (TNS)The objectives of TNS are to ensure the environmental health and wellbeing of people by ensuring that our activities remain within the carrying capacity of the ecosystem. It advocates that we should shape our society by taking from the Earth what it can sustainably provide, and not to return substances that it cannot assimilate.[90]
cradle-to-cradle(C2C) Design and production of products of all types in such a way that at the end of their service life, they can be recycled.[91]
perma-culturePermaculture seeks to reconnect humans with nature to bring forth abundance by regenerative means, guided by three principal ethics often described as Earth care, people care and fair shares.[92]
performance economy“The focus is on the maintenance and exploitation of stock (mainly manufactured capital) rather than linear or circular flows of materials or energy. The performance economy represents a full shift to servitization, with revenue obtained from providing services rather than selling goods.”[93]
blue economySustainable industrialization of the oceans to the benefit of all.[94]
regenerative design“holistic approaches that support the co-evolution of human and natural systems in a partner relationship … focused on enhancing life in all its manifestations”.[95]
(p. 19)
industrial metabolismBy analogy with biological metabolism, which includes biological enzymes that catalyze biochemical reactions, the metabolic processes associated with industrial manufacturing, distribution, use, logistics and end-of-service life are composed of resources, machines or workstations that provide added value to the input material.[96]
industrial symbiosisThe interaction of separate business entities that create a cooperative network to achieve competitive advantage by physical exchange of materials, energy, water and/or by-products, as well as services and infrastructures.[97]
Source: compiled by the authors based on the work indicated in the far-right column.
Table 5. Technical characteristics of the vertical agricultural farm.
CharacteristicValue
Floor area, m21000
Cultivation area, m24000
Total number of sections, pcs (for sprouts and cultivation)185
Ceiling height, m5
Production capacity, kg/month10,000
Number of workers, people25
Source: compiled by the authors.
Table 6. The specification of project tasks of the alternative graph.
Task DesignationTask NameCosts of Executing the Task, Thousand RUBDuration of Executing the Task, WeeksTechnical Level of the Task
SStart
m1Carrying out R&D for creating a vertical lettuce farm15012
m2Choosing the location for building the farm203
m3Creating the drawing/plan for building the farm904
D1Choosing the floor area of the farm
d1.1500 m2500061
d1.21000 m26500122
d1.31500 m28000203
D2Choosing the floor area for growing crops
d2.11200 m2250021
d2.24000 m24000102
d2.36000 m2700053
D3Developing a control system
d3.1Automated control system200061
d3.2Combined control system1000122
m4Project approval1008
D4Producing the vertical farm
d4.1Hydroponics391091
d4.2Aeroponics5000102
D5Producing the vertical farm
d5.1Automated control system160051
d5.2Combined control system2400142
m5Assembling the equipment and multi-layer iron structure202
m6Assembling all parts3006
m7Elaborating the operational documentation80022
m8Starting up the control systems42520
m9Testing and trying the operating capacity of the structure1008
m10Introducing amendments to the documentation following the test results604
m11Commissioning403
FFinish
Source: compiled by the authors.
Table 7. Project options.
Number of the Project OptionTotality of Tasks in the OptionCosts of Executing the Option, Thousand RUBDuration of Executing the Option, WeeksTechnical Level of the Option
1m1–m11, d1.1, d2.1.1, d3.1.1, d4.2.1, d5.112,8151501
2m1–m11, d1.1, d2.1.2, d3.1.1, d4.2.1, d5.112,8351491
3m1–m11, d1.1, d2.1.1, d3.1.2, d4.2.1, d5.112,8301511
4m1–m11, d1.1, d2.1.2, d3.1.2, d4.2.1, d5.112,8501501
5m1–m11, d1.1, d2.1.2, d3.1.2, d4.2.2, d5.112,8451491
6m1–m11, d1.1, d2.1.2, d3.1.1, d4.2.2, d5.112,8301481
7m1–m11, d1.2, d2.2.1, d3.2.1, d4.1.1, d5.213,0051502
8m1–m11, d1.2, d2.2.2, d3.2.1, d4.1.1, d5.213,0301492
9m1–m11, d1.2, d2.2.1, d3.2.2, d4.1.1, d5.213,0201512
10m1–m11, d1.2, d2.2.2, d3.2.2, d4.1.1, d5.213,0451502
11m1–m11, d1.2, d2.2.2, d3.2.2, d4.1.2, d5.213,0701492
12m1–m11, d1.2, d2.2.2, d3.2.1, d4.1.2, d5.213,0551482
Source: designed by authors.
Table 8. The specifications of the set of effective project options.
Option NumberTotality of Tasks of the OptionCosts of Executing the Option, Thousand RUBDuration of Executing the Option, WeeksTechnical Level of the Option
1m1–m11, d1.1, d2.1.1, d3.1.1, d4.2.1, d5.112,8151501
3m1–m11, d1.1, d2.1.1, d3.1.2, d4.2.1, d5.112,8301511
7m1–m11, d1.2, d2.2.1, d3.2.1, d4.1.1, d5.213,0051502
8m1–m11, d1.2, d2.2.2, d3.2.1, d4.1.1, d5.213,0301492
12m1–m11, d1.2, d2.2.2, d3.2.1, d4.1.2, d5.213,0551482
Source: designed by authors.
Table 9. The specification of the chosen project option.
Option NumberTotality of Tasks of the OptionCosts of Executing the Option, Thousand RUBDuration of Executing the Option, WeeksTechnical Level of the Option
8m1–m11, d1.2, d2.2.2, d3.2.1, d4.1.1, d5.213,0301492
Source: designed by authors.
Table 10. Factors forming the prices for the goods produced by the farm.
DesignationFactor
c1Logistics costs, RUB a month
c2Raw materials costs, RUB a month
c3Rental costs, RUB a month
c4Electricity costs, RUB a month
c5Wages, RUB a month
c6Depreciation, RUB a month
c7Average quantity of finished goods, kg a month
c8Rate of return, % a month
Source: designed by the authors.
Table 11. List of factors affecting the demand of the farm.
DesignationFactor
d1Number of customers a month, people
d2Number of prospects, people
d3Purchase intensity, pcs a month
d4Number of purchases after advertising, pcs a month
d5Number of purchases following positive reviews, pcs a month
d6Population of the region, people
d7Effectiveness of advertising, a month, %
d8Effectiveness of reviews, a month, %
d9Contact intensity, pcs a month
d10Goods consumption rate, kg a month
Source: designed by the authors.
Table 12. The connections between the variables of the model.
Endogenous VariablesExogenous Variables
PX1X2
X1CD
Cc1c2c3c4c5c6c7c8
Dd1d2d3d4d5d6d7d8d9d10
d1d2d3d4d5d6d7d8d9
d2d6
d3d4d5
d4d2d7
d5d1d2d6d8d9
X2c1c2c3c4c5c6
Source: designed by the authors.
Table 13. Values of the statistical variables of the model.
VariableValueUnit of Measure
c130,000RUB a month
c240,000RUB a month
c350,000RUB a month
c450,000RUB a month
c570,000RUB a month
c65000RUB a month
c7900kg a month
c825%
d6500,000people
d71.8%
d83.5%
d97pcs a month
d100.1kg a month
Source: designed by the authors.
Publisher’s Note: MDPI stays neutral with regard to jurisdictional claims in published maps and institutional affiliations.

