Efficiency Power Plant Implementation Decision-Making Based on the Profit Function and Its Numerical Simulation
 Yiping Zhu*
  Yue Jin
- School of Management, Nanchang University, Nanchang, China
The efficiency power plant (EPP) is a kind of virtual power plant with zero emission, zero pollution, and low cost and exhibits a high-quality low-carbon production behavior in input-output analysis. In the process of implementing EPP, enterprises not only save electricity but also reduce carbon emissions, while increasing the cost of R&D and equipment. Therefore, it is very necessary to study relationships between carbon quota and EPP implementation decision. In this paper, we build the profit functions of three different types of enterprises implementing EPP and analyze the relationship of main parameters, such as the probability of implementing EPP, electricity saving, income, cost, and carbon quota, and obtain nine relative results. Then, we use ‘Maple’ software to simulate the results by drawing images of parameters, and all the above nine results passed the simulation test verification. At last, we collect the actual survey data and use VC++ programming to carry out an empirical study in China to prove the practicability of the model and the results. The results show that, under the carbon quota trading system, enterprises should tend to implement EPPs and increase investment in R&D and acquisition of EPPs and are needed to adjust the intensity of implementing EPPs according to the change of carbon quota and unit carbon quota income, to obtain higher income.
Introduction
Background
Electricity demand side management (DSM) is to let enterprises and users manage their own enterprise electricity situation through the construction of electricity fine management platform. Efficiency power plant (EPP) is a representative DSM energy efficiency resource project. EPP can be considered as a collection of some DSM energy efficiency resource projects with better combination. EPPs use high-efficiency electrical equipment and products, based on the energy-saving transformation plan of an industry or a regional enterprise, to form a regional electricity utilization efficiency optimization in different ways, which has the same important significance with the construction of a new power plant.
Over the past 10 years, the development of DSM has achieved abundant energy conservation and emission reduction effects and formed a certain scale. For example, the State Grid Energy Research Institute of China counts that the generation capacity of the DSM project is 640.7 billion kWh in China from 2011 to 2015 and estimates that the same in 2016–2020 is 1.3254 trillion kWh. It can reach 1.9661 trillion kWh during the period of 2010–2020, equivalent to a reduction of 22,598 kWh in generation capacity, and nearly 57 billion USD in investment compared with the conventional power plants (Energy Research Institute of State Grid of China, 2010).
The China government has introduced a carbon quota management system (Chang et al., 2020), which has a significant impact on the implementation of EPP. Under the carbon quota system, enterprises must control the greenhouse gas emissions, mainly carbon dioxide (CO2). The implementation of EPP cannot only reduce power consumption but also reduce carbon emissions, which, to some extent improves the willingness of enterprises to implement EPP (Li et al., 2016). Moreover, as the EPP grew in size, massive fiscal and tax subsidies became unsustainable, and carbon quotas became the government’s main means of controlling carbon emissions.
In this paper, on the basis of predecessors’ research summarized, we further combine government carbon quota with EPP, through the establishment of EPP implementation decision model based on the profit function, analyze the decisions of enterprises under different carbon quota, and verify the correctness and rationality of the results through system simulation. We hope this article could provide a reference for enterprises to make correct decisions under different carbon quota and different technology maturity when implementing EPPs.
Literature Review
EPP and DSM are hot topics in energy management, as they grew in size; they encountered economic, technological, and managerial problems in the development process (Haydt et al., 2014). Thus, most scholars prefer to focus on the three aspects of EPPs, such as in the economic field, such as billing (Çakmak and Altaş, 2020), pricing (Venizelou et al., 2020), and cost-benefit analysis (Wang and Zhu, 2014); in the field of mathematics, such as scheduling (Chamandoust et al., 2020) and planning (Zhu et al., 2017) and energy efficiency (Wang et al., 2015; Wang et al., 2016; Chakraborty et al., 2020); and in the field of technology, such as renewable energy (Kalair et al., 2020), smart distribution system (Reddy et al., 2020), and others (Mendes et al., 2020).
Among the field of energy management, the game analysis of low-carbon investment behavior is meaningful and necessary. Rai and Beck (2017) stated the importance of using behavioral science to address the persistent gaps between the technical potential of low-carbon technologies and the actual adoption of these technologies. The game analysis in low-carbon environment is derived from the low-carbon supply chain research. Du et al. (2015) conducted a game-theoretical analysis and gave low-carbon supply policies for supply chain management (Du et al., 2017). Chen et al. (2014) investigated a practical demand side management scenario where the selfish consumers compete to minimize their individual energy cost through scheduling their future energy consumption profiles using an aggregative game approach. Li et al. (2017) examined the influences of different game structures on the optimal decisions and performance of a low-carbon closed-loop supply chain (CLSC) with price and carbon emission level-dependent market demands. Then, the scholars put forward the game behavior of each participant in low-carbon investment. Du et al. (2013) considered the emission cap of emission-dependent manufacturer allocated by the government as a kind of environmental policy and formally investigated its influence on decision-making within the concerned emission-dependent supply chain and distribution fairness in social welfare. Luo et al. (2016) derived the optimal solutions for the two manufacturers in the purely competitive and co-opetitive market environments, respectively. Based on non-cooperative and cooperative games, Huang et al. (2018) proposed a hierarchical game playing scheme and a simplified multienergy system optimization method to assist stakeholders to participate in technoeconomic analysis process. Sun et al. (2020) constructed a Stackelberg differential game model (dominated by manufacturers) under both centralized and decentralized decisions considering the lag time of emission reduction technologies and the low-carbon preferences of consumers. Zhu et al. (2018) investigated how to optimize the strategy of low carbon investment for suppliers and manufacturers in supply chains and discussed the impacts of various factors on evolutionarily stable strategies. Arai et al. (2014) proposed a comprehensive framework for evaluating the performance of demand-side actors in a demand-side management system using each control scheme according to both communication availability and sampling frequency. Liu et al. (2017) proposed a scenario for DSM programs to schedule household energy consumption considering bidirectional energy trading of PEVs by a Bayesian game approach. Mahmoudi et al. (2019) evaluated the performance of Iranian thermal power plants combined with multivariate data analysis techniques, game theory, Shannon entropy, and the technique for the order of preference by similarity with ideal solution. Dou, 2015, established a dispatching optimization model of regional integrated power and gas energy system and analyzed the node energy price through the node energy balance equation and a demand response model based on evolutionary game.
Implementing EPP is a special low-carbon behavior, which can not only reduce carbon emission but also reduce electricity consumption. Therefore, the decision analysis of EPP needs to consider both low carbon and power-saving benefits. The author puts forward EPP implementation by government and enterprise, but it is far from enough (Zhu et al., 2019). Research on decision analysis among EPP enterprises is likewise important, but unfortunately, there is a lack of research on this aspect, especially about the EPP implementation decision with carbon quotas and carbon reduction benefits. Above all, the literature that analyzes the decision analysis among EPP enterprises urgently needs to be supplemented. Therefore, this study of relationship analysis for EPP implementation decision and carbon quota is innovative and of practical value.
Theoretical Basis
Efficiency Power Plant
EPP is a packaged set of DSM items or collections. The brief summary is EPPs realize energy saving transformation of energy-consuming equipment, and the energy saved is equivalent to the electricity generated by conventional coal-fired power plants (Zhu et al., 2017). Compared with conventional power plants, which are power plant entities, EPPs are designed to save electricity, not produce electricity, and save as much electricity as they produce. Although an EPP is not a real power plant, compared with power generation resources, it has the same importance in the optimal allocation of regional power supply and demand resources. It is an effective and convenient way to realize energy conservation and emission reduction and control power consumption (Maria et al., 2020). EPPs have many advantages, such as zero emission, zero pollution, low cost, non-land occupation construction cost, and operation benefit. Based on these advantages, EPPs can be used to optimize regional power resource allocation and improve the reliability and stability of the power system.
Table 1 compares fuel consumption, pollution emissions, and cost comparisons, and the comparison is about producing (or saving) per 1 kWh electricity between conventional power plants and energy-efficient power plants (source: Castro et al., 2020). The conventional power plant in the table takes a typical coal-fired power plant with an installed capacity of 300,000 kW as an example, and the annual utilization hours of its power generation equipment are about 5000 h.

TABLE 1. Comparison of conventional power plants and efficiency power plants.
Carbon Quota
Carbon quota refers to the greenhouse gas emission reduction targets that must be completed according to the regulations. For an EPP, it refers to the carbon dioxide emission reduction during the implementation of EPP. Many scholars have conducted research studies on carbon quota, but they almost took carbon quota as a constraint condition, and few literature studies have studied it as an endogenous variable. Carbon cap-and-trade was first proposed by J.H.Dales in his book “Pollution, Property and Price” (Dales, 1968), which pointed out that the government could consider pollution as a transfer of the right through the process of mutual trading of emission rights by enterprises and the regulation of the market, so as to improve the efficiency of energy use. At present, the carbon quota trading system is a relatively effective incentive means in the market, which can urge enterprises to take emission reduction measures. There are three typical distribution methods: free distribution, priced sale, and full market (Chen, 2003). There are mainly four typical carbon emission trading systems in the world (Zhang et al., 2014), namely, the European Union Carbon Emission Trading System (EUETS), the United States Regional Greenhouse Gas Initiative (RGGI), Australia’s New South Wales Greenhouse Gas Emission Reduction System (NSWGGAS), and Japan’s Tokyo Carbon Emissions Trading System (Tokyo ETS).
Methodology
The Behavior of Implementing Efficiency Power Plant
In China, the initial government subsidies are one of the impetuses of the enterprises implementing EPPs. With the increase of the size of the EPP, government financial subsidies began to gradually withdraw from the market, and carbon quota, as another kind of subsidies for the development of enterprises, began to appear. The government sets different carbon quota levels according to the ability of different enterprises to implement EPP, thus encouraging the development of EPP. The government stipulates a certain amount of carbon quota at the initial stage of the enterprise. With the implementation of the EPP, the government will subsidize a certain amount of carbon quota for unit reduction of electricity consumption. When not implementing the EPP, a certain amount of carbon quota will be consumed in normal enterprise production. At the end of each year, the total amount of carbon quota of the enterprise is accounted. The excess carbon quota can be exported by the enterprise to obtain funds. If the excess carbon quota is less than zero, the enterprise needs to buy excess carbon quota, or it will have to pay high compensation to the government.
This paper takes the government carbon quota level as an endogenous variable and studies how enterprises should formulate EPP implementation decision with the change of carbon quota level to ensure the maximization of their own income.
1) For enterprises that choose to implement EPP, we analyze the carbon quota level that enterprises will reach the critical value of R&D investment, and with the constant change of the carbon quota level, we research how the electricity reduced and the income obtained by implementing EPP will change with the change of carbon quota. 2) For enterprises that do not choose to implement EPP, we study the carbon quota level that enterprises will start to tend to implement EPP and research what extent will they continue to ignore EPP. 3) For enterprises that are uncertain whether to implement EPP or not, we study how should they make EPP decision with the change of carbon quota, that is, determine the tendency (probability) of implementing EPP, so as to maximize their own income, and research the change trend of enterprise output and income with the change of carbon quota.
Assumptions
1) Subject
There are three different types of enterprises, namely, enterprise E1 which always implements EPP, enterprise E2 which never implements EPP, and enterprise E3 which implements EPP as the case may be.
2) Electricity saved or consumed (unit: kWh, MWh, and GWh)
Set the electricity saved in enterprise E1 as
In addition, we can set the probability, tendency, or strength
3) Price (this is the price at which EPP saves electricity, not the market price)
In fact, the electricity reduced by implementing EPP has exactly the same function as the electricity generated by the power plant, and the products can be completely replaced. But unlike electricity prices, which are controlled by the government, we assume that the price of electricity reduced by EPP is affected by market supply and demand, and its price can be expressed as P.
4) Cost
It is assumed that the cost of EPP implementation is mainly divided into two parts: R&D cost and operation cost. R&D cost includes the costs of key processes, technologies, and equipment of EPP, expressed as C1; operating costs include energy-efficient processes and equipment produced or purchased for EPP implementation, as well as personnel inputs, etc., expressed as C2. For enterprise E1 and E3, the unit R&D cost and unit operation cost decrease with the increase of power saving. For enterprise E2, this kind of enterprise has no R&D cost but only has operation cost.
4) Carbon quotas
It mainly refers to the carbon emission quota determined by the government according to the situation of enterprises. Assume that the carbon quota stipulated by the government for each enterprise is H. The government will subsidize the carbon quota of h for every 1 kWh of electric quantity reduced by EPP. The government will deduct the carbon quota of h for every 1 kWh of electric quantity consumed by the enterprise without EPP. The carbon quota can be sold or purchased, and the economic benefit of carbon quota of h unit is d.
The main parameters and implications of the above assumptions can be represented in Table 2, and the revenue, costs, and variable returns of three different kinds of enterprises implementing EPP are presented in Figure 1.
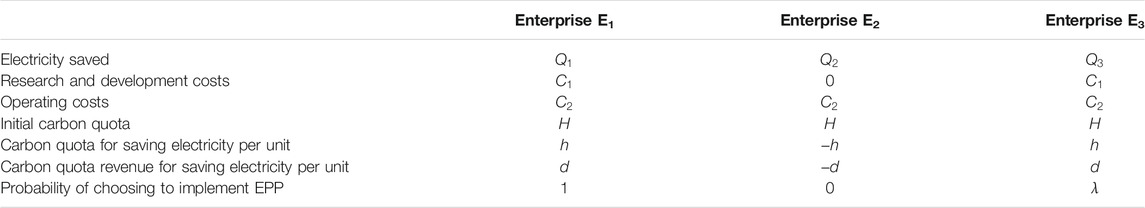
TABLE 2. Variables and meanings in the assumptions.
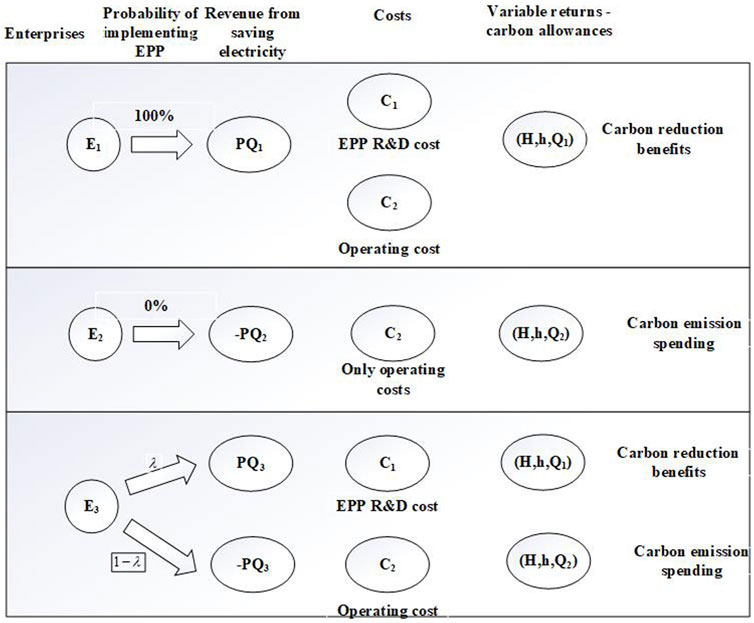
FIGURE 1. The revenue, costs, and variable returns of three different kinds of enterprises implementing EPP.
Building the Profit Functions
1) Business revenue functions for three types of enterprises:
1) Set
Put
Take the derivative of
Thus, the optimal power saving
2) Set
In the same way, take the derivative of
3) Set
In the same way, take the derivative of
Joint establishment of optimal power consumption of three kinds of enterprises, which can be simplified to
By substituting the optimal solution of the above formula into the profit function of the respective enterprises, the optimal earnings of the three types of enterprises can be further obtained as follows:
Results
Relationship Analysis of Main Parameters
1) For enterprise E1
According to Eq. 9, the electricity saved by enterprise E1 has no relationship with the total carbon quota set by the government for the enterprise and is related to the carbon quota obtained by saving each unit of electricity and the benefit of unit carbon quota. In Eq. 9, the optimized first-order derivative of
Then, result 1 can be obtained as follows. Result 1: the income of enterprise E1 is directly related to the carbon quota for implementing EPP. There is a unit of carbon quotas
Then, we analyze the relationship between revenue and R&D investment. The optimized first derivative of revenue
Then, result 2 can be obtained as follows. Result 2: in Eq. 12,
Then, we analyzed the relationship between income
Then, result 3 can be obtained as follows. Result 3: in Eq. 13, all the unknowns are positive values, and we know 0 < λ < 1; so,
2) For enterprise E2
In Eq. 10, the optimized first-order derivative of revenue
We cannot determine if
In Eq. 15, when
Then, result 4 is obtained as follows. Result 4: in Eq. 16, h and b are constants greater than 0, 0<
Similarly, in order to study the relationship between enterprise E2, income
Result 5: there is a negative correlation between enterprise E2 income and consumed carbon quota, that is, the income decreases with the increase of unit carbon quota. Within a certain range of unit carbon quota h, enterprise E2 income will increase with the increase of carbon quota consumed, but beyond a certain range, the enterprise income will decrease with the increase of carbon quota consumed. For the government, the carbon quota of E2 per unit enterprise determined must be greater than
2) For enterprise E3
In this part, we analyze the electricity saved and the revenue from enterprise E3 and discuss how the parameter changes with carbon quota and the value of the probability a of implementing EPP, so as to maximize the enterprise revenue. That is, to study the electricity saved by enterprise E3 and analyze the variation trend between electricity saved and carbon quota h, revenue d per unit carbon quota, and probability
Firstly, in Eq. 9, the first derivative of electricity quantity
Then, result 6 can be obtained as follows. Result 6: in Eq. 17, h, d and b are constants greater than 0, and 0<λ < 1. When 0<λ < 0.5, 12λd−6d < 0, and 12λℎ−6ℎ<0, that is,
Secondly, we analyze the income in Eq. 10 of enterprise E3 and find that the factors affecting enterprise income are related to the development cost, the total carbon quota given by the government, the income of carbon quota per unit, and the carbon quota obtained (or consumed) from energy saving (consumption). The relationship between the enterprise income and unit carbon quota income is analyzed as follows. In Eq. 10, the first derivative of the enterprise income
We cannot determine whether
In Eq. 19, h and b are constants greater than 0, and 0<λ < 1. So,
Then, result 7 can be obtained as follows. Result 7: when
Similarly, the change trend between enterprise benefit and unit carbon quota h is as same as the relationship between enterprise income and unit carbon quota income d, and we would not analyze separately. In other words, enterprise E3 income will decrease first and then increase with the increase of the unit carbon quota, and when
Next, we analyze the relationship between the corporate income and total carbon quota. In Eq. 10, the first derivative of enterprise E3 income
Then, result 8 can be obtained as follows. Result 8: in Eq. 21, d and h are constants greater than 0, so
Then, the first derivative of enterprise E3 income
In Eq. 22, we cannot determine whether
In Eq. 23, h, d, and b are constants greater than 0, so
Then, result 9 can be obtained as follows. Result 9: when
Verification of Results
The previous nine results are mainly obtained through mathematical model construction and derivation. In order to verify the validity of the results, this part uses Maple, simulation software, to verify the validity of the results. Maple software is one of the most general mathematical and engineering computing software in the world and is widely used in the field of mathematics and science, among which the application of Maple software to test the correctness of decision results is one of its main applications. Main steps of Maple simulation include four steps, namely, assignment of variables, establishment of simulation model, analysis model, and conclusion. Among them, numerical setting plays a crucial role in the establishment of the simulation model, which determines whether the simulation model can correctly verify the decision results.
According to the above parameter setting and requirements and referring to literature studies (Du et al., 2015; Luo et al., 2016; Huang et al., 2018), we set the values of each parameter as shown in Table 3.
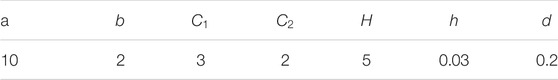
TABLE 3. The value setting of some parameters in simulation.
Now, Maple software was used to verify nine results of the changes of industry income, output, and other variables of three kinds of enterprises, respectively, and the verification processes are as follows.
1) For enterprises E1
Verification of result 1: the relationship image between enterprise E1 income
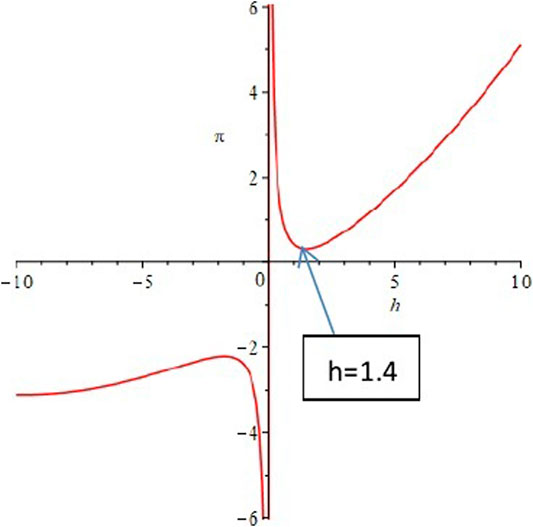
FIGURE 2. The relationship between enterprise E1 income
Verification of results 2 and 3: similarly, we set
2) For enterprise E2
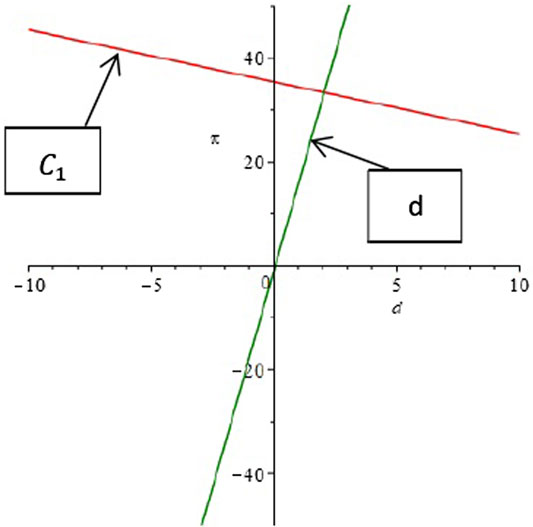
FIGURE 3. The relationship between enterprise E1 income
Verification of result 4: let
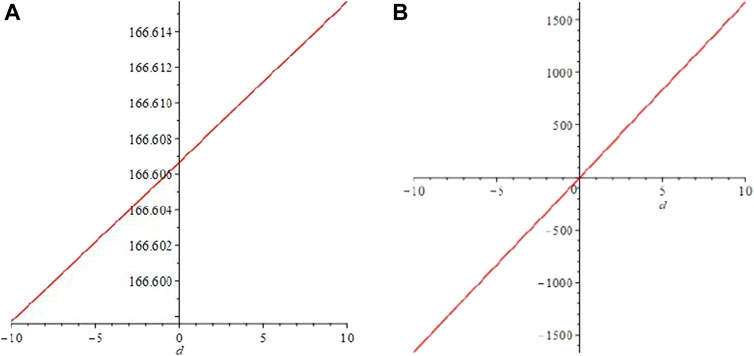
FIGURE 4. (A) The function image of the derivative of
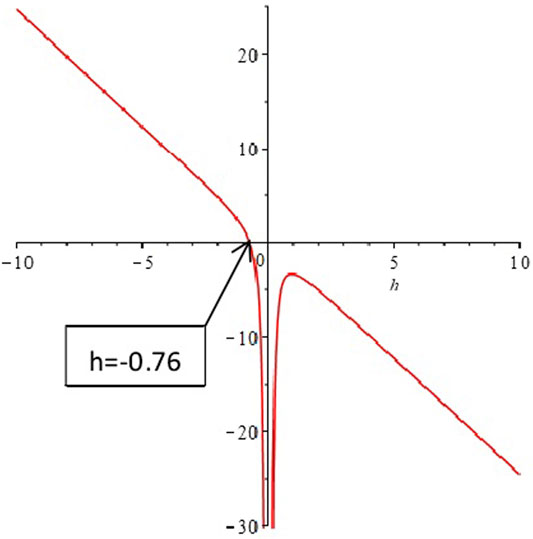
FIGURE 5. The function image of the derivative of
Verification of result 5: let
3) For enterprise E3
Verification of result 6: we analyze the relationship between electric quantity
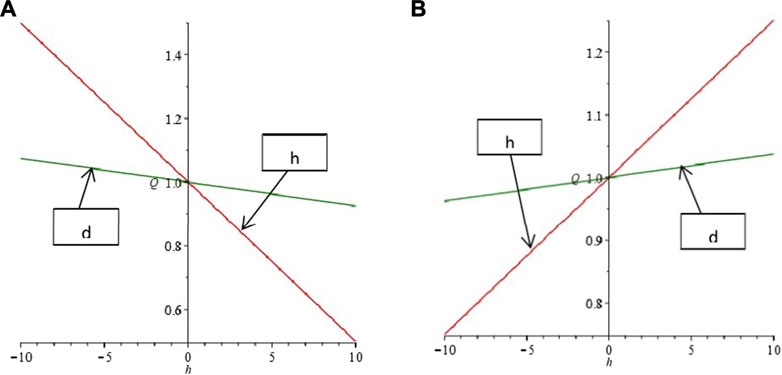
FIGURE 6. (A) The relationship between electricity
Verification of result 7: study the relationship between enterprise E3 income
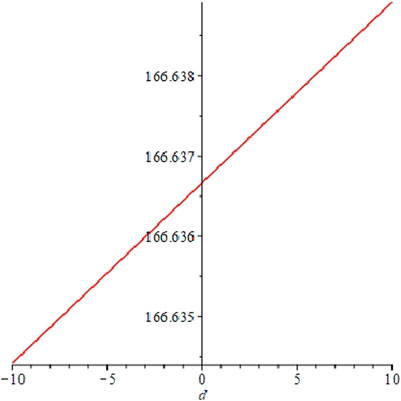
FIGURE 7. The function image of the derivative of
Verification result 8: now, study the relationship between enterprise E3 income
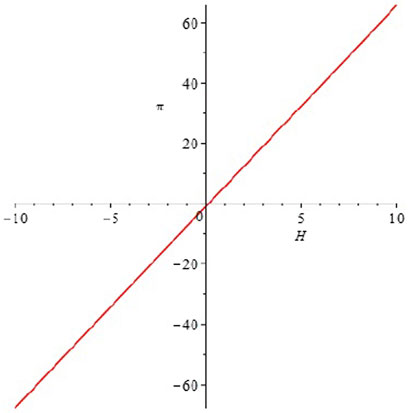
FIGURE 8. The relationship between
Verification of result 9: finally, we study the relationship between enterprise E3 income
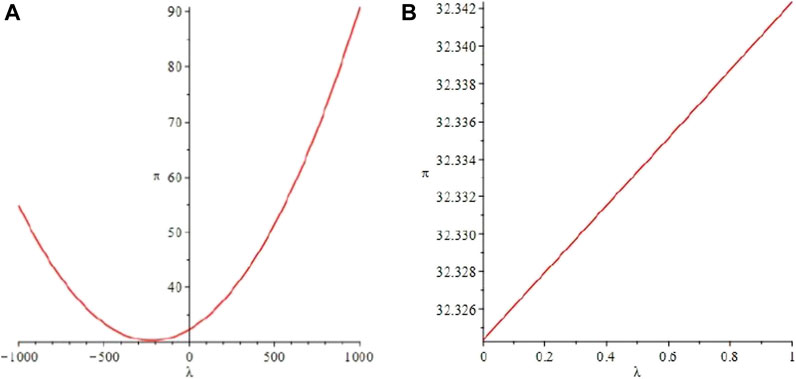
FIGURE 9. (A) The relationship between enterprise E3 earnings
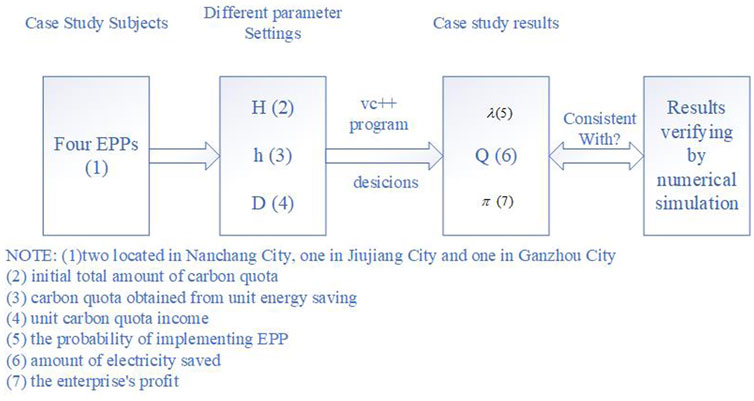
FIGURE 10. The block diagram of the case study.
Case Study
To prove the practicability of the model and the results, this part will use a case study to analyze the influence on the initial total amount of carbon quota H, carbon quota h obtained from unit energy saving, and unit carbon quota income d to the probability
1) The basic information and data of the EPP project, such as project name, investment amount, annual power saving, annual carbon emission, equipment life, and other information come from field investigation of EPP project in Jiangxi province.
2) The common parameters, such as sales price of power saved by EPP, cost of EPP implementation, and other data are referred to recent data released by authorities and Energy Statistics Yearbook.
Table 4 shows the survey object descriptions and fixed parameter setting.
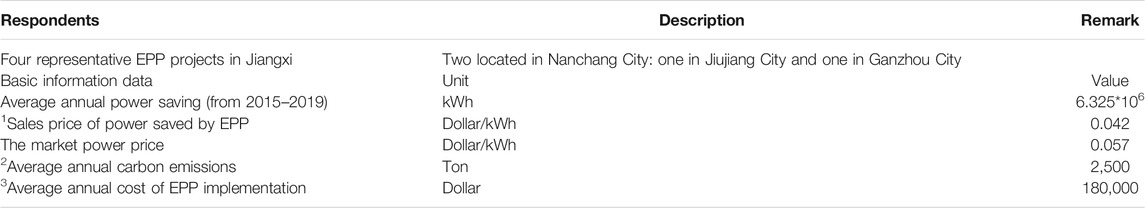
TABLE 4. The survey object descriptions and fixed parameter setting.
Note: 1Sales price of power saved by EPP fluctuates with the market, but this part does not take electricity price as the focus problem. In order to simplify the problem, we take the average selling electricity price during the observation period as the final value. 3For the cost of EPP implementation, which is also variable, we take the average value.
2The implementation of EPP has zero carbon emission, and enterprises only have carbon emissions when they do not implement EPP. Therefore, the carbon emission of the investigated enterprises is much lower than that of ordinary small or medium-sized manufacturing enterprises.
Next, we will adjust the initial total amount of carbon quota H, carbon quota h obtained from unit energy saving, and unit carbon quota income d, which will influence the decision of enterprises to implement EPP, and finally calculate the power saving and income of enterprises under the specified decision. Because the data in this study are complex and there are multifarious index operations, the VC++ (version 6.0) is used to construct a program to achieve the solution of this case study. The main code of VC++ program can refer to the code in the attachment of a previous article by Zhu et al., 2019. The block diagram of this case study can be shown in Figure 10.
The results are shown in Table 5.
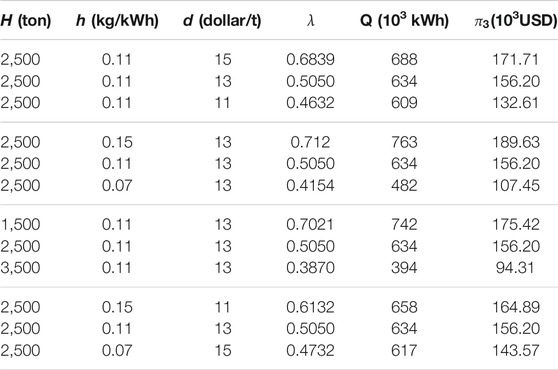
TABLE 5. The probability
According to Table 5, lines 1 through line 3 show that unit carbon quota income d has a positive effect on power saving
The results in Table 5 are consistent with those obtained in Relationship Analysis of Main Parameters, that is, we prove the above results from the perspective of empirical analysis.
Discussion
In this paper, three important contents are put forward:
Firstly, we build the profit functions of three types of enterprises, analyze the relationships of main parameters, and get nine results.
Secondly, we use Maple, the simulation software, to verify the validity of the results by drawing images of parameters. All the above nine results passed the simulation test.
Finally, we carry out an empirical analysis of a Chinese case and verify the practicability of the profit functions and the results of parameter relationship analysis through the actual survey data, which has practical guiding significance.
Compared to Zhu et al.’s, 2018, study about the general study of low-carbon investment, low-carbon investment is translated into implementation of EPP, and specific research conclusions and specific recommendations are given. Compared to literature studies by Li et al., 2017 and Sun et al., 2020, about the income study of carbon emission, the carbon emission energy savings are considered as one of the benefits of implementing EPP. Compared to (Arai et al.’s, 2014, study, correlation analysis of parameters is constructed based on three different types of enterprises and under different carbon quota constraints. Compared to literature studies by Zhu et al., 2018 and Dou et al., 2020, a simulation by Maple software and a case study in China are put forward to verify the research results.
Above all, this paper has three innovation points or improvements:
First, most research objects in literature studies about general low-carbon investment only have the function of reducing carbon emission or pollutant emission, while our research object-EPP in this paper is a special low-carbon behavior, which can reduce power consumption and carbon emission at the same time.
Second, the correlation analysis of parameters we constructed takes into account not only three types of different enterprises but also different carbon quota constraints.
Finally, through simulation and empirical analysis, we double test the profit function model and relevant results to verify their scientific effectiveness.
Conclusion and Suggestion
Conclusion
Firstly, the paper analyzed the factors affecting the earnings and output of EPP enterprises, non-EPP enterprises, and selective EPP enterprises by establishing the profit functions, and then, we studied how the income and output of three kinds of enterprises change with the carbon quota. Thus, production decisions of different types of enterprises under different carbon quotas are obtained, and the results through Maple simulation software and empirical analysis are verified, in order to provide theoretical reference for different types of enterprises to make production decisions under different carbon quotas.
Suggestions
1) As the carbon quota given by the government and the carbon quota obtained by implementing EPP increase, the enterprise will gain more disposable carbon quotas, so enterprises can sell excess carbon quotas to reap the benefits and their profits will soar. At this time, enterprises should increase the investment in EPP research and input to acquisition, continuously improve the ability of EPP core technology, so as to expand their market share, and obtain the long-term development of the enterprise.
2) The effect of carbon quota obtained by implementing EPP on the output of enterprises is much greater than that of carbon quota income per unit. When both factors have an impact on the output of an enterprise, the enterprise should give priority to the carbon quota obtained by implementing EPP, so as to ensure the maximum income of the enterprise.
3) According to the change of carbon quota and unit carbon quota income, enterprises should adjust the intensity of EPP implementation to obtain higher income. Enterprise income is positively correlated with total carbon quota, carbon quota income per unit, and the intensity (probability) of EPP implementation. Therefore, when the total carbon quota and revenue per unit of carbon quota given by the government increase, enterprises should enhance the implementation of EPP, so that enterprises can obtain higher revenue.
Data Availability Statement
The original contributions presented in the study are included in the article/Supplementary Material. Further inquiries can be directed to the corresponding author.
Author Contributions
YZ constructed the theoretical framework of the manuscript. YJ collected the data and made statistical analysis.
Funding
This work was supported by the Natural Science Foundation of China (NSFC; grant number: 71964022, grant number: 72164026), Educational Science Project of Jiangxi Province (grant number: 18YB012), and Jiangxi Culture, Art and Science Planning Project (grant number: YG2018037).
Conflict of Interest
The authors declare that the research was conducted in the absence of any commercial or financial relationships that could be construed as a potential conflict of interest.
Publisher’s Note
All claims expressed in this article are solely those of the authors and do not necessarily represent those of their affiliated organizations, or those of the publisher, the editors, and the reviewers. Any product that may be evaluated in this article, or claim that may be made by its manufacturer, is not guaranteed or endorsed by the publisher.
References
Arai, R., Yamamoto, K., Nishio, T., and Morikura, M. (2014). Differential Game-Theoretic Analysis on Information Availability in Decentralized Demand-Side Energy Management Systems. IEICE Trans. Commun. E97.B (9), 1817–1825. doi:10.1587/transcom.e97.b.1817
Çakmak, R., and Altaş, İ. H. (2020). A Novel Billing Approach for Fair and Effective Demand Side Management: Appliance Level Billing (AppLeBill). Int. J. Electr. Power Energ. Syst. 121, 106062. doi:10.1016/j.ijepes.2020.106062
Castro, M. d. F., Colclough, S., Machado, B., Andrade, J., and Bragança, L. (2020). European Legislation and Incentives Programmes for Demand Side Management. Solar Energy 200, 114–124. doi:10.1016/j.solener.2019.12.004
Castro, M. d. F., Colclough, S., Machado, B., Andrade, J., and Bragança, L. (2020). European Legislation and Incentives Programmes for Demand Side Management. Solar Energy 200, 114–124. doi:10.1016/j.solener.2019.12.004
Chakraborty, N., Mondal, A., and Mondal, S. (2020). Efficient Load Control Based Demand Side Management Schemes towards a Smart Energy Grid System. Sustain. Cities Soc. 59, 102175. doi:10.1016/j.scs.2020.102175
Chamandoust, H., Bahramara, S., and Derakhshan, G. (2020). Day-ahead Scheduling Problem of Smart Micro-grid with High Penetration of Wind Energy and Demand Side Management Strategies. Sustainable Energ. Tech. Assessments 40, 100747. doi:10.1016/j.seta.2020.100747
Chang, L., Hao, X., Song, M., Wu, J., Feng, Y., Qiao, Y., et al. (2020). Carbon Emission Performance and Quota Allocation in the Bohai Rim Economic Circle. J. Clean. Prod. 258, 120722. doi:10.1016/j.jclepro.2020.120722
Chen, H., Li, Y., Louie, R. H. Y., and Vucetic, B. (2014). Autonomous Demand Side Management Based on Energy Consumption Scheduling and Instantaneous Load Billing: an Aggregative Game Approach. IEEE Trans. Smart Grid 5 (4), 1744–1754. doi:10.1109/tsg.2014.2311122
Chen, W. (2003). Carbon Quota price and CDM Potentials after Marrakesh. Energy Policy 31 (8), 709–719. doi:10.1016/s0301-4215(02)00122-2
Dales, J. H. (1968). Pollution, Property and Prices: An Essay in Policy-Making and Economics. Toronto: University of Toronto Press.
Dou, X. (2015). The Essence, Feature and Role of Low Carbon Economy. Environ. Dev. Sustain. 17 (1), 123–136. doi:10.1007/s10668-014-9542-9
Dou, X., Wang, J., Wang, X. Y., and Wu, L. (2020). Analysis of User Demand Side Response Behavior of Regional Integrated Power and Gas Energy Systems Based on Evolutionary Game. Proc. Chin. Soc. Electr. Eng. 40 (12), 3775–3785. doi:10.13334/j.0258-8013.pcsee.190581
Du, S., Hu, L., and Wang, L. (2017). Low-carbon Supply Policies and Supply Chain Performance with Carbon Concerned Demand. Ann. Oper. Res. 255 (1-2), 569–590. doi:10.1007/s10479-015-1988-0
Du, S., Zhu, J., Jiao, H., and Ye, W. (2015). Game-theoretical Analysis for Supply Chain with Consumer Preference to Low Carbon. Int. J. Prod. Res. 53 (12), 3753–3768. doi:10.1080/00207543.2014.988888
Du, S., Zhu, L., Liang, L., and Ma, F. (2013). Emission-dependent Supply Chain and Environment-Policy-Making in the 'cap-And-Trade' System. Energy Policy 57, 61–67. doi:10.1016/j.enpol.2012.09.042
Energy Research Institute of State Grid of China (2010). Study on Ways and Means to the Construction of EPP. Beijing, China: China Electric Power Press. (In Chinese).
Haydt, G., Leal, V., and Dias, L. (2014). A Multi-Objective Approach for Developing National Energy Efficiency Plans. Energy Policy 67, 16–27. doi:10.1016/j.enpol.2013.06.133
Huang, Z., Yu, H., Chu, X., and Peng, Z. (2018). A Novel Optimization Model Based on Game Tree for Multi-Energy Conversion Systems. Energy 150, 109–121. doi:10.1016/j.energy.2018.02.091
Kalair, A. R., Abas, N., Hasan, Q. U., Seyedmahmoudian, M., and Khan, N. (2020). Demand Side Management in Hybrid Rooftop Photovoltaic Integrated Smart Nano Grid. J. Clean. Prod. 258, 120747. doi:10.1016/j.jclepro.2020.120747
Li, H., Wang, C., Xu, L., and Ou, W. (2017). Pricing, Carbon Emission Reduction, Collection Decision, and Coordination in a Low-Carbon Closed-Loop Supply Chain. J. Renew. Sustain. Energ. 9 (6), 065907. doi:10.1063/1.4991668
Li, M.-J., Song, C.-X., and Tao, W.-Q. (2016). A Hybrid Model for Explaining the Short-Term Dynamics of Energy Efficiency of China's thermal Power Plants. Appl. Energ. 169, 738–747. doi:10.1016/j.apenergy.2016.02.082
Liu, X., Gao, B., Wu, C., and Tang, Y. (2018). Demand-Side Management with Household Plug-In Electric Vehicles: a Bayesian Game-Theoretic Approach. IEEE Syst. J. 12 (3), 2894–2904. doi:10.1109/jsyst.2017.2741719
Luo, Z., Chen, X., and Wang, X. (2016). The Role of Co-opetition in Low Carbon Manufacturing. Eur. J. Oper. Res. 253 (2), 392–403. doi:10.1016/j.ejor.2016.02.030
Mahmoudi, R., Emrouznejad, A., Khosroshahi, H., Khashei, M., and Rajabi, P. (2019). Performance Evaluation of thermal Power Plants Considering CO2 Emission: A Multistage PCA, Clustering, Game Theory and Data Envelopment Analysis. J. Clean. Prod. 223, 641–650. doi:10.1016/j.jclepro.2019.03.047
Mendes, D. L. S., Rabelo, R. A. L., Veloso, A. F. S., Rodrigues, J. J. P. C., and dos Reis Junior, J. V. (2020). An Adaptive Data Compression Mechanism for Smart Meters Considering a Demand Side Management Scenario. J. Clean. Prod. 255, 120190. doi:10.1016/j.jclepro.2020.120190
Rai, V., and Beck, A. L. (2017). Play and Learn: Serious Games in Breaking Informational Barriers in Residential Solar Energy Adoption in the United States. Energ. Res. Soc. Sci. 27, 70–77. doi:10.1016/j.erss.2017.03.001
Srikanth Reddy, K., Lokesh Kumar Panwar, L. K., Panigrahi, B. K., Rajesh Kumar, R., and Xu, Y. (2020). A Dual Objective Approach for Aggregator Managed Demand Side Management (DSM) in Cloud Based Cyber Physical Smart Distribution System. Future Generation Comput. Syst. 105, 843–854. doi:10.1016/j.future.2017.08.019
Sun, L., Cao, X., Alharthi, M., Zhang, J., Taghizadeh-Hesary, F., and Mohsin, M. (2020). Carbon Emission Transfer Strategies in Supply Chain with Lag Time of Emission Reduction Technologies and Low-Carbon Preference of Consumers. J. Clean. Prod. 264, 121664. doi:10.1016/j.jclepro.2020.121664
Venizelou, V., Makrides, G., Efthymiou, V., and Georghiou, G. E. (2020). Methodology for Deploying Cost-Optimum price-based Demand Side Management for Residential Prosumers. Renew. Energ. 153, 228–240. doi:10.1016/j.renene.2020.02.025
Wang, J.-M., Ge, X., Zhang, L., and Zhang, H. (2016). Management Index Systems and Energy Efficiency Diagnosis Model for Power Plant: Cases in China. Math. Probl. Eng. 2016, 1–13. doi:10.1155/2016/8159871
Wang, J. M., and Zhu, Y. P. (2014). Cost-benefit Analysis of DSM Energy-Efficiency Project in Low-Carbon Vision: a Case in China. Energy Education Science and Technology Part A. Energ. Sci. Res. 32 (1), 645–658. doi:10.1016/j.enbuild.2014.07.008
Wang, J., Zhu, Y., and Li, Y. (2015). EPP Energy Efficiency Calculation and Influencing Factor Analysis: Cases in China. Math. Probl. Eng. 2015, 1–8. doi:10.1155/2015/986562
Zhang, Y.-J., Wang, A.-D., and Da, Y.-B. (2014). Regional Allocation of Carbon Emission Quotas in China: Evidence from the Shapley Value Method. Energy Policy 74, 454–464. doi:10.1016/j.enpol.2014.08.006
Zhu, G., Pan, G., and Zhang, W. (2018). Evolutionary Game Theoretic Analysis of Low Carbon Investment in Supply Chains under Governmental Subsidies. Ijerph 15 (11), 2465. doi:10.3390/ijerph15112465
Zhu, Y., Hu, Y., and Zhang, F. (2017). Progressive IRP Models for Power Resources Including EPP. Math. Probl. Eng. 2017, 1–7. doi:10.1155/2017/2520346
Keywords: efficiency power plants, implementation decision, carbon quota, relationship analysis, maple
Citation: Zhu Y and Jin Y (2021) Efficiency Power Plant Implementation Decision-Making Based on the Profit Function and Its Numerical Simulation. Front. Energy Res. 9:628206. doi: 10.3389/fenrg.2021.628206
Received: 11 November 2020; Accepted: 18 August 2021;
Published: 15 September 2021.
Edited by:
Hong-zhou Li, Dongbei University of Finance and Economics, ChinaReviewed by:
Neeraj Dhanraj Bokde, Aarhus University, DenmarkShuai Geng, Shandong Jianzhu University, China
Copyright © 2021 Zhu and Jin. This is an open-access article distributed under the terms of the Creative Commons Attribution License (CC BY). The use, distribution or reproduction in other forums is permitted, provided the original author(s) and the copyright owner(s) are credited and that the original publication in this journal is cited, in accordance with accepted academic practice. No use, distribution or reproduction is permitted which does not comply with these terms.
*Correspondence: Yiping Zhu, zhuyipingnet@ncu.edu.cn