
Influence of Population Density on CO2 Emissions Eliminating the Influence of Climate


Departamento de Ingeniería Eléctrica, Escuela Superior de Ingeniería, Universidad de Sevilla, Camino de los Descubrimientos, s/n, 41092 Sevilla, Spain
*
Author to whom correspondence should be addressed.
Atmosphere 2021, 12(9), 1193; https://doi.org/10.3390/atmos12091193
Submission received: 5 August 2021
/
Revised: 10 September 2021
/
Accepted: 14 September 2021
/
Published: 15 September 2021
(This article belongs to the Special Issue Impacts of Air Pollution in Spain)
Abstract
:More than 50% of the world’s population lives in cities. Its buildings consume more than a third of the energy and generate 40% of the emissions. This makes cities in general and their buildings in particular priority points of attention for policymakers and utilities. This paper uses population density as a variable to know its influence on energy consumption and emissions produced in buildings. Furthermore, to show its effect more clearly, the influence of the climate was eliminated. The usual energy consumption in buildings is thermal and electrical. The study was carried out at the city level, both per inhabitant and per household. The area actually occupied by the city was considered. The proposed method was applied to the case of Spanish cities with more than 50,000 inhabitants. The results show that the higher the population density, the higher the energy consumption per inhabitant and household in buildings. The consumption of thermal energy is elastic, while that of electrical energy is inelastic, varying more than 100% between extreme groups. Regarding CO2 emissions, the higher the population density, the higher the emissions. Emissions of electrical origin barely vary by 2% and are greater than those of thermal origin. In addition, the proportion of emissions of electrical origin, with respect to the total, decreases with increasing population density from 74% to 55%. This research aims to help policymakers and utilities to take the appropriate measures that favor the use of renewable energies and reduce CO2 emissions.
Keywords:
urban population; CO2 emissions; energy consumption; climate; urban sustainability; buildings; Spain1. Introduction
More than half of the world’s population currently lives in cities. In addition, it is estimated that by 2030 this population will reach 60%. In certain areas, the population is even larger, reaching 70% in Europe and estimated to be over 80% in 2050 [1]. This demographic increase in cities leads to 80% of energy being consumed in them [2]. Additionally, the main greenhouse gases (GHG) are carbon dioxide (CO2), methane (CH4), nitrous oxide (N2O), and hydrofluorocarbons (HFCs). However, without a doubt, CO2 is the most worrying since it represents 80% of total emissions, corresponding to transport only slightly more than 30% [3]. Within cities, buildings consume 36% of energy and produce 40% of emissions [4], with electricity and natural gas being the usual forms of consumption in them [5]. Furthermore, they are responsible for the main growth in emissions [6].
Given this background, buildings have become a priority focus for both reducing energy consumption and emissions. Thus, several of the Sustainable Development Goals of the United Nations focus their attention on cities. Goal 11 focuses on the sustainability of cities through resource efficiency, and mitigation and adaptation to climate change; Goal 13, addresses climate change and its impacts, including on the atmosphere; Goal 7 is oriented towards the use of renewable energies; and Goal 12 focuses on sustainable consumption [7].
This concern is not only found at the global level through the United Nations but also, for example, at the European level. Thus, the European Union has launched a €750 billion recovery plan COVID-19 [8]. This plan is configured in six priority action areas, one of which is construction and buildings [9]. Moreover, descending to a level closer to the citizens is the Covenant of Mayors. Initially, it was European in scope, but later became global and changed its name to Climate and Energy. Currently, it is made up of more than 8000 cities in 53 countries around the world [10].
This research is carried out by studying energy consumption and emissions from city buildings. The results obtained are per household and inhabitant at the city level. Both households and inhabitants are assigned, in addition to consumption and emissions from residential buildings, those corresponding to the buildings that make up administrative offices and the tertiary sector. In this way, all buildings are covered. In addition, it must be considered that a city has a greater number of non-residential buildings depending on the number of inhabitants, and its reason for being is to serve them. For this reason, its consumption and emissions were distributed among the households and inhabitants of the city.
With a good knowledge of the current state of energy consumption and emissions in cities, it will be easier to cope with climate change, promote urban sustainability and improve air quality in cities. Thus, policymakers will be able to legislate to ensure that energy is consumed efficiently; and utilities will be able to plan the infrastructures to supply energy to cities in a sustainable way.
The study method used is based on statistical analysis. It is based on classical methods that use statistical databases and that continue to be used recently [11,12,13,14,15], and in others that create synthetic populations [16]. In this way, the population is represented in a simplified way from aggregated public data.
The main contributions of this paper are: investigate energy consumption and emissions of city buildings based on population density; eliminate the influence of the climate on these factors; analyze the results by household and by inhabitant; carry out the study at the city-level and not in an aggregate way for a large area; and show the application of the method to the case of Spanish cities with a population greater than 50,000 inhabitants. These studies, to the authors’ knowledge, have not been carried out previously.
The article is structured as follows: Section 2 presents studies that relate energy in cities with the population density; a description of the proposed method is presented in Section 3; Section 4 shows the application of the method to the case of Spanish cities; then, the results per inhabitant and household are revealed and discussed in Section 5; and finally, Section 6 summarizes the findings of the study.
2. Literature Review
The importance that cities are acquiring both in energy consumption and in the valuation of their emissions is reflected not only in the measures that governments are taking, but also in the studies carried out by researchers [17]. In cities, buildings are one of the main elements that consume energy and emit pollutants [18].
Usually, the works that study energy consumption focus on two aspects: make a forecast of consumption, and analyze how different variables influence it. Forecasts of electricity consumption for Spain [19] or natural gas for Poland [20] were made. They were also carried out at the sectoral level, as was the case in the residential sector [21].
To carry out the studies, different variables were used. However, population density is a variable that is quite important and that, on the contrary, has been little used in research [22]. The variable most similar to density and commonly used was urbanization. This is defined as the amount of population living in urban areas with respect to the total. It is used when studying large areas [23]. However, it is not suitable when looking to analyze smaller areas. In those cases, population density was more useful. With it, analyzes can be carried out at the city level [24]; and details in larger areas, such as at the country-level [25].
To calculate the population density, it is necessary to know both the area considered and the population that lives in it. However, it is usual to find that it is calculated in an inappropriate way from the point of view of the authors. Thus, when considering the population density of a city, the entire municipality is usually considered. That is, a city is in a municipality, and the municipality usually occupies a larger area than the city since there are unpopulated areas in it. Therefore, when calculating the population density in this way, it results in a lower value than it really corresponds. The extension that must be considered is the one that the buildings of the city occupy only, and that is the one that its inhabitants really occupy.
Studies that analyze the influence of population density on energy consumption in cities also consider that of vehicles [26]. In this way, the great influence that buildings have on energy consumption is masked.
Papers that study energy consumption in buildings analyze a specific sector. A sample of 620 urban households was analyzed in Malaysia. The average consumption of electrical energy was determined, and the higher the quality of life of the inhabitants, the greater the consumption [27]. Energy consumption at the residential level was also calculated in 29 Chinese provinces. The conclusion was that population density has a nonlinear impact. It increases to a certain value, beyond which it has little influence [28]. The service sector was also analyzed in Japan. In this case, the higher the density, the lower the per capita consumption. Thus, by doubling the population in the municipality, energy efficiency increased by 12% due to higher productivity [29].
Factors influencing energy consumption in different countries were also analyzed. The results were not conclusive either. Thus, in Kenya, the higher the urbanization and population density, the lower the energy consumption. However, with the consumption of electrical energy, the opposite occurs [30]. In China, the influence of urbanization and population density were opposite. While increasing density increases energy consumption, increasing urbanization decreases it [31]. On the contrary, in Canada, the higher the population density, the lower the electricity consumption per capita [32]. Even in a study of 93 countries, the findings differed from country to country [33].
Research on emissions in houses [34], locomotion [35,36], industry [37], avoided by electric vehicle [38], estimates at the country level [39], or policy guidelines for reducing emissions [40] were carried out. Increasingly, the existence of databases for the evaluation of air quality is being used [41]. In rural areas of developing countries, coal and solid biomass are used as fuels. These type of emissions were also investigated [42]
Emissions produced in the city, including transport, are usually studied [43]. In addition, instead of density, urbanization is once again the frequently used variable. Its impact on air pollution was studied, concluding that it has a great impact on it [44]. However, other studies conclude that this impact varies over the years. This is the case of the analysis carried out in the city of Wuhan in China [45]. The influence of this and other variables on emissions was also studied. The conclusion obtained was that urbanization was one of the variables that have the greatest influence [46]. However, in other cases, the opposite conclusion was reached [47]; or that the influence was shaped similar to an inverted U-shape [48]. In addition, the influence of urbanization on airport emissions at the city level was studied, reaching the conclusion that it exerts a strong positive correlation [49]
Unlike what happens with energy consumption, the density variable was used in more research. One type of research that is frequently encountered is the analysis of the type of influence that certain variables, including density, have on emissions. Thus, it was investigated with foreign indirect investment in China [50]; or with energy consumption, economic growth, and trade openness in India [51]; in them, it was obtained that density was the variable that had the most influence. However, in the study of this variable, together with economic growth, energy consumption, and trade openness in 11 Asian countries, the impact was negligible [52]. It was also found that in China the relationship between CO2 emissions and population density was an inverted U-shaped [53].
At the city level, the factors that influenced indirect emissions in the household were studied in Beijing, and urbanization was one of those that increased them [54]. In addition, 49 cities were studied in Japan using density as a variable. However, a clear conclusion could not be reached [55].
Therefore, there were not many studies that related population density to energy consumption in buildings. Moreover, although there were some that performed it with electricity consumption, there was hardly any with the consumption of natural gas. Something similar, although less accentuated, occurs with the analysis of population density and CO2 emissions. Therefore, there is a need to study how energy consumption and emissions that are produced in buildings are influenced by population density in cities, in particular in the case of Spain.
3. Materials and Methods
An important part of the proposed method is the management of the data sources that contain the necessary information and the relationship between them. Whenever possible, databases should be public and come from official organizations.
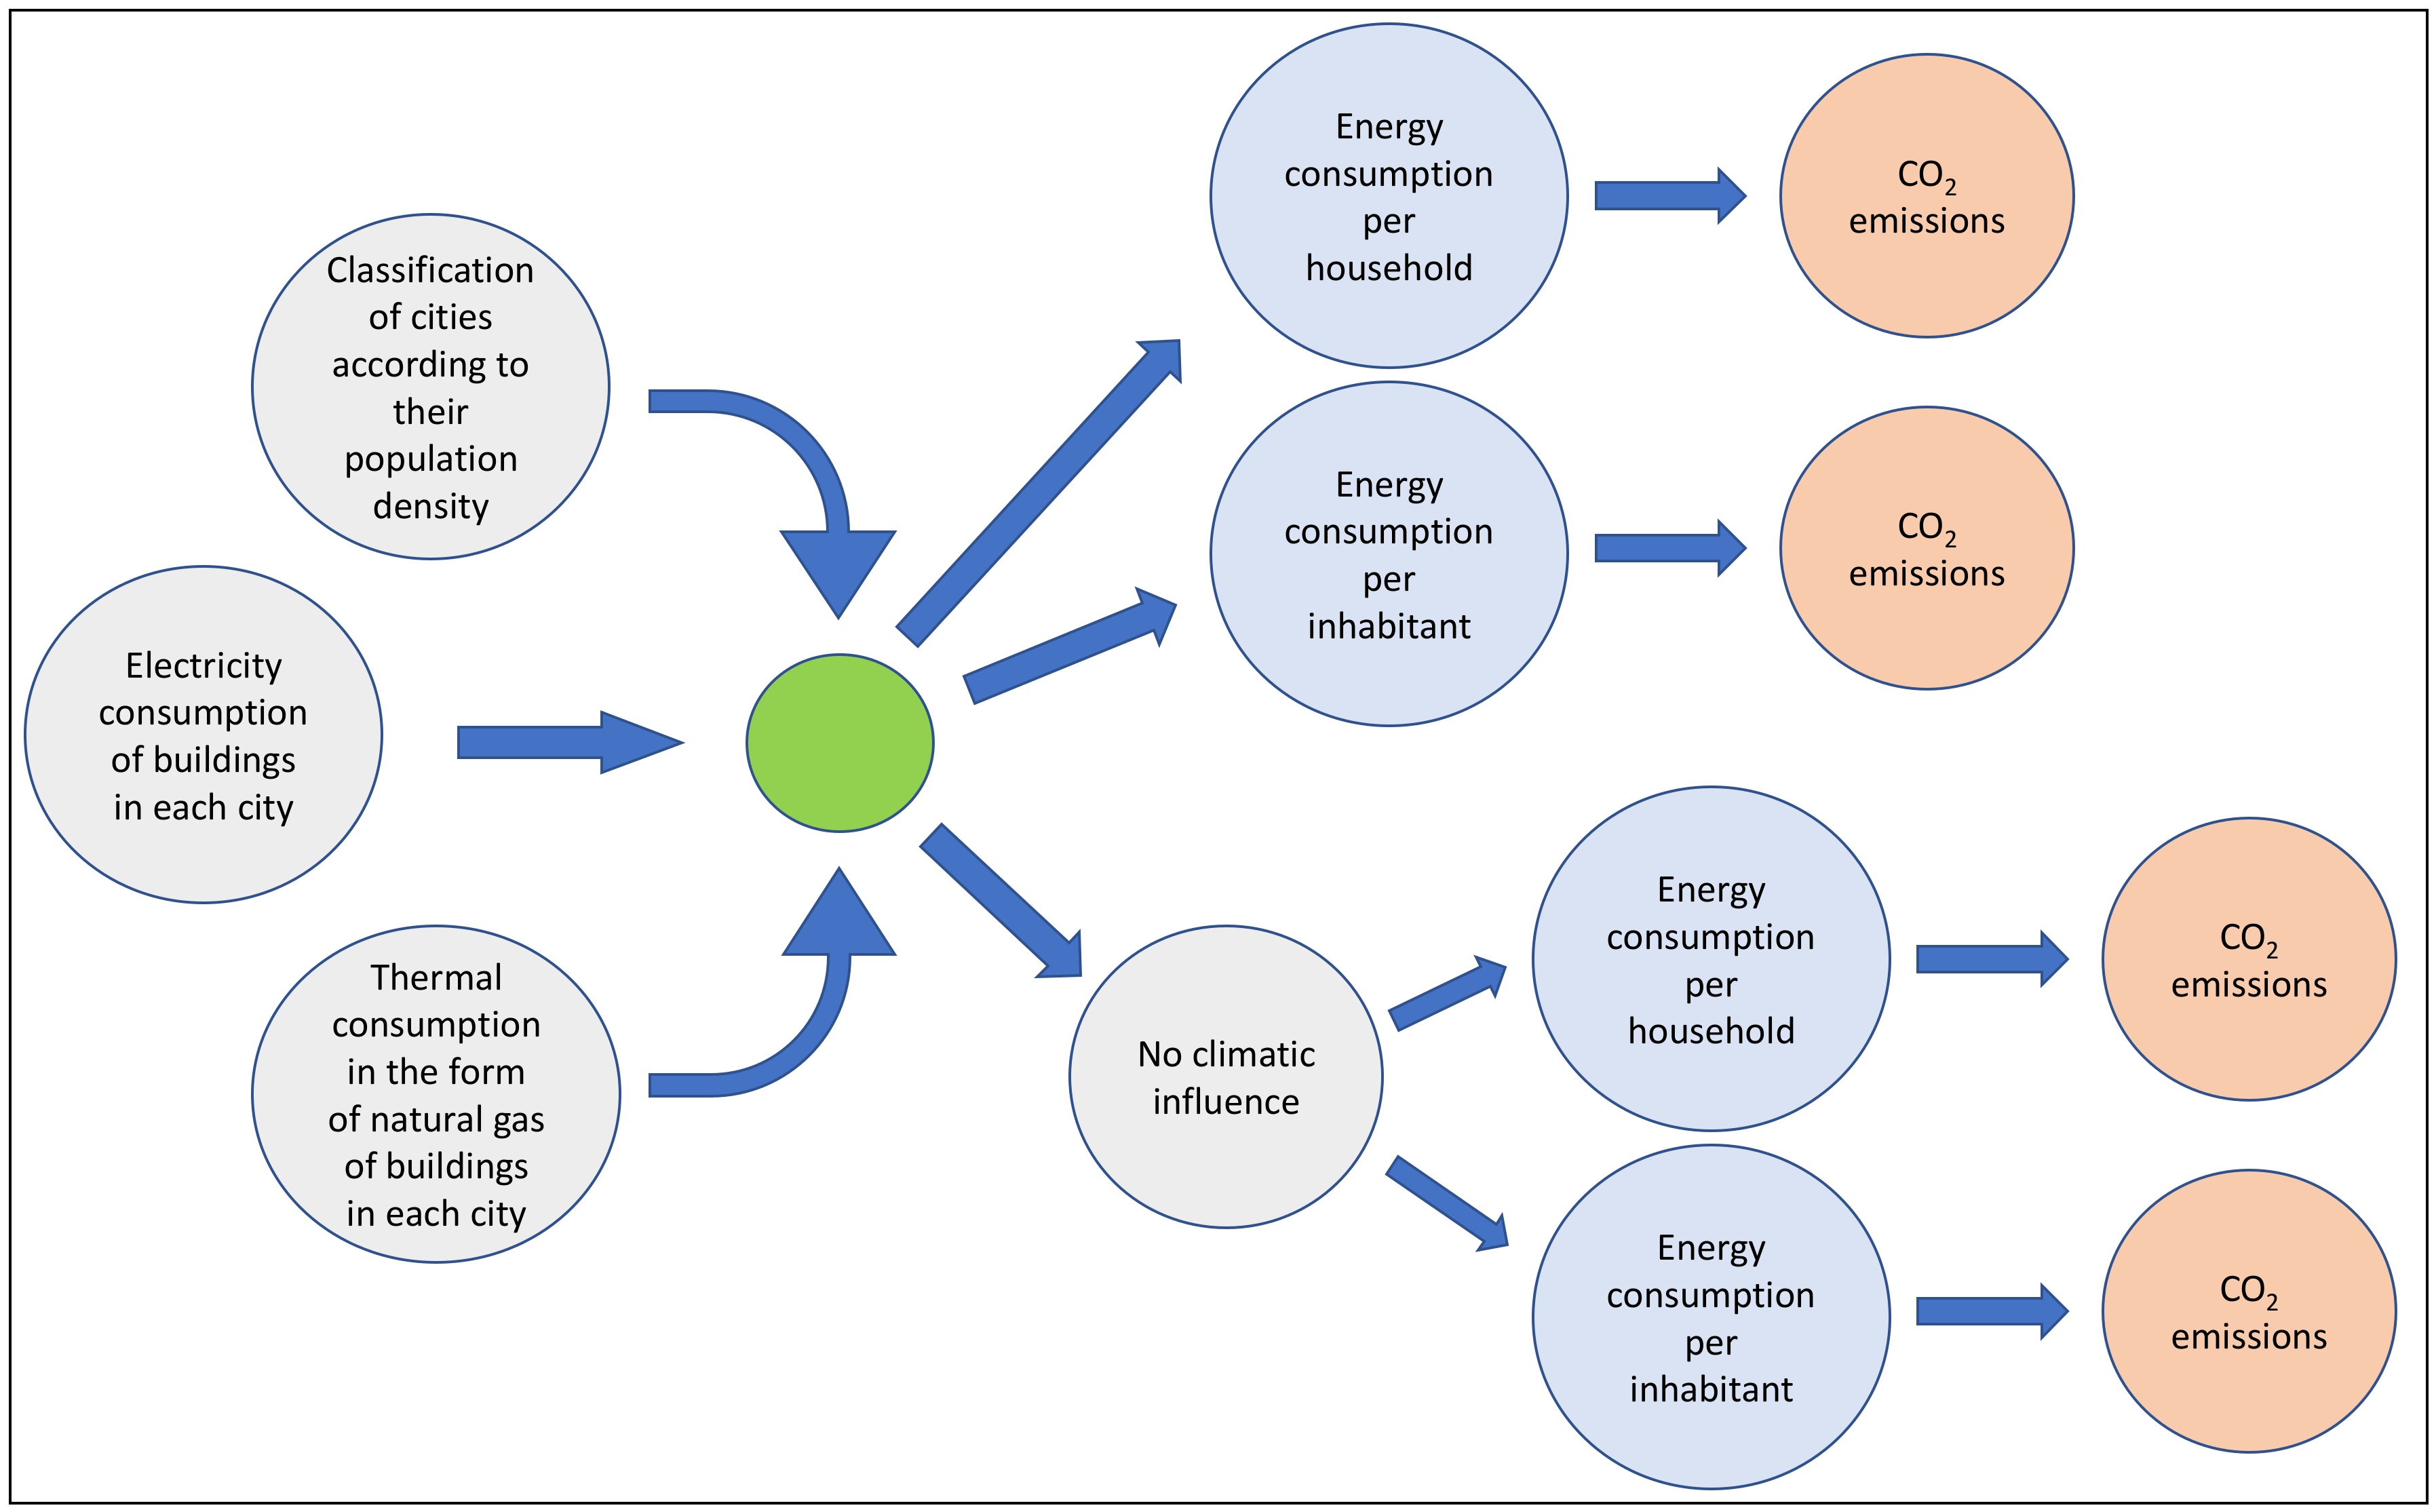
First, the cities that are within the area of interest are defined. Next, the number of inhabitants of them and the extension that they occupy are identified. This point is very important because it is necessary to consider the area actually occupied by the city, not the entire extension that the municipality can occupy. This is so because the extension of the municipality is normally much greater than that of the city. Next, the electrical and thermal consumption per inhabitant and household are found. From these consumptions, CO2 emissions are calculated. To eliminate the influence of the climate, the electrical and thermal consumptions of the buildings are found. Finally, the emissions without the influence of the climate are calculated. A flowchart of the proposed method is shown in Figure 1.
The results obtained will make it possible to undertake the necessary measures to reduce energy consumption in buildings and their emissions in each city. In this way, the behavior that occurs in each of them is distinguished.
3.1. Population Density of Cities
The two data necessary to calculate the population density are the number of inhabitants and the area occupied by the city. Information on the population of a city and the municipality in which it is located are usually separated. However, with the occupied surface, that does not happen. Thus, most of the time, the information provided is the area of the municipality, which is larger than that of the city. It must be considered that this area also includes land not occupied by buildings. At the authors’ consideration, the information on the area covered only by the city should be considered. The occupied surface may be continuous or discontinuous depending on the type of buildings.
Therefore, about the surface of the city, only the area occupied by continuous and discontinuous urban fabric is considered in the study [56].
3.2. Classification of Cities by Population Density
First, the cities to study must be selected. The selection will depend on the information that is of interest to obtain. Information on the number of inhabitants of each one of them and the surface that it really occupies must be obtained. In this way, its density was calculated. Next, cities with similar densities were grouped.
The main statistical results of each group were calculated. They were obtained for both electrical and thermal consumption and the total for each group:
where ni is the number of cities that belong to group i; is the mean energy consumed in group i; Eij is the energy consumption of city j, which is located in group i; si is the standard deviation of the energy consumed in the cities of group i; the energy consumed will be thermal, electric, or total depending on the case study; and cities consumptions should be listed in ascending order to calculate the median.
The density variation index (DVI) was used to analyze the variations in energy consumption of each group [57]:
where is the index of the group of cities that have size i, is the energy consumption mean value of group i and is the mean energy consumption of all cities (of all groups). This index makes it easier to analyze the behavior of each group.
3.3. Electric and Thermal Energy Consumption
The consumption of thermal and electrical energy was considered in the buildings of the city. Therefore, the one corresponding to the means of transport was not considered, nor the one corresponding to the industries. However, it was considered that of homes, government buildings, and those of the tertiary sector. All this consumption was distributed by households and inhabitants. This was considered in this way because, in a city, the number of buildings other than homes was greater because of a greater number of inhabitants. In addition, these buildings exist because a population lives there that must be serviced. Therefore, that energy was assigned to the inhabitants, although they do not consume it directly, but that consumption exists because they live in the city.
Certain activities were considered to calculate electricity consumption. The classification of the Statistical Classification of Economic Activities in the European Community, commonly referred to as NACE (for the French term “nomenclature statistique des activités économiques dans la Communauté européenne”) was considered [58]. The following items were used: 36 to 39, 53, 60, 61, 72, 84 to 88 (exc. 85.5 and 85.6), 91, 99, 45 to 47, 58.2, 59, 62 to 71, 73 to 75, 77 to 82, 85.5, 85.6, 90, 92 to 98.
Regarding thermal consumption, supply points with a pressure equal to or less than 4 bar and a consumption between 5000 and 50,000 kWh per year were considered. They correspond to homes, public administrations buildings, and the tertiary sector.
3.4. CO2 Emissions
CO2 emissions depend on the mix of both thermal and electrical energy production. For each country, it will have different values. Therefore, it is necessary to know the sources of both electricity and natural gas generation.
3.5. Elimination of Climate Influence
The objective of eliminating the influence of the climate is to be able to observe more clearly in the results the influence of population density on energy consumption and CO2 emissions without that influence. To conduct this, the selected cities must be located on a map of the area considered to identify the climate that affects them. Therefore, this classification must be crossed with the density groups that are established. In this way, a correction factor to apply to the consumption of each city will be obtained [12]:
where is the mean energy consumed in the climate zone i; is the mean energy consumed in all cities studied; and is the correction factor. Each city will be affected by the correction factor that corresponds to the climate where it is located. In this way, the energy consumed by each city is corrected and the influence of the climate eliminated.
4. Practical Application
A recent article conducted a similar study [57]. However, it did not analyze the CO2 emissions produced by energy consumption, nor did it study the behavior that occurs in cities when eliminating the influence of the climate. Numerous studies indicated that climate was one of the factors that had the greatest influence on energy consumption and, therefore, on emissions [59,60]. Hence, the importance of eliminating this factor when conducting the study. This work takes advantage of the analysis and findings obtained and continues from them. Section 5.1, Section 5.2, and Section 5.3 repeats them succinctly because, without them, the investigation cannot be successfully completed.
The proposed methodology was applied to Spain. Cities with more than 50,000 inhabitants were selected and represented more than 50% of the population. The data used correspond to the year 2016. The results obtained will allow policymakers and energy utilities to make decisions to achieve sustainability in urban centers.
4.1. Classification of Spanish Cities
The 145 Spanish cities with more than 50,000 inhabitants were considered. To classify them, data on their population [61] and the area they occupy [62] were taken. This information, together with that necessary to calculate thermal and electrical consumption and emissions, was obtained from public and official databases.
The number of inhabitants per hectare was used to segment the cities into five groups. Remember that 1 hectare is 10,000 square meters. Group 1 included cities with less than 100 inhabitants/hectare; Group 2 included cities between 100 and 200 inhabitants/hectare; Group 3 covered cities with densities between 200 and 300; in Group 4 were those between 300 and 400 inhabitants/hectare; finally, Group 5 included cities with a density greater than 500. This classification is shown in Table 1. Furthermore, the number of inhabitants per household was similar in all groups, as can be observed in Table 2.
4.2. Thermal and Electric Energy Consumption
The data were obtained from the following official sources: Spanish National Statistics Institute [63], National Commission on Markets and Competition [64] (they were both dependent on the Ministry of Economic Affairs and Digital Transformation), and Secretary of State for Energy [65] (which depends on the Ministry for Ecological Transition and Demographic Challenge).
4.3. CO2 Emissions
The Spanish government set CO2 emission factors basing on the Directive 2010/31/UE of the European Parliament and of the Council of 19 May 2010 on the energy performance of buildings. These factors were those established in 2016, and they were the ones to be used in the building sector [66]. It established the natural gas CO2 emission factor as 0.252 tCO2/MWh. Likewise, it established CO2 emissions as 0.291 tCO2/MWh for electricity points of consumption considering all types of generators and sources.
4.4. Elimination of Climate Influence
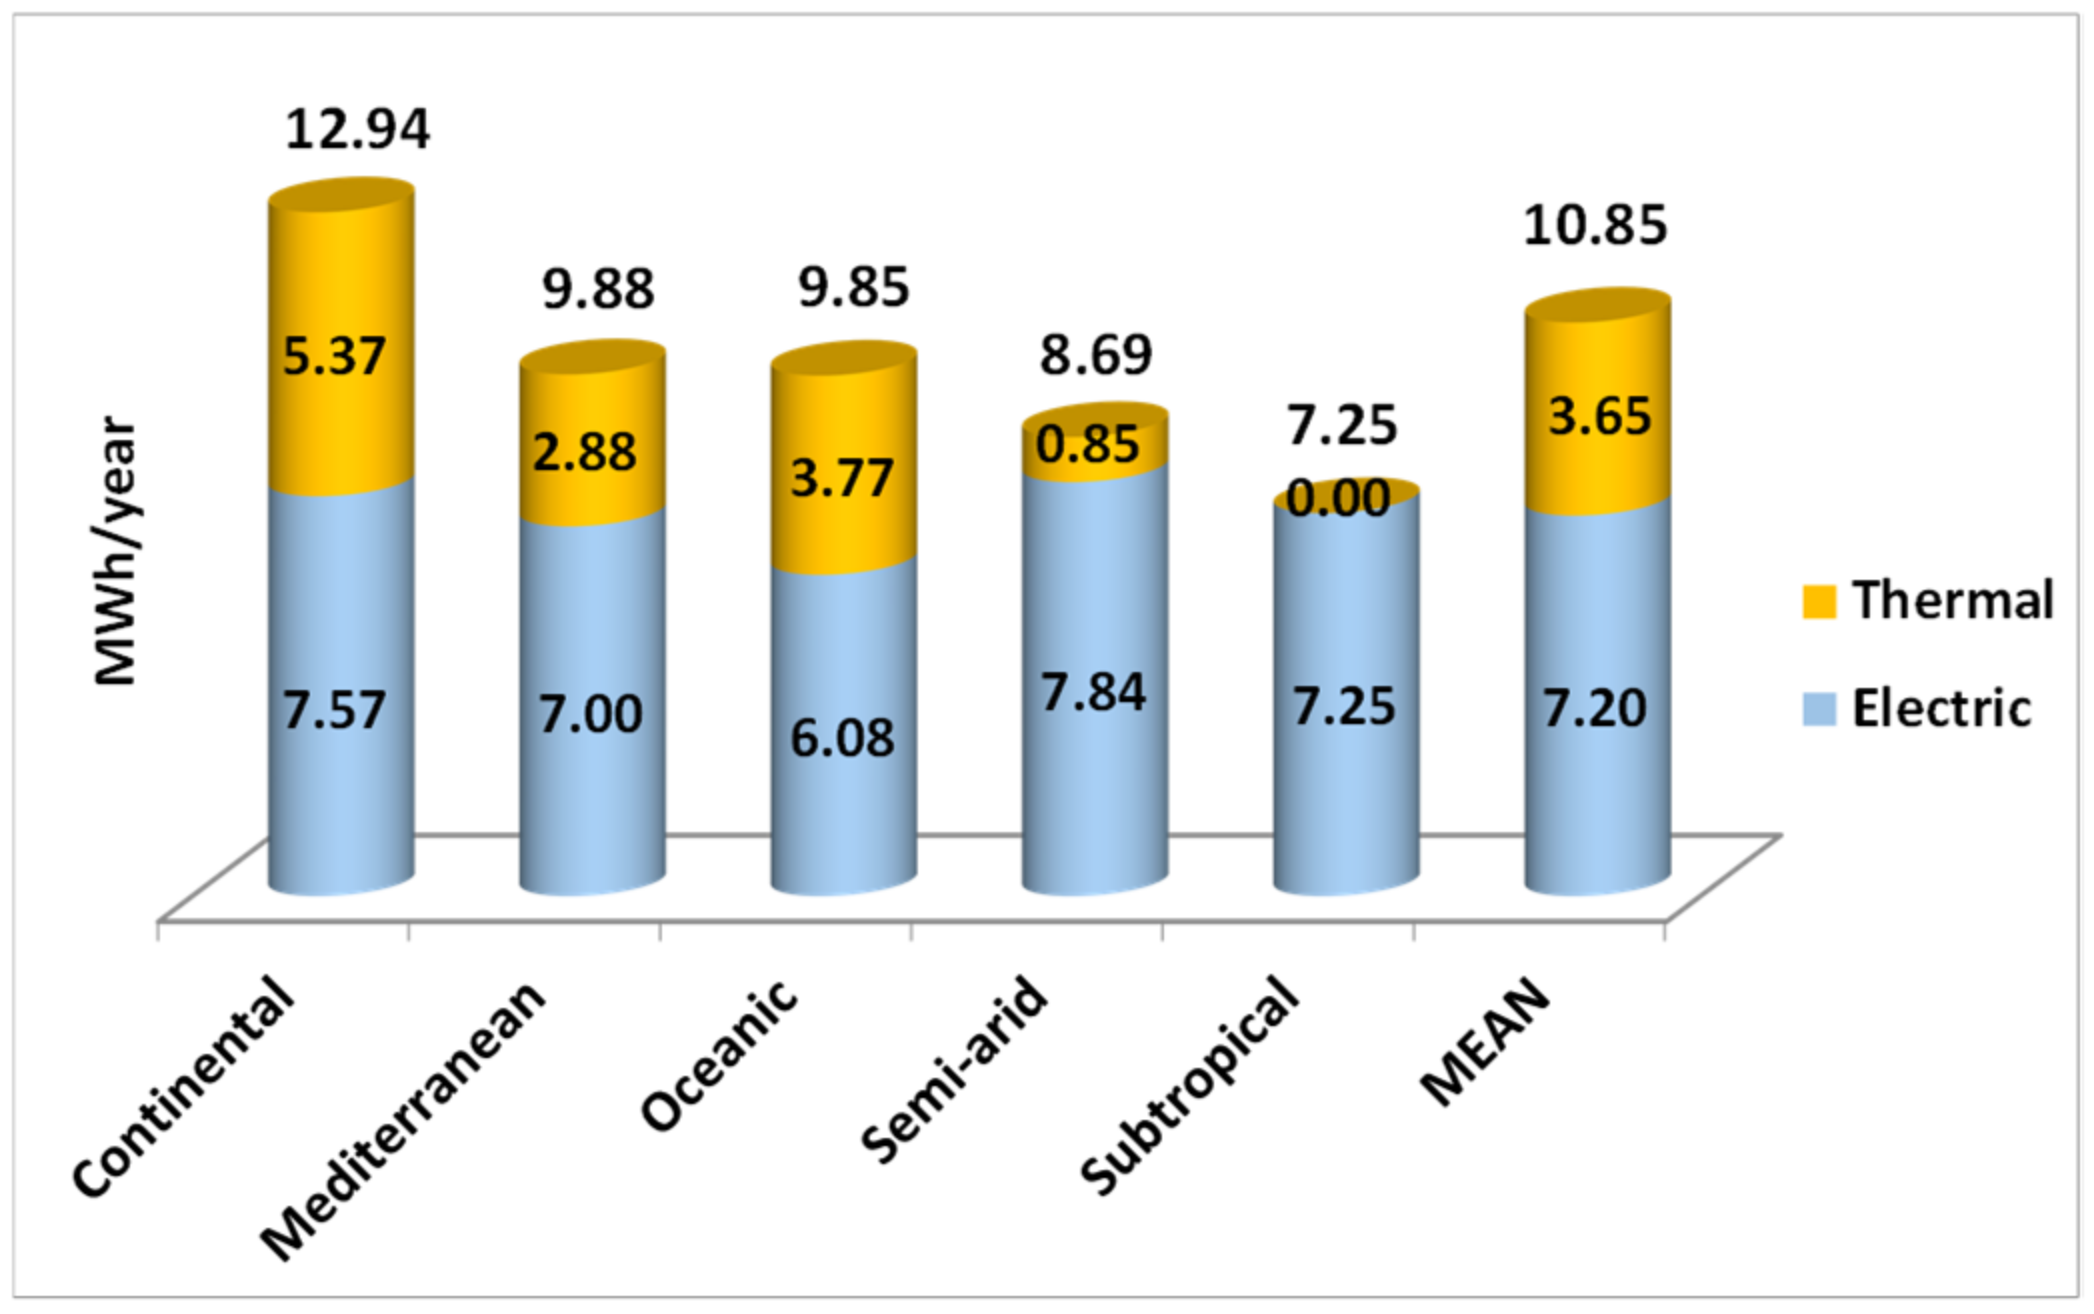
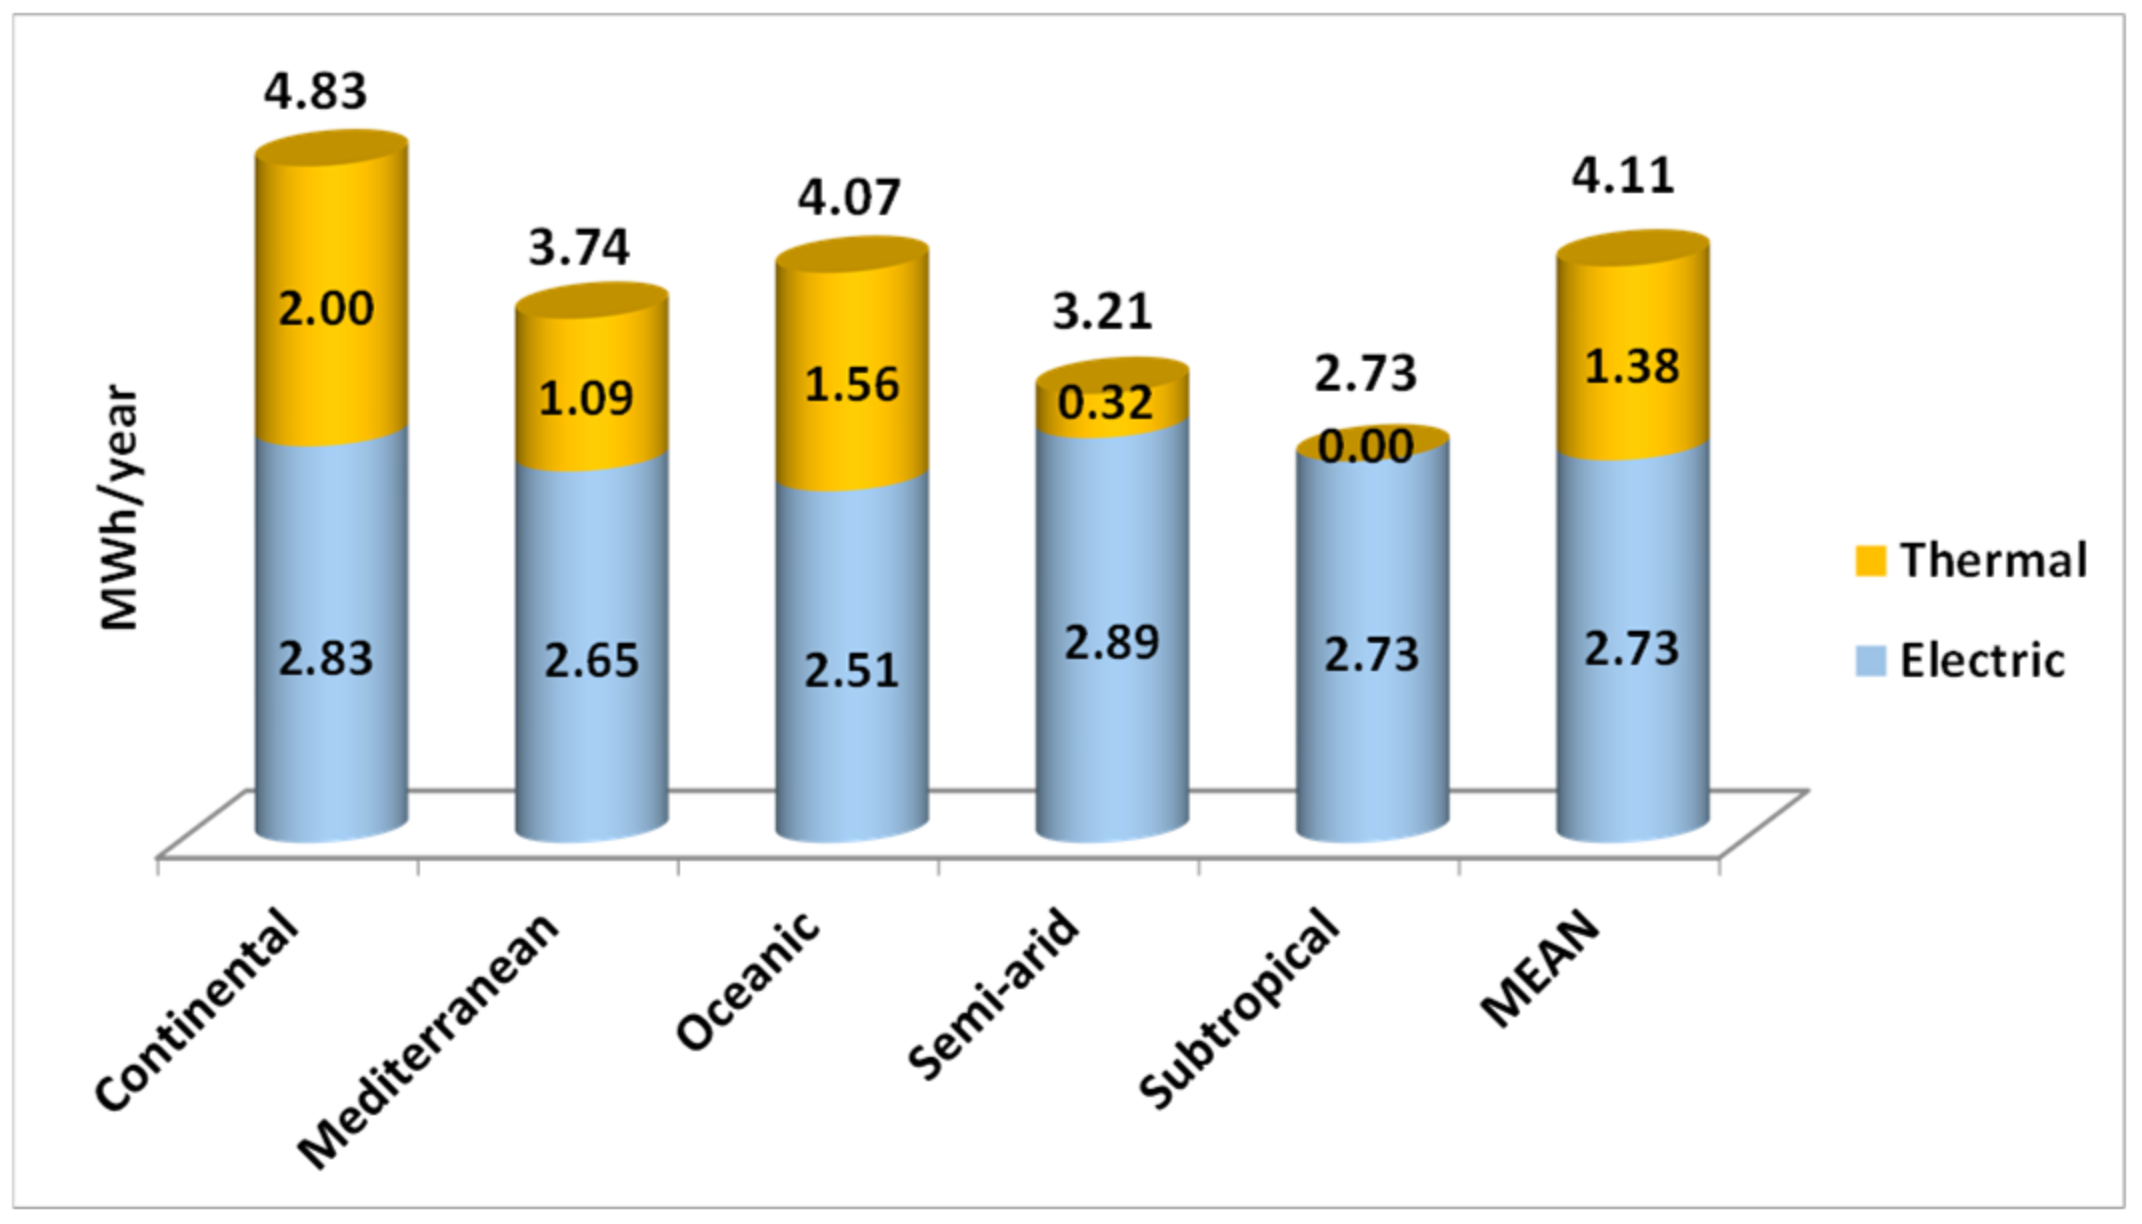
The climate that affects each of the cities was identified. Table 1 also shows the type of climate with which each one was affected: (C) continental, (M) Mediterranean, (O) oceanic, (A) semi-arid, and (S) subtropical. The number of cities affected by each type of climate is shown in Figure 2. The largest number of cities was in the continental zone, followed by the Mediterranean zone. These two areas were the most numerous, reaching 75% of the cities. The cities located in the other areas were only 25%.
5. Results and Discussion
5.1. Sample of Study
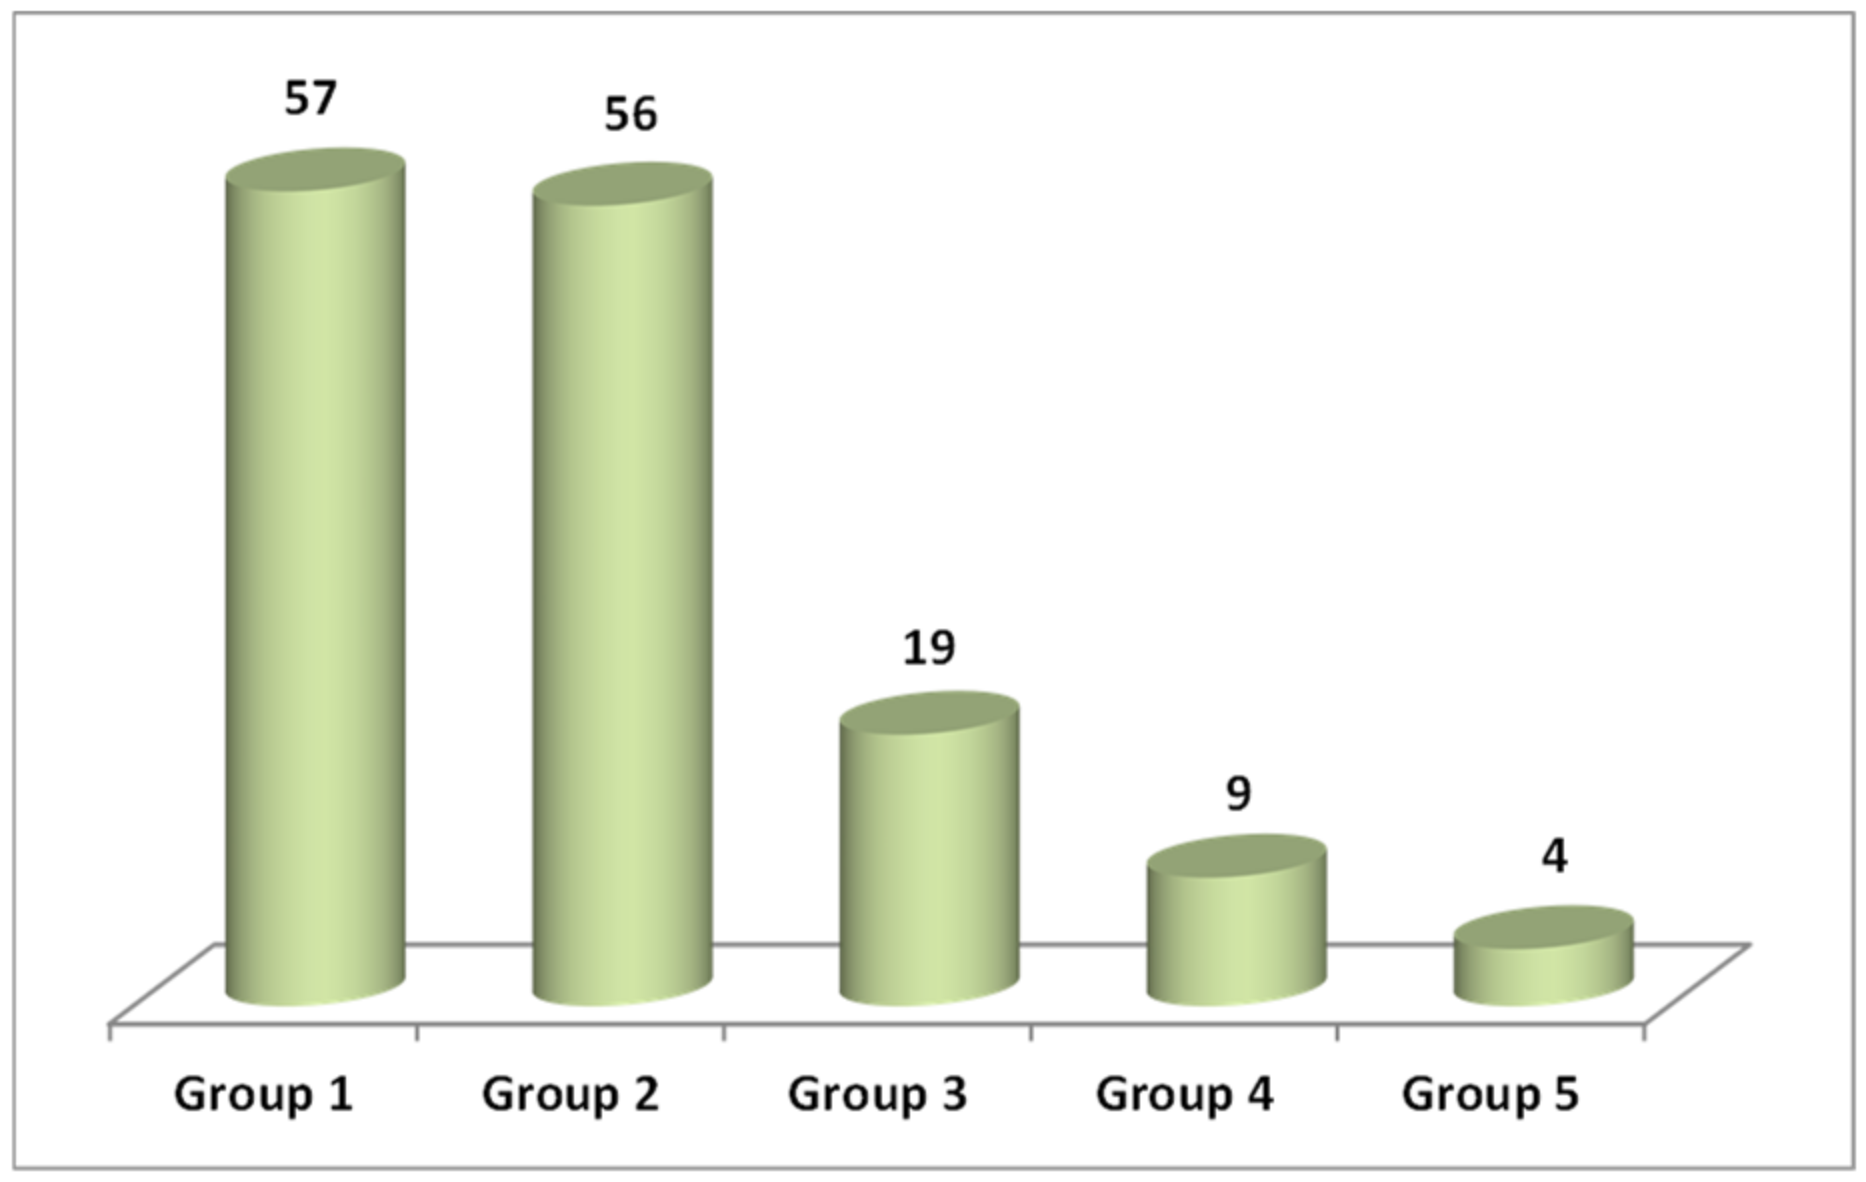
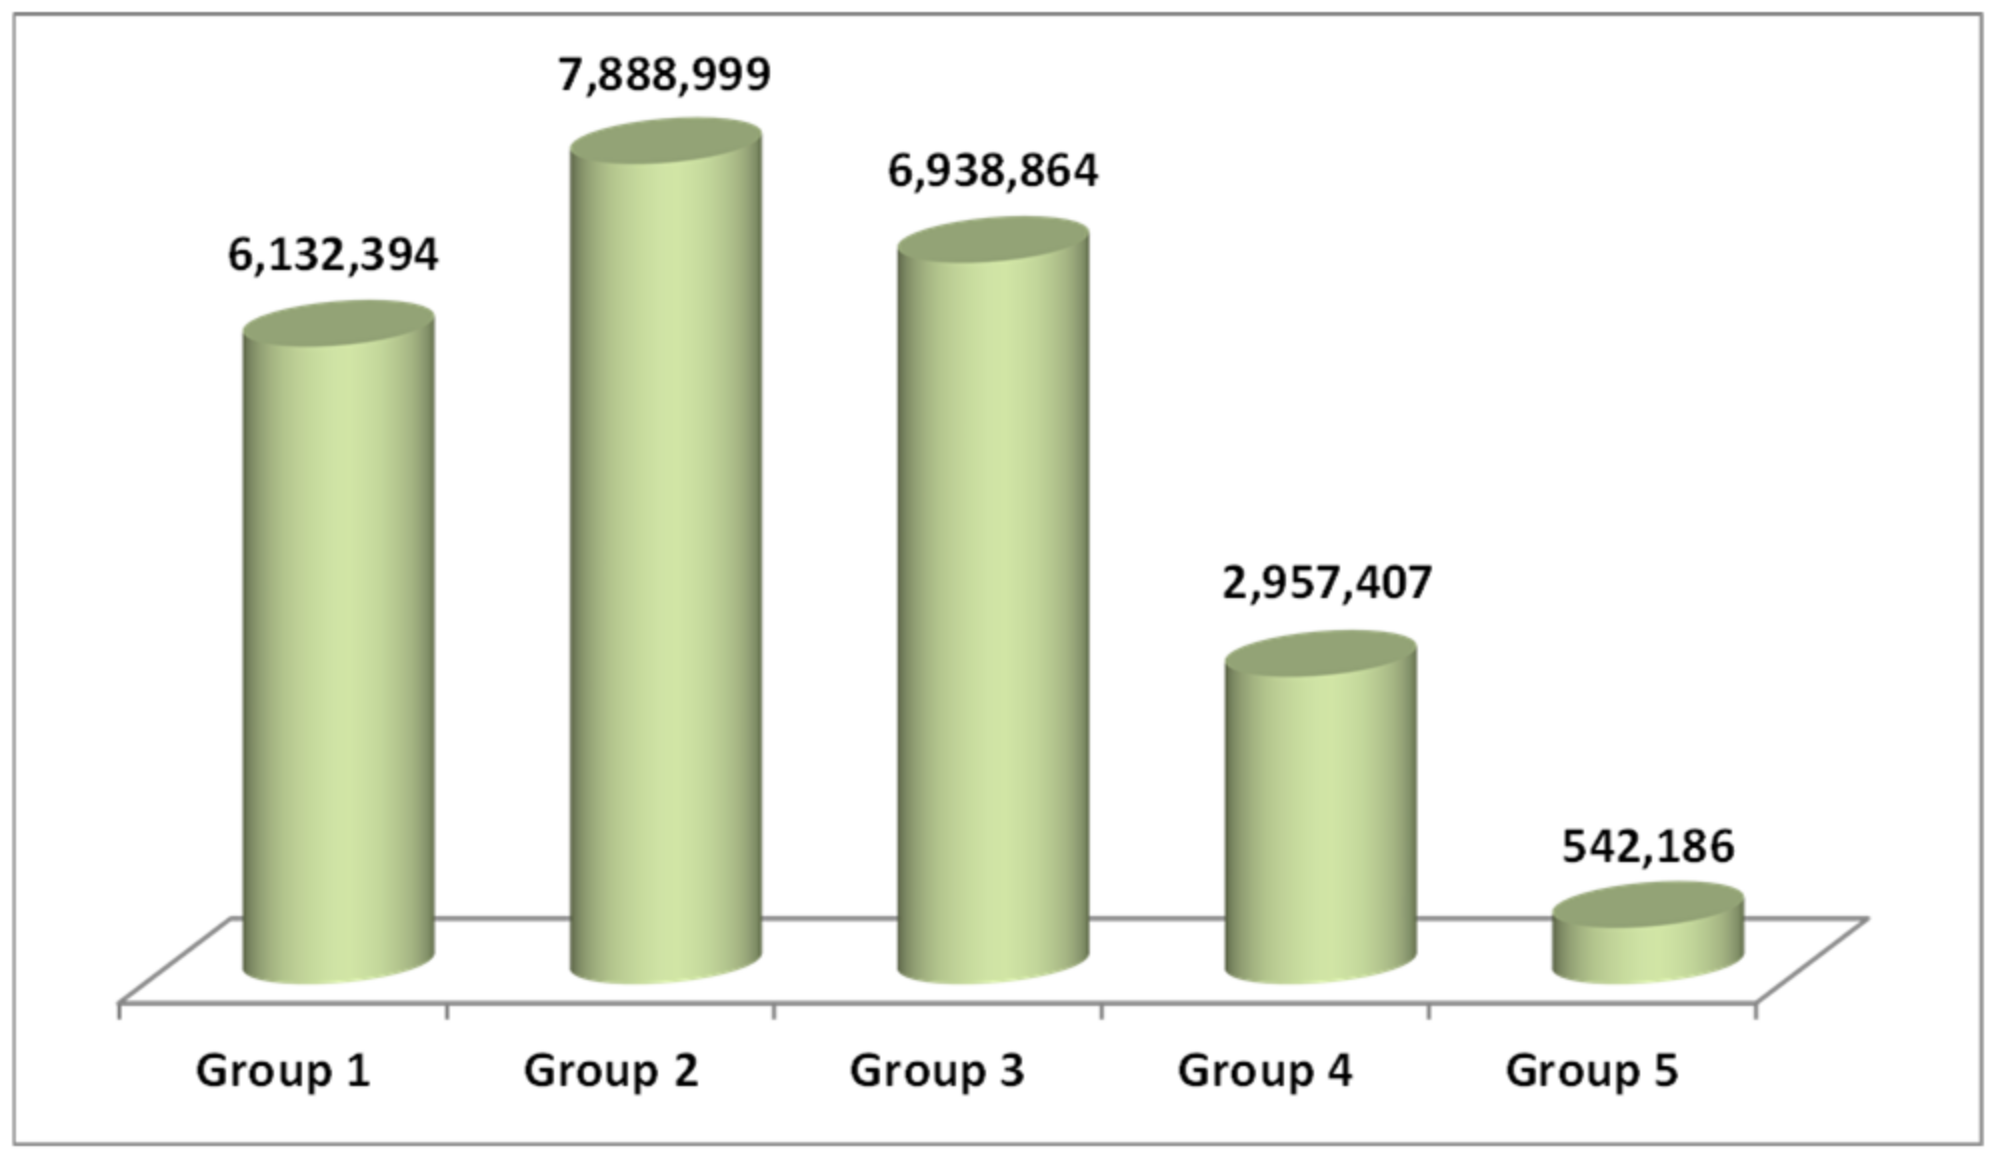
The cities were grouped into five groups according to the criteria established in Table 1. The distribution of cities in each group is shown in Figure 3. A total of 40% of the cities have a density lower than 200 inhabitants/hectare, and those with more than 400 inhabitants/hectare were only 4. Furthermore, almost 60% of the population lives in cities with a density lower than 200 inhabitants/hectare, and only 2% in the densest cities (Figure 4).
5.2. Energy Consumptions per Household
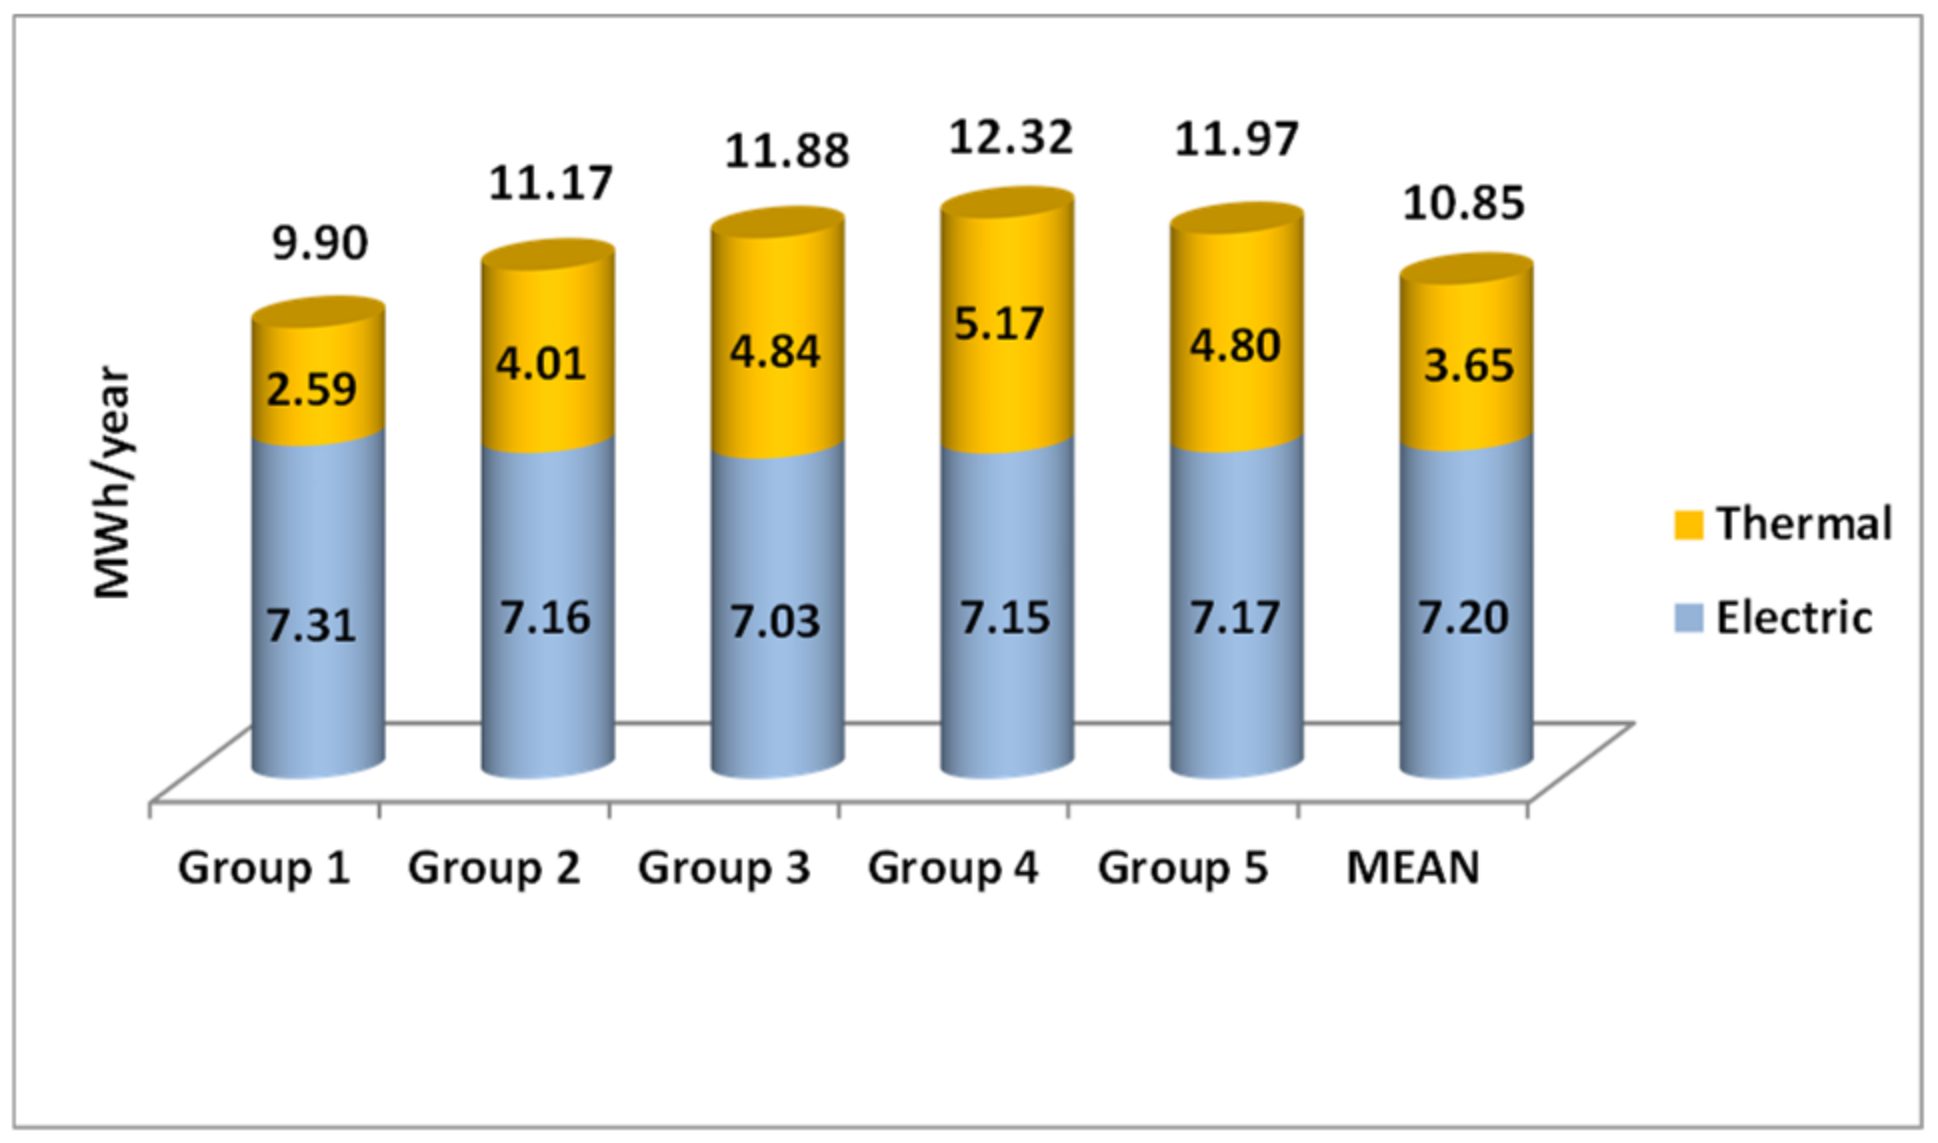
The mean values of thermal, electrical, and total energy consumption per household of each group are shown in Figure 5. The conclusions obtained were: the higher the population density in the cities, the higher the consumption, although a slight decrease in the four cities density was observed. Thermal consumption presents a behavior similar to the total; however, electricity consumption was approximately constant in all groups.
5.3. Energy Consumptions per Inhabitant
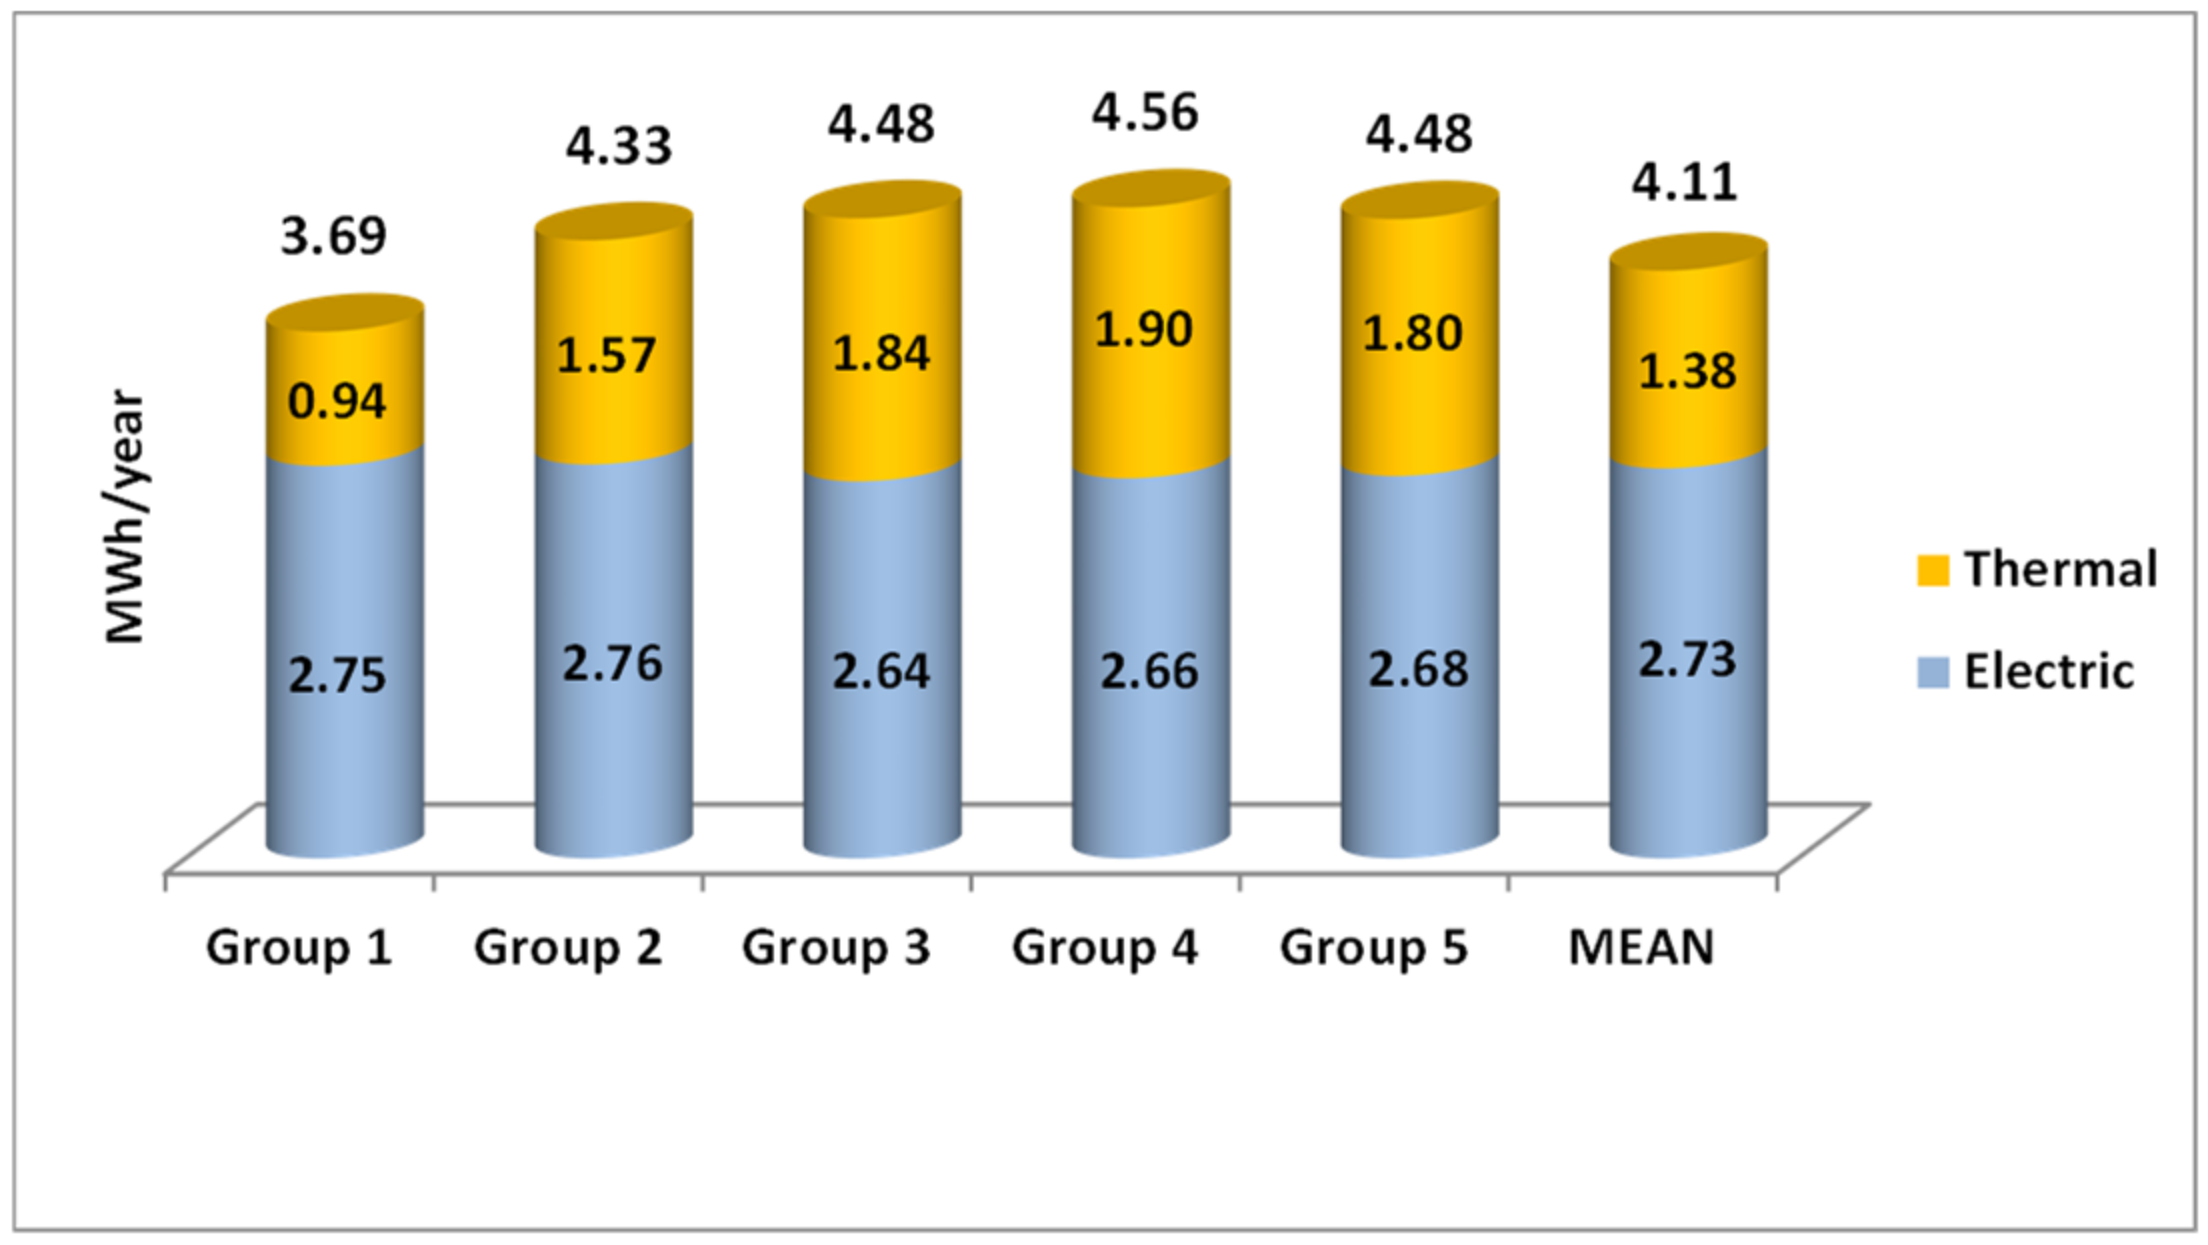
Figure 6 shows the mean values of the total, thermal, and electrical energy consumption per inhabitant in each of the groups. The conclusions were similar to those obtained for energy consumption per household: the higher the population density, the higher the consumption, although a slight decrease in the consumption of the four densest cities was found again; the same thing happens in thermal consumption and electricity consumption remained constant in all groups.
5.4. Energy Consumptions per Household without the Influence of Climate
A variable that has relevant importance on energy consumption is the climate. This variable can mask the result obtained when analyzing others. In the specific case of energy consumption in cities, to eliminate the influence of the climate, the geographical location of each of the cities must be known. Thus, in the case of Spain, the map of their geographical location must be superimposed with the climate map. Continental, Mediterranean, oceanic, semi-arid, and subtropical are the climates found in Spain, and thus, the climate of each city is identified. The number of cities affected by each type of climate is shown in Figure 2. It must be taken into account that, from now on, the studies will be carried out eliminating the influence of the climate unless expressly indicated otherwise.
The energy consumption of Spanish cities with more than 50,000 inhabitants depending on the climate was studied, and the energy consumption in each of them was identified [67]. Thus, the consumption of thermal, electrical, and total energy per household for each climate zone and the total mean consumption are shown in Figure 7. Using these data, the influence of the climate on energy consumption was eliminated. In this way, the influence of density on consumption can be analyzed more clearly.
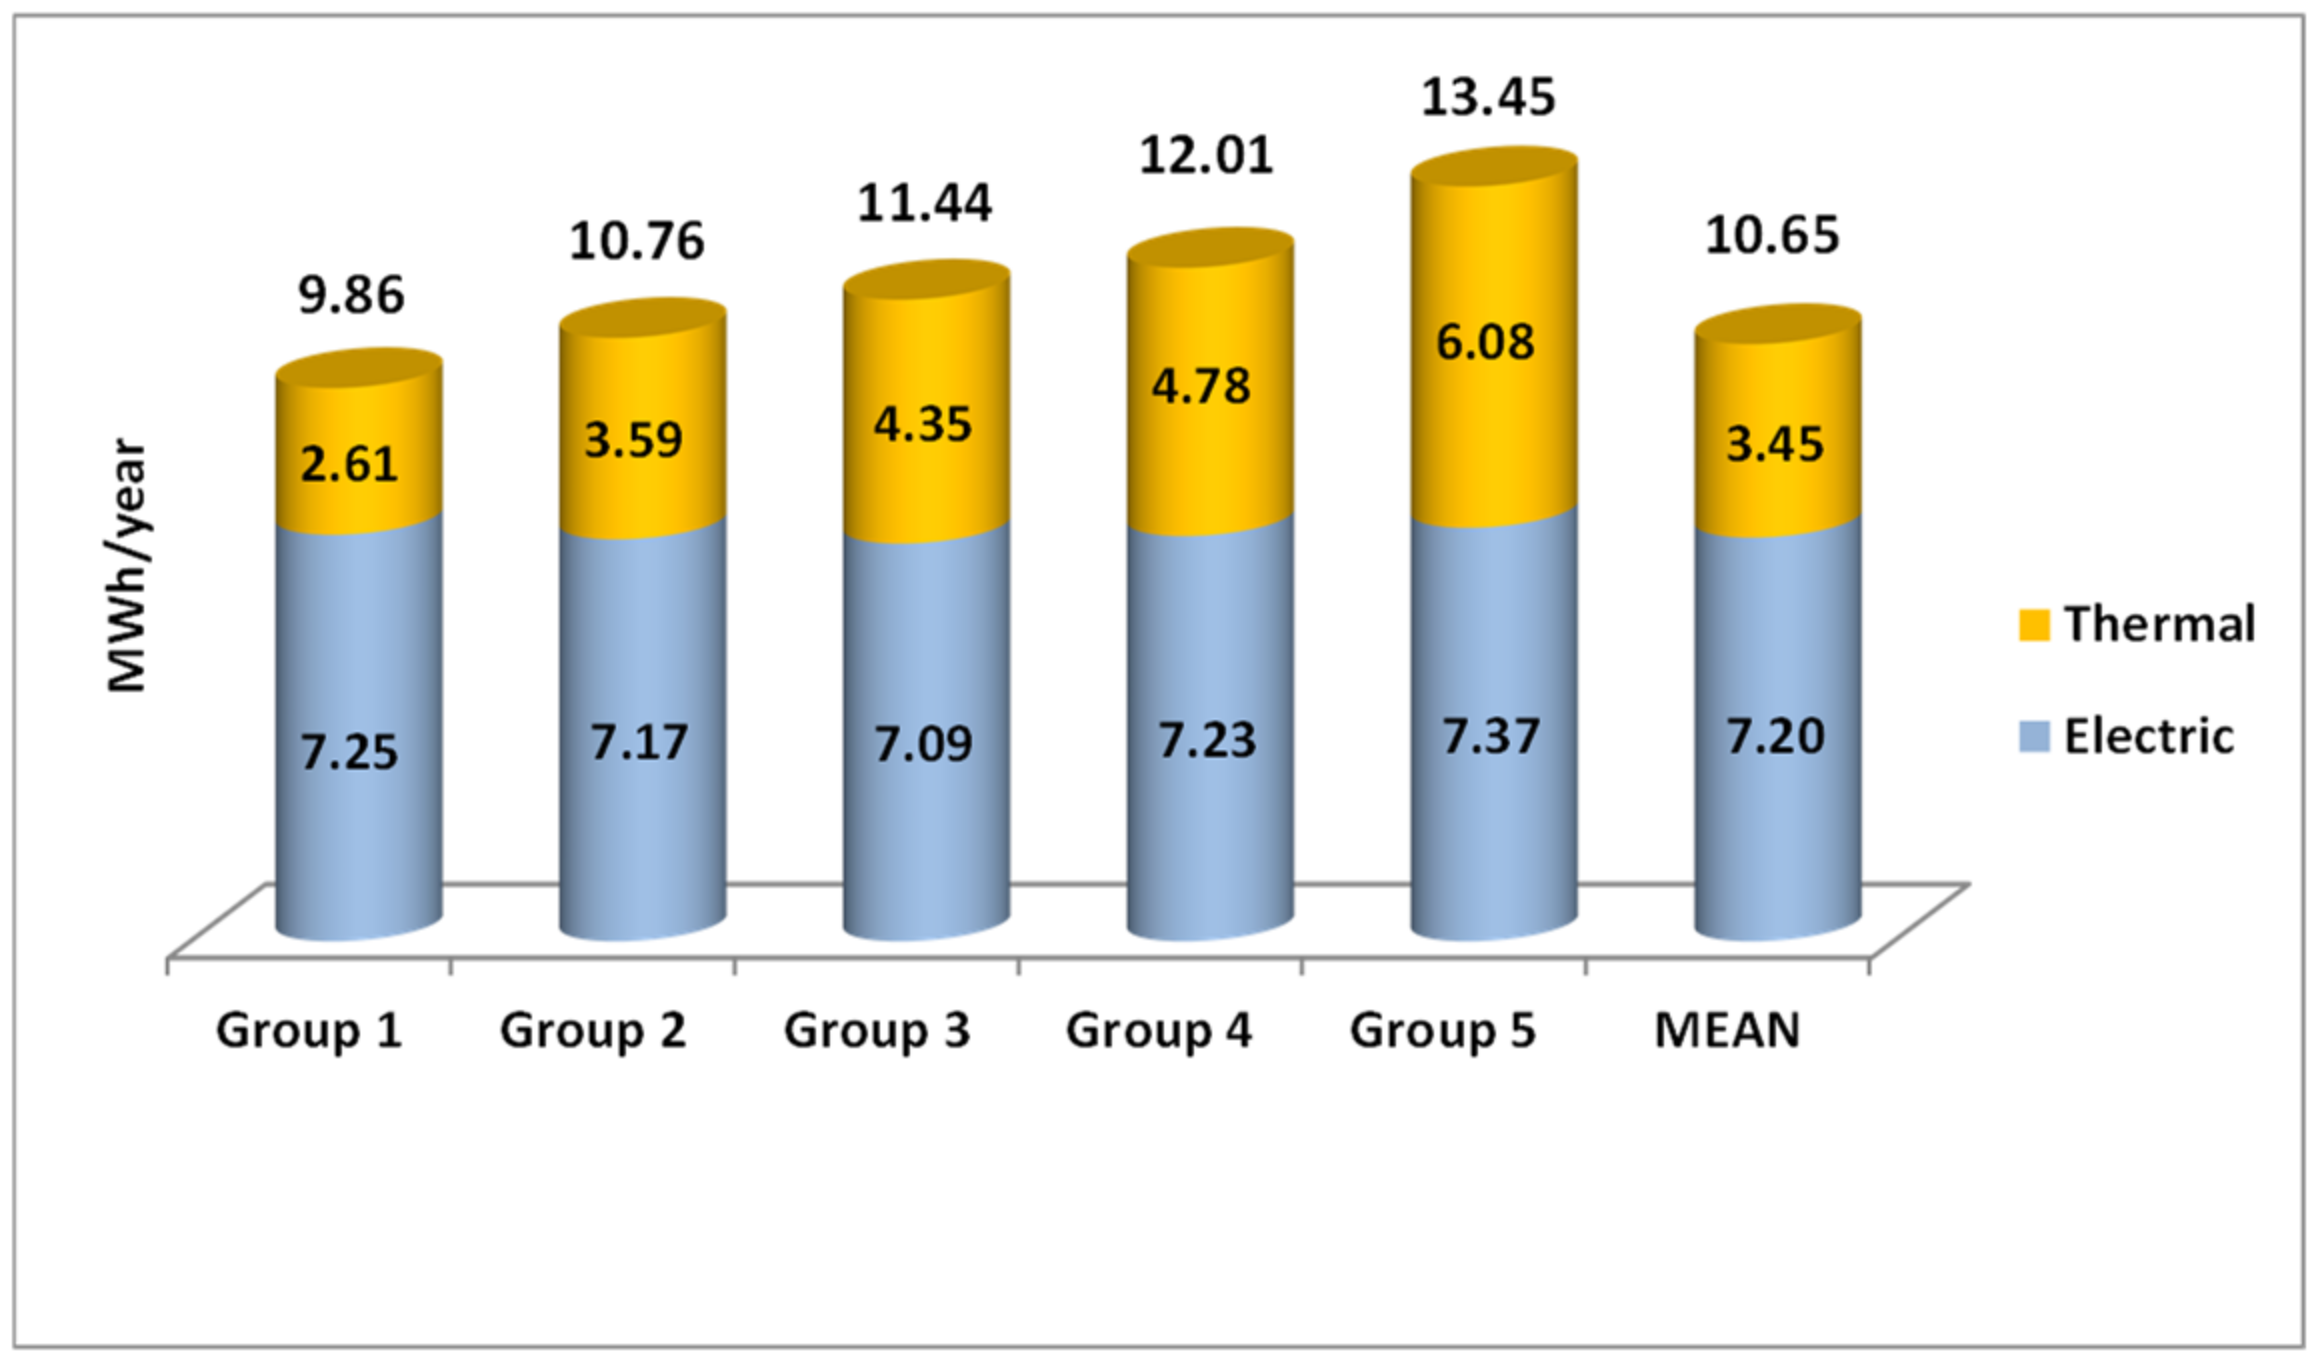
The main statistical data are presented in Table 3. The five groups defined in Section 4.1 were maintained. Figure 8 shows the mean consumption values for each group, as well as the average values for a group containing all cities. The total consumption of each group of cities increased as their density increased. Only the cities of Group 1 had a consumption lower than the average value, this being almost 10% lower. Those with the highest consumption, Group 5, exceeded mean consumption by almost 25%. In addition, while between Groups 2 to 4 there was an approximately homogeneous increase, between Groups 1 and 2 and between Groups 4 and 5, the growth was high.
Thermal consumption follows a similar behavior: it increases as density increases. However, the differences were more pronounced. Thus, the cities of Group 1 have a consumption lower by 25% than the mean consumption, while the cities with the highest consumption have it 75% above; and the difference that occurs between the two extreme groups was greater than 200%.
Regarding electricity consumption, the behavior is completely different. In this case, electricity consumption was almost constant, varying only 1% between extreme values. However, the greatest difference occurred between the cities of Group 5 and the rest since the difference was minimal among the rest of the groups.
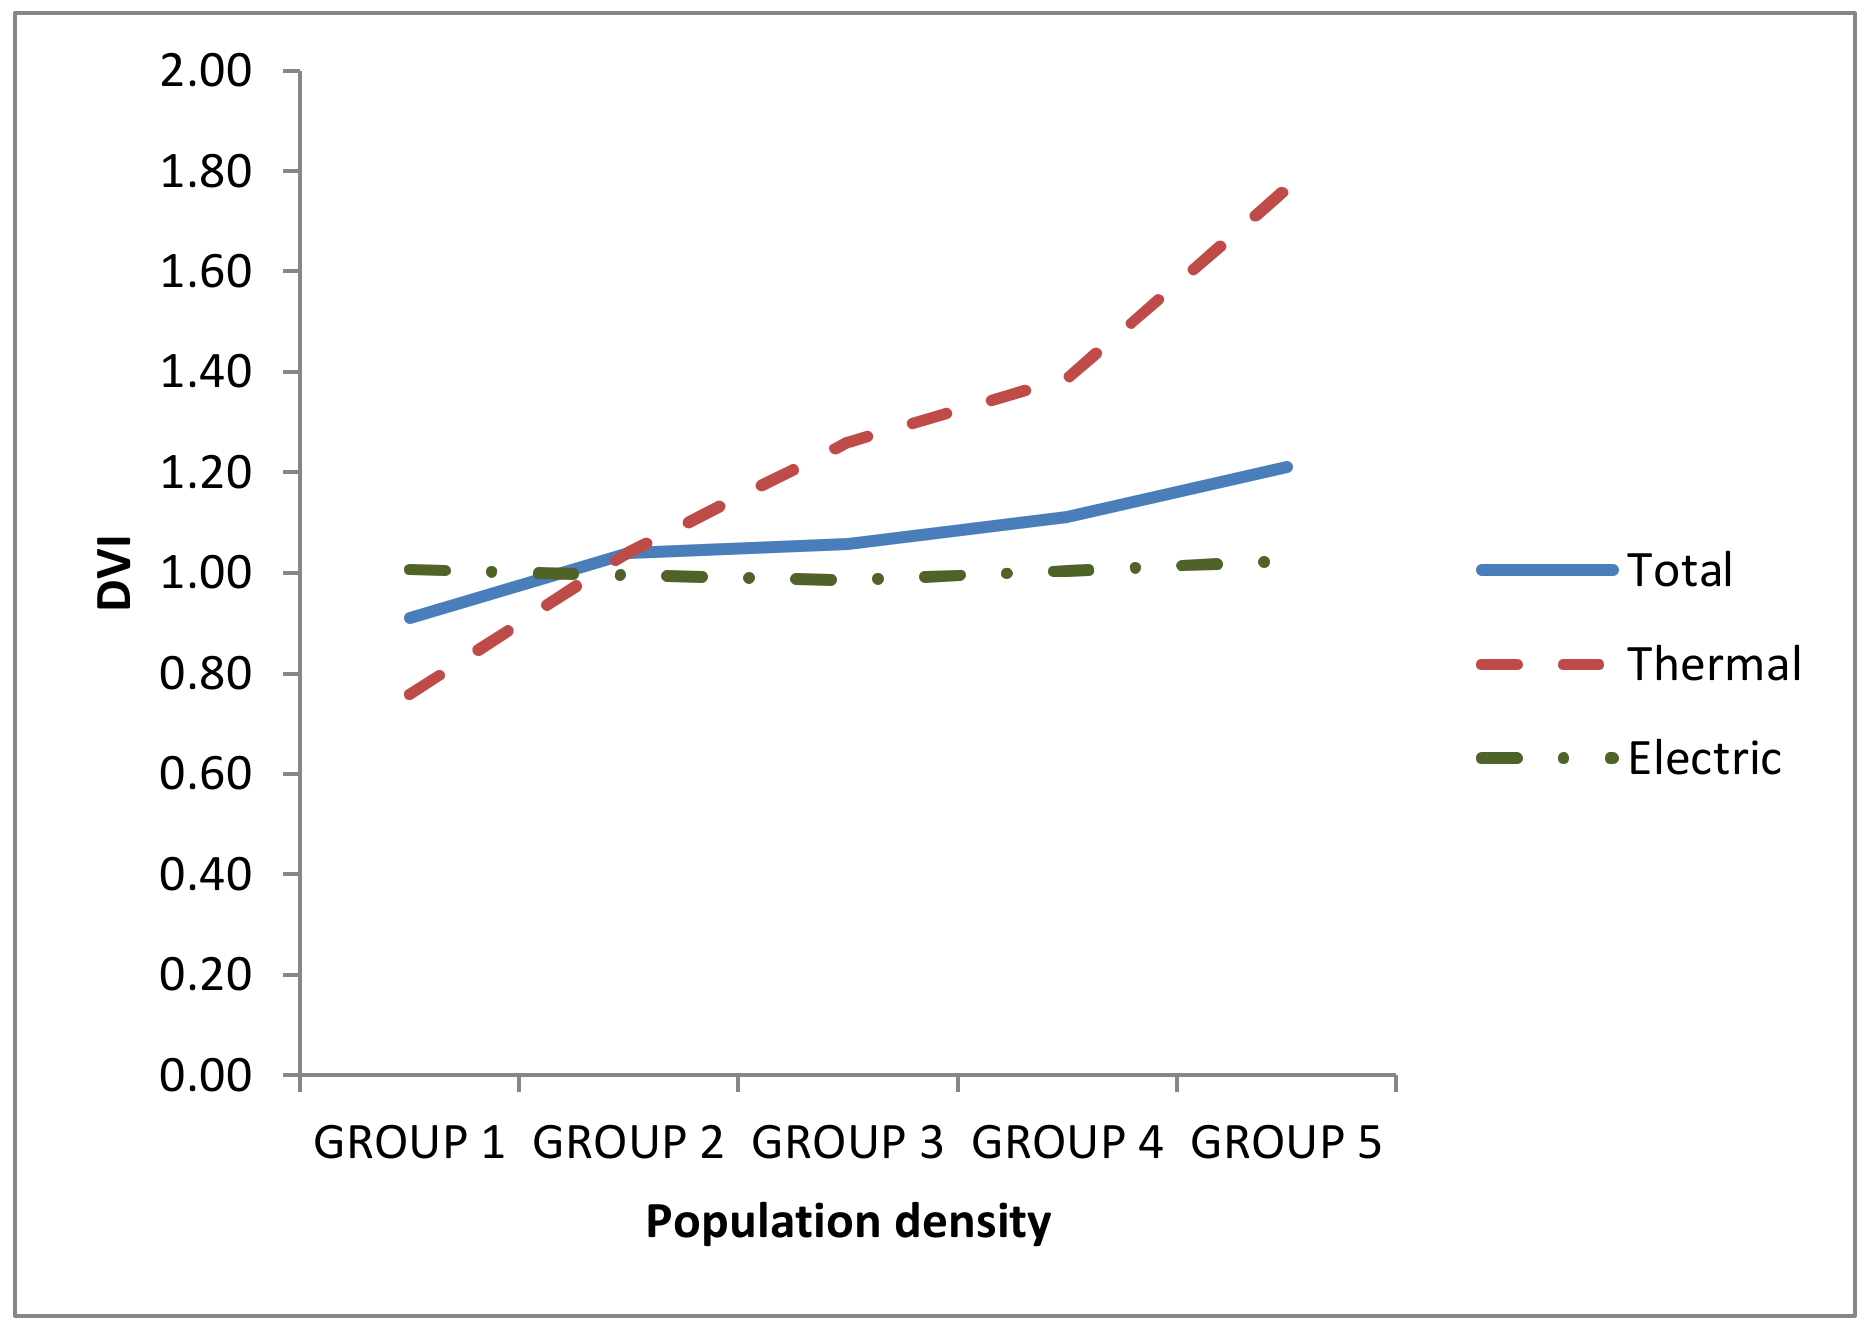
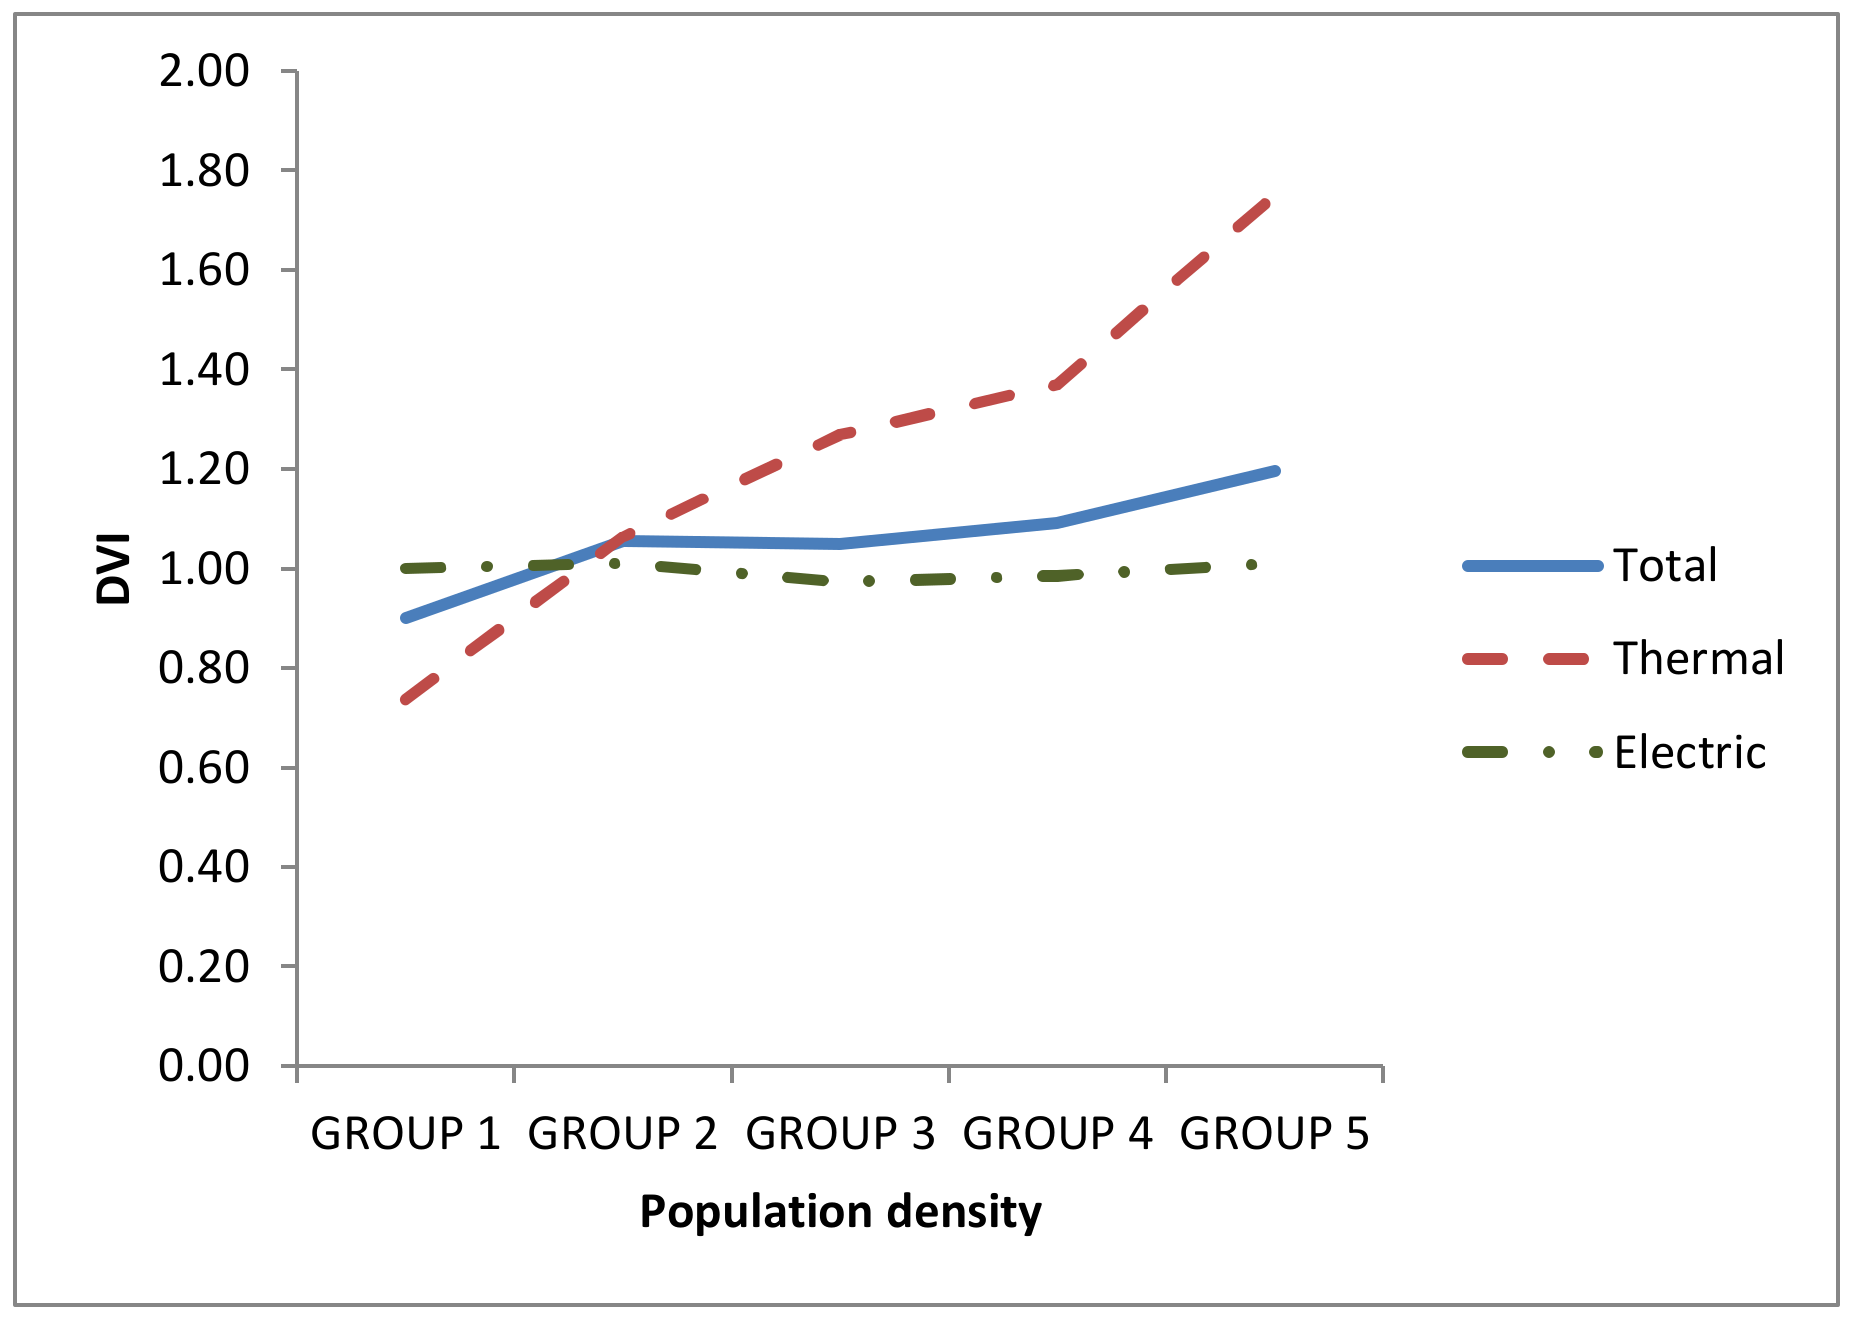
To analyze the difference more clearly in energy consumption between the groups, the index defined in Equation (7) was used. Figure 9 shows these variations. The total consumption of Groups 2, 3, and 4 were similar, while in Groups 1 and 5, a greater difference was detected. Thermal consumption follows a clearly ascending line as density increases in cities. Thus, while Group 1 had a consumption lower than 20% of the average value, Group 5 almost reached a consumption that was 80% higher. Furthermore, electricity consumption was scarcely influenced by density in cities.
In summary, the higher the density in cities, the greater their total energy and thermal consumption, and the latter being very elastic. However, the electricity consumption is almost constant and, therefore, inelastic.
5.5. Energy Consumptions per Inhabitant without the Influence of Climate
The information on energy consumption according to the climate was used again. Figure 10 shows the total, electricity, and thermal consumption per inhabitant according to the type of climate that affects the city [67]. With this information, the influence of climate can be eliminated and study how density affects energy consumption without that influence.
The main statistical data of energy consumption without the influence of the climate are shown in Table 4. Figure 11 shows the mean consumption of each group, as well as that of all cities. Total energy consumption increased as density increased. Group 1 was the only one with consumption below the mean. The greatest differences between groups were found between Groups 1 and 2 and between Groups 4 and 5. In thermal consumption, the behavior was similar, although much more pronounced. The higher the density, the higher the consumption. It turns out that only Group 1 was the one with a value lower than the mean. Furthermore, the difference between Groups 1 and 2 reached 45%, and the difference between extreme groups was greater than 100%. Regarding electricity consumption, consumption was approximately constant, with the variation between extreme consumption being 3%.
Figure 12 shows the variation of the DVI index. Regarding total consumption, Group 1 had a consumption 8% lower than the mean value, while Group 5 had a consumption 25% above. Groups 1 and 5 show a greater increase compared to the posterior and anterior groups, respectively. However, the variations between the rest of the groups were small, but always increasing.
Thermal consumption also increased with increasing density. In this case, Group 1 had a consumption lower than 25% with respect to the mean, while Group 5 had it 75% above. Therefore, the difference between the groups with the highest and lowest consumption was quite high. In addition, the variation that occurred in the consumption slope can be clearly observed.
Finally, the electricity consumption presented almost a straight line, which gives an idea of its inelastic nature.
In conclusion, the higher the density in cities, the greater the total and thermal energy consumption, while the electricity consumption was almost constant. In addition, the thermal consumption was elastic, while the electrical one was inelastic.
5.6. CO2 Emissions
As indicated in Section 4.3, the Spanish Government established the natural gas CO2 emission factor as 0.252 tCO2/MWh and 0.291 tCO2/MWh for electricity. Therefore, knowing the energy consumption in each of its forms, CO2 emissions can be calculated. First, the emissions will be determined without eliminating any variables. They will then be calculated by eliminating the influence of the climate.
CO2 emissions per household are shown in Figure 13. The results obtained were in line with those obtained in [57] for energy consumption. Total emissions increased as density increased. However, there was a small decrease in the four cities that make up the group with the highest density. Only the least dense cities had lower-than-mean emissions, and they were 8% lower. The cities with the highest emissions were 12% higher than the mean. Furthermore, the greatest increase in emissions between groups occurred between Groups 1 and 2.
Regarding emissions of thermal origin, the behavior was similar to that shown with total emissions, although more accentuated. Thus, the emissions of Group 1 were 30% lower than the mean values, and those of Group 4 were 40% higher. In this case, the difference between the extreme emission values reached 100%. The most pronounced variation between groups occurred again between Groups 1 and 2.
In the case of emissions of electrical origin, they remained approximately constant. The variation between extreme values was less than 4%. In this case, although the variations between groups were minimal, the groups that present the highest emissions are those that previously presented the lowest and vice versa.
Regarding the number of emissions, those of electrical origin were greater than the thermal ones.
Figure 14 shows the emissions per inhabitant, type of origin, and group. The behavior they presented was similar to that obtained for households. Emissions grow as the density of cities does, except in the four densest cities, where there was a slight decrease. In the case of total and thermal emissions, the greatest difference occurred again between Groups 1 and 2. The difference between the extreme values exceeded 20% in the case of total emissions and 100% in the case of thermal emissions. Regarding electrical emissions, the value was almost constant in all groups, and, in all cases, they were higher than thermal ones.
5.7. CO2 Emissions without the Influence of Climate
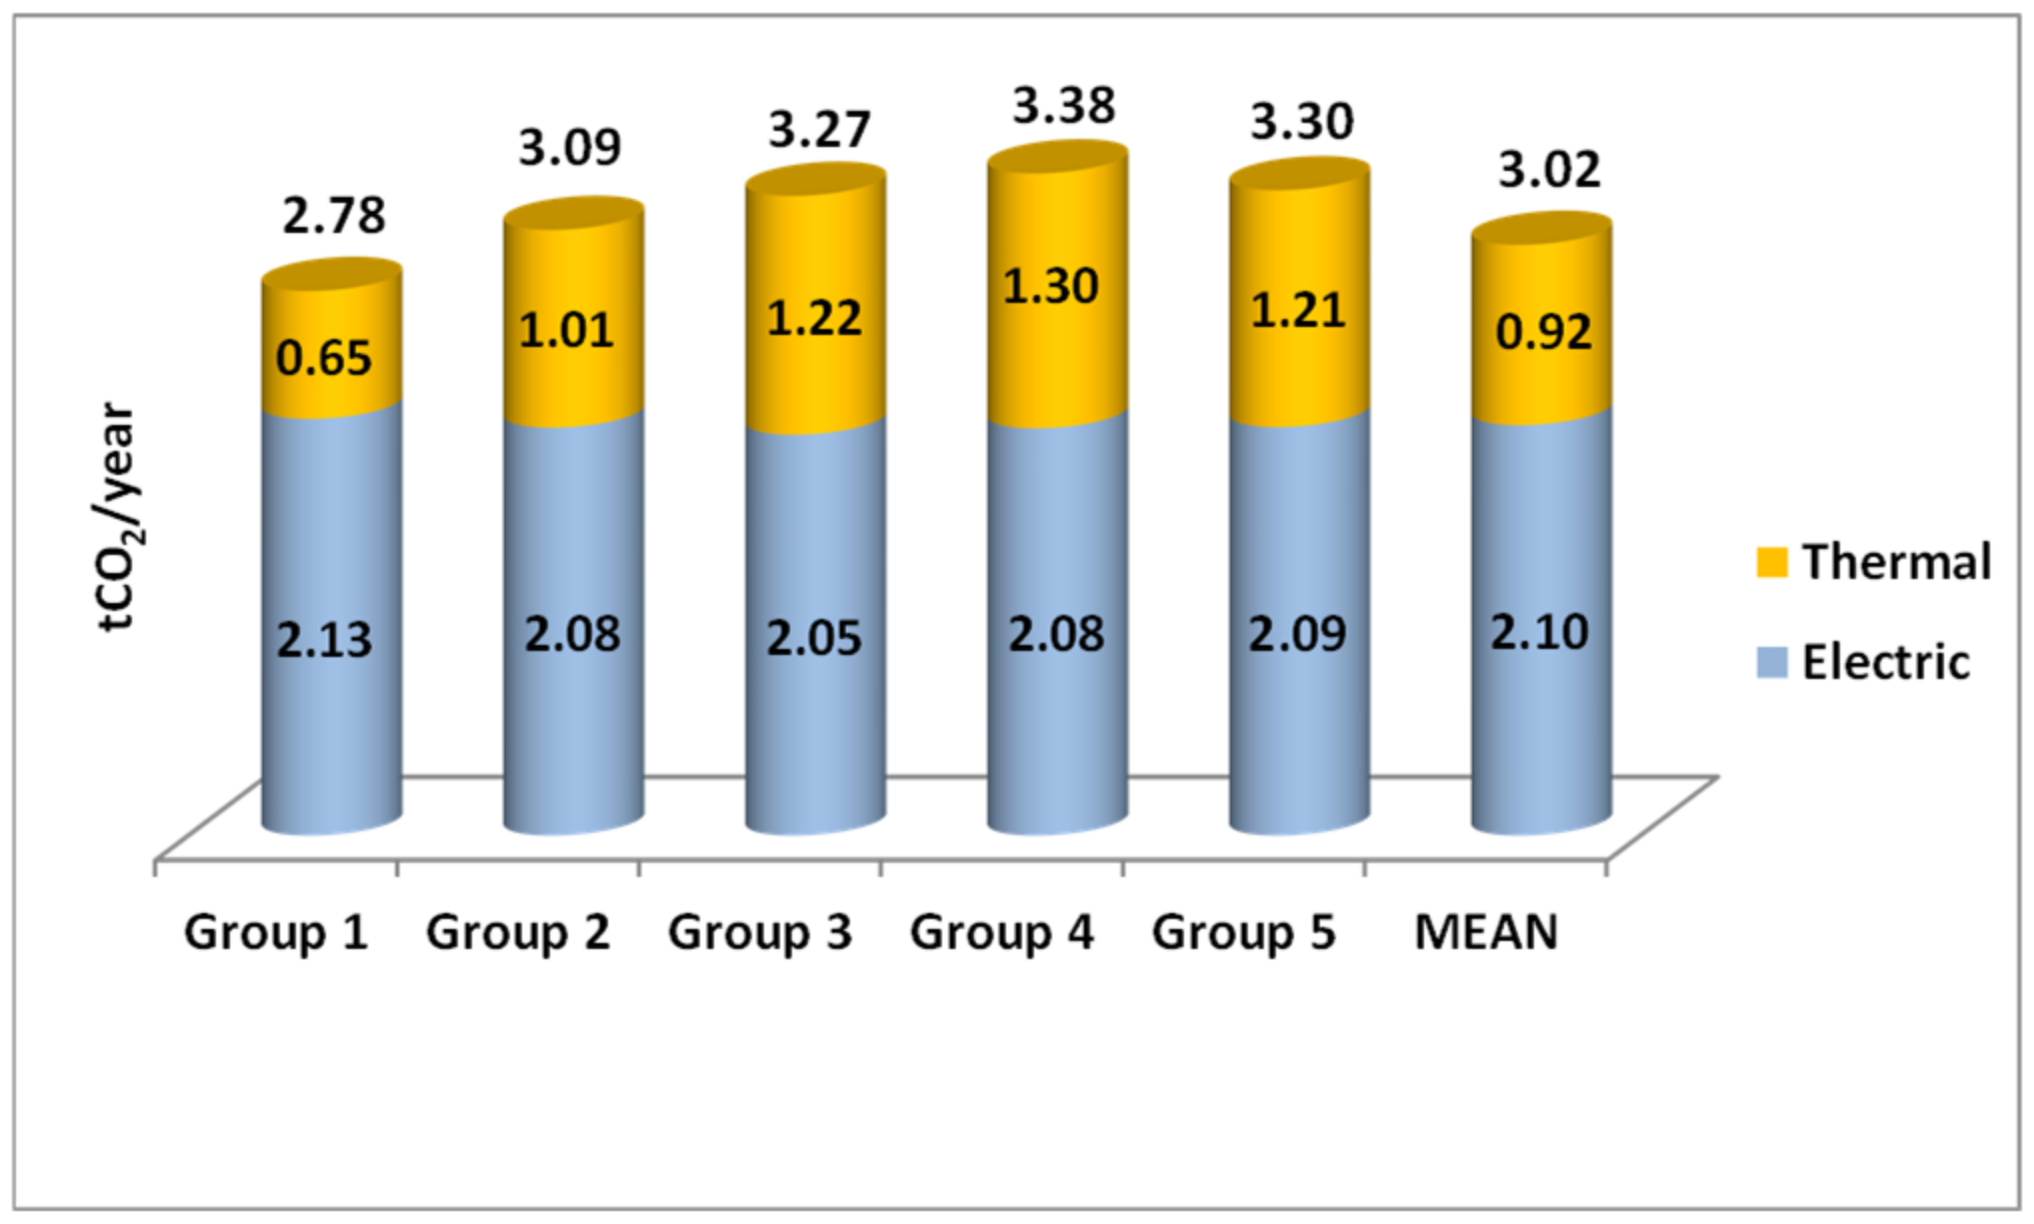
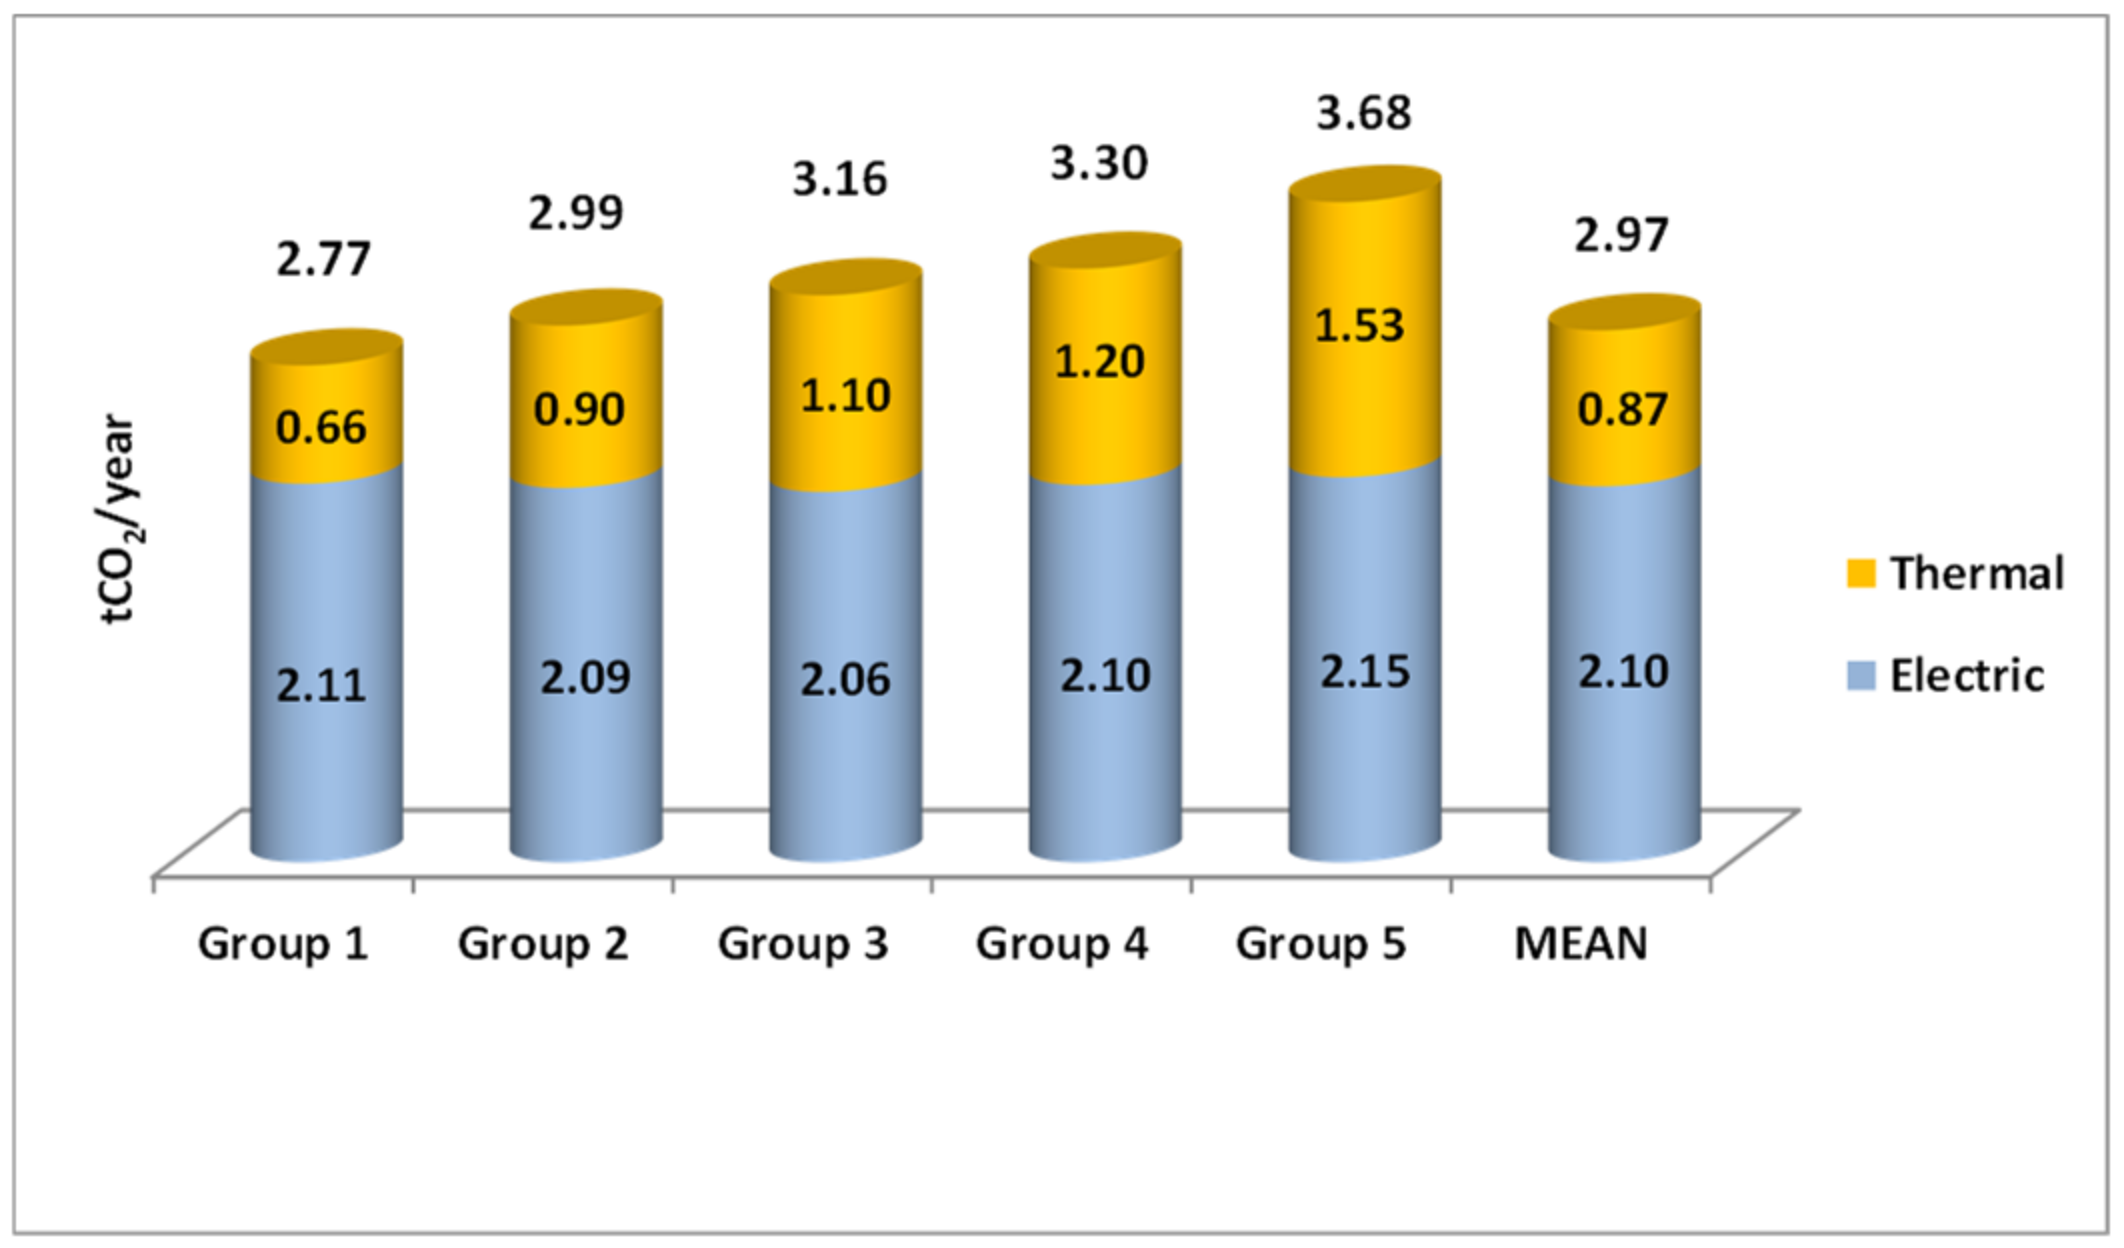
Thermal, electric, and total CO2 emissions per household without the influence of climate are shown in Figure 15. Unlike what happened when the influence of climate had not been eliminated, in all cases, it was true that the higher the density, the higher the emissions. The only group with emissions below the mean was Group 1. The others were above, reaching over 25% in the case of the group with the highest density. The greatest increase now occurred between Groups 4 and 5. Thermal emissions had similar behavior, although more pronounced. In this case, Group 1 had emissions 25% lower than the average, while Group 5 had them 76% above. Emissions of electrical origin remained approximately constant, with a variation of 2% between the extreme values.
Regarding the number of emissions depending on the type, those of electrical origin was higher than the thermal ones. However, if the percentage of emissions of each type was analyzed in each group, as the density increased, the proportion of emissions of electrical origin decreased. Thus, while in Group 1, they represented slightly more than 73% of the total, in Group 5, they did not reach 55%.
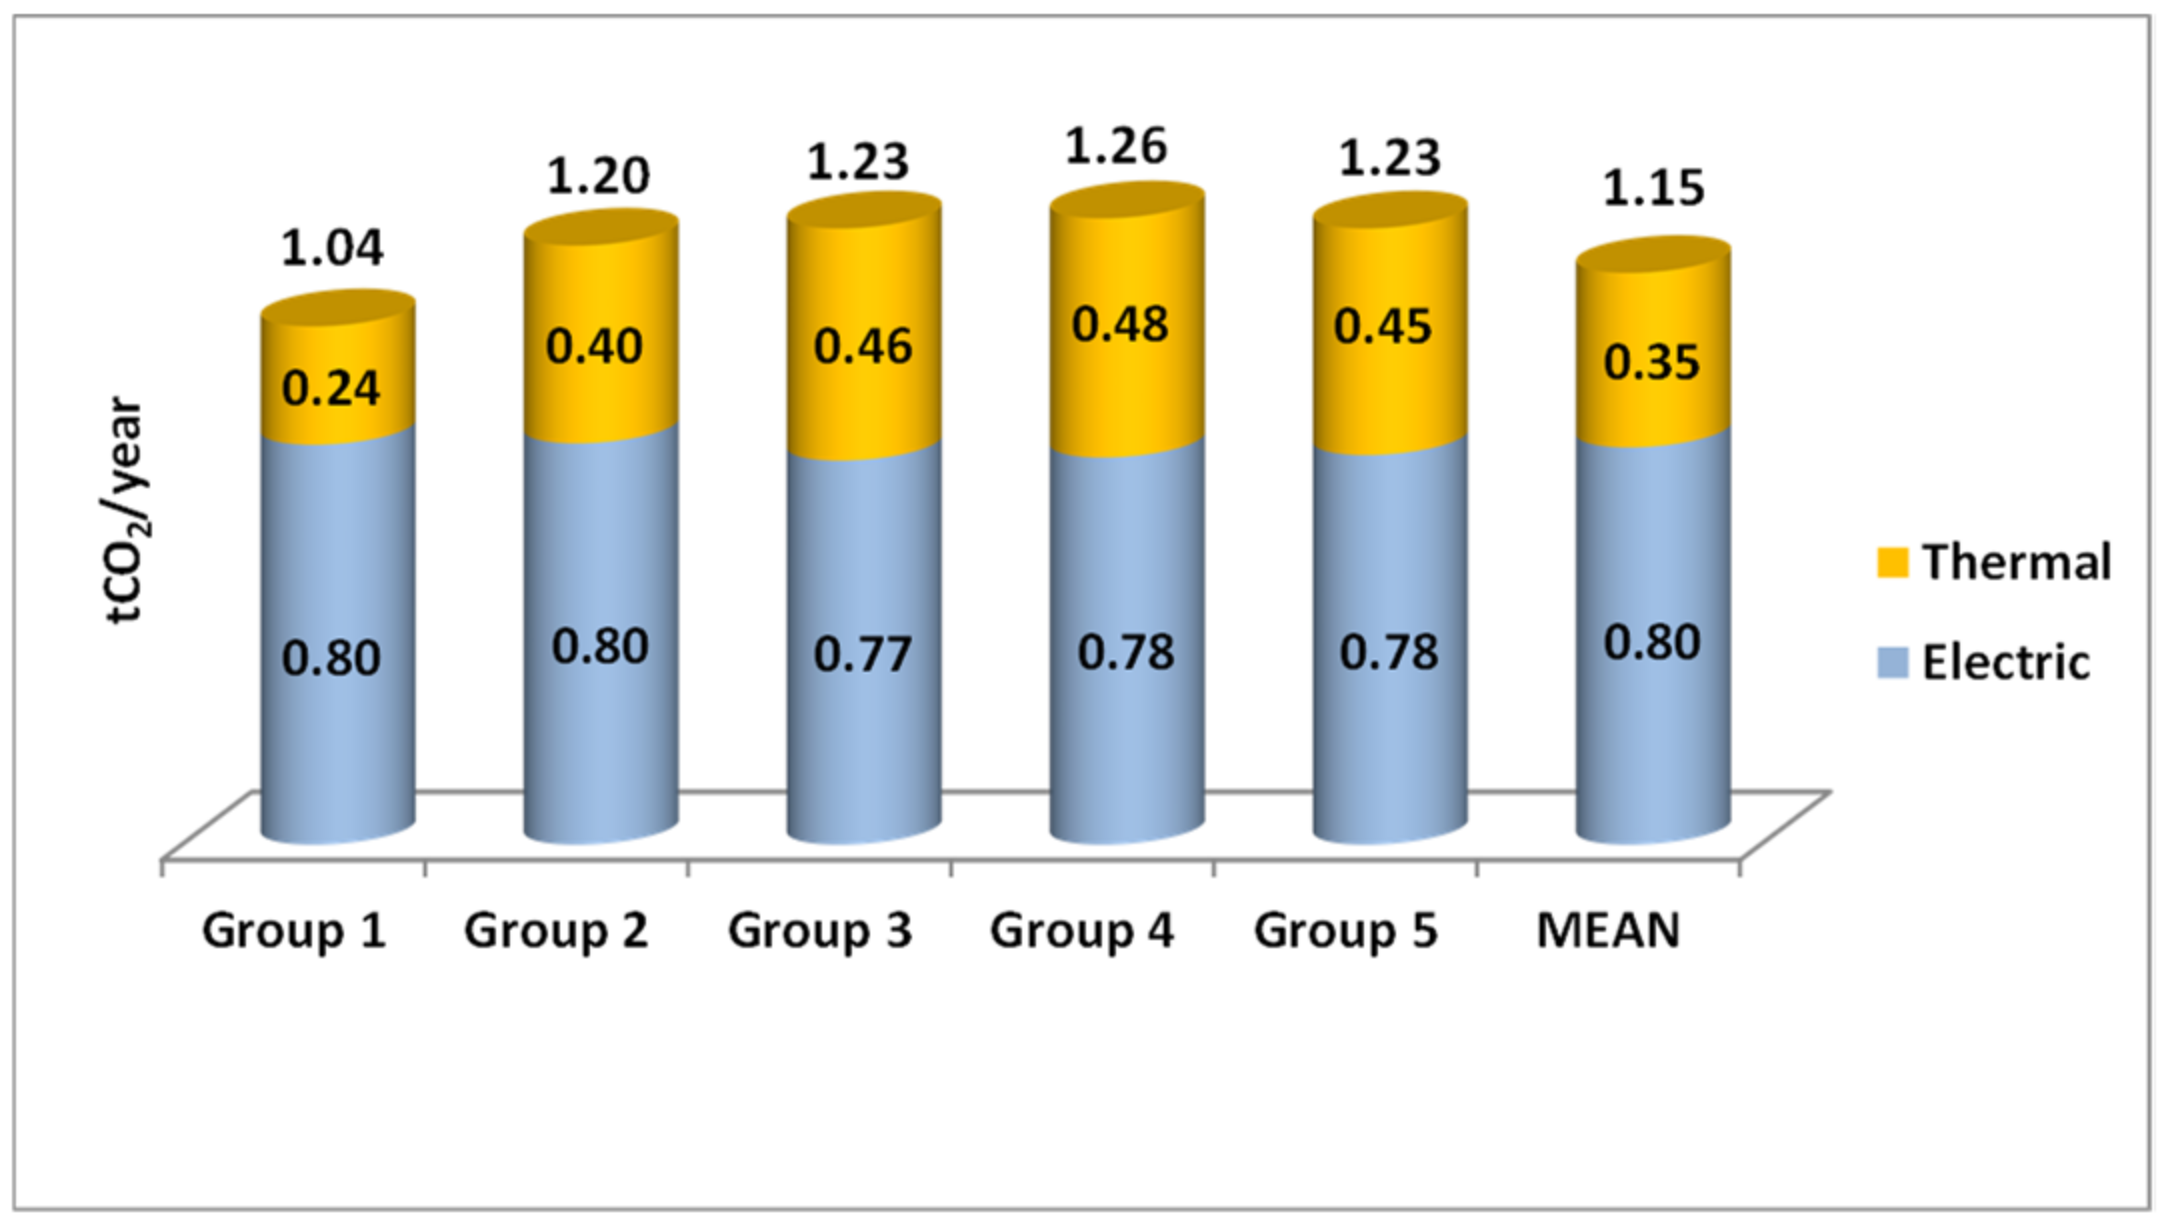
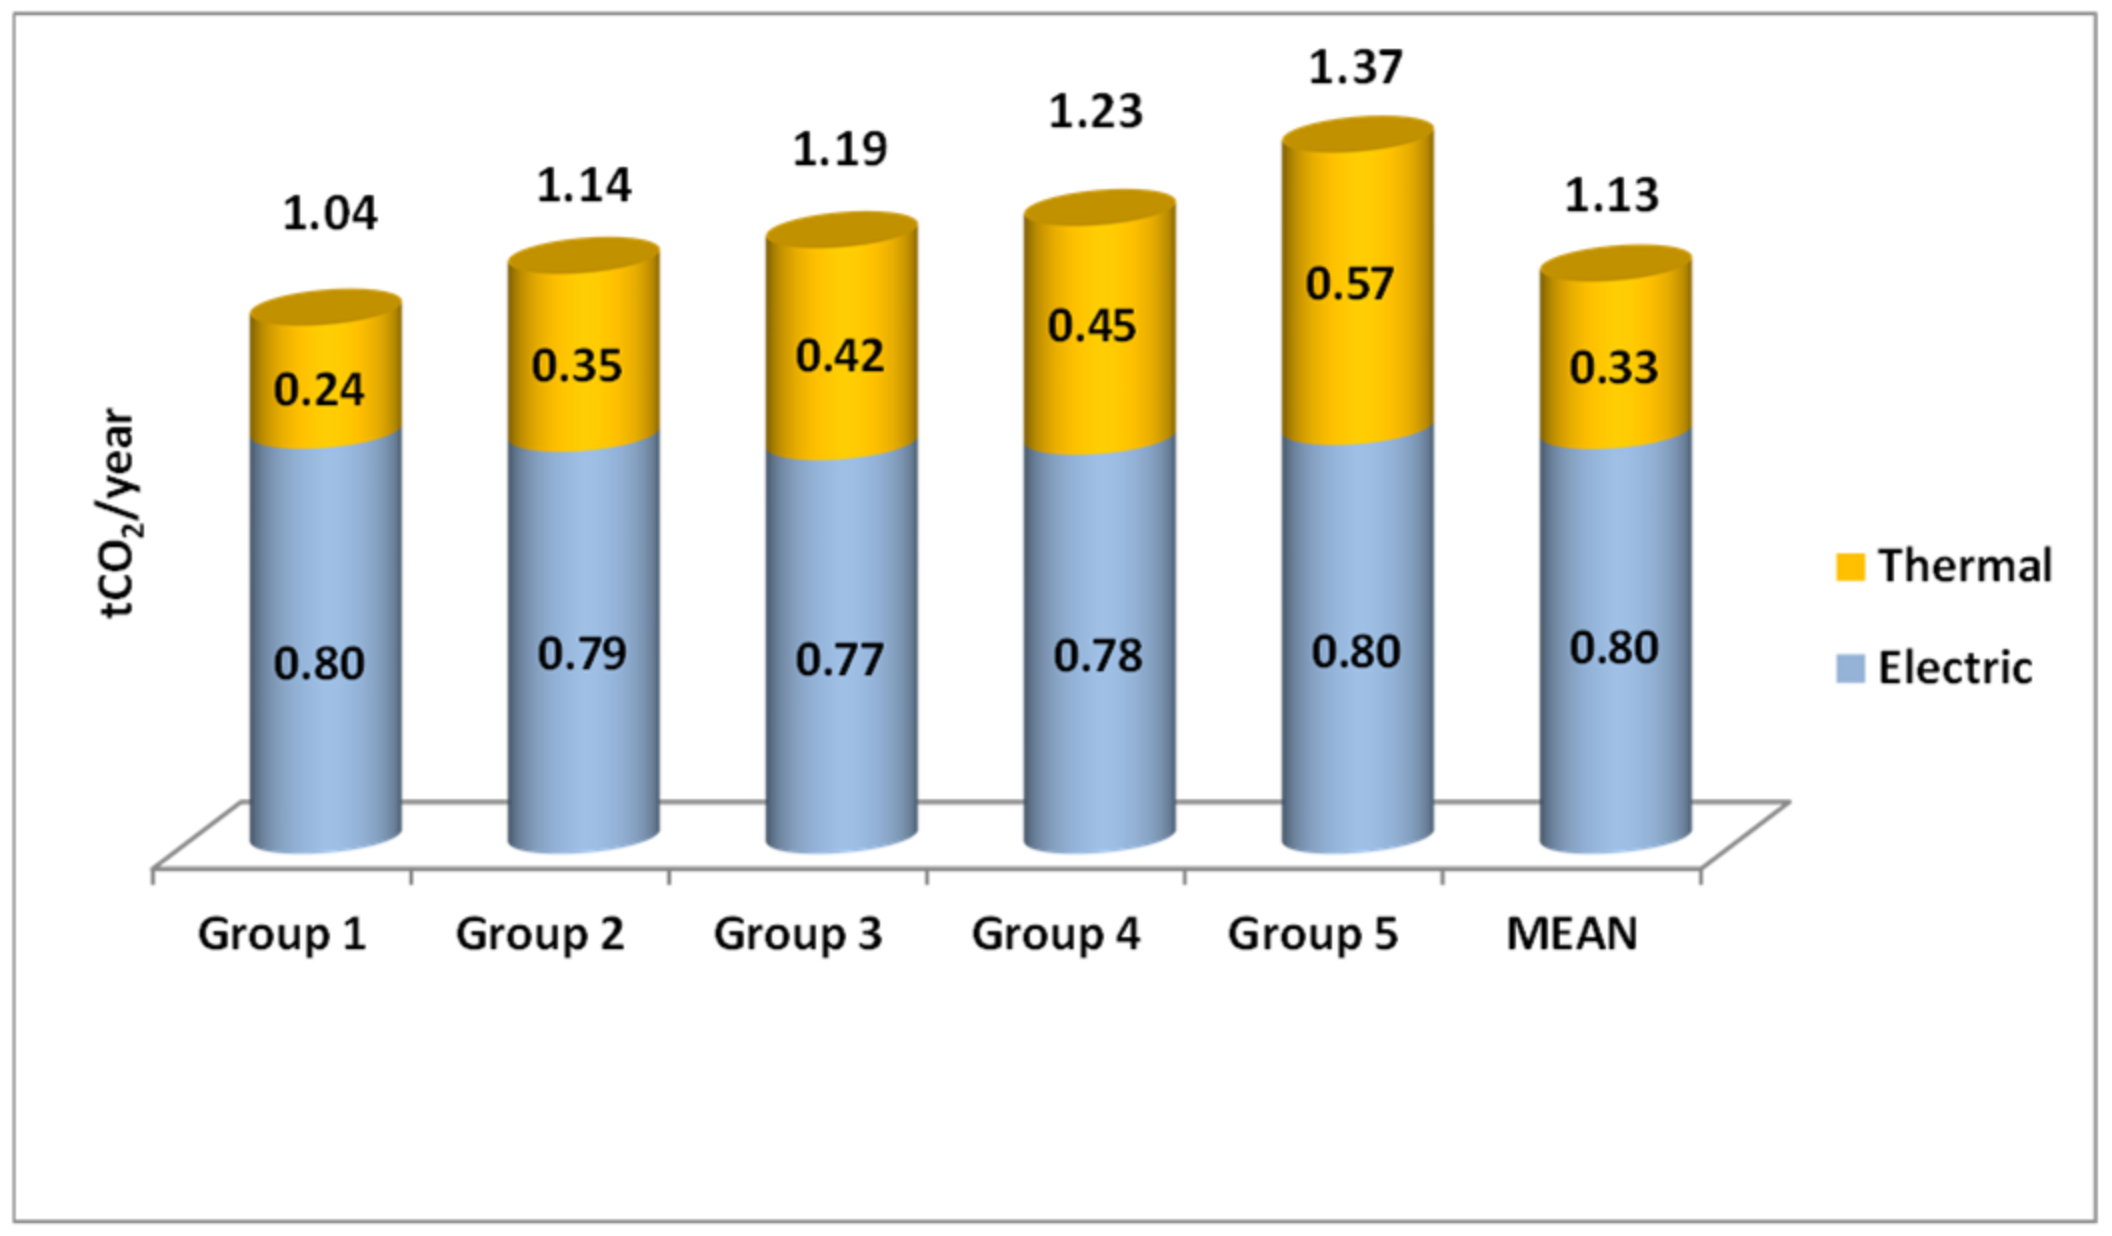
Figure 16 shows emissions per capita without the influence of climate. In this case, the conclusions that can be reached were similar to those obtained in the case study of emissions per household: the higher the density, the higher the total and thermal emissions; only Group 1 had values below the mean, which in the case of total emissions were somewhat higher than 8%, while in the case of thermal emissions they almost reached 27%; Group 5, which was the one with the highest emissions, exceeded the average total emissions by 25%, while it did so by 75% the thermal emissions.
Regarding the proportion of the type of emissions in each group, those of electrical origin was higher than the thermal ones. Furthermore, as population density increased, the percentage of electricity emissions decreased. Thus, from 74% of Group 1, it goes to 55% of Group 5.
As a summary, both per household and per inhabitant: as density increased in cities, total emissions, and those of thermal origin increased, while those of electrical origin remained almost constant; emissions of electrical origin were greater than those of thermal origin; and as the density increased, the proportion of electrical emissions with respect to the total in each group decreased.
6. Conclusions
More than half of the world’s population lives in cities, 80% of energy is consumed in them, and their buildings consume 36% of energy and generate 40% of emissions. This background has sparked the interest of both governments and utilities to promote urban sustainability and improve air quality and health in cities.
This paper is intended to help policymakers and utilities in making decisions to allow planning the construction of energy production facilities using renewable sources and to enact laws that favor the reduction of GHG. For this, both energy consumption and emissions in buildings were studied based on the population density of cities. The forms of energy considered were those that are usually consumed in buildings: electrical and thermal in the form of natural gas. In addition, to show more clearly how population density affects, the influence of climate was removed. The analysis was carried out per household and per inhabitant. The consumption and emissions of all the buildings were considered and distributed among the households and inhabitants of the city. This was the case because, although it is not consumption that is directly carried out by the inhabitants and that it occurs at households, it really exists in the city for the needs of its inhabitants.
For the density calculation, the area actually occupied by the city was considered. Not so the empty area that every municipality usually has. In addition, an index that facilitates analysis was introduced into the study. The proposed method can be used both in large study areas and in small ones. As a practical application, the 145 Spanish cities with more than 50,000 inhabitants were studied.
The results show similar behaviors both per household and per inhabitant. With regard to energy consumption, the following was observed: the higher the density in cities, the greater their total energy and thermal consumption; in the case of thermal consumption, the changes are very marked, exceeding 100% among extreme groups; the consumption of electrical energy is almost constant in all of them; and the energy consumption of thermal origin is very elastic, while that of electrical origin is very inelastic.
Regarding emissions, the following conclusions were obtained: the higher the population density, the greater the total emissions and those of thermal origin; those corresponding to electrical consumption are almost invariant (barely vary by 2%); emissions of electrical origin are greater than those of thermal origin; and the higher the population density, the lower the proportion of electricity emissions with respect to the total, decreasing from 74% to 55%.
Author Contributions
Conceptualization, I.M.Z.-S. and P.J.Z.-P.; methodology, I.M.Z.-S. and P.J.Z.-P.; validation, I.M.Z.-S., F.J.Z.-S., and P.J.Z.-P.; formal analysis, I.M.Z.-S., F.J.Z.-S., and P.J.Z.-P.; investigation, I.M.Z.-S. and P.J.Z.-P.; data curation, I.M.Z.-S. and F.J.Z.-S.; writing—original draft preparation, P.J.Z.-P.; writing—review and editing, I.M.Z.-S., F.J.Z.-S., and P.J.Z.-P.; visualization, I.M.Z.-S. and F.J.Z.-S.; supervision, P.J.Z.-P.; project administration, P.J.Z.-P.; funding acquisition, P.J.Z.-P. All authors have read and agreed to the published version of the manuscript.
Funding
This research received no external funding.
Institutional Review Board Statement
Not applicable.
Informed Consent Statement
Not applicable.
Data Availability Statement
Not applicable.
Acknowledgments
The authors would like to thank the eCitySevilla project for providing facilities to conduct the research. The authors would like to acknowledge the support of the Spanish State Research Agency under Grant No. PID2020-116433RB-I00 (PID2020-116433RB-I00/AEI/ 10.13039/501100011033).
Conflicts of Interest
The authors declare no conflict of interest.
References
- Department of Economic and Social Affairs. 2014 Demographic Yearbook, 64th ed.; United Nations: New York, NY, USA, 2015. [Google Scholar]
- Committed to local sustainable energy. In Reducing Energy Dependence in European Cities; Covenant of Mayors: Brussels, Belgium, 2018.
- European Parliament News. Available online: https://www.europarl.europa.eu/news/en/headlines/society/20180301STO98928/greenhouse-gas-emissions-bycountry-and-sector-infographic (accessed on 12 October 2020).
- International Energy Agency. 2018 Global Status Report: Towards A Zero-Emission, Efficient and Resilient Buildings and Construction Sector; United Nations Environment Programme: Paris, France, 2018. [Google Scholar]
- Shahrokni, H.; Levihn, F.; Brndt, N. Big meter data analysis of the energy efficiency potential in Stockholm’s building stock. Energy Build 2014, 78, 153–164. [Google Scholar] [CrossRef]
- Yan, Y.; Pan, A.; Wu, C.; Gui, S. Factors influencing indirect carbon emission of residential consumption in China: A case of Liaoning province. Sustainability 2021, 11, 4414. [Google Scholar] [CrossRef] [Green Version]
- Department of Economic and Social Affairs. Report of the Inter-Agency and Expert Group on Sustainable—Development Goals Indicators (E/CN.3/2016/2/Rev.1); United Nations: New York, NY, USA, 2016. [Google Scholar]
- European Parliament News. Available online: https://www.europarl.europa.eu/news/en/headlines/society/20200618STO81513/green-deal-key-to-a-climate-neutral-and-sustainable-eu (accessed on 25 July 2020).
- European Commission. A New Circular Economy Action Plan for A Cleaner and More Competitive Europe; COM(2020) 98 Final (2020); European Commission: Brussels, Belgium, 2020. [Google Scholar]
- Energy-Cities. Available online: https://energy-cities.eu/project/covenant-of-mayors-for-climate-energy/#:~:text=The%20Covenant%20of%20Mayors%20gathers,and%20affordable%20energy%20to%20all (accessed on 13 May 2020).
- Jiang, L.; Xing, R.; Chen, X.; Xue, B. A survey-based investigation of greenhouse gas and pollutant emissions from household energy consumption in the Qinghai-Tibet Plateau of China. Energy Build 2021, 235, 110753. [Google Scholar] [CrossRef]
- Zarco-Soto, I.M.; Zarco-Periñán, P.J.; Sánchez-Durán, R. Influence of cities population size on their energy consumption and CO2 emissions: The case of Spain. Environ. Sci. Pollut. Res. 2021, 28, 28146–28147. [Google Scholar] [CrossRef]
- Huo, T.; Ren, H.; Cai, W. Estimating urban residential building-related energy consumption and energy intensity in China based on improved building stock turnover model. Sci. Total Environ. 2019, 650, 427–437. [Google Scholar] [CrossRef] [PubMed]
- Urquizo, J.; Calderón, C.; James, P. Metrics of urban morphology and their impact on energy consumption: A case study in the United Kingdom. Energy Res. Soc. Sci. 2017, 32, 193–206. [Google Scholar] [CrossRef]
- Bart, I.L. Urban sprawl and climate change: A statistical exploration of cause and effect, with policy options for the EU. Land Use Policy 2010, 27, 283–292. [Google Scholar] [CrossRef]
- Nageli, C.; Camarasa, C.; Jakob, M.; Catenazzi, G.; Ostermeyer, Y. Synthetic building stocks as a way to assess the energy demand and greenhouse gas emissions of national building stocks. Energy Build. 2018, 173, 443–460. [Google Scholar] [CrossRef]
- Paravantis, J.A.; Tasios, P.D.; Dourmas, V.; Andreakos, G.; Velaoras, K.; Kontoulis, N.; Mihalakakou, P. A regression analysis of the carbon footprint of megacities. Sustainability 2021, 13, 1379. [Google Scholar] [CrossRef]
- Ali, K.A.; Ahmad, M.I.; Yusup, Y. Issues, impacts, and mitigations of carbon dioxide emissions in the building sector. Sustainability 2020, 12, 7427. [Google Scholar] [CrossRef]
- Pérez-García, J.; Moral-Carcedo, J. Analysis and long term forecasting of electricity demand through a decomposition model: A case study for Spain. Energy 2016, 97, 127–143. [Google Scholar] [CrossRef]
- Szoplik, J. Forecasting of natural gas consumption with artificial neural networks. Energy 2015, 85, 208–220. [Google Scholar] [CrossRef]
- Bianco, V.; Marchitto, A.; Scarpa, F.; Tagliafico, L.A. Forecasting energy consumption in the EU residential sector. Int. J. Environ. Res. Public Health 2020, 17, 2259. [Google Scholar] [CrossRef] [Green Version]
- Salim, R.A.; Shafiei, S. Urbanization and renewable and non-renewable energy consumption in OECD countries: An empirical analysis. Econ. Model. 2014, 38, 581–591. [Google Scholar] [CrossRef] [Green Version]
- Chen, Z.; Zhou, M. Urbanization and energy intensity: Evidence from the institutional threshold effect. Environ. Sci. Pollut. Res. 2021, 28, 11142–11157. [Google Scholar] [CrossRef] [PubMed]
- Greca, P.; Barbarossa, L.; Ignaccolo, M.; Inturri, G.; Martinico, F. The density dilemma. A proposal for introducing Smart growth principles in a sprawling settlement within Catania Metropolitan Area. Cities 2011, 28, 527–535. [Google Scholar] [CrossRef]
- Rahman, M.M. Exploring the effects of economic growth, population density and international trade on energy consumption and environmental quality in India. Int. J. Energy Sect. Manag. 2020, 14, 1177–1203. [Google Scholar] [CrossRef]
- Ali, W.; Abdullah, A.; Azam, M. The dynamic relationship between structural change and CO2 emissions in Malaysia: A cointegrating approach. Environ. Sci. Pollut. Res. 2017, 24, 12723–12739. [Google Scholar] [CrossRef]
- Ali, S.S.S.; Razman, M.R.; Awang, A.; Asyraf, M.R.M.; Ishak, M.R.; Ilyas, R.A.; Lawrence, R.J. Critical determinants of household electricity consumption in rapidly growing city. Sustainability 2021, 13, 4441. [Google Scholar] [CrossRef]
- Wang, Q.; Yang, X. Urbanization impact on residential energy consumption in China: The roles of income, urbanization level, and urban density. Environ. Sci. Pollut. Res. 2019, 26, 3542–3555. [Google Scholar] [CrossRef]
- Morikawa, M. Population density and efficiency in energy consumption: An empirical analysis of service establishments. Energy Econ. 2012, 34, 1617–1622. [Google Scholar] [CrossRef] [Green Version]
- Sarkodie, S.A.; Adom, P.K. Determinants of energy consumption in Kenya: A NIPALS approach. Energy 2018, 159, 696–705. [Google Scholar] [CrossRef]
- Li, S.; Shi, J.; Wu, Q. Environmental Kuznets curve: Empirical relationship between energy consumption and economic growth in upper-middle-income regions of China. Int. J. Environ. Res. Public Health 2020, 17, 6971. [Google Scholar] [CrossRef]
- Larivière, I.; Lafrance, G. Modelling the electricity consumption of cities: Effect of urban density. Energy Econ. 1999, 21, 53–66. [Google Scholar] [CrossRef]
- Burney, N.A. Socioeconomic development and electricity consumption: A cross-country analysis using the random coefficient method. Energy Econ. 1995, 17, 185–195. [Google Scholar] [CrossRef]
- Liu, L.; Qu, J.; Maraseni, T.N.; Niu, Y.; Zeng, J.; Zhang, L.; Xu, L. Household CO2 emissions: Current status and future perspectives. Int. J. Environ. Res. Public. Health 2020, 17, 7077. [Google Scholar] [CrossRef] [PubMed]
- Lan, L.; Ghasemifard, H.; Yuan, Y.; Hachinger, S.; Zhao, X.; Battacharjee, S.; Bi, X.; Bai, Y.; Menzel, A.; Chen, J. Assessment of urban CO2 measurement and source attribution in Munich based on TDLAS.WMS and trajectory analysis. Atmosphere 2020, 11, 58. [Google Scholar] [CrossRef] [Green Version]
- Bebkiewicz, K.; Chlopek, Z.; Lasocki, J.; Szczepanski, K.; Zimakowska-Laskowska, M. Analysis of emission of greenhouse gases from road transport in Poland between 1990 and 2017. Atmosphere 2020, 11, 387. [Google Scholar] [CrossRef] [Green Version]
- Hashim, B.M.; Sultan, M.A.; Maliki, A.A.; Al-Ansari, N. Estimation of greenhouse gases emitted form energy industry (oil refining and electricity generation) in Iraq using IPCC methodology. Atmosphere 2020, 11, 622. [Google Scholar] [CrossRef]
- Moeletsi, M.E.; Tongwane, M.I. Project direct carbon dioxide emission reductions as a result of the adoption of electric vehicles in Gauteng province of South Africa. Atmosphere 2020, 11, 591. [Google Scholar] [CrossRef]
- Tsai, W.T. Trend analysis of Taiwan’s greenhouse gas emissions from the energy sector and its mitigation strategies and promotion actions. Atmosphere 2021, 12, 859. [Google Scholar] [CrossRef]
- Freebairn, J. A portfolio policy package to reduce greenhouse gas emissions. Atmosphere 2020, 11, 337. [Google Scholar] [CrossRef] [Green Version]
- Iskandaryan, D.; Ramos, F.; Trilles, S. Features exploration from datasets vision in air quality prediction domain. Atmosphere 2021, 12, 312. [Google Scholar] [CrossRef]
- Zhang, W.; Lu, Z.; Xu, Y.; Wang, C.; Gu, Y.; Xu, H.; Streets, D.G. Black carbon emissions from biomass and coal in rural China. Atmos. Environ. 2018, 176, 158–170. [Google Scholar] [CrossRef]
- Chen, J.; Wang, B.; Huang, S.; Song, M. The influence of increased population density in China on air pollution. Sci. Total Environ. 2020, 735, 139456. [Google Scholar] [CrossRef] [PubMed]
- Ren, S.; Stroud, C.A.; Belair, S.; Leroyer, S.; Munoz-Alpizar, R.; Moran, M.D.; Zhang, J.; Akingunola, A.; Makar, P.A. Impact of urbanization on the predictions of urban meteorology and air pollutants over four major North American cities. Atmosphere 2020, 11, 969. [Google Scholar] [CrossRef]
- Ding, L.; Zhao, W.; Huang, Y.; Cheng, S.; Liu, C. Research on the coupling coordination relationship between urbanization and the air environment: A case study of the area Wuhan. Atmosphere 2015, 6, 1539–1558. [Google Scholar] [CrossRef] [Green Version]
- Huo, T.; Cao, R.; Du, H.; Zhang, J.; Cai, W.; Liu, B. Nonlinear influence of urbanization on China’s urban residential building carbon emissions; New evidence from panel threshold model. Sci. Total Environ. 2021, 772, 145058. [Google Scholar] [CrossRef]
- Nathaniel, S.; Nwodo, O.; Abdediran, A.; Sharma, G.; Shah, M.; Adeleye, N. Ecological footprint, urbanization, and energy consumption in South Africa; including the excluded. Environ. Sci. Pollut. Res. 2019, 26, 27168–27179. [Google Scholar] [CrossRef] [PubMed]
- Hasmi, S.H.; Fan, H.; Habib, Y.; Riaz, A. Non-linear relationship between urbanization paths and CO2 emissions: A case of South, South-East and East Asian economies. Urban Clim. 2021, 37, 100814. [Google Scholar] [CrossRef]
- Zhang, W.; Jiang, L.; Cui, Y.; Xu, Y.; Wang, C.; Yu, J.; Stretts, D.G.; Lin, B. Effects of urbanization on airport CO2 emissions: A geographically weighted approach using nighttime light data in China. Resour. Conserv. Recycl. 2019, 150, 104454. [Google Scholar] [CrossRef]
- Wu, S.; Zhang, K. Influence of urbanization and foreign direct investment on carbon emission efficiency: Evidence from urban clusters in the Yangtze River economic belt. Sustainability 2021, 13, 2722. [Google Scholar] [CrossRef]
- Ohlan, R. The impact of population density, energy consumption, economic growth and trade openness on CO2 emissiones in India. Nat. Hazards 2015, 79, 1409–1428. [Google Scholar] [CrossRef]
- Assamoi, G.R.; Wang, S.; Liu, Y.; Gnangoin, T.B.Y.; Kassi, D.F.; Edjoukou, A.J.R. Dynamics between participation in global value chains and carbon dioxide emissions: Empirical evidence for selected Asian countries. Environ. Sci. Pollut. Res. 2020, 27, 16496–16506. [Google Scholar] [CrossRef]
- Liu, Y.; Gao, C.; Lu, Y. The impact of urbanization on GHG emissions in China: The role of population density. J. Clean. Prod. 2017, 157, 299–309. [Google Scholar] [CrossRef]
- Jin, X.; Li, Y.; Sun, D.; Zhang, J.; Zheng, J. Factors controlling urban and rural indirect carbon dioxide emissions in household consumption: A case study in Beijing. Sustainability 2019, 11, 6563. [Google Scholar] [CrossRef] [Green Version]
- Hirano, Y.; Ihara, T.; Hara, M.; Honjo, K. Estimation of direct and indirect household CO2 emissions in 49 Japanese Cities with consideration regional conditions. Sustainability 2020, 12, 4678. [Google Scholar] [CrossRef]
- GMES Urban Atlas Project. Mapping Guide for a European Urban Atlas; European Commission: Brussels, Belgium, 2011. [Google Scholar]
- Zarco-Periñán, P.J.; Zarco-Soto, I.M.; Zarco-Soto, F.J. Influence of the population density of cities on energy consumption of their households. Sustainability 2021, 13, 7542. [Google Scholar] [CrossRef]
- Eurostat Methodologies and Working Papers. Statistical Classification of Economic Activities in the European Community; European Commission: Luxembourg, 2008. [Google Scholar]
- Günay, M.E. Forecasting annual gross electricity demand by artificial neural networks using predicted values of socio-economic indicators and climatic condition: Case of Turkey. Energy Policy 2016, 90, 92–101. [Google Scholar] [CrossRef]
- Bianco, V.; Scarpa, F.; Tagliafico, L.A. Analysis and future outlook of natural gas consumption n the Italian residential sector. Energy Conv. Manag. 2014, 87, 754–764. [Google Scholar] [CrossRef]
- Instituto Nacional de Estadística. Cifras de Población, Ministerio de Asuntos Económicos y Transformación Digital. Available online: http://www.ine.es/dyngs/INEbase/es/operacion.htm?c=Estadistica_C&cid=1254736176951&menu=ultiDatos&idp=1254735572981 (accessed on 12 October 2019).
- Copernicus. Available online: https://land.copernicus.eu/local/urban-atlas (accessed on 6 January 2020).
- Instituto Nacional de Estadística. Demografía y Población, Ministerio de Asuntos Económicos y Transformación Digital. Available online: http://www.ine.es/ss/Satellite?L=es_ES&c=Page&cid=1254735910183&p=1254735910183&pagename=INE%2FINELayout (accessed on 1 November 2020).
- Comisión Nacional de los Mercados y la Competencia. Informe de Supervisión del Mercado de Gas Natural en España; Ministerio de Economía, Industria y Competitividad: Madrid, Spain, 2017.
- Secretaría de Estado de la Energía. Estadísticas y Balances Energéticos; Ministerio para la Transición Ecológica: Madrid, Spain, 2018.
- Ministerio de Industria, Energía y Turismo, Ministerio de Fomento. Factores de Emisión de CO2 y Coeficientes de Paso a Energía Primaria de Diferentes Fuentes de Energía Final Consumidas en el Sector de Edificios de España. Available online: https://energia.gob.es/desarrollo/EficienciaEnergetica/RITE/Reconocidos/Paginas/IndexDocumentosReconocidos.aspx (accessed on 21 October 2020).
- Zarco-Soto, I.M.; Zarco-Periñán, P.J.; Sánchez-Durán, R. Influence of climate on energy consumption and CO2 emissions: The case of Spain. Environ. Sci. Pollut. Res. 2020, 27, 15645–15662. [Google Scholar] [CrossRef] [PubMed]
Figure 1.
Method flowchart.

Figure 2.
Number of cities by type of climate of Spain.

Figure 3.
Number of cities of each group.

Figure 4.
Population of each group of cities.

Figure 5.
Thermal, electric, and total mean energy consumption per household of each group of cities.
Figure 5.
Thermal, electric, and total mean energy consumption per household of each group of cities.

Figure 6.
Thermal, electric, and total mean energy consumption per inhabitant of each group of cities.
Figure 6.
Thermal, electric, and total mean energy consumption per inhabitant of each group of cities.

Figure 7.
Thermal, electric, and total energy consumption per household of each Spanish climate zone.
Figure 7.
Thermal, electric, and total energy consumption per household of each Spanish climate zone.

Figure 8.
Thermal, electric, and total mean energy consumptions per household by group of cities without the influence of climate.
Figure 8.
Thermal, electric, and total mean energy consumptions per household by group of cities without the influence of climate.

Figure 9.
Variation of the DVI index for energy consumptions per household by group of cities without the influence of climate.
Figure 9.
Variation of the DVI index for energy consumptions per household by group of cities without the influence of climate.

Figure 10.
Thermal, electric, and total energy consumption per inhabitant of each Spanish climate zone.
Figure 10.
Thermal, electric, and total energy consumption per inhabitant of each Spanish climate zone.

Figure 11.
Thermal, electric, and total mean energy consumptions per inhabitant by group of cities without the influence of climate.
Figure 11.
Thermal, electric, and total mean energy consumptions per inhabitant by group of cities without the influence of climate.

Figure 12.
Variation of the DVI index for energy consumptions per inhabitant by group of cities without the influence of climate.
Figure 12.
Variation of the DVI index for energy consumptions per inhabitant by group of cities without the influence of climate.

Figure 13.
Thermal, electric, and total CO2 emissions per household by group of cities.

Figure 14.
Thermal, electric, and total CO2 emissions per inhabitant by group of cities.

Figure 15.
Thermal, electric, and total CO2 emissions per household by group of cities without the influence of climate.
Figure 15.
Thermal, electric, and total CO2 emissions per household by group of cities without the influence of climate.

Figure 16.
Thermal, electric, and total CO2 emissions per inhabitant by group of cities without the influence of climate.
Figure 16.
Thermal, electric, and total CO2 emissions per inhabitant by group of cities without the influence of climate.


Table 1.
Classification of Spanish cities by population density.
| Inhabitants/Hectare | Cities |
|---|---|
| Group 1: density < 100 | Albacete (C), Alcalá de Guadaíra (C), Alcoy/Alcoi (M), Alicante/Alacant (A), Aranjuez (C), Arganda del Rey (C), Arona (S), Ávila (C), Badajoz (C), Benalmádena (M), Benidorm (M), Boadilla del Monte (C), Cáceres (C), Cartagena (A), Castellón de la Plana (M), Chiclana de la Frontera (M), Ciudad Real (C), Collado Villalba (C), Córdoba (C), Elche/Elx (A), Elda (A), Estepona (M), Ferrol (O), Jerez de la Frontera (M), Linares (C), Línea de la Concepción (La) (M), Lorca (A), Lugo (O), Marbella (M), Mérida (C), Mijas (M), Murcia (A), Orihuela (A), Ourense (C), Paterna (M), Ponferrada (C), Pontevedra (O), Pozuelo de Alarcón (C), Puerto de Santa María (M), Rivas-Vaciamadrid (C), Rozas de Madrid (Las) (C), Rubí (M), Sagunto/Sagunt (M), San Cristóbal de la Laguna (S), San Sebastián de los Reyes (C), San Vicente del Raspeig (C), Sanlúcar de Barrameda (M), Sant Cugat del Vallès (M), Santiago de Compostela (O), Talavera de la Reina (C), Toledo (C), Torrelavega (O), Torrevieja (A), Utrera (C), Vélez-Málaga (C), Vigo (O), Vila-Real (M) |
| Group 2: 100 ≤ density < 200 | Alcobendas (C), Algeciras (M), Almería (A), Arrecife (S), Avilés (O), Burgos (C), Castelldefels (M), Cerdanyola del Vallès (M), Coslada (C), Cuenca (C), Dos Hermanas (C), Ejido (El) (A), Fuengirola (M), Gandía (M), Getxo (O), Gijón (O), Girona (C), Granada (C), Granollers (M), Guadalajara (C), Huesca (C), Irún (O), Jaén (C), Las Palmas (S), León (C), Lleida (C), Logroño (C), Majadahonda (C), Málaga (M), Manresa (M), Molina de Segura (A), Motril (M), Oviedo (O), Palencia (C), Palma de Mallorca (M), Pinto (C), Reus (M), Roquetas de Mar (A), Salamanca (C), San Bartolomé de Tirajana (S), San Sebastián/Donostia (O), Santa Cruz de Tenerife (S), Santa Lucía de Tirajana (S), Santander (O), Segovia (C), Siero (O), Tarragona (M), Telde (S), Terrassa (M), Torremolinos (M), Valdemoro (C), Valladolid (C), Vilanova i la Geltrú (M), Vitoria/Gasteiz (C), Zamora (C), Zaragoza (C) |
| Group 3: 200 ≤ density < 300 | A Coruña (O), Alcalá de Henares (C), Alcorcón (C), Barakaldo (O), Ceuta (M), Getafe (C), Leganés (C), Madrid (C), Mataró (M), Melilla (M), Mollet del Vallès (M), Móstoles (C), Pamplona/Iruña (C), Sabadell (M), San Fernando (M), Sant Boi de Llobregat (M), Sevilla (C), Valencia (M), Viladecans (M) |
| Group 4: 300 ≤ density < 400 | Badalona (M), Barcelona (M), Bilbao (O), Cádiz (M), Fuenlabrada (C), Huelva (M), Parla (C), Prat de Llobregat (El) (M), Torrejón de Ardoz (C) |
| Group 5: 400 ≤ density | Cornellà de Llobregat (M), L’Hospitalet de Llobregat (M), Santa Coloma de Gramenet (M), Torrent (M) |
Table 2.
Inhabitants per household in each group.
| Inhabitants per Household | |
|---|---|
| Group 1 | 2.66 |
| Group 2 | 2.59 |
| Group 3 | 2.69 |
| Group 4 | 2.67 |
| Group 5 | 2.68 |
Table 3.
Statistical data of energy consumptions per household by group of cities without the influence of climate.
Table 3.
Statistical data of energy consumptions per household by group of cities without the influence of climate.
| Total (MWh/Year) | Thermal (MWh/Year) | Electric (MWh/Year) | |||||||||||||
|---|---|---|---|---|---|---|---|---|---|---|---|---|---|---|---|
| Population Density | Mean | Std. Dev. | Median | Max. | Min. | Mean | Std. Dev. | Median | Max. | Min. | Mean | Std. Dev. | Median | Max. | Min. |
| Group 1 | 9.86 | 2.80 | 9.30 | 15.77 | 5.87 | 2.61 | 2.11 | 2.02 | 8.09 | 0.00 | 7.25 | 0.98 | 7.21 | 9.73 | 5.40 |
| Group 2 | 11.06 | 2.30 | 11.73 | 15.46 | 5.78 | 3.59 | 2.29 | 4.14 | 7.33 | 0.00 | 7.17 | 0.99 | 7.08 | 9.52 | 5.40 |
| Group 3 | 11.44 | 2.97 | 12.80 | 14.56 | 5.87 | 4.35 | 2.61 | 5.06 | 7.47 | 0.00 | 7.09 | 0.67 | 7.30 | 8.25 | 5.82 |
| Group 4 | 12.01 | 2.94 | 13.86 | 14.49 | 6.87 | 4.78 | 2.52 | 5.63 | 7.17 | 0.58 | 7.23 | 0.87 | 7.22 | 8.43 | 5.97 |
| Group 5 | 13.46 | 1.70 | 13.77 | 14.40 | 10.64 | 6.08 | 2.18 | 7.06 | 7.39 | 2.81 | 7.37 | 0.26 | 7.34 | 7.68 | 7.14 |
Table 4.
Statistical data of energy consumptions per inhabitant by group of cities without the influence of climate.
Table 4.
Statistical data of energy consumptions per inhabitant by group of cities without the influence of climate.
| Total (MWh/Year) | Thermal (MWh/Year) | Electric (MWh/Year) | |||||||||||||
|---|---|---|---|---|---|---|---|---|---|---|---|---|---|---|---|
| Population Density | Mean | Std. Dev. | Median | Max. | Min. | Mean | Std. Dev. | Median | Max. | Min. | Mean | Std. Dev. | Median | Max. | Min. |
| Group 1 | 3.69 | 0.89 | 3.66 | 5.26 | 2.27 | 0.96 | 0.73 | 0.79 | 2.69 | 0.00 | 2.74 | 0.32 | 2.81 | 3.68 | 2.18 |
| Group 2 | 4.15 | 0.82 | 4.40 | 5.51 | 2.27 | 1.39 | 0.88 | 1.62 | 2.69 | 0.00 | 2.76 | 0.31 | 2.74 | 3.72 | 2.25 |
| Group 3 | 4.31 | 1.21 | 4.92 | 5.41 | 1.84 | 1.65 | 0.98 | 1.94 | 2.69 | 0.00 | 2.66 | 0.36 | 2.74 | 3.18 | 1.72 |
| Group 4 | 4.48 | 1.02 | 4.92 | 5.26 | 2.67 | 1.78 | 0.96 | 1.94 | 2.69 | 0.22 | 2.69 | 0.18 | 2.74 | 2.86 | 2.32 |
| Group 5 | 5.04 | 0.67 | 5.26 | 5.26 | 3.91 | 2.28 | 0.83 | 2.69 | 2.69 | 1.03 | 2.76 | 0.04 | 2.74 | 2.83 | 2.74 |
Publisher’s Note: MDPI stays neutral with regard to jurisdictional claims in published maps and institutional affiliations. |
© 2021 by the authors. Licensee MDPI, Basel, Switzerland. This article is an open access article distributed under the terms and conditions of the Creative Commons Attribution (CC BY) license (https://creativecommons.org/licenses/by/4.0/).
Share and Cite
MDPI and ACS Style
Zarco-Periñán, P.J.; Zarco-Soto, I.M.; Zarco-Soto, F.J. Influence of Population Density on CO2 Emissions Eliminating the Influence of Climate. Atmosphere 2021, 12, 1193. https://doi.org/10.3390/atmos12091193
AMA Style
Zarco-Periñán PJ, Zarco-Soto IM, Zarco-Soto FJ. Influence of Population Density on CO2 Emissions Eliminating the Influence of Climate. Atmosphere. 2021; 12(9):1193. https://doi.org/10.3390/atmos12091193
Chicago/Turabian StyleZarco-Periñán, Pedro J., Irene M. Zarco-Soto, and Fco. Javier Zarco-Soto. 2021. "Influence of Population Density on CO2 Emissions Eliminating the Influence of Climate" Atmosphere 12, no. 9: 1193. https://doi.org/10.3390/atmos12091193
Note that from the first issue of 2016, this journal uses article numbers instead of page numbers. See further details here.