
Analyzing Mission Impact of Military Installations Microgrid for Resilience
by
 , and
, and
Christopher J. Peterson
1, 
Douglas L. Van Bossuyt
1,*,
Ronald E. Giachetti
1 and
and
Giovanna Oriti
2 1
Department of Systems Engineering, Naval Postgraduate School, Monterey, CA 93943, USA
2
Department of Electrical Engineering, Naval Postgraduate School, Monterey, CA 93943, USA
*
Author to whom correspondence should be addressed.
Systems 2021, 9(3), 69; https://doi.org/10.3390/systems9030069
Submission received: 5 August 2021
/
Revised: 1 September 2021
/
Accepted: 10 September 2021
/
Published: 15 September 2021
Abstract
:This article develops a method to model, analyze, and design military microgrids with the objective to improve their resilience in the face of disconnections from the larger electrical grid. Military microgrids provide power to installation and base facilities to enable base mission objective accomplishments that are related to national security. Previous research, tools, and methods for microgrid design and assessment do not adequately address resilience in terms of accomplishing mission objectives and instead primarily focus on economic outcomes. This article proposes a novel metric to quantify microgrid resilience in terms of its ability to minimize the impact of power disruption on missions supported by the microgrid. The metric is used in a novel design method to ensure an islanded military microgrid can continue operations while disconnected for a two-week duration. Our model examines the ability to continue mission operations subject to various microgrid disruptions as well as equipment reliability.
1. Introduction
The US Department of Defense (DoD) is increasingly interested in improving energy security and increasing resilience at its installations and base facilities [1]. The DoD is concerned with the loss of power from the electric utility, whether due to natural weather events or intentional attack, which can disrupt the base’s operations. Microgrids are systems that can increase the resilience of military facilities to provide power during interruptions by providing multiple redundant local power sources and infrastructure independent of the larger electric utility. Whenever the base becomes disconnected from the grid, the microgrid can operate in what is called “island mode” and continue to provide power to critical electrical loads [2,3].
Analyzing microgrid resilience remains an ongoing topic of interest. Existing resilience analysis techniques primarily focus on economic analyses [4,5,6]. While cost is important to the military, a focus on cost often ignores the mission impact of power loss to national security functions the military microgrids support. Further, it is very difficult to monetarily quantify national security [7,8]. Base resilience is best achieved by minimizing the mission impact of the loss of utility power.
This paper contributes to the literature on DoD facility resilience a modeling and analysis method, and an associated resilience metric, to support the design of microgrids to minimize mission impact in the face of power disruptions. We approach the microgrid resilience issue from a systems engineering perspective because many command-level decisions on funding allocations and assessment of base and force readiness are made from this perspective [9,10]. We define overall resilience of the microgrid as the expected electrical disruption mission impact (EEDMI). Our approach differs from extant work that classifies loads as either critical or non-critical or using what is essentially a binary scale. We assign a mission impact to each load, which is derived from the Mission Depdencency Index (MDI) [11,12], allowing for a prioritization among all the critical loads when trying to minimize mission impact. Using this approach, microgrid resilience is tied to continuation of installation operations rather than only purely economic or power requirements.
2. Background and Literature Review
Microgrids consist of connected loads and energy generation sources (e.g., diesel generators, photo voltaics (PVs), etc.) with a variety of potential control systems and operating philosophies that often include energy storage systems (ESS) (e.g., chemical batteries, thermal storage, etc.) [13]. Many microgrids can either be connected to a larger power grid or operate in “island-mode” temporarily disconnected from the larger power grid [14].
Military microgrids are deployed for various reasons such as to increase electrical power security to meet mission requirements, reduce energy life cycle costs, increase utilization of renewable energy resources, and provide a supply of electrical power to remote areas [3]. Although deliberate attacks on microgrids are not typical [15], military microgrids can be a more attractive and likely target due to the importance of their mission and national security value.
Threats to a military base’s energy security result from a variety of sources, including disruption of power from the utility grid, reliability of components on the base, damage to the grid due to accidents or natural disasters, and deliberate attack (both physical and cyber) [16,17]. Navy guidance prescribes each Navy installation to consider the likelihood and impact of each of the various threats to energy security [10]. While it is desirable to protect against all possibilities, balancing the costs of security measures against the likelihood and impacts of potential threats must be undertaken [16,18]. A holistic approach based on risk and consequences of all threats is necessary to effectively design the system [10,18,19].
A variety of efforts are currently underway to better understand and improve resilience of both civilian and military microgrids. Much existing research on optimizing microgrid design focuses on cost objectives, where minimizing life cycle cost is a priority [4,5,6,20]. When load shedding is factored in, a cost is assigned to the unmet load [21,22,23,24,25]. However, scant guidance is available on how to assign a monetary value to lost load when the load’s intrinsic value is national security [7,8]. Other research assigns the amount of load shedding allowable as a constraint [22,24]. Microgrid resilience research has been primarily focused on a variety of contexts that are not directly applicable to military microgrids or do not take into account some of the nuances that make military microgrids distinct from civilian microgrids. For instance, many focus on civilian microgrid infrastructure where deliberate attack is not taken into account and often instead focuses on adverse weather events [26,27,28] or on recovery actions that may not be practical during a deliberate attack [29]. Other research does not define critical loads in a manner that is applicable to the military [30].
Guidance documents for energy security of military microgrids attempt to optimize microgrid design through maximizing the reliability of meeting critical loads given a fixed investment or by targeting a specific reliability value and minimizing a life cycle cost objective function with reliability as a constraint [9,31,32]. However, cost-based resilience analysis in practice often focuses on reducing operating costs during normal operating conditions (e.g., peak shaving, etc.) rather than on improving resilience [7,8]. Research into deliberate attacks on large electric grids and how to design said grids to defend against such attacks has been conducted [23]. Methods to support military microgrid design decisions based on cost, stakeholder needs, uncertainty, and other factors have been developed [33,34]. Within most of the above efforts, a variety of design parameters are used, such as system response to disruptions, component selection, economics, control system schemas, etc.
DoD guidance and policy have focused primarily on some form of maintaining critical mission functions in defining microgrid resilience. In the military context, multiple definitions of resilience exist and often contain some or all of the following elements: (1) the ability of the system to continue to function despite a disturbance, (2) the ability of the system to maintain vital functions despite a major disruption, and (3) the ability of the system to minimize the duration and impact of a disruption or set of disruptions [35]. DoD Instruction 4170.11 defines energy resilience as “the ability to prepare for and recover from energy disruptions that impact mission assurance on military installations” and critical energy requirements as “critical mission operations on military installations or facilities that require a continuous supply of energy in the event of an energy disruption or emergency” [36]. Within 10 U.S. Code §·101(e)(6), energy resilience is stated as “the ability to avoid, prepare for, minimize, adapt to, and recover from anticipated and unanticipated energy disruptions in order to ensure energy availability and reliability sufficient to provide for mission assurance and readiness, including task critical assets and other mission essential operations related to readiness, and to execute or rapidly reestablish mission essential requirements” [37]. This is similar to resilience definitions and assessments outside of the military context [38,39,40]. Recent resilience analysis work within a military systems context has focused on breaking resilience up into multiple phases of a system design and operation process with associated terminologies to suit each phase of a system’s life cycle [41,42] and across multiple methods of increasing resilience in a system [43]. Further, there have been arguments made to use resilience in analysis of alternatives for military systems [44] and from a mission engineering perspective [45]. Our proposed measure is similar to the value-oriented measure described by Ferris [46,47], except we provide a means to define value as mission impact, whereas Ferris presented a general framework.
DoD doctrine prescribes installation resilience using a days-of-autonomy metric. Naval facilities are required to have seven days of autonomy as driven by UFC 3–540-01, which dictates the amount of onsite fuel storage for backup generators [48]. The Army requires 14 days of power and water for critical missions [49]. For the Marines, the metric is prescribed as the ability for installations to “stay mission operable off of the grid for at least 14 days” [50]. In our professional experience, DoD resilience doctrine is interpreted by base energy managers as requiring one plausible method of providing electrical energy to specific critical missions for the mandated days of autonomy (e.g., 7 days, 14 days, etc.). The days of autonomy is selected by each service branch based on how long it is expected to be able to replicate specific critical missions performed at a base with a power outage at other bases not impacted by a power outage. This paper defines resilience of a military microgrid as the ability of the microgrid to maximize performance of critical missions powered by the microgrid against the entire set of potential disruptions, considering both the likelihood and impact of each disruption. This resilience definition aligns with the military’s needs for performing its missions in the face of all potential adverse events.
For the purposes of the research presented in this article, we propose that resilience of a military microgrid be defined as the ability of the microgrid to maximize functionality of critical missions powered by the microgrid in the event of a disruption. Maximizing resilience means the microgrid provides the maximum functionality against the entire set of potential disruptions, considering both the likelihood and impact of each disruption. This definition of resilience most closely aligns with the overall functional requirement of military microgrids. The proposed definition also closely aligns with the resilience objectives for military facilities within the doctrine and guidance documents reviewed above.
2.1. Understanding the Value of Resilience for Military Microgrids
In many civilian microgrid cases, the value of resilience can be defined in terms of real dollars [51] such as in industrial applications where the loss of production or material in process due to a power loss can be determined [52]. For military microgrids, the “product” is national defense, which does not have an easily defined value [7]. No standard for defining the value of resilience exists within the DoD [8]. Some methods proposed to quantify the value of resilience to the military by equating it to the cost of providing the resilience such as the cost of backup generators [51]. Other methods to define a value for resilience include using the cost to relocate the mission or buy services to complete the mission [53] and calculating a monetary customer damage function (CDF) based on the duration of outage [52].
Instead of approaching the value of resilience of military microgrids from a purely monetary perspective, some have approached the issue by assigning a mission dependency index (MDI) to facilities that captures the relative criticality of a facility [11,12]. Several deficiencies have been identified in MDI, including: (1) inconsistencies in application, (2) time dependency of corrective actions, and (3) the MDI scoring equation [54]. Further, MDI does not take into account that the Navy’s Resilient Energy Program Office (REPO) has recently shifted to using the Energy Security Assessment Tool (ESAT), a spreadsheet model that aids in identifying and prioritizing gaps according to the Navy’s “3 pillars of energy security”, namely efficiency, resilience, and reliability [55]. However in our professional experience, ESAT can suffer from the same issues as MDI. While the Navy’s REPO has shifted to ESA for some applications, we observe MDI still being used broadly across the DoD. In spite of the identified deficiencies of MDI, it is the most accepted and widely used method of quantifying the criticality and importance of a particular facility from a resilience perspective.
2.2. Microgrid Resilience Analysis Techniques Built upon This Research
Several researchers have developed extensions to the research presented in this article based on Peterson’s masters thesis [56] and upon an early draft manuscript of this article. The research presented in this article is fundamental to others’ works. Kain et al. [57] present a method to analyze specific local external threats to a military microgrid such as wildfires, truck bombs, airplane crashes, etc. and relies on the method developed in this article to prioritize improving resilience of the microgrid by adding additional storage and generation at individual critical loads to form self-isolating nanogrids. Herster-Dudley built upon this work to investigate how human factors can delay recovery times for military microgirds that have suffered damage [58]. Hildebrand developed cost models based on the research presented in this article [59]. Beaton used the research presented here to develop an analysis tool to determine if distributed energy storage would result in higher resilience in specific scenarios of interest to military installations [60]. Bolen et al. [61] integrated the research presented in this article with research from several other authors to provide decision-makers with several perspectives on military microgrid resilience. This article provides the fundamental underpinnings of many others’ works and is novel.
3. Methodology
This section presents a novel modeling and analysis method to analyze the mission impact of power disruptions on a military installation using the proposed expected electrical disruption mission impact (EEDMI) metric. The method can optimize microgrid architectures, thus maximizing mission achievement. The method does not take into account issues such as phase imbalances, power factor issues, energy flow direction, and related issues, because we are interested in the higher-level engineering trades necessary for minimizing mission impact. This idealization of the problem space is typical of other high-level architectural microgrid methods [62].
3.1. Step 1: Define Mission and Associated Load for Each Facility
The model links power usage to mission, and the first step is to identify the mission each facility contributes to, the load associated with conducting the mission, and the impact any loss of power would cause to mission accomplishment. We define mission impact as a measure of the base commander’s preference for completion of a particular mission. Bases conduct many missions—e.g., a base might provide in-service engineering to the fleet, logistics support, and test and evaluation of new weapons. In order to quantify , an energy manager can either use existing MDI scores (our recommendation) or develop their own method of quantifying the importance of each facility’s mission to the base and to national security. In general, is attempting to answer the questions:
- What is the importance of the operation a facility supports?
- Does disruption cause further loss?
- Can the mission be delayed, moved to other facilities, or achieved by other means?
- To what degree can the mission continue without the power source?
- Is the mission impacted by other resources (e.g., water, fuel, etc.) other than power loss that might cause discontinuation?
We advocate using MDI to quantify . However, if MDI scores are not available for all facilities on a DoD base, a subjective score could be developed similarly to the concept of utility in decision analysis [63]. Due to the current methods of quantifying the importance of specific loads to national defense (MDI and ESAT), is currently a unitless measure and the range of is arbitrary and based on the method of quantification. For instance, MDI is a 0–100 scale as implemented in DoD; a different scale could be used, such as 0–500, if an energy manager were to develop their own process for producing . However, in the future, a new national defense quantification method may be developed with an associated unit. We adopt the 0–100 MDI scale for .
3.2. Step 2: Generate the Set of Failure Scenarios
The systems engineer then generates the set of failure scenarios S that could disrupt the power supply and estimates the probability of each occurring over the course of a year, here denoted as for each specific scenario s. Events for equipment failure should use historical data if available. This step should also consider the impacts of other systems and factors upon which the microgrid is reliant such as fuel delivery disruption, spare parts unavailability, etc. Existing sources of data and quantification processes for predictable failure scenarios originating outside of a site boundary can be used for DoD bases such as weather events, earthquakes, and other natural and man-made hazards [64,65]. However, deliberate attacks are currently challenging to postulate and predict in a way that is applicable to all DoD bases. Instead, an energy manager must evaluate the specific circumstances of a specific DoD base, relevant current and anticipated future threat postures, and other relevant conditional information to construct plausible attack scenarios. For instance, a DoD base located on an isolated island with no civilian population likely does not need to consider a vehicle-based improvised explosive device, but a DoD base with direct road access to population centers likely does. It should be noted that not all militaries take the same approach as the DoD when locating bases and when determining the level of integration a base will have with the surrounding community. For that matter, DoD bases do not have a one-size-fits-all approach to how a base is located and how it is connected to or protected against the surrounding community. Thus, it is important that practitioners carefully assess each individual military base to determine potential failure scenarios of interest.
We recommend that the following failure scenarios, in order, should comprise the minimum set of scenarios analyzed. Additional scenarios (e.g., forest fire, improvised explosive device, tsunami, plane crash, etc.) should be chosen based on the specific circumstances of the base. Variations of the minimum set of scenarios may be justified if PV is a major generation source or if other time-of-year-related factors may significantly influence microgrid operations (e.g., higher failure rate of ESS and diesel generators in winter or summer due to extreme temperatures).
- Island mode over mission duration (e.g., 7 days, 14 days, etc.) with no additional failures (baseline scenario);
- Island mode over mission duration with random failures of hardware components;
- Island mode over mission duration with no access to diesel fuel resupply;
- Island mode over mission duration with random failures of hardware and no access to diesel fuel resupply;
- Additional scenarios of specific interest to a base such as malicious and human-caused events (e.g., physical attack, cyber attack, plane crash, etc.), and natural disaster events of interest to a base (e.g., tornado, flood, wildfire, etc.).
3.3. Step 3: Determine the Recovery Time
The systems engineer then determines the recovery time of each component in the microgrid. This can be a probability distribution to account for the variation in repair times, and is generally scenario-dependent. For instance, the repair times during a natural disaster will likely be higher than those due to equipment failure due to widespread impact of a natural disaster in the area and availability of resources to perform repairs.
3.4. Step 5: Simulate the Microgrid System
The systems engineer then simulates the microgrid system using a model developed with information collected in the above steps and initial systems engineering analysis effort. The modeling effort is described in detail in Section 4.1 below. The model generates the impact of each event in terms mission impact (). The model determines the load shedding and behavior of the system and facilities and then calculates using the function mapped in the previous step. Since load shedding and subsequent varies depending on conditions, demand, and starting state of the system, we advocate using a Monte Carlo simulation for each scenario; however, other simulation methods can be used if desired. The mean over all iterations of the Monte Carlo simulation, , quantifies the expected mission impact over that specific scenario s.
3.5. Step 6: Calculate the Total Mission Impact
The systems engineer then calculates the total impact of disruption events over all considered failure scenarios, defined here as expected electrical disruption mission impact (). This quantifies the resilience of the system against all expected threats and disruptions. We calculate the mission impact for a single scenario as the per unit time (T) of the entire duration scenario,
We calculate as,
Assuming MDI has been used for , is unitless. Otherwise, may have units based on what quantification was chosen in Step 1 above. The serves the purpose of comparing different microgrid architectures for a base with the lowest signifying the microgrid architecture that best supports the base’s missions. When using MDI or other quantifiable measures, allows for a ordinal ranking of all the microgrid architectures, which is what we use it for.
3.6. Step 7: Analyze Results
Finally, the systems engineer inspects the results to uncover the main drivers of mission impact and evaluates possible changes to the system configuration, specifications, or operation to minimize those effects. Inspection of the contribution of each scenario to informs the systems engineer which scenarios or probabilities contribute the most. The systems engineer can iterate the analysis for different microgrid architectures as required, generating the for alternate designs for comparison.
4. Illustrative Military Microgrid Analysis and Results
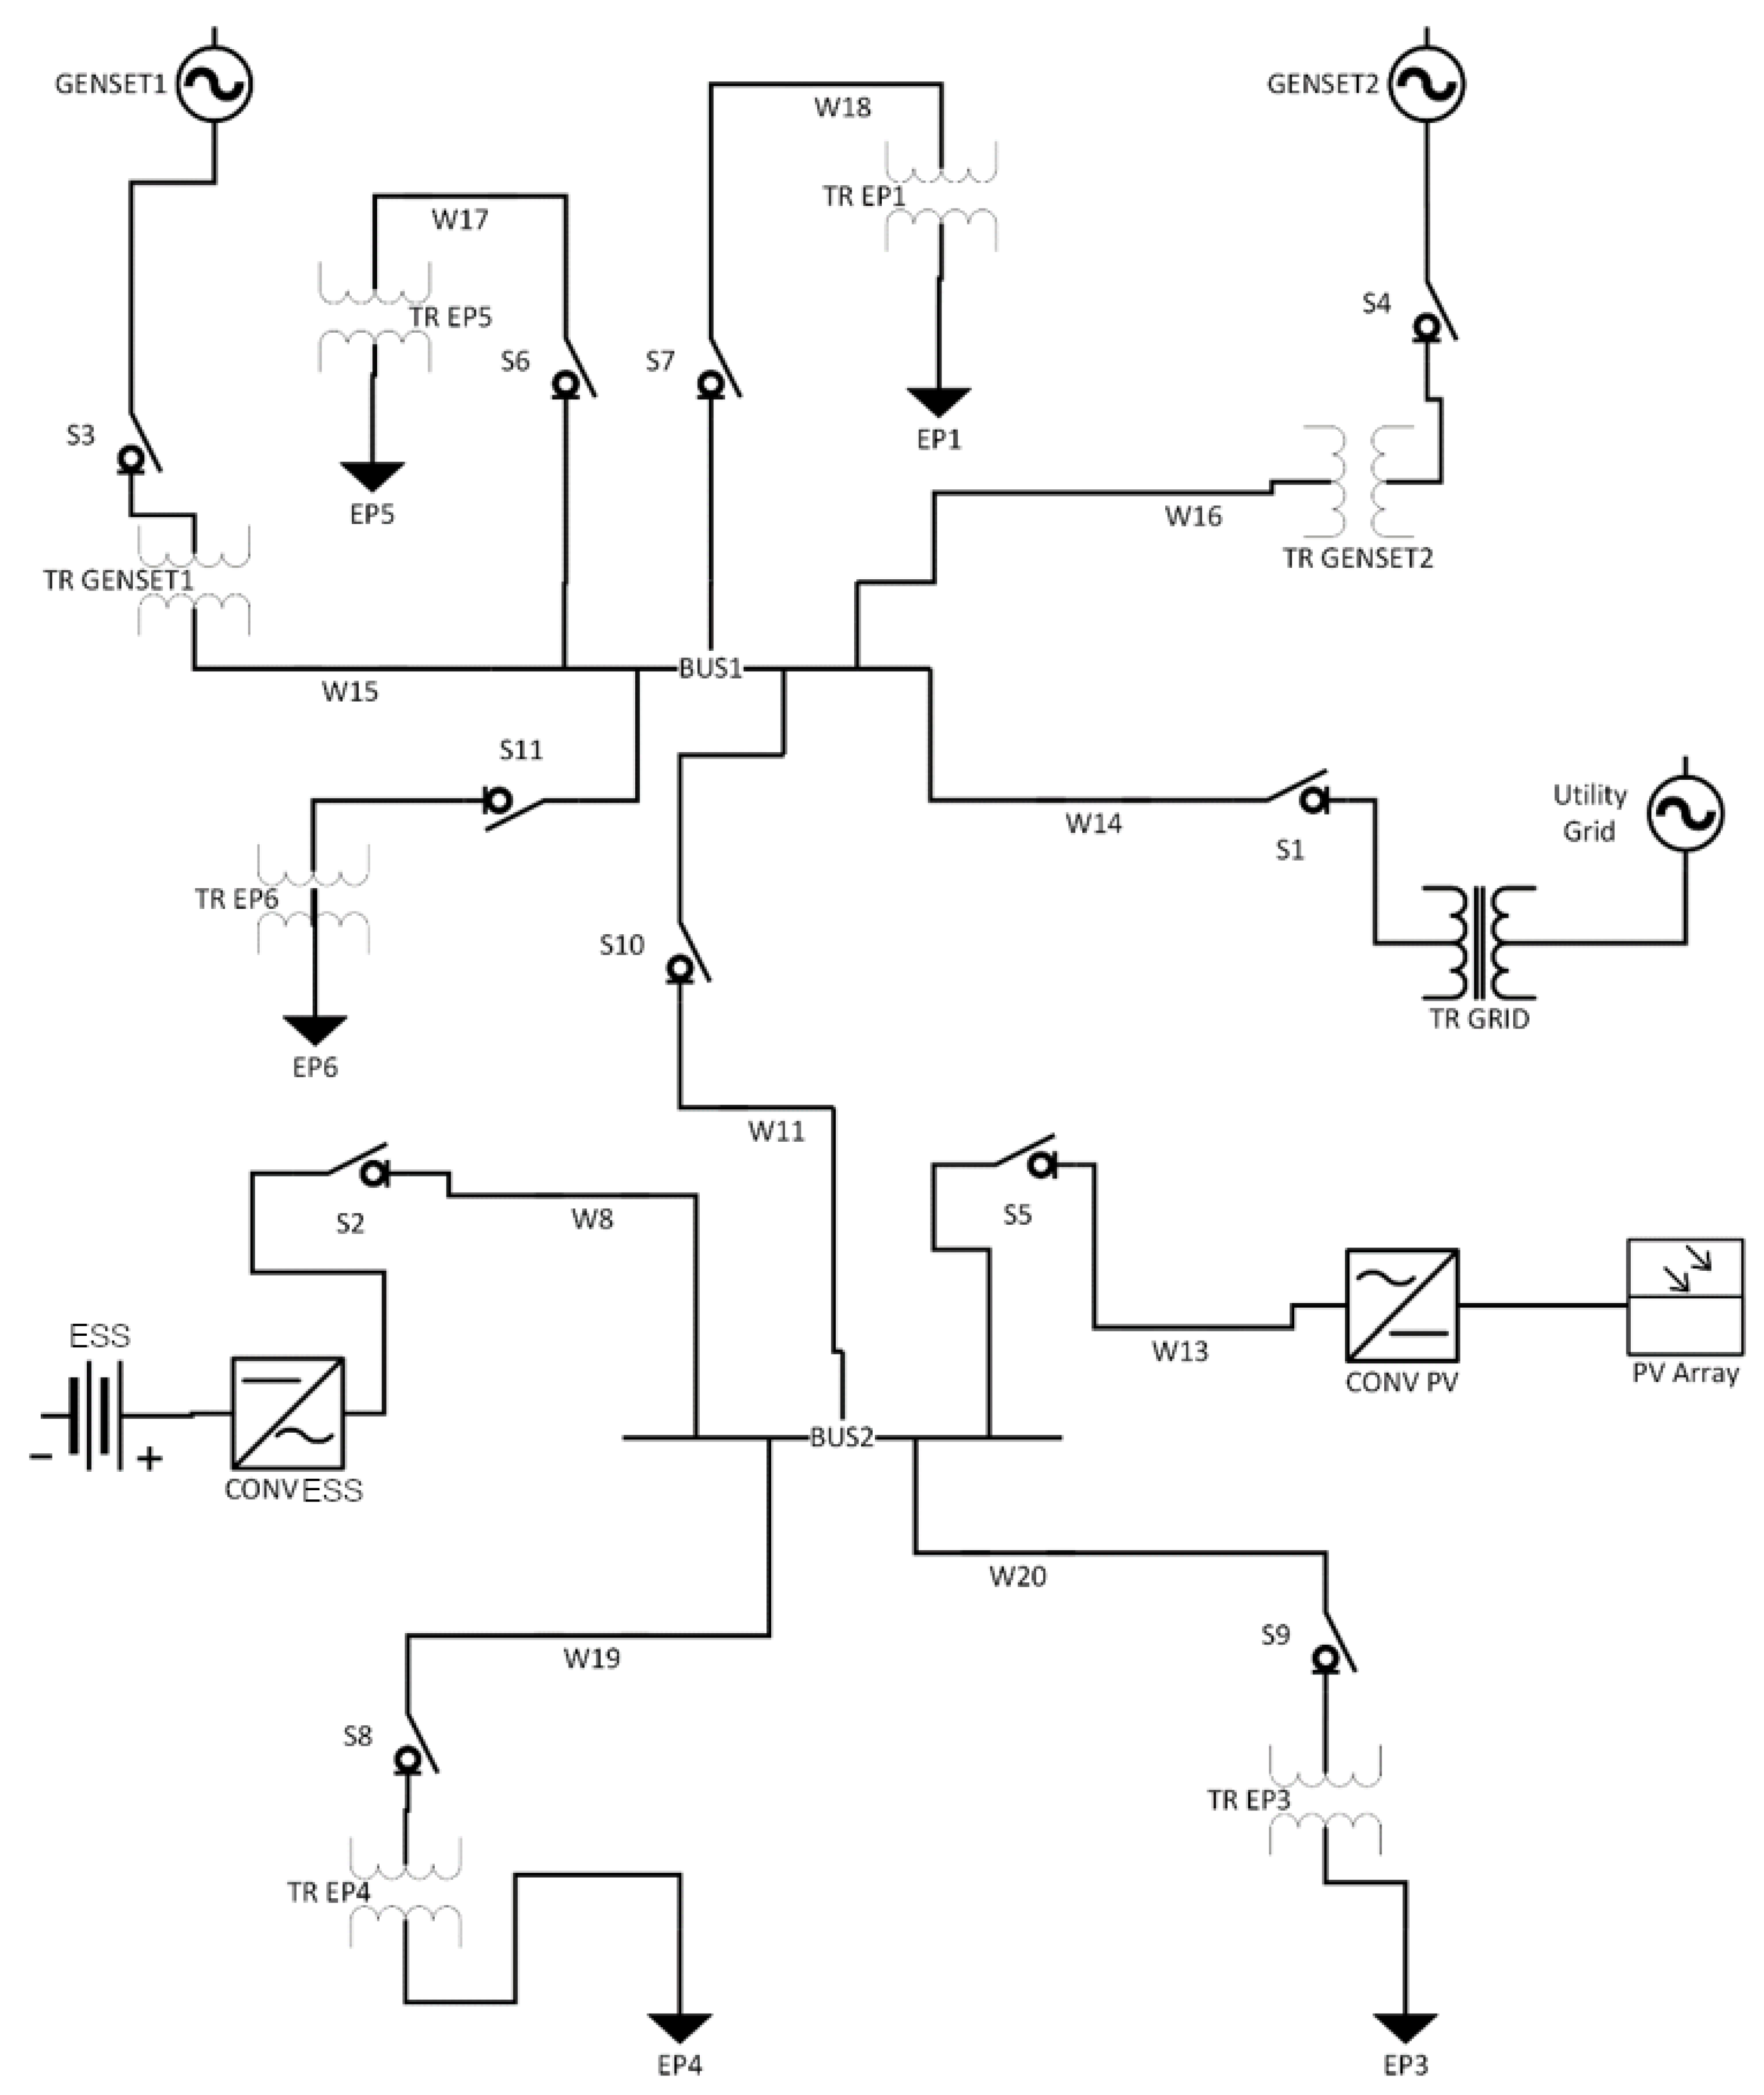
This section demonstrates how a system engineer could apply the proposed model and method to analyze the resilience and mission impact for a microgrid on a DoD base. Figure 1 presents the microgrid baseline architecture. The baseline microgrid consists of two electrical feeders denoted as BUS1 and BUS2 connected to each other, with the utility grid connection at BUS1. The microgrid distribution system is typical of office buildings and local distribution systems found on military bases.
The baesline microgrid includes two power-generation sources of two diesel generators, each with 300 kW capacity, that are operated together, which is a typical operating mode at some bases, and one 3000 m PV array operating at 18% efficiency. The microgrid has an ESS in the form of a battery system for energy storage with capacity of 3000 kWh with a charge/discharge rate of 300 KW/h, which stores power to balance load and demand. The PV and ESS sizing of the baseline microgrid is typical of demonstration renewable energy projects found on some bases. The PV and ESS can help to supplement the diesel generators in island mode and provides a small level of redundancy. The installation has 5000 gallons of fuel storage split evenly between the two diesel generators sufficient for one week operation. Table 1 summarizes the facilities, power demand when emergencies occur (the critical loads), and on a per hour basis derived from MDI if the loads represented by the facilities are lost.
The control logic seeks to maximize resilience of the system against an unpredictable long-term outage of utility power. For this reason, the ESS is maintained in a fully charged state when connected to utility power with no attempt to reduce costs through peak shaving or other means. When in island mode, if demand exceeds generator capacity, then the additional energy needed is drawn from the battery. The PV energy charges the battery when excess PV energy is available and otherwise supplements the diesel generators and ESS. The microgrid only sheds loads after demand exceeds both the generator capacity and battery storage capacity.
Failure rates of the components in the microgrid come from publicly available data sources [66,67,68,69,70]. Reliability block diagrams were developed to calculate the overall failure rate for each power line link within the microgrid, including between the PV array, the ESS, the diesel generators, the loads, and other microgrid components.
4.1. Modeling Approach
The model determines the power flow within the microgrid, the pertinent states of the equipment within the microgrid such as the ESS charge state, PV power being generated, and state of the components that make up the microgrid. The model records demand not met and required load shedding and calculates the resulting impact to mission. Power demanded at each facility and PV power generated are stochastic and time-dependent. The simulation model is implemented via a set of MATLAB scripts, which are available in [56]. The active power balance equation is used to model the microgrid’s power system in steady state, which can change hourly [71]. Of note, this model can be used for either AC, DC, or hybrid microgrid analysis with any power conversion losses included in the model through efficiency of each distributed resource the power balance equations.
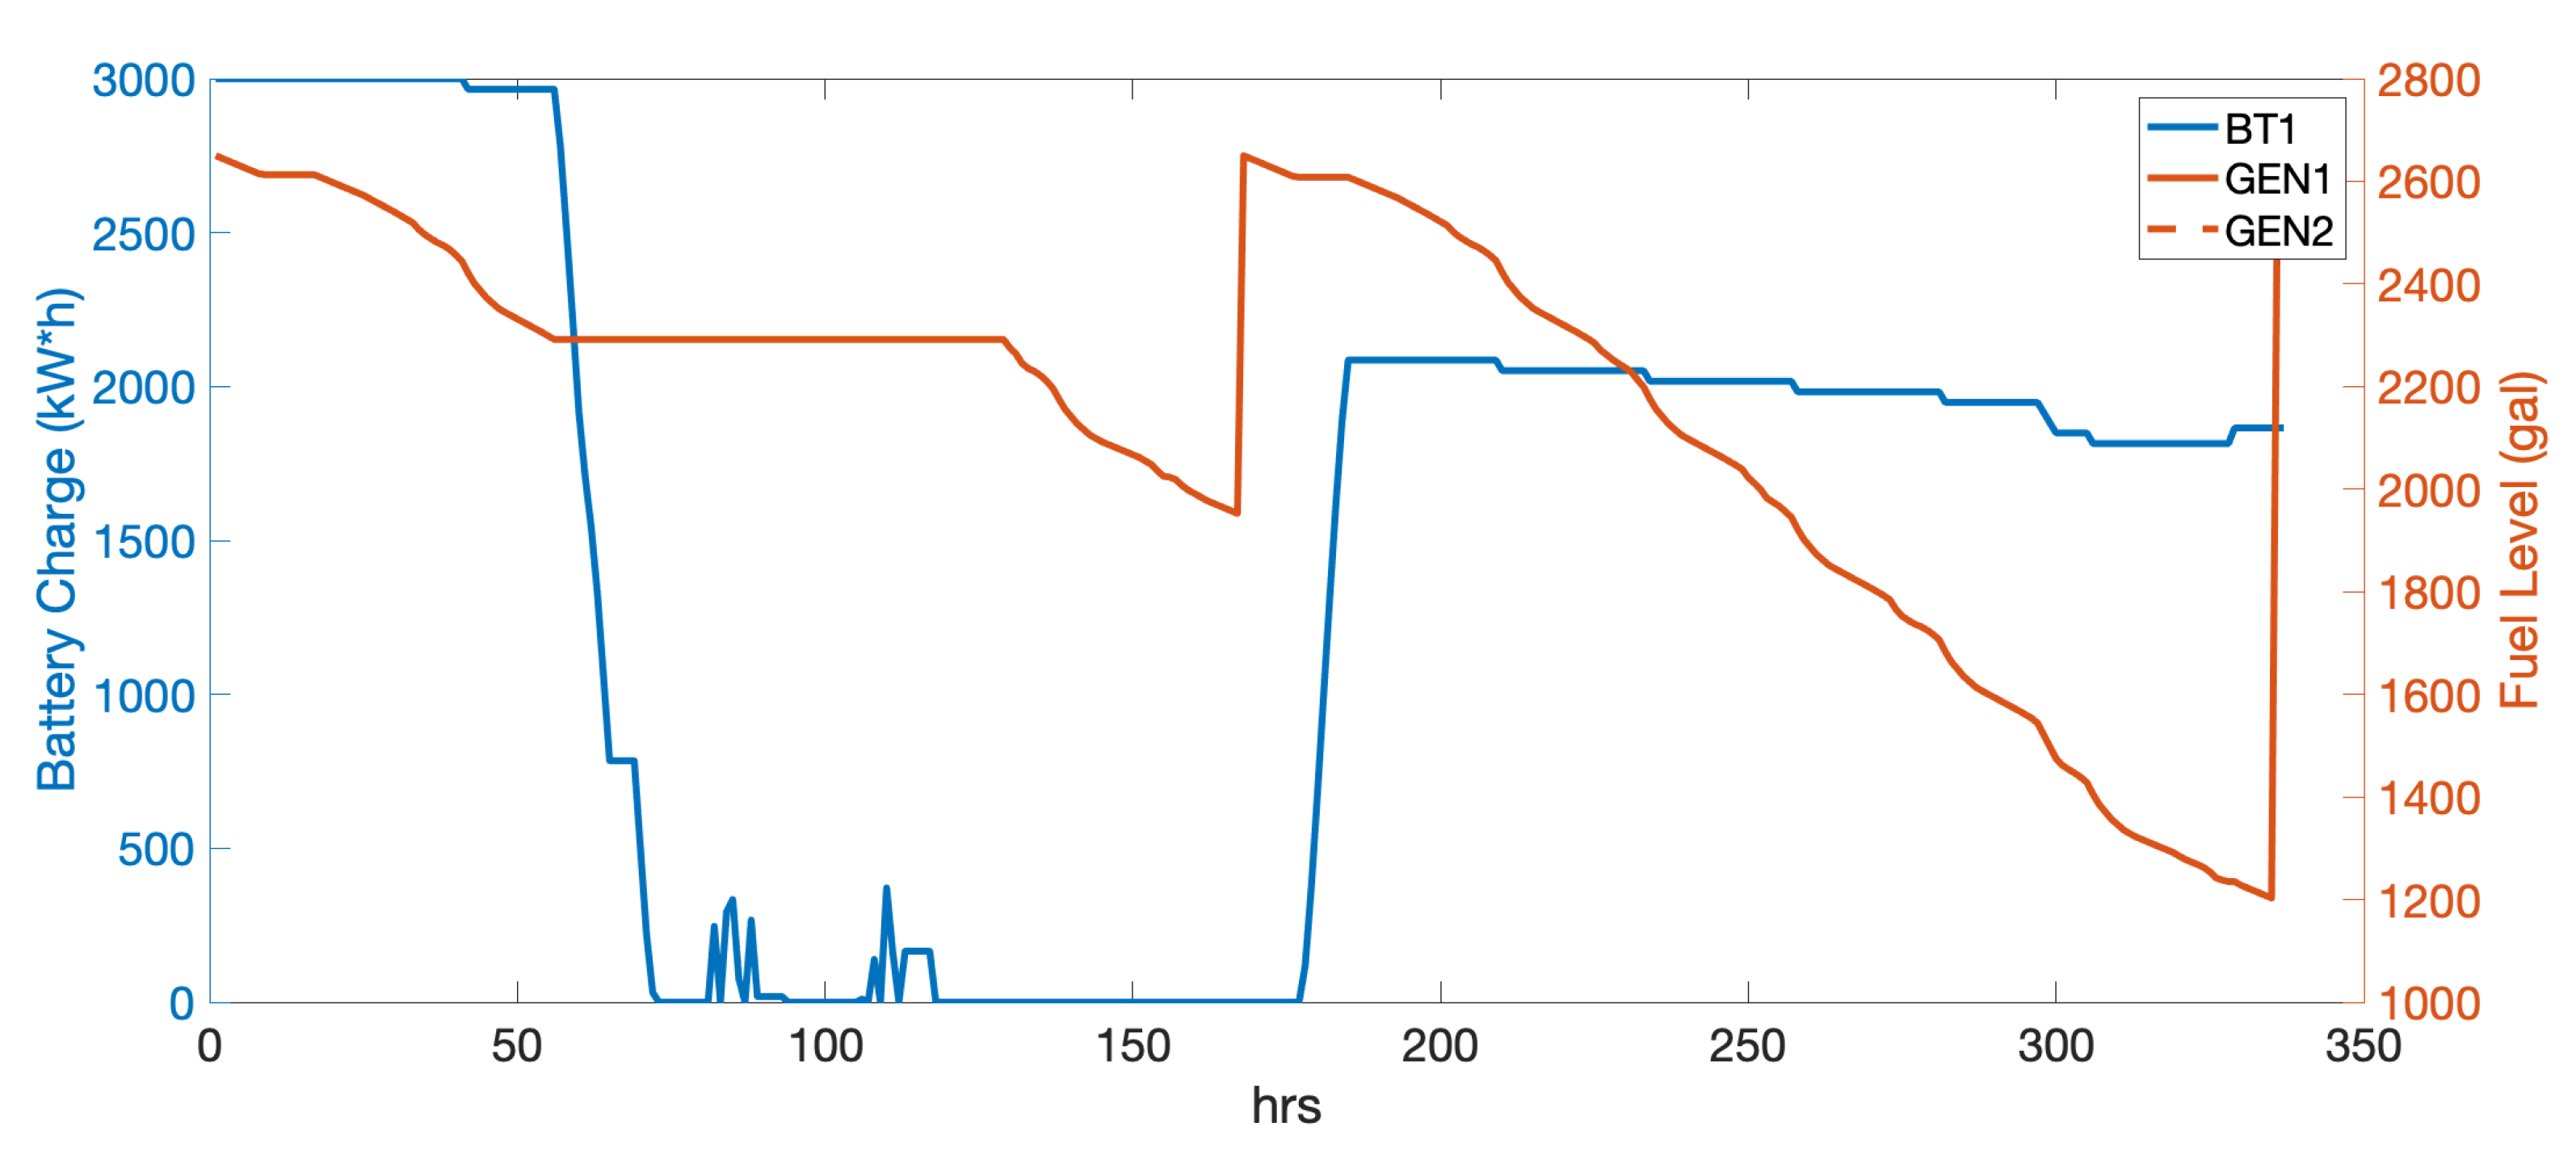
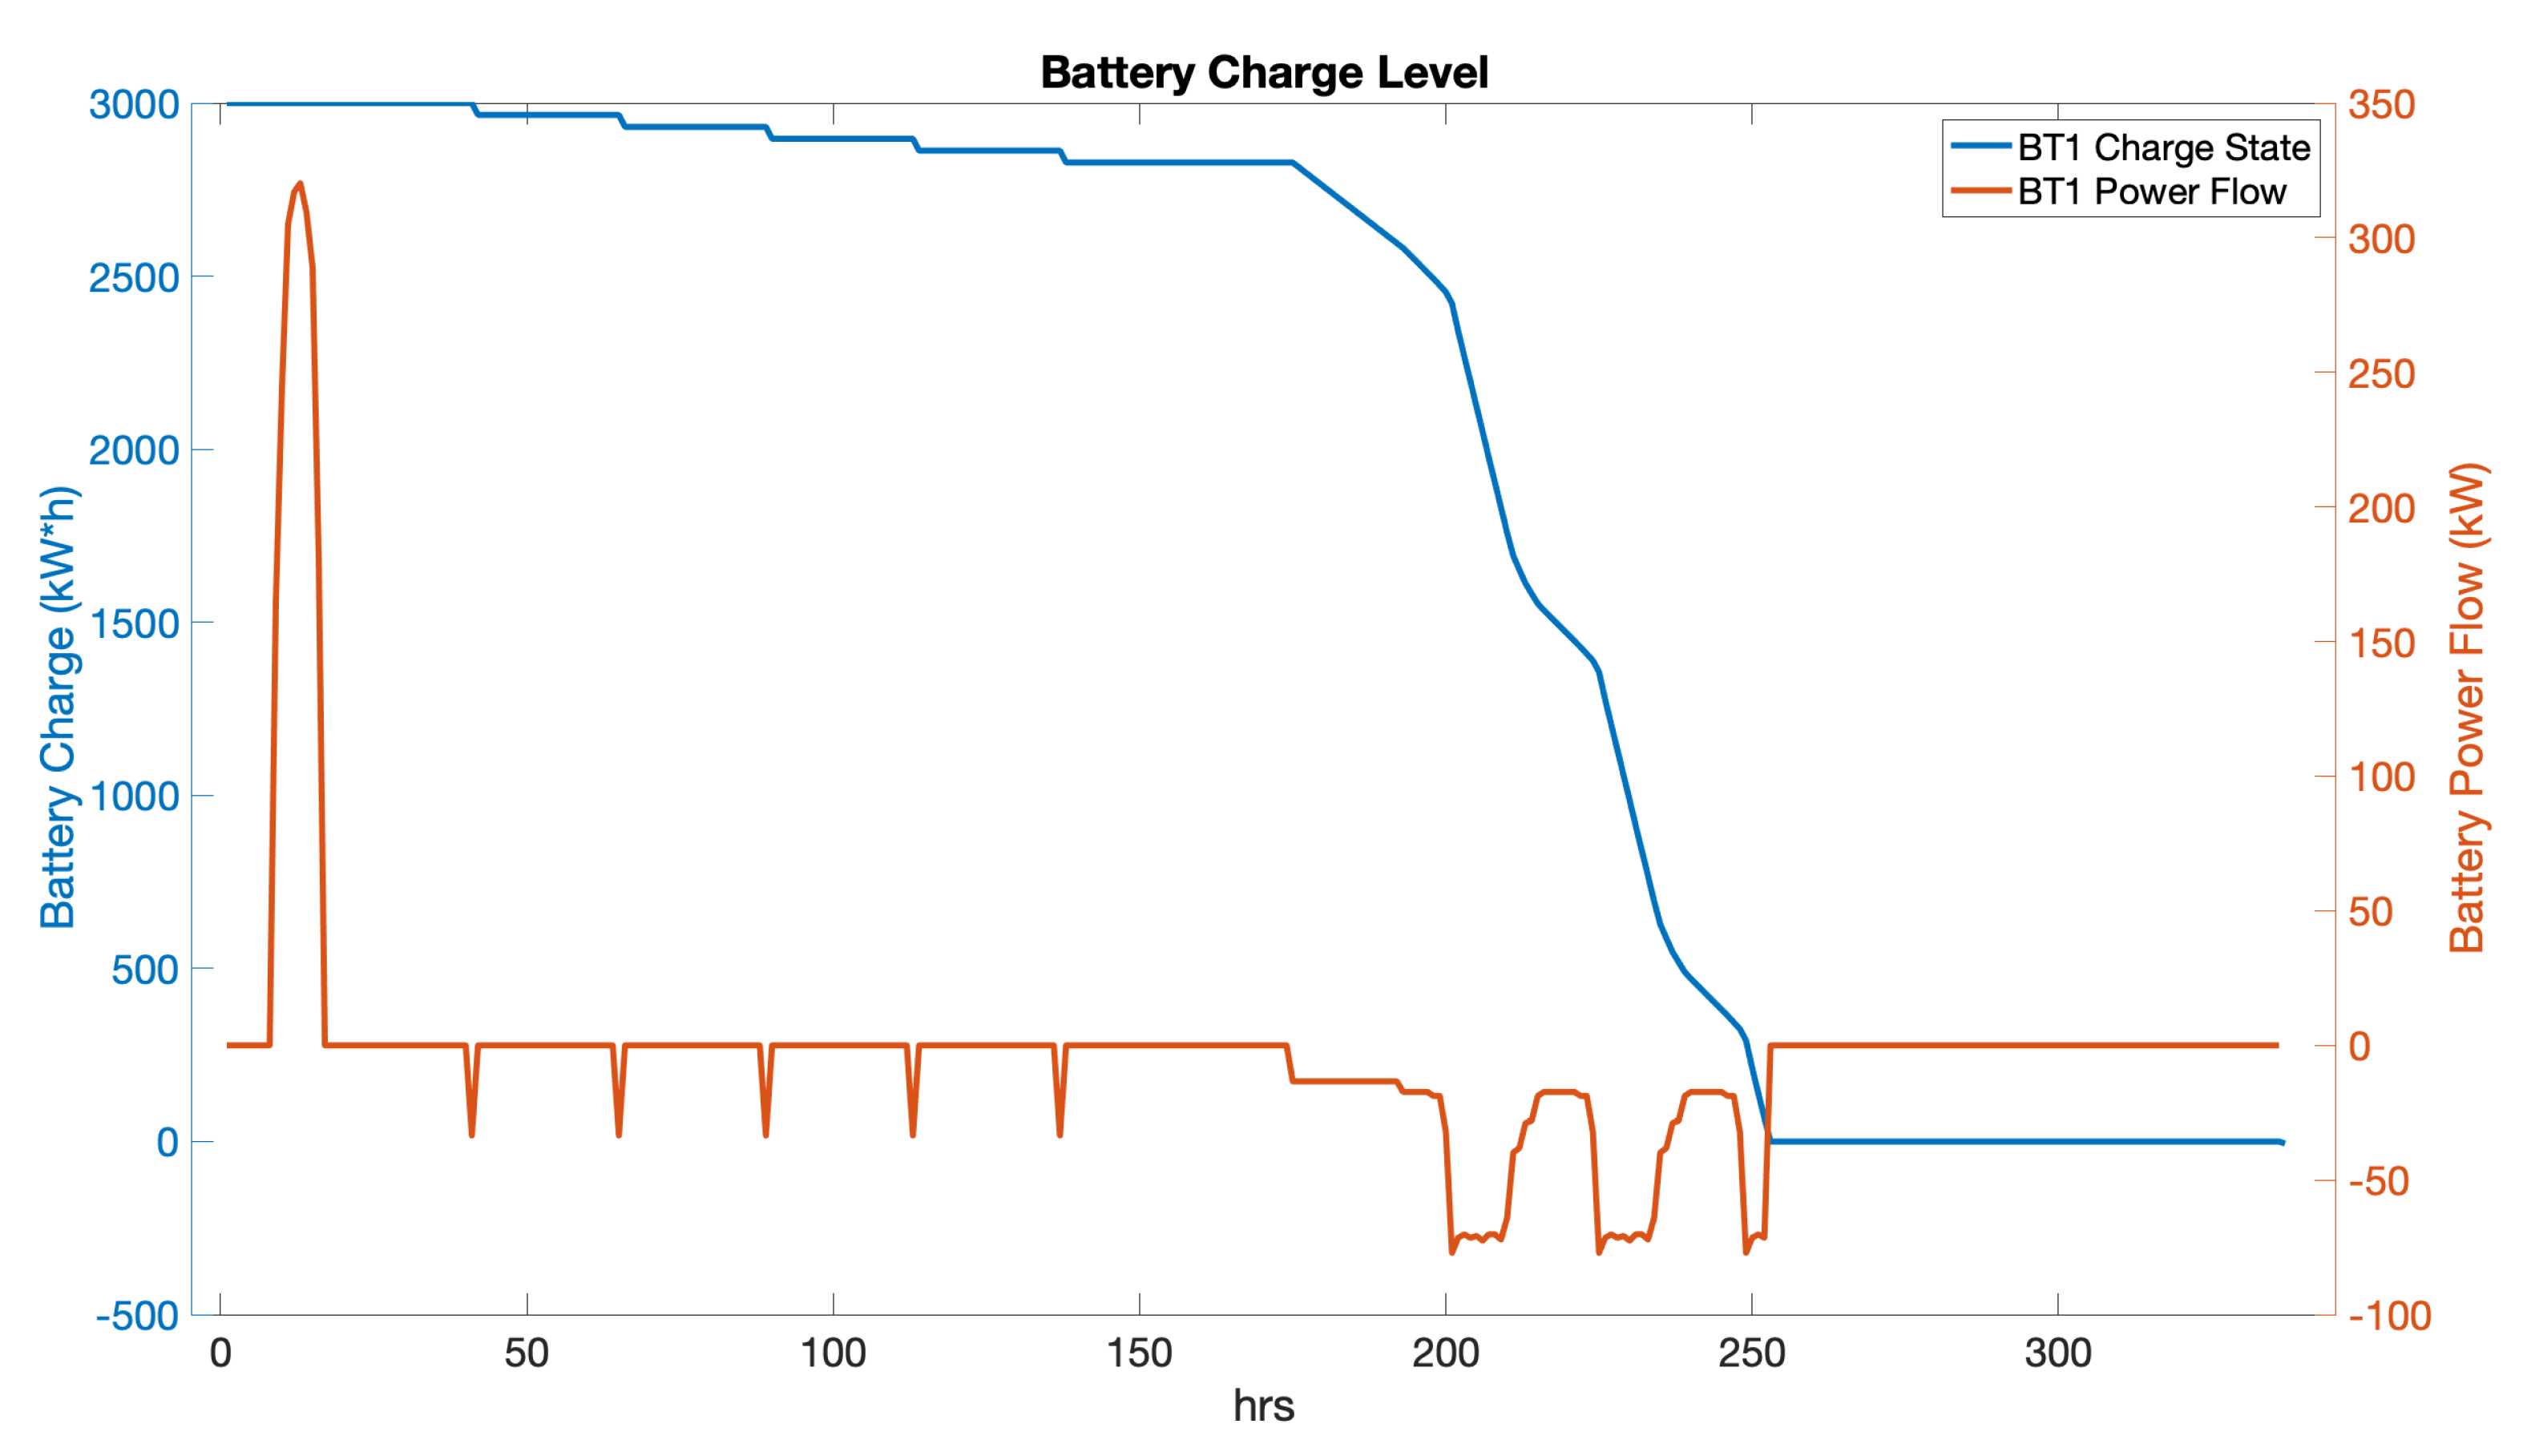
The simulation model uses the normal hourly load data demanded at each facility, as was discussed in Section 4 and shown in Table 1, which is derived from [66] for this case study. The data source contains ten years of hourly load data. During island mode operation, the model modifies the demand profiles to only power critical loads and sheds non-critical loads. We assume that the base has determined for each facility what loads must be served during the island mode instances and have a control system to switch off non-critical loads. The model calculates the amount of PV power generated using solar incidence received at the ground, PV area, and efficiency using solar incidence data from the National Solar Radiation Data Base [72]. The model can optionally be set to run over a randomly selected two-week window in a specific year of solar data or run over a specific two-week window, which can illuminate potential microgrid architecture issues related to PV sizing during winter months if PV is a significant contribution to generation capacity. Figure 2 shows an example of the output from the simulation model during a two-week island mode operation with a 72 h generator failure event. Figure 3 shows an example output of a 72 h loss of the PV array and the connection between the BUS1 and BUS2 feeders.
The simulation implements failures or attacks using the operational state of each of the components within the system; i.e., either operational or not operational. The operational state of each connection to the feeders (e.g., BUS1, BUS2) between nodes within the microgrid may be user-defined as an input to the simulation. This allows the user to define a scenario of interest for the simulation, such as failure of multiple elements for a set amount of time. The model performs Monte Carlo simulations to calculate the overall risk and effects given the stochastic nature of load and PV generation. The user can vary the failure rates and repair times to capture the sensitivity of the grid resilience to different factors. This informs the systems engineer by allowing her to evaluate different types of equipment and sparing and repair strategies to be used when operating the system to maximize its resilience. Table 2 presents the summary of inputs and outputs in the simulation model.
4.2. Scenario Investigation
The subsequent subsections investigate specific failure scenarios and iterate on the microgrid design as deemed necessary. The baseline scenario where all microgrid equipment is functioning properly and no events beyond the initial grid disconnect occur is first investigated. Then random equipment failures are added to the baseline scenario which provides motivation for a redesign of the microgrid. Next, the case of missed diesel resupply is investigated. Then several additional scenarios of interest (cyber attack, plane crash, weather event, etc.) are investigated to determine if further redesign of the microgrid is necessary. A practitioner must carefully analyze their specific installation’s scenarios of interest.
4.3. Baseline Scenario
The baseline microgrid architecture operating in island mode due to electrical grid disruption over a 14 day duration with no random failures and successful diesel resupply shows that the microgrid successfully completes its mission over 1000 Monte Carlo runs across a year of solar data. The results of the runs indicate the baseline microgrid architecture is sufficient to sustain all critical loads in this scenario—an of zero results from this scenario.
4.4. Baseline Scenario with Random Failures
Random failures are now introduced into the baseline scenario where each component in the microgrid is provided an annual probability of failure and mean time to repair (MTTR). Each failure mode is run on 1000 Monte Carlo simulations to calculate , and then the mean and standard deviation (SD) of each for each failure mode is calculated. Table 3 shows the input values for probability of failure (used in later calculations) and MTTR, and the output of the mean and standard deviation of for each failure mode. The failure data come from publicly available data sources [66,67,68,69,70].
The results shown in Table 3 indicate that in the baseline microgrid architecture the PV array is not needed to reduce , which is expected because the PV is sized as a demonstration renewable energy project that is under-sized to support situations where one of the two diesel generators fail. However, the ESS is important to support the microgrid because the two diesel generators cannot meet peak critical loads and must rely on the ESS providing power during those times.
The can be calculated for the above set of failure scenarios using Equation (2). In the above set of failure scenarios, the total is 2797.4. This can serve as a useful baseline reference when examining what changes could be made to an existing microgrid architecture. Improvements in resilience will decrease .
A systems engineer may want to use these results as motivation to adjust PV and ESS sizing to better account for failures that may occur while the microgrid is islanded such as a diesel generator failing. For instance, increasing ESS and PV size to a 10,000 m PV array and a 10,000 kWh ESS with a 1000 kW max charge/discharge rate virtually eliminates load shedding events when one of the two diesel generators is offline and results in 1.5 Mean and SD 33.9. This indicates that only in very rare circumstances, when there are multiple back-to-back days with very low solar energy, will a load be shed in this scenario. Throughout the rest of the illustrative analysis, the above PV and ESS sizing is used. Re-running the simulations performed above produces an of 407.8, which is an order of magnitude less than what the was prior to resizing the PV and ESS. Such a significant reduction in indicates that the PV and ESS resizing significantly improved resilience of the microgrid.
We observed that many of the events in the Monte Carlo simulation are binary such as equipment being in one of two states: operational or failure. Consequently, the summary statistics do not always convey the full picture of what may occur. For instance, in just under half of the simulations, no load shedding occurs when the ESS is lost. Similarly, loss of a single generator results in no load shedding in two thirds of the simulations. Loss of the PV array never results in load shedding. In many cases where the SD is 0, the critical loads that lose power are always the same based on the microgrid control logic.
4.5. No Diesel Resupply Scenarios
The next set of scenarios examines what happens when the diesel generator fuel bunkers are not resupplied at the expected interval. A missed diesel resupply can occur for a wide variety of reasons, and DoD microgrids that are overly reliant on regular diesel delivery during a prolonged island mode period may have excessive load shed events. The microgrid architecture is sized to require refuel of the diesel generators every seven days. Because of the redesign of the microgrid to incorporate significantly more PV and ESS capacity, the Mean is 115.1 and the SD is 695.9. This indicates that in most scenarios, the PV and ESS are sufficient to support all critical loads. The next step is to re-run the no-diesel scenario including random equipment failure as was done previously, which has been omitted here.
4.6. Additional Scenarios of Specific Interest
This section explores the mission impact and response of the system against natural disasters, malicious events, and human-caused events. The intent is to explore the resilience of the microgrid against atypical failures, extended failures of portions of the system due to catastrophic failures, and failure of multiple portions of the system due to common cause failures, natural disasters, or deliberate attack, all of which are of particular relevance to the DoD.
4.6.1. Malicious and Human-Caused Events
We separate malicious and human-caused events from natural disasters to highlight the specific issue of assigning probability of occurrence to malicious and human-caused scenarios. For instance, assessing the likelihood of an adversary conducting a cyberattack, an attack on a portion of the microgrid, and other malicious attacks is challenging. Likewise, assessing human-caused events such as military plane crashes is equally challenging. In order to understand the contribution that malicious events and human-caused events make to , we propose assigning a probability on an annual basis of 1 × 10 to these scenarios in the absence of reliable data. For instance, while many attempts at quantifying cyberattack probability exist in the literature, we suggest that military microgrids are potentially a bigger target for cyberattack versus their civilian counterparts, including zero-day exploits that are difficult to predict.
A cyberattack could lead to the failure of the system to switch to only supplying critical loads on the loads supplied by the BUS2 feeder in the event of the failure of the connection between the BUS1 and BUS2 feeders. If the switch to critical loads within the system only occurs when disconnected from utility power and operating in island mode, noncritical loads could continue to receive power. The DoD facility may be unaware of the failure of the connection between the BUS1 and BUS2 feeders due to the ability of the ESS and PV array to continue to meet normal loads. Under all investigated durations of no non-critical load shedding on feeder BUS2 and with the connection between the feeders disconnected, mean and SD remained 0, meaning that the system is very resilient to this type of cyberattack failure. Other cyberattacks targeting other portions of the microgrid may be warranted based on specific microgrid architectures and is omitted here. It is important for a cybersecurity threat assessment to be conducted regularly on microgrid infrastructure to determine if specific components have become more vulnerable to attack and then re-run a cyberattack scenario to determine if has significantly changed.
The scenario of a large portion of the microgrid being destroyed by an airplane crash is next investigated. Many bases are co-located or in close proximity to airfields. In this scenario, we assume that the grid connection is severed, both diesel generators are destroyed, and the link between the BUS1 and BUS2 feeders is severed for 72 h until firefighting and disaster response operations have concluded so that utility crews can access and re-energize the BUS2 feeder. In this scenario, mean is 22,523.3 with an SD of 10,320.9. This indicates that an airplane crash could cause significant critical load shedding in the first 72 hours to EP1, EP5, and EP6. After the connection between the BUS1 and BUS2 feeders is re-energized, the three critical loads are picked back up by the the PV and ESS.
The scenario of a deliberate attack on the distribution system that supplies the three facilities with the highest is next examined. In this scenario, the transformers for EP4, EP5, and EP6, which are located above ground, are destroyed while at the same time the utility power grid in the region is bombed, destroying several high voltage transmission towers feeding area substations. While in this scenario, the base has spare transformers on-site and crews ready to dispatch to replace the destroyed transformers, it is assumed that it takes 96 hours to restore power to the EP4, EP5, and EP6 loads due to a delay in securing the base and ensuring utility crews will not be targets of a second attack and conduct the repair work. Power from the utility grid is not restored for 14 days due to the off-base destroyed transmission towers. Under this attack, a mean of 21,888 and SD of 0 results.
Many additional malicious and human-caused events likely exist for military microgrids. Location-specific and threat posture-specific scenarios should be postulated by base energy managers and then analyzed in the same manner as was done above.
4.6.2. Natural Disasters
We now focus on natural disasters. Natural disasters are generally well-understood, and the probability of occurrence of a wide range of natural disasters has been determined for locations throughout the globe. The specific natural disasters relevant to a particular military microgrid must be selected by the base energy manager. Several representative scenarios are examined below.
A scenario where a wildfire enters a base is next investigated. In this scenario, the wildfire destroys the grid connection, the ESS, and one diesel generator. While in the past, wildfire season was contained to the summer and fall months, recent fires in the American west point toward year-round fire season. Thus, the Monte Carlo simulation continues to run across an entire year rather than only one period of the year. The resulting mean is 5922.7 and SD is 16.9. Future calculations of this scenario use a probability of 5 /year, which is based on a generic estimated wildfire frequency in California. Practitioners should adjust the probability based on their specific base’s location and local wildfire patterns.
A scenario where a debris flow going through a base following a wildfire or atmospheric river event is next investigated. Burn scars and atmospheric river events can produce large debris flows, which can destroy infrastructure downstream. This has occurred with unfortunate regularity in the American west in the last few decades. In this scenario, we assume that one diesel generator, the grid connection, and the connection between the BUS2 feeder and the PV array are destroyed. This results in a mean of 21,805.6 and SD of 1582.4. A probability of occurrence of 2 /year is used in future calculations.
4.7. Total Impact to Mission
After all potential events and scenarios have been investigated and and probability data have been tabulated for each, is calculated from Equation (2). The is 5283.9 for the scenarios discussed above. The contribution to of the equipment failure scenarios is 407.8, which is an order of magnitude lower than the contribution of the additional scenarios of specific interest. This indicates that a base energy manager should investigate potential upgrades or modifications to the microgrid architecture to better protect against the additional scenarios of specific interest.
4.8. System Design Impacts on Resilience
The following analysis investigates the effect that different design choices not directly related to resilience improvements may have on microgrid resilience. The first alternative explored is the control strategy of the ESS charge. We initially assumed that maintaining the ESS in the fully charged state would maximize resilience of the system. The investigation tests the possible consequence of using the ESS to perform peak shaving to maximize the financial benefits of the microgrid. In our professional experience, a common request of base energy managers is to use an ESS to conduct peak load shaving even though it is rarely justifiable to fund ESS construction based on a net present value calculation of peak energy shaving versus cost of ESS. To maintain resilience against a loss of utility power, the ESS is maintained at no less than 50 percent charge. A design selection using the minimum 50 percent charge results in no impact on resilience. No load shedding occurs during the simulation of 1000 iterations of a two-week loss of utility power.
Investigations of generator fuel supply, ESS capacity, PV sizing, and related microgrid design changes, is presented in [56]. In most scenarios, the diesel fuel supply could be reduced by about one third before degrading the microgrid’s ability to function and meet all critical loads. However, several of the additional scenarios of specific interest are significantly negatively impacted by the proposed design changes. We recommend that base energy managers analyze any proposed design changes from the perspective of resilience prior to implementing said changes. What initially looks like a cost savings may have significant deleterious effects on microgrid resilience.
4.9. Summary of Findings
The above example revealed the initial military microgrid design was not adequate to meet the objective of operating for two weeks in island mode. Refinement of the microgrid design through iterative design changes and simulation resulted in a system that was validated to meet the two-week island mode operation requirement with a high likelihood. The final system design resulted in no mission impact against the design goal of continued operations for a two-week duration following the loss of utility power and minimal mission impact due to equipment failures concurrent with the grid disconnect event.
The method investigates how equipment and infrastructure reliability impact overall system resilience in the face of loss of utility power. We applied the design method to a set of scenarios involving equipment failure that are expected to most commonly occur to determine the mission impact of equipment failure events. The results revealed which potential equipment failures resulted in the highest mission impact. Results from equipment failure analysis indicated that the ESS and PV array required up-sizing to better protect against said failures. Design changes to protect against both the equipment failure scenarios and the the additional scenarios of specific interest could include installing redundant ESS and PV in several locations across the microgrid (likely co-located with the critical loads) and are worth exploring further. The reasons are that the ESS is essential for the temporary storage of energy in order to balance the demand and supply for power during different times of the day and that the PV array is essential for supplying energy if the diesel generators are unavailable.
When considering events with a low likelihood but potentially high impact on , the method helps to identify loss of a generator, or combined loss of any power generation source with other failures, that results in the greatest before up-rating the PV array and ESS. This indicated that additional generation redundancy or up-rating the PV array and ESS (which was pursued) would be an option worth pursuing. Details from the simulation model also provided information on the time dependence of failure and resilience of the microgrid specifically in scenarios where PV is relied upon for all generation capacity. Deliberate attacks can also result in significant impacts, and a scenario of an attack on microgrid components of key facilities, which could be carried out without many resources, can lead to a significant mission impact. Hardening the microgrid components to reduce the likelihood and attractiveness of these targets, or adding redundancy, would benefit the expected mission impact. Natural disasters also indicate the potential for significant mission impact due to the destruction of microgrid components. This further indicates that hardening said components, adding redundancy, and/or distributing generation and ESS resources across the microgrid may lead to improvements in mission impact in these scenarios.
5. Discussion and Future Work
The paper presents a systems engineering modeling and analysis method to design military microgrids resilience in the face of disruptions and equipment failures. The method focuses on minimizing mission impact due to threats to energy security and can be applied in the early design phase of a microgrid when only architectural data are available. Existing microgrids may also benefit from application of the method to assess their resilience and target modification and plans of actions to address any deficiency uncovered.
The method depends on the identification of scenarios, a reasonable approach for low probability, high impact events, and malicious and human-caused events. Scenario generation should not just identify the extreme cases but also more common and routine issues such as equipment failures, degradation of equipment, accidents, and weather events. The probability of certain high impact scenarios, such as deliberate attack, is very difficult to quantify and will likely vary over the lifetime of the system as the threat environment and enemy tactics change. The set of initiating events for some of the high impact scenarios can be relatively common events such as vehicular accidents or tree branches causing damage to distribution equipment. Focusing on one, possibly low-probability scenario, that has suddenly gained attention due to a recent high-profile event or potential threat discovery can result in a lack of attention to more common threats and divert resources away from contingencies or design changes that could benefit resilience against more common threats. Conversely, ignoring additional scenarios of specific interest may result in a worse mission impact to a microgrid in the future.
A decision-maker can use the proposed method to map power loss to mission impact. The assumption is reasonable for many military bases where facilities and their power requirements can be traced to particular missions. A limitation of the example in this article was the assumption of a constant value to over time for each facility for each hour of load shed. due to load shedding in a real microgrid application is likely more complex. For instance, load shedding that occurs in the middle of the night will likely have a lower than that during the day when the facility is in use. As another example, load shedding at a facility where the critical loads are air conditioners may see no until the load is lost for several hours.
This article advises allocating resources towards reducing the and developing potential actions and plans to address events that could impact the mission given both the impact and probability of threats. For instance, power transmission via temporary transmission paths or spare equipment maintained onsite can decrease the recovery time of power and subsequent mission impact. Generation via locally procured small generators or use of temporary facilities could also lessen the potential mission impact in some of the scenarios.
Given the difficulty in defining the probability of certain events, such as deliberate attack, additional analysis and assessment of possible initiation events is warranted. This article identified several potential scenarios that could result in a high mission impact, such as direct attacks of microgrid components that cut power to facilities with a significant mission impact. While we proposed using 2 /year occurrence of such events, additional analysis to quantify the probability of attacks that would cause a high mission impact may improve the results of the method developed in this article to be more realistic and identify potential mitigation strategies. An investigation to explore possible contingency actions to include such scenarios and the effects those action would have on mission impact may also provide useful guidance and examples to facility managers.
We advocate using MDI to quantify for specific loads in a military microgrid because MDI is an indication of a load’s importance to national defense. Other potential quantification methods such as ESAT are available, although none is as widely used in the military and across the federal government as MDI. Several limitations and drawbacks of MDI have been identified in the literature [54]. We suggest that a new method of quantifying a specific load’s contribution to national defense be developed to better represent the mission impact of losing a specific load for a specific amount of time during a specific portion of a scenario (e.g., 14 day grid outage). Such an undertaking will be a significant effort involving all federal agencies involved in national defense.
Linking cost to resilience has intentionally been avoided. Current policies generally tie microgrid upgrades and improvements to efficiency metrics rather than resilience metrics. In the future, it may be useful to quantify and understand the cost of increased resilience. At present, it is most important to develop and highlight the usefulness of a method of quantifying military microgrid resilience.
The method presented here is not appropriate for comparing between bases to prioritize investment of limited resources. is base- and scenario-specific. Future work may investigate how to normalize or similar across multiple bases in a region or globally to better understand the regional or global impact of local events at bases. Future work may investigate a mission engineering approach to prioritizing investment across multiple military bases to support the larger national security mission.
While the illustrative military microgrid analysis demonstrated investigation of specific scenarios of interest to military bases, it did not seek to optimize the microgrid design. Instead, the microgrid design was improved to better support mission critical loads. The process outlined above could be optimized using a linear optimization model or similar.
This work did not investigate the potential benefits and drawbacks of different microgrid types such as an AC microgrid versus a DC microgrid or a hybrid microgrid. Each type of microgrid uses different major components with different reliability values that can impact the . Future work may investigate different microgrid types and how specific types can be more or less resilient for specific facilities based on local conditions.
The case study in this article focuses on a microgrid topology that is not particularly resilient due to the single interconnect between BUS 1 and BUS 2. This topology is similar to that found on many small and medium-sized bases. Some large bases have implemented ring topologies where high-voltage transmission lines circle the base with multiple substations present that are able to feed many distribution lines and can be rapidly reconfigured to route electricity around damaged portions of the microgrid. While a ring topology appears to have superior prerformance to hub-and-spoke and other topologies, this article has not pursued that line of inquiry. Future work could analyze if ring topologies are in fact more resilient to the types of failure scenarios that military microgrids can be expected to encounter.
6. Conclusions
This article presented a systems engineering modeling and analysis method to analyze the resilience of military microgrids in terms of the impact on mission achievement. We focus on resilience in the context of a military microgrid that must continue operations for a desired duration (such as two weeks) following disconnection from the utility grid. The model differs from existing approaches to analyzing resilience that either seek to minimize total cost, maximize renewable energy sources, or treat all electrical load as interchangable. Instead, we link electrical demand to mission accomplishment and then seek to minimize the mission impact due to disruptions caused by loss of utility power, equipment failures, and malicious attacks. The expected electrical disruption mission impact () metric introduced in this article quantifies the system resilience in terms of the impact to the mission performed by a facility when it loses power. The model is not intended to predict actual failures but to provide information on failures and how they would impact the mission accomplishment at the military base so that a decision maker can make design and investment decisions on how to best address potential resilience issues.
An example using a representative microgrid similar to currently deployed military microgrids demonstrated how the method can be applied to assess different microgrid designs and configurations in terms of resilience. The example serves as a template for microgrid designers to follow in assessing their own microgrids.
Author Contributions
Conceptualization, C.J.P. and D.L.V.B.; methodology, C.J.P.; software, C.J.P.; validation, C.J.P.; formal analysis, C.J.P.; investigation, C.J.P. and D.L.V.B.; resources, G.O. and D.L.V.B.; data curation, C.J.P.; writing—original draft preparation, C.J.P. and D.L.V.B.; writing—review and editing, D.L.V.B., R.E.G. and G.O.; visualization, C.J.P. and D.L.V.B.; supervision, D.L.V.B. and R.E.G.; project administration, G.O. and D.L.V.B.; funding acquisition, G.O. and D.L.V.B. All authors have read and agreed to the published version of the manuscript.
Funding
Naval Facilities Engineering and Expeditionary Warfare Center Command (NAVFAC EXWC) Navy Shore Energy Technology Transition and Integration (NSETTI) Program.
Institutional Review Board Statement
Not applicable.
Informed Consent Statement
Not applicable.
Data Availability Statement
Source data and code are available upon request from the authors.
Conflicts of Interest
The authors declare no conflict of interest. The funders had no role in the design of the study; in the collection, analyses, or interpretation of data; in the writing of the manuscript; or in the decision to publish the results.
References
- Department of Defense. Department of Defense 2016 Operational Energy Strategy; Technical Report; Office of the Assistant Secretary of Defense for Energy, Installations and Environment: Washington, DC, USA, 2015.
- Murugesan, S.; Murali, V.; Daniel, S.A. Hybrid Analyzing Technique for Active Islanding Detection Based on d-Axis Current Injection. IEEE Syst. J. 2018, 12, 3608–3617. [Google Scholar] [CrossRef]
- Hirsch, A.; Parag, Y.; Guerrero, J. Microgrids: A review of technologies, key drivers, and outstanding issues. Renew. Sustain. Energy Rev. 2018, 90, 402–411. [Google Scholar] [CrossRef]
- DER-CAM+ User Manual; Technical Report; Lawrence Berkeley National Laboratory (LBNL): Berkeley, CA, USA, 2018.
- Petri, C. Assessing the Operational Resilience of Electrical Distribution Systems. Master’s Thesis, Naval Postgraduate School, Monterey, CA, USA, 2017. [Google Scholar]
- Homer Pro. Vol. 3.12.5. 2019. Available online: https://www.homerenergy.com/products/pro/index.html (accessed on 10 November 2019).
- Hathaway, T. Putting a Dollar Value on Energy Resiliency for the U.S. Military. 2019. Available online: https://microgridknowledge.com/value-energy-resiliency-military/ (accessed on 10 November 2019).
- Rusco, F.; Lepore, B.J. DoD Renewable Energy Projects: Improved Guidance Needed for Analyzing and Documenting Costs and Benefits; Technical Report; HT Media Ltd.: Washington, DC, USA, 2016. [Google Scholar]
- 3 Pillars of Energy Security (Reliability, Resiliency, & Efficiency); Technical Report; Naval Facilities Engineering Command (NAVFAC): Washington, DC, USA, 2017.
- Utilities Infrastructure Management Manual; Technical Report; Naval Facilities Engineering Command (NAVFAC): Washington, DC, USA, 2017.
- Al Antelman, R.; Miller, A. Mission Dependency Index Validation Report; Technical Report; Naval Facilities Engineering Service Center: Port Hueneme, CA, USA, 2002. [Google Scholar]
- Smith, C.W. Mission Dependency Index of Air Force Built Infrastructure: Knowledge Discovery with Machine Learning. Master’s Thesis, Air Force Institute of Technology, Wright-Patterson Air Force Base, OH, USA, 2016. [Google Scholar]
- Short, T.A. Electric Power Distribution Handbook; CRC Press: Boca Raton, FL, USA, 2004. [Google Scholar]
- Guerrero, J.M.; Chandorkar, M.; Lee, T.L.; Loh, P.C. Advanced control architectures for intelligent microgrids—Part I: Decentralized and hierarchical control. IEEE Trans. Ind. Electron. 2012, 60, 1254–1262. [Google Scholar] [CrossRef] [Green Version]
- Battis, J.; Kurtovich, M.; O’Donnell, A. Security and Resilience for California Electric Distribution Infrastructure: Regulatory and Industry Response to SB 699; Technical Report; California Public Utilities Commission Safety and Enforcement Division Risk Assessment and Safety Advisory Section: San Francisco, CA, USA, 2018.
- Physical Vulnerability of Electric Systems to Natural Disasters and Sabotage; Technical Report; Office of Technology Assessment: Washington, DC, USA, 1990.
- Griffith, T.E., Jr. Strategic Attack of National Electrical Systems. Master’s Thesis, The School of Advanced Airpower Studies, Maxwell Air Force Base, Montgomery, AL, USA, 1994. Accession Number: ADA425504. [Google Scholar]
- Security Guideline for the Electricity Sector: Physical Security; Technical Report; North American Electric Reliability Corporation (NERC): Atlanta, GA, USA, 2012.
- Savena, M. Energy Supply for Mission Critical Facilities: Tiered Requirements and Capabilities of Supporting Energy Systems; Presented at Energy Planning for Resilient Military Installations Information Sharing Session: Washington, DC, USA, 2017. [Google Scholar]
- Xu, X.; Xue, F.; Wang, X.; Lu, S.; Jiang, L.; Gao, C. Upgrading Conventional Distribution Networks by Actively Planning Distributed Generation Based on Virtual Microgrids. IEEE Syst. J. 2020, 1–12. [Google Scholar] [CrossRef]
- Keesee, C.W. Realizing Energy Security on a DoD Installation Using Photovoltaics with a Battery Energy Storage System. Master’s Thesis, Naval Posgraduate School, Monterey, CA, USA, 2018. [Google Scholar]
- Paniagua Sánchez-Mateos, J. Reliability-Constrained Microgrid Design. Master’s Thesis, KTH Royal Institute of Technology, Stocholm, Sweden, 2016. [Google Scholar]
- Salmeron, J.; Wood, K.; Baldick, R. Optimizing Electric Grid Design under Asymmetric Threat (III); Technical Report; Naval Postgraduate School Monterey CA Dept of Operations Research: Monterey, CA, USA, 2005. [Google Scholar]
- Ulmer, N.A. Optimizing Microgrid Architecture on Department of Defense Installations. Master’s Thesis, Naval Posgraduate School, Monterey, CA, USA, 2014. [Google Scholar]
- Bahramirad, S.; Reder, W.; Khodaei, A. Reliability-constrained optimal sizing of energy storage system in a microgrid. IEEE Trans. Smart Grid 2012, 3, 2056–2062. [Google Scholar] [CrossRef]
- Shen, Y.; Gu, C.; Ma, Z.; Yang, X.; Zhao, P. A Two-Stage Resilience Enhancement for Distribution Systems Under Hurricane Attacks. IEEE Syst. J. 2020, 1–9. [Google Scholar] [CrossRef]
- Bessani, M.; Massignan, J.A.D.; Fanucchi, R.Z.; Camillo, M.H.M.; London, J.B.A.; Delbem, A.C.B.; Maciel, C.D. Probabilistic Assessment of Power Distribution Systems Resilience Under Extreme Weather. IEEE Syst. J. 2019, 13, 1747–1756. [Google Scholar] [CrossRef]
- Panteli, M.; Mancarella, P. Modeling and Evaluating the Resilience of Critical Electrical Power Infrastructure to Extreme Weather Events. IEEE Syst. J. 2017, 11, 1733–1742. [Google Scholar] [CrossRef]
- Khederzadeh, M.; Zandi, S. Enhancement of Distribution System Restoration Capability in Single/Multiple Faults by Using Microgrids as a Resiliency Resource. IEEE Syst. J. 2019, 13, 1796–1803. [Google Scholar] [CrossRef]
- Confrey, J.; Etemadi, A.H.; Stuban, S.M.F.; Eveleigh, T.J. Energy Storage Systems Architecture Optimization for Grid Resilience With High Penetration of Distributed Photovoltaic Generation. IEEE Syst. J. 2020, 14, 1135–1146. [Google Scholar] [CrossRef]
- Microgrid Design Guide; Technical Report; Naval Facilities Engineering Command (NAVFAC): Washington, DC, USA, 2016.
- Performing Energy Security Assessments—A How-To Guide for Federal Facility Managers; Technical Report; Federal Energy Management Program, Department of Energy, n.d.: Washington, DC, USA, 2006.
- Karvetski, C.W.; Lambert, J.H.; Linkov, I. Scenario and multiple criteria decision analysis for energy and environmental security of military and industrial installations. Integr. Environ. Assess. Manag. 2011, 7, 228–236. [Google Scholar] [CrossRef]
- Buede, D.M.; Miller, W.D. The Engineering Design of Systems: Models and Methods; John Wiley & Sons: Hoboken, NJ, USA, 2016. [Google Scholar]
- Hosseini, S.; Barker, K.; Ramirez-Marquez, J.E. A review of definitions and measures of system resilience. Reliab. Eng. Syst. Saf. 2016, 145, 47–61. [Google Scholar] [CrossRef]
- Installation Energy Management. DoD Instruction 4170.11 Change 1. 2016. Available online: https://www.acq.osd.mil/dodsc/library/dodi-4170-11-installation.pdf (accessed on 10 November 2019).
- U.S. Code Title 10. ARMED FORCES Subtitle A. General Military Law Part I. ORGANIZATION AND GENERAL MILITARY POWERS Chapter 1. DEFINITIONS Section 101. Definitions. (e)Facilities and Operations. (6)Energy resilience. Available online: https://www.govinfo.gov/app/details/USCODE-2011-title10/USCODE-2011-title10-subtitleA-partI-chap1-sec101/summary (accessed on 3 January 2012).
- Madni, A.M.; Jackson, S. Towards a Conceptual Framework for Resilience Engineering. IEEE Syst. J. 2009, 3, 181–191. [Google Scholar] [CrossRef]
- Hollnagel, E.; Woods, D.D.; Leveson, N. Resilience Engineering: Concepts and Precepts; Ashgate Publishing, Ltd.: Farnham, UK, 2006. [Google Scholar]
- Woods, D.D. Four concepts for resilience and the implications for the future of resilience engineering. Reliab. Eng. Syst. Saf. 2015, 141, 5–9. [Google Scholar] [CrossRef]
- Specking, E.; Parnell, G.S.; Pohl, E.; Buchanan, R. Engineering Resilient Systems: Achieving Stakeholder Value through Design Principles and System Operations. IEEE Trans. Eng. Manag. 2021, 1–12. [Google Scholar] [CrossRef]
- Small, C.; Parnell, G.; Pohl, E.; Goerger, S.R.; Cottam, B.; Specking, E.; Wade, Z. Engineered resilient systems with value focused thinking. In INCOSE International Symposium; Wiley Online Library: Hoboken, NJ, USA, 2017; Volume 27, pp. 1371–1385. [Google Scholar]
- Buchanan, R.K.; Goerger, S.R.; Rinaudo, C.H.; Parnell, G.; Ross, A.; Sitterle, V. Resilience in engineered resilient systems. J. Def. Model. Simul. 2020, 17, 435–446. [Google Scholar] [CrossRef]
- Wade, Z.; Goerger, S.; Parnell, G.S.; Pohl, E.; Specking, E. Incorporating resilience in an integrated analysis of alternatives. Mil. Oper. Res. 2019, 24, 5–16. [Google Scholar]
- Specking, E.; Cottam, B.; Parnell, G.; Pohl, E.; Cilli, M.; Buchanan, R.; Wade, Z.; Small, C. Assessing engineering resilience for systems with multiple performance measures. Risk Anal. 2019, 39, 1899–1912. [Google Scholar] [CrossRef]
- Ferris, T.L. A resilience measure to guide system design and management. IEEE Syst. J. 2019, 13, 3708–3715. [Google Scholar] [CrossRef] [Green Version]
- Ferris, T.L. Measurement of Resilience and the Time Value of Resilience. IEEE Syst. J. 2020, 15, 1578–1585. [Google Scholar] [CrossRef]
- Unified Facilities Criteria (UFC): Engine-Driven Generator Systems for Prime and Standby Power Applications; Technical Report; Naval Facilities Engineering Command (NAVFAC): Washington, DC, USA, 2014.
- Installation Energy and Water Security Policy. 2020. Available online: https://www.asaie.army.mil/Public/ES/doc/ARN21644_AD2020-03_Web_Final.pdf (accessed on 13 September 2021).
- Coglianese, V.G. Resilience Symposium Report; Technical Report; Marine Corps Base Hawaii: Oahu, HI, USA, 2019. [Google Scholar]
- Rickerson, W.; Gillis, J.; Bulkele, M. The Value of Resilience for Distributed Energy Resources: An Overview of Current Analytical Practices; Technical Report; National Association of Regulatory Utility Commissioners: Golden, CO, USA, 2019. [Google Scholar]
- Giraldez, J.; Booth, S.; Anderson, K.; Massey, K. Valuing Energy Security: Customer Damage Function Methodology and Case Studies at DoD Installations; Technical Report; U.S. Department of Energy Office of Scientific and Technical Information: Golden, CO, USA, 2012.
- Savena, M.; Judson, N.; Pina, A. The Cost of Energy Security and Resilience; Presented at Federal Utility Partnership Working Group Seminar: Ontario, CA, USA, 2017.
- Kujawski, E.; Miller, G. The mission dependency index: Fallacies and misuses. In INCOSE International Symposium; Wiley Online Library: Hoboken, NJ, USA, 2009; Volume 19, pp. 1565–1580. [Google Scholar]
- Call, S. The Navy’s Energy Mission Integration Group (EMIG) Overview. 2019. Available online: https://www.energy.gov/sites/prod/files/2019/05/f62/17-fupwg-spring-2019-call.pdf (accessed on 10 November 2019).
- Peterson, C.J. Systems Architecture Design and Validation Methods for Microgrid Systems. Master’s Thesis, Naval Postgraduate School, Monterey, CA, USA, 2019. [Google Scholar]
- Kain, A.; Van Bossuyt, D.L.; Pollman, A. Investigation of Nanogrids for Improved Navy Installation Energy Resilience. Appl. Sci. 2021, 11, 4298. [Google Scholar] [CrossRef]
- Herster-Dudley, M.R. Building Resilience within DOD Microgrids by Considering Human Factors in Recovery Procedures. Master’s Thesis, Naval Postgraduate School, Monterey, CA, USA, 2021. [Google Scholar]
- Hildebrand, J.P. Estimating the Life Cycle Cost of Microgrid Resilience. Master’s Thesis, Naval Postgraduate School, Monterey, CA, USA, 2020. [Google Scholar]
- Beaton, D.T. Testing Whether Distributed Energy Storage Results in Greater Resilience of Microgrids. Master’s Thesis, Naval Postgraduate School, Monterey, CA, USA, 2021. [Google Scholar]
- Bolen, C.D.; Chu, V.; Dang, A.Q.; Kim, P.T.; Proctor, C.; Shideler, B.R. Integrating Power-Flow, Resilience, and Cost Models for Naval Installation Microgrids; Technical Report; Naval Postgraduate School: Monterey, CA, USA, 2021. [Google Scholar]
- Murty, P. Power Systems Analysis; Butterworth-Heinemann: Oxford, UK, 2017. [Google Scholar]
- Keeney, R.L.; Raiffa, H.; Meyer, R.F. Decisions with Multiple Objectives: Preferences and Value Trade-Offs; Cambridge University Press: Cambridge, UK, 1993. [Google Scholar]
- Ravindra, M.; Banon, H. Methods for External Event Screening Quantification: Risk Methods Integration and Evaluation Program (RMIEP) Methods Development; Technical Report NUREG/CR-4839, SAND87-7156; U.S. Nuclear Regulatory Commission and Sandia National Labs: Albuquerque, NM, USA, 1992.
- Murray, R.; Prassinos, P.; Savy, J.; Bernreuter, D.; Cummings, G. Individual Plant Examinations for External Events: Review Plan and Evaluation Criteria; Technical Report NUREG/CR-5260; U.S. Nuclear Regulatory Commission and Lawrence Livermore National Lab: San Francisco, CA, USA, 1989.
- Deru, M.; Field, K.; Studer, D.; Benne, K.; Griffith, B.; Torcellini, P.; Liu, B.; Halverson, M.; Winiarski, D.; Rosenberg, M.; et al. U.S. Department of Energy Commercial Reference Building Models of the National Building Stock; Technical Report; National Renewable Energy Laboratory: Golden, CO, USA, 2011. [CrossRef] [Green Version]
- Horton, W.; Goldberg, S.; Volkman, C. The failure rates of overhead distribution system components. In Proceedings of the 1991 IEEE Power Engineering Society Transmission and Distribution Conference, Dallas, TX, USA, 22–27 September 1991; pp. 713–717. [Google Scholar]
- IEEE Recommended Practice for the Design of Reliable Industrial and Commercial Power Systems. Available online: https://ieeexplore.ieee.org/document/4040357 (accessed on 15 September 2021).
- Brown, R.E. Electric Power Distribution Reliability, 2nd ed.; CRC Press: Boca Raton, FL, USA, 2008. [Google Scholar]
- Chatzinikolaou, E.; Rogers, D.J. A comparison of grid-connected battery energy storage system designs. IEEE Trans. Power Electron. 2016, 32, 6913–6923. [Google Scholar] [CrossRef]
- Hillier, F.S. Introduction to Operations Research; Tata McGraw-Hill Education: New York City, NY, USA, 2012. [Google Scholar]
- Wilcox, S. National Solar Radiation Database 1991–2010 Update: User’s Manual. Available online: https://www.nrel.gov/docs/fy12osti/54824.pdf (accessed on 15 September 2021).
Figure 1.
Baseline Example Microgrid System One-Line Diagram.

Figure 2.
ESS Storage and Generator Fuel Storage in 72-H Generator Failure Scenario. Note that the Generators are Slaved to One Another and Provide Identical Output.
Figure 2.
ESS Storage and Generator Fuel Storage in 72-H Generator Failure Scenario. Note that the Generators are Slaved to One Another and Provide Identical Output.

Figure 3.
ESS Storage during 72-H Loss of the PV Array and the Connection Between the BUS1 BUS2 Feeders.
Figure 3.
ESS Storage during 72-H Loss of the PV Array and the Connection Between the BUS1 BUS2 Feeders.


Table 1.
Summary of Facilities within Baseline Microgrid Model. Adapted from [66].
Table 1.
Summary of Facilities within Baseline Microgrid Model. Adapted from [66].
| Load | Facility Type | Floor Area () | Avg CL (kW) | Max CL (kW) | |
|---|---|---|---|---|---|
| EP1 | Small Office | 5500 | 2.8 | 5.8 | 10 |
| EP3 | Small Office | 5500 | 2.8 | 5.8 | 15 |
| EP4 | Medium Office | 53,628 | 32.3 | 71 | 61 |
| EP5 | Large Office | 498,588 | 267 | 523 | 93 |
| EP6 | Warehouse | 52,045 | 10.9 | 31 | 74 |
| Total | 315.8 | 636.6 | 253 |
Table 2.
Simulation Model Inputs and Outputs.
| Input | Output |
|---|---|
| Generator size | Power flow |
| Generator fuel storage, resupply probability and timing | Generator fuel level |
| ESS storage and maximum output | ESS state of charge |
| PV array area and efficiency | Mission impact |
| Map of load shed to mission impact | |
| Hourly facility loads | |
| Functional state of each component (optional) | |
| Failed component and recovery time (optional) | |
| Solar incidence |
Table 3.
Due to Equipment Failures with Probability of Failure on a Yearly Basis, and with MTTR (Hrs).
Table 3.
Due to Equipment Failures with Probability of Failure on a Yearly Basis, and with MTTR (Hrs).
| Failures of Connections Between Feeders, and Loads and Equipment | ||||
| Node 1 → Node 2 | Pr(Failure) | MTTR | Mean | SD |
| BUS1 → BUS2 | 3.980 | 5 | 7.1 | 89.2 |
| BUS1 → EP1 | 2.230 | 5 | 1680 | 0 |
| BUS1 → EP5 | 2.592 | 6 | 15,624 | 0 |
| BUS1 → EP6 | 2.955 | 5 | 12,432 | 0 |
| BUS1 → GEN1 | 1.795 | 6 | 4181.6 | 3210.2 |
| BUS1 → GEN2 | 1.795 | 6 | 4243.5 | 3218.5 |
| BUS2 → ESS | 1.141 | 19 | 820.2 | 546.4 |
| BUS2 → EP3 | 2.773 | 5 | 2520 | 0 |
| BUS2 → EP4 | 3.860 | 5 | 10,248 | 0 |
| BUS2 → PV | 1.163 | 19 | 0 | 0 |
| Failures of Power Generation and Storage Equipment | ||||
| Component | Pr(Failure) | MTTR | Mean | SD |
| GEN1 | 3.763 | 18 | 4181.6 | 3210.2 |
| GEN2 | 3.763 | 18 | 4243.5 | 3218.5 |
| ESS | 7.592 | 84 | 820.2 | 546.4 |
| PV | 1.533 | 24 | 0 | 0 |
| Failures of Multiple Equipment and Links | ||||
| Component(s) | Pr(Failure) | MTTR | Mean | SD |
| GEN1 & GEN2 | 7.526 | 36 | 26,382.3 | 4732.6 |
| GEN1 & PV | 5.768 | 42 | 13,031.8 | 1203.8 |
| GEN1 & ESS | 2.856 | 102 | 8009.1 | 3231.6 |
| ESS & PV | 7.745 | 108 | 3316.9 | 259.9 |
Publisher’s Note: MDPI stays neutral with regard to jurisdictional claims in published maps and institutional affiliations. |
© 2021 by the authors. Licensee MDPI, Basel, Switzerland. This article is an open access article distributed under the terms and conditions of the Creative Commons Attribution (CC BY) license (https://creativecommons.org/licenses/by/4.0/).
Share and Cite
MDPI and ACS Style
Peterson, C.J.; Van Bossuyt, D.L.; Giachetti, R.E.; Oriti, G. Analyzing Mission Impact of Military Installations Microgrid for Resilience. Systems 2021, 9, 69. https://doi.org/10.3390/systems9030069
AMA Style
Peterson CJ, Van Bossuyt DL, Giachetti RE, Oriti G. Analyzing Mission Impact of Military Installations Microgrid for Resilience. Systems. 2021; 9(3):69. https://doi.org/10.3390/systems9030069
Chicago/Turabian StylePeterson, Christopher J., Douglas L. Van Bossuyt, Ronald E. Giachetti, and Giovanna Oriti. 2021. "Analyzing Mission Impact of Military Installations Microgrid for Resilience" Systems 9, no. 3: 69. https://doi.org/10.3390/systems9030069
Note that from the first issue of 2016, this journal uses article numbers instead of page numbers. See further details here.