Article

Influence of Reaction pH towards the Physicochemical Characteristics of Phosphorylated Polyvinyl Alcohol-Aluminum Phosphate Nanocomposite

by
Asmalina Mohamed Saat
1,2,*,
Md Salim Kamil
1,
Nor Aliya Hamizi
2,3,*,
Irfan Anjum Badruddin
4,5,
Nadiah Ghazali
2,3,
Suresh Sagadevan
3,
Sarfaraz Kamangar
5,
T. M. Yunus Khan
5 and
Mohd Rafie Johan
3
1
Malaysian Institute of Marine Engineering Technology, Universiti Kuala Lumpur, Lumut 32200, Malaysia
2
Nanomaterials Engineering Research Group, Advanced Materials Research Laboratory, Department of Mechanical Engineering, Universiti Malaya, Kuala Lumpur 50603, Malaysia
3
Nanotechnology & Catalysis Research Centre, University of Malaya, Kuala Lumpur 50603, Malaysia
4
Research Center for Advanced Materials Science (RCAMS), King Khalid University, P.O. Box 9004, Abha 61413, Saudi Arabia
5
Mechanical Engineering Department, College of Engineering, King Khalid University, Abha 61413, Saudi Arabia
*
Authors to whom correspondence should be addressed.
Coatings 2021, 11(9), 1105; https://doi.org/10.3390/coatings11091105
Submission received: 27 July 2021 / Revised: 25 August 2021 / Accepted: 2 September 2021 / Published: 14 September 2021

Abstract

:
The present study deals with the formation of a phosphorylated polyvinyl alcohol (PPVA)-Aluminum Phosphate (AlPO4) nanocomposite, changing the pH solution under the two-step process involving the phosphorylation of polyvinyl alcohol (PVA) followed by the conjugation with AlPO4. The composite was formed by varying the pH of the solution in the range of 7–12 and the reflected changes in the product’s morphology, crystallinity, surface nature, thermal stability, etc. were recorded using FESEM, XRD, FTIR, UV-Vis spectroscopy, TGA, etc. From the analysis, it was found that the particles formed with two different sizes of the probed pH, and at pH 10 they were homogeneously distributed. In addition, the morphology of the PPVA-AlPO4 composite also seems to be altered with respect to the pH and this is due to the differences in the amount of H+ and OH anions. Thus, from the overall analysis, it can be indicated that pH 10 needs to be maintained for the formation of a spherical shape and uniformly distributed PPVA-AlPO4 nanocomposite.

1. Introduction

Polyvinyl alcohol (PVA) is an industrially applied polymer and offers the characteristics of high hydrophilicity along with good chemical and thermal stabilities. Further, fine-tuning the intrinsic properties, it has been subjected to phosphorylation which enhances the polymer dispersion and stability even in harsh and marine environments. As an example, the composite formed from phosphorylated polyvinyl alcohol (PPVA) was found to contain better flame-retarding and anti-corrosion properties because of the generation of a second 3D network by the newly incorporated phosphate groups following the inter-and intra-molecular hydrogen bonding [1]. Moreover, other similar studies on PPVA composites (PPVA-graphene aerogel, PPVA-polyaniline) found significant aqueous and thermal stabilities, in addition to the mechanical resistance due to the newly involved self-assembling feature [2,3]. However, other distinctively direct phosphate coatings were also investigated to enhance the internal properties, e.g., aluminum phosphate (AlPO4), a type of naturally occurring compound with its low density, high melting point, and hardness when used in non-stoichiometric amounts, offers superior oxidation resistances and thermal degradations (over 1000 °C) [2]. This direct phosphate coating material allows for the formation of compatible thin films of high bonding strength even at low temperatures, where the coated films protect the sensitive surfaces from undergoing degradation in extreme environmental conditions [3]. Alaoui et al. explored for the first time the unique property of AlPO4 as an active corrosion inhibitor having the improved efficiency of more than 84% (at 0.01 M AlPO4 in 0.33 M H3PO4) and thereby paving a path for the usage of AlPO4 as an oxide-resistance platform [4,5]. PPVA with AlPO4 was also reported to demonstrate good corrosion inhibition performance on steel surfaces [6].
Recently, PPVA-AlPO4 was also reported as superior corrosion protection properties due to the formation of the coral reef-like structure [7]. The synthesis of nanocomposite with PVA leads to challenges in tailoring physicochemical properties. Systematic synthesis methodologies are needed to solve problems related to interfacial interaction, structural complexity, uniform dispersion, and multifunctionalities [8]. Various techniques were employed to synthesize inorganic materials by soft chemical methods [9], including precipitation, hydrothermal methods, sol–gel, high temperature methods [10,11], and solid-state synthesis. The precipitation method was widely used because of its advantages, and inorganic materials with high purity can also be obtained at low temperatures. Therefore, this method is both environmentally friendly and cost-effective [9].
The hybrid composite formed by the combination of PPVA and AlPO4 has a better distribution of particles and the associated improvement in the electrochemical stability because of the coupling of the pendant PO43− group in PPVA with that of the PO43−, a group of AlPO4 favoring strong bond formation [6]. Moreover, the degradation parameters of PPVA-AlPO4 composite, e.g., electrochemical, aqueous, and thermal stabilities, are influenced by the morphology of AlPO4, which depends on the pH solution applied during the formation of AlPO4 particles. Since the solution at pH of 10, 11, and 12 produces the AlPO4 morphology to be varied from nanoparticles, nanorods, to nanowires, it is highly necessary to investigate the effect of pH on the formation of PPVA-AlPO4 composite [12]. Therefore, in the present study, we have investigated the effects of varied reaction pH towards the structural, thermal, and morphological characteristics of the PPVA-AlPO4 composite.

2. Experimental

2.1. Materials

All the chemicals used in this work were of analytical grade and used as such without further purification. Polyvinyl alcohol (PVA), phosphoric acid (H3PO4), aluminum nitrate (Al (NO3)3), aluminum hydroxide Al (OH)3, potassium hydroxide (KOH), and methanol (CH3OH) were purchased from R & M Chemicals, Malaysia and used without any further modification.

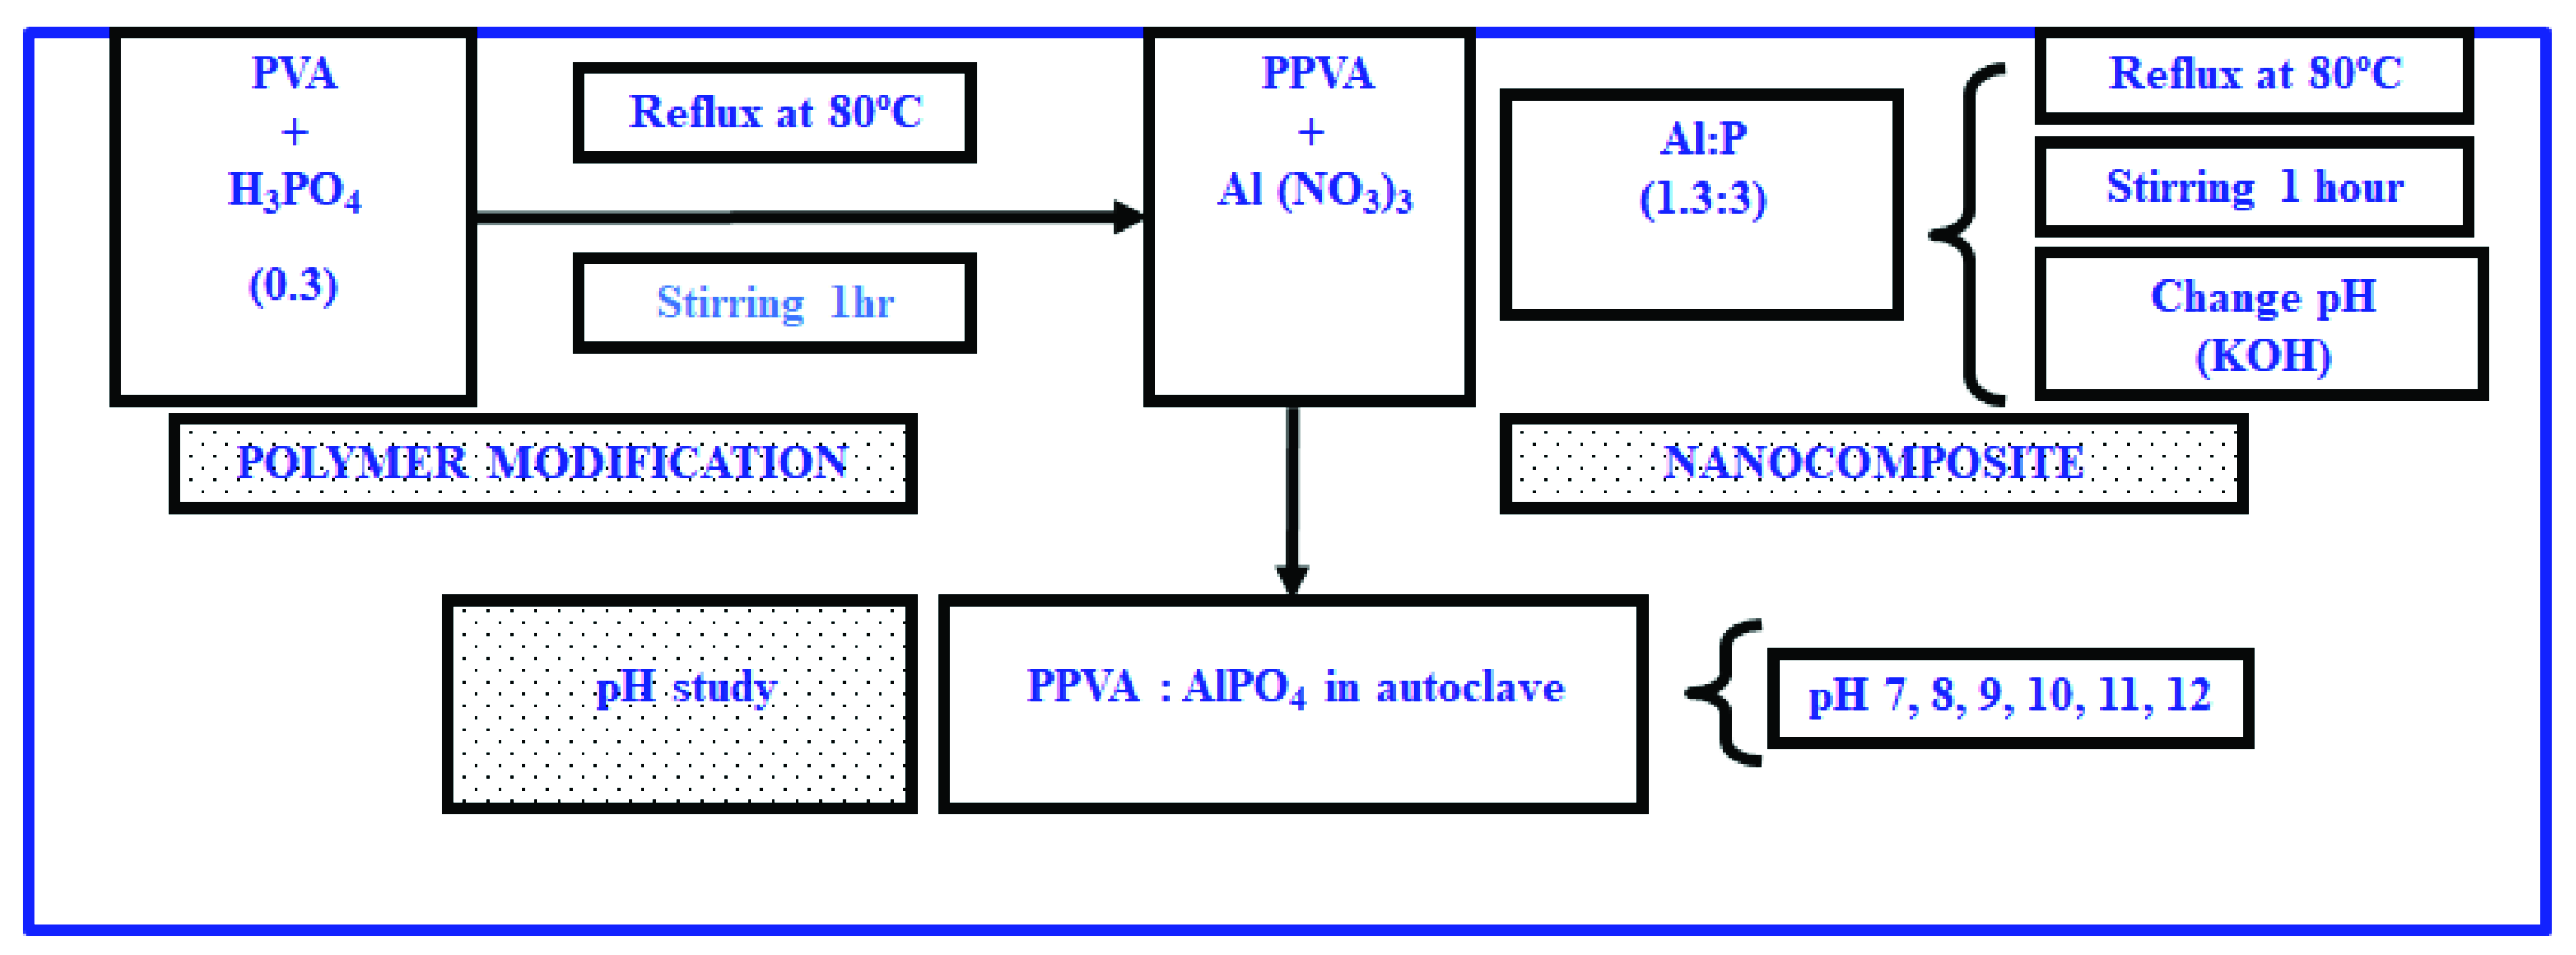
2.2. Synthesis of PPVA-AlPO4

The formation of PPVA-AlPO4 composite involves two steps, namely (1) modification of PVA polymer with phosphoric acid to form PPVA, and (2) in situ or co-precipitation of AlPO4 with that of PPVA to generate the composite. The surface modification of PVA to form PPVA occurs through the replacement of -OH groups of PVA by the phosphate groups of phosphoric acid. Briefly, about 6.6 g of PVA, deionized water, and H3PO4 were mixed in a three-necked round bottom flask and heated under refluxing conditions, with stirring at a rate of 120 rpm in an inert atmosphere. When the temperature reached 90 °C, PVA started melting in the solution mixture, and this heating and stirring was maintained for another 1 h, followed by cooling at room temperature. After the cooling process, the product was transferred to a cast-ing plate and left to dry for another 3 days at room temperature to form a film. In the second step, the formation of PPVA was mixed with aluminum nitrate in the stoichio-metric ratio of 1.3:3, at the temperature of 90 °C, and stirred under an inert atmosphere for 1 h. At this stage, the reaction pH was varied in the range of 7–12 to observe the influence of AlPO4 morphology towards the formation of PPVA-AlPO4 composite, where the product formed was left to dry at room temperature. A flowchart of the synthesis and characterization of PPVA-AlPO4 nanocomposites is shown in Figure 1. Visual observation of the as-prepared and heat-treated samples at 120 °C for various pH values are tabulated in Table 1.

2.3. Instrumental Analysis

The powder X-ray diffraction (XRD) analysis on Panalytical Empyrean diffractometer UK) with Cu Kα radiation (λ = 1.54060 Å) in the 2θ angle of 20° to 80° was used for the determination of structural properties of PPVA-AlPO4 composite. To assess the nature of thermal stability of the composite, thermogravimetric analysis (TGA) and simultaneous differential thermal analysis (SDTA) were applied, and for that, a Mettler Toledo TGA/SDTA851 instrument (Switzerland) was used to heat the samples in the temperature range of 25–1000 °C (heating rate of 10 °C/min). Fourier transform infrared (FTIR) spectroscopy for the surface chemical properties of the composite in the wavenumber range 4000–400 cm−1 (resolution of 4 cm−1) was applied using a Perkin Elmer System 2000, UK). The optical studies of the composite were performed using a Cary 50 UV-Visible spectrophotometer (USA) with a 3-mm quartz cell in the wavelength range of 200–900 nm and at a scan speed of 60 nm/min. For the investigation of morphological changes due to the variation of pH, the field emission scanning electron microscope (FESEM) Jeol JEM-2100F (Japan) was used.

3. Results and Discussion

3.1. Thermal Analysis

Figure 2 shows the thermal analysis of PPVA-AlPO4 composite formed with different pH values (7–12) and from the figure, the SDTA traces indicate the broad endothermic peak in the temperature range of 30–250 °C. We observed weight losses at four different reaction stages. (1) The first stage of weight loss is due to the elimination of water/moisture from the crystals around 120 °C, and a similar stage of loss around 120–260 °C is due to the elimination of water coordinated with that of AlPO4. However, for the sample formed with a reaction pH at 10, the metal coordinated water elimination peak is observed at a temperature higher than that of 280 °C, thereby suggesting the occurrence of maximum interaction between PPVA and Al metal. Moreover, this sample analysis indicates that only limited water is available for the elimination, in addition to the occurrence of dehydration within this range to produce an endothermic effect with a possible phase transformation. (2) The second stage of weight loss occurring in the temperature range of 260–480 °C can be linked to the spontaneous degradation of PPVA and the subsequent elimination of low-weight organic compounds. The composite samples formed from varied pH are showing different temperature peaks, i.e., the samples at pH 10, 11, and 12 are showing the exothermic peak at 280 °C, while the pH at 7, 8, and 9 samples have a broad peak at lower than 250 °C temperature. (3) The third degradation stage is occurring in the temperature range of 450–700 °C for samples formed with pH at 7, 8, and 9, while 480–720 °C for the samples with pH at 10 and 11, and 480–760 °C for the sample formed of pH 12. In addition, another broad less intense endothermic peak in the temperature range of 400–460 °C was observed because of the degradation of PPVA that results in the breakage of the carbon backbone. The same peak, however, became more intense in the case of a sample at pH 12. Further, in the temperature range of 400–1000 °C, there was no occurrence of dehydration, but the phase transformation seems to have existed as shown in SDTA. Table 1 shows the comparison of changes occurring in the AlPO4 crystal system along with the temperature range of 400–460 °C [13], and also at other temperature regions of 680, 670, and 770 °C. (4) The occurrence of final weight loss is observed in the temperature region of 700–1000 °C and can be attributed to the total decomposition of PPVA-AlPO4 composite. Moreover, the weight residues of about 53, 56, 57, 59, 58, and 52 wt% are noted for the samples prepared with pH 7, 8, 9, 10, 11, and 12, respectively. The analysis of results indicated that the weight loss residue is increased for the solution pH up to 10, and after that they started decreasing to reach the minimum value nearer to pH 7. However, the highest weight loss (59%) was observed for the sample formed at pH 10, indicating the occurrence of maximum interaction between PPVA and AlPO4. In addition, we observed an exothermic peak at 770 °C for the sample formed at pH 12 and this can be linked to the phase transformation and completion of AlPO4 crystallization [14].
The comparison of TGA/SDTA data shown in Table 2 indicates that the maximum interaction between PPVA and AlPO4 occurred at pH 10, resulting in the formation of maximum char. Burrell et al. (2001) reported the pH dependency of Al−OH and Al−PO4 bonding that is reflected in the precipitation [15]. This analysis is in good agreement with our study results, where the observation of the highest weight residue (59%) and lowest water content (21% in the first stage) indicate the existence of maximum bonding of Al-PO4 at pH 10.

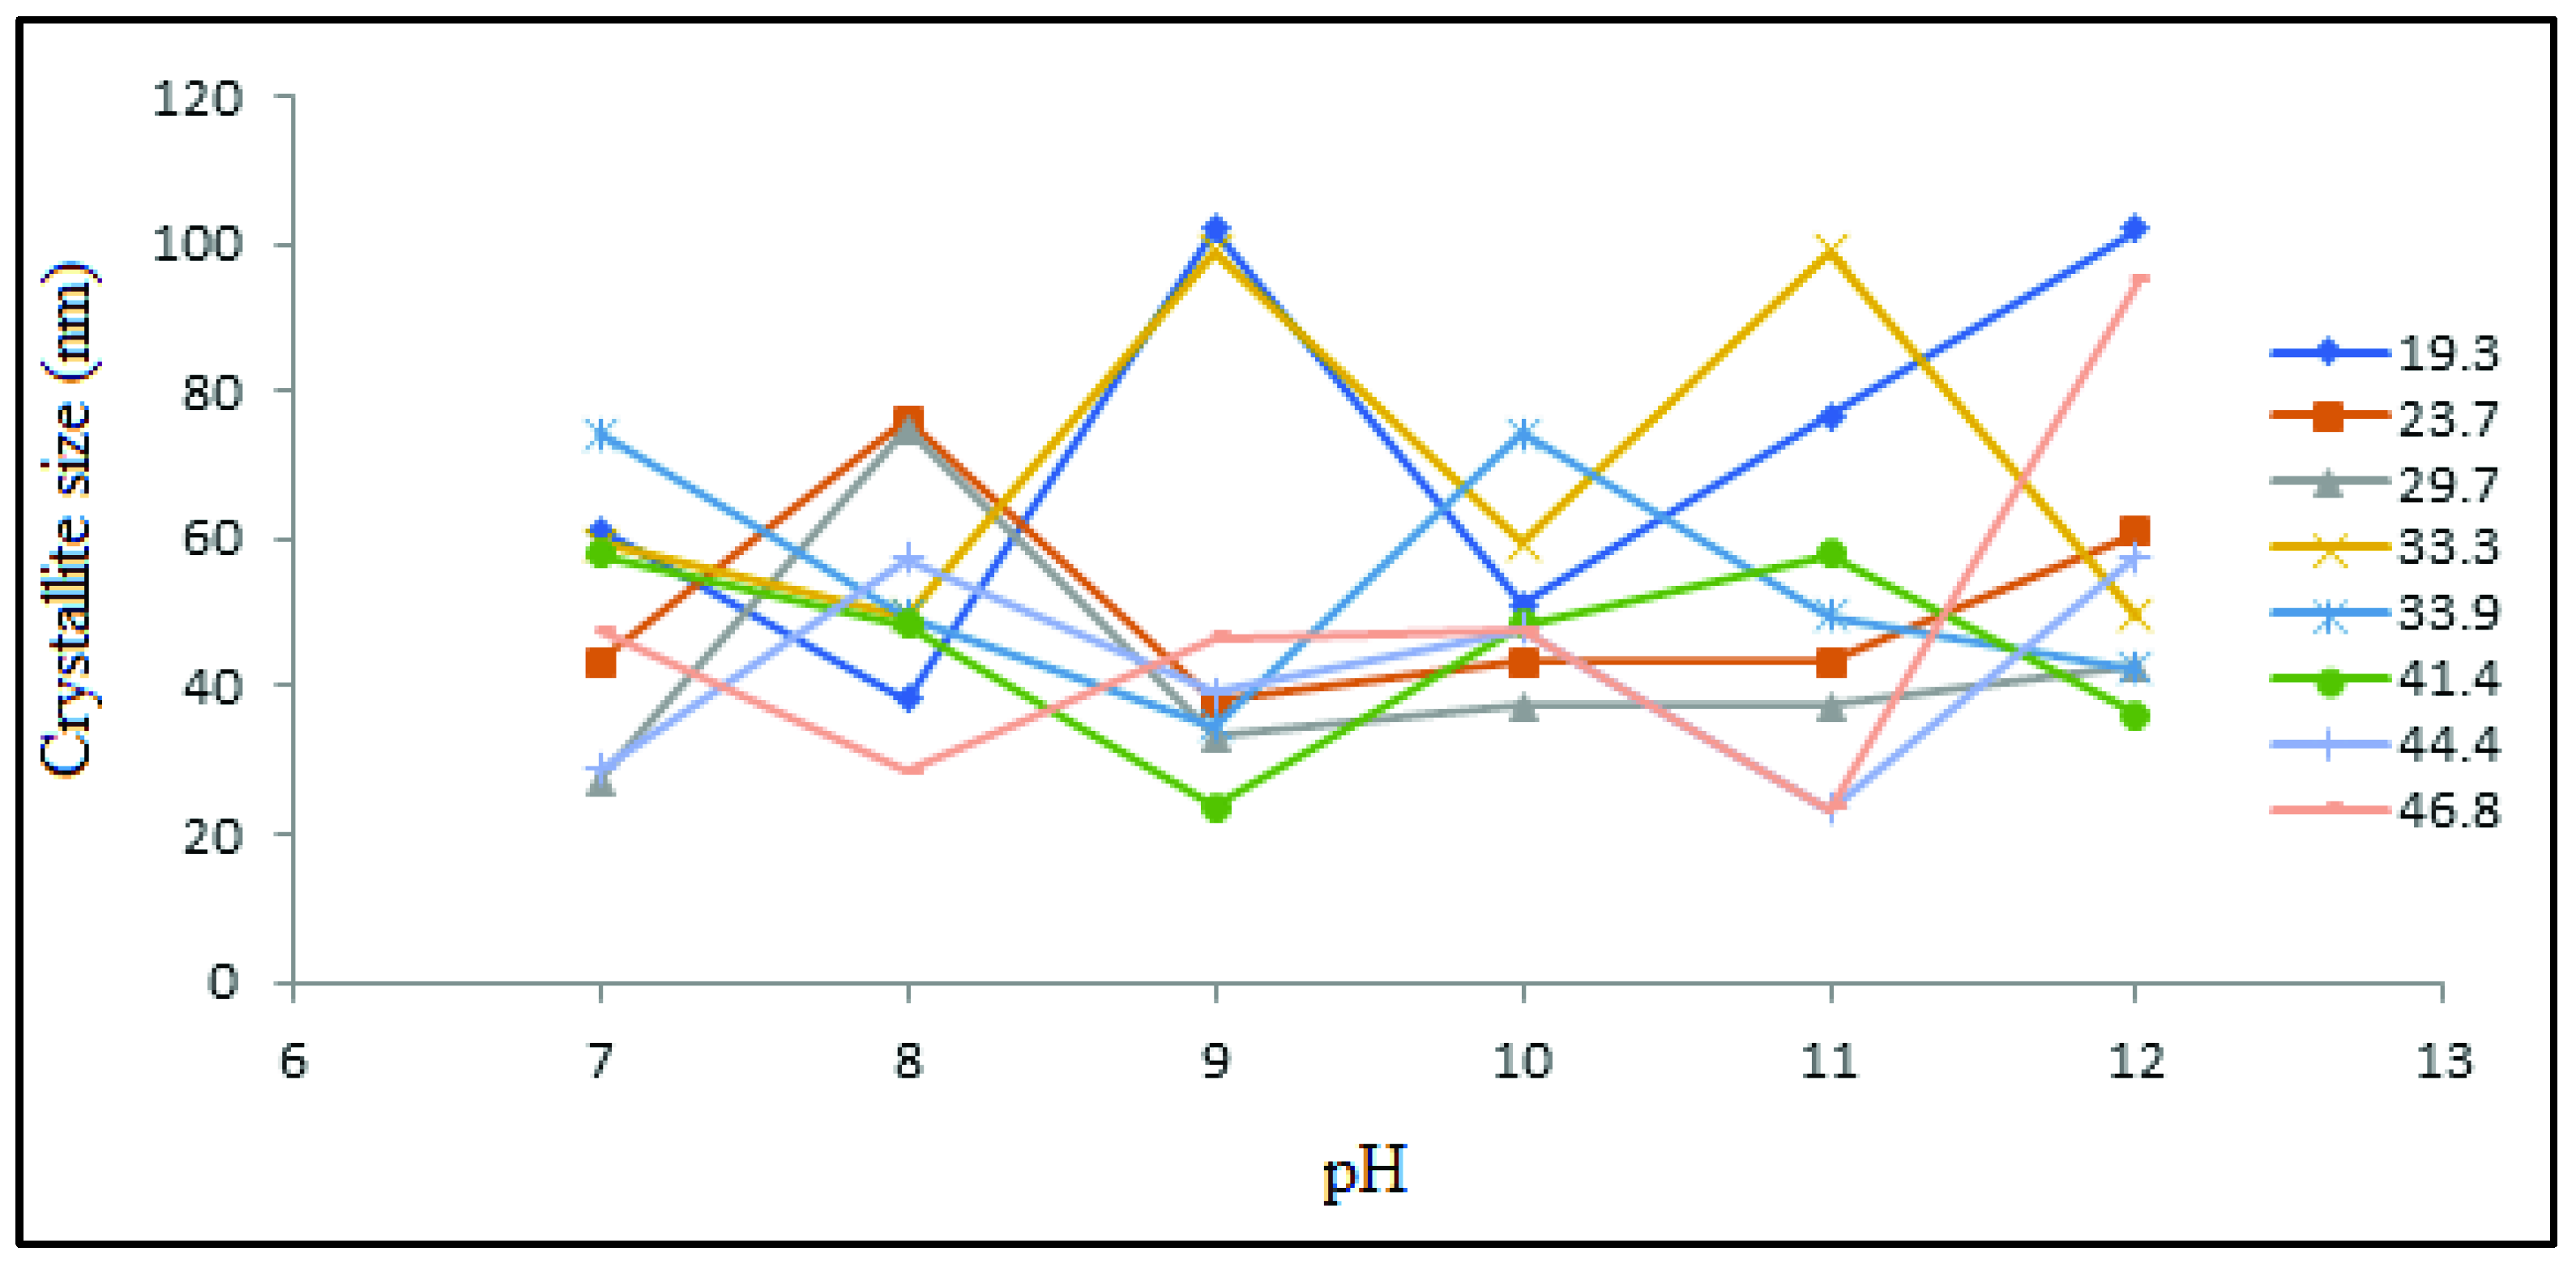
3.2. Powdered XRD Analysis
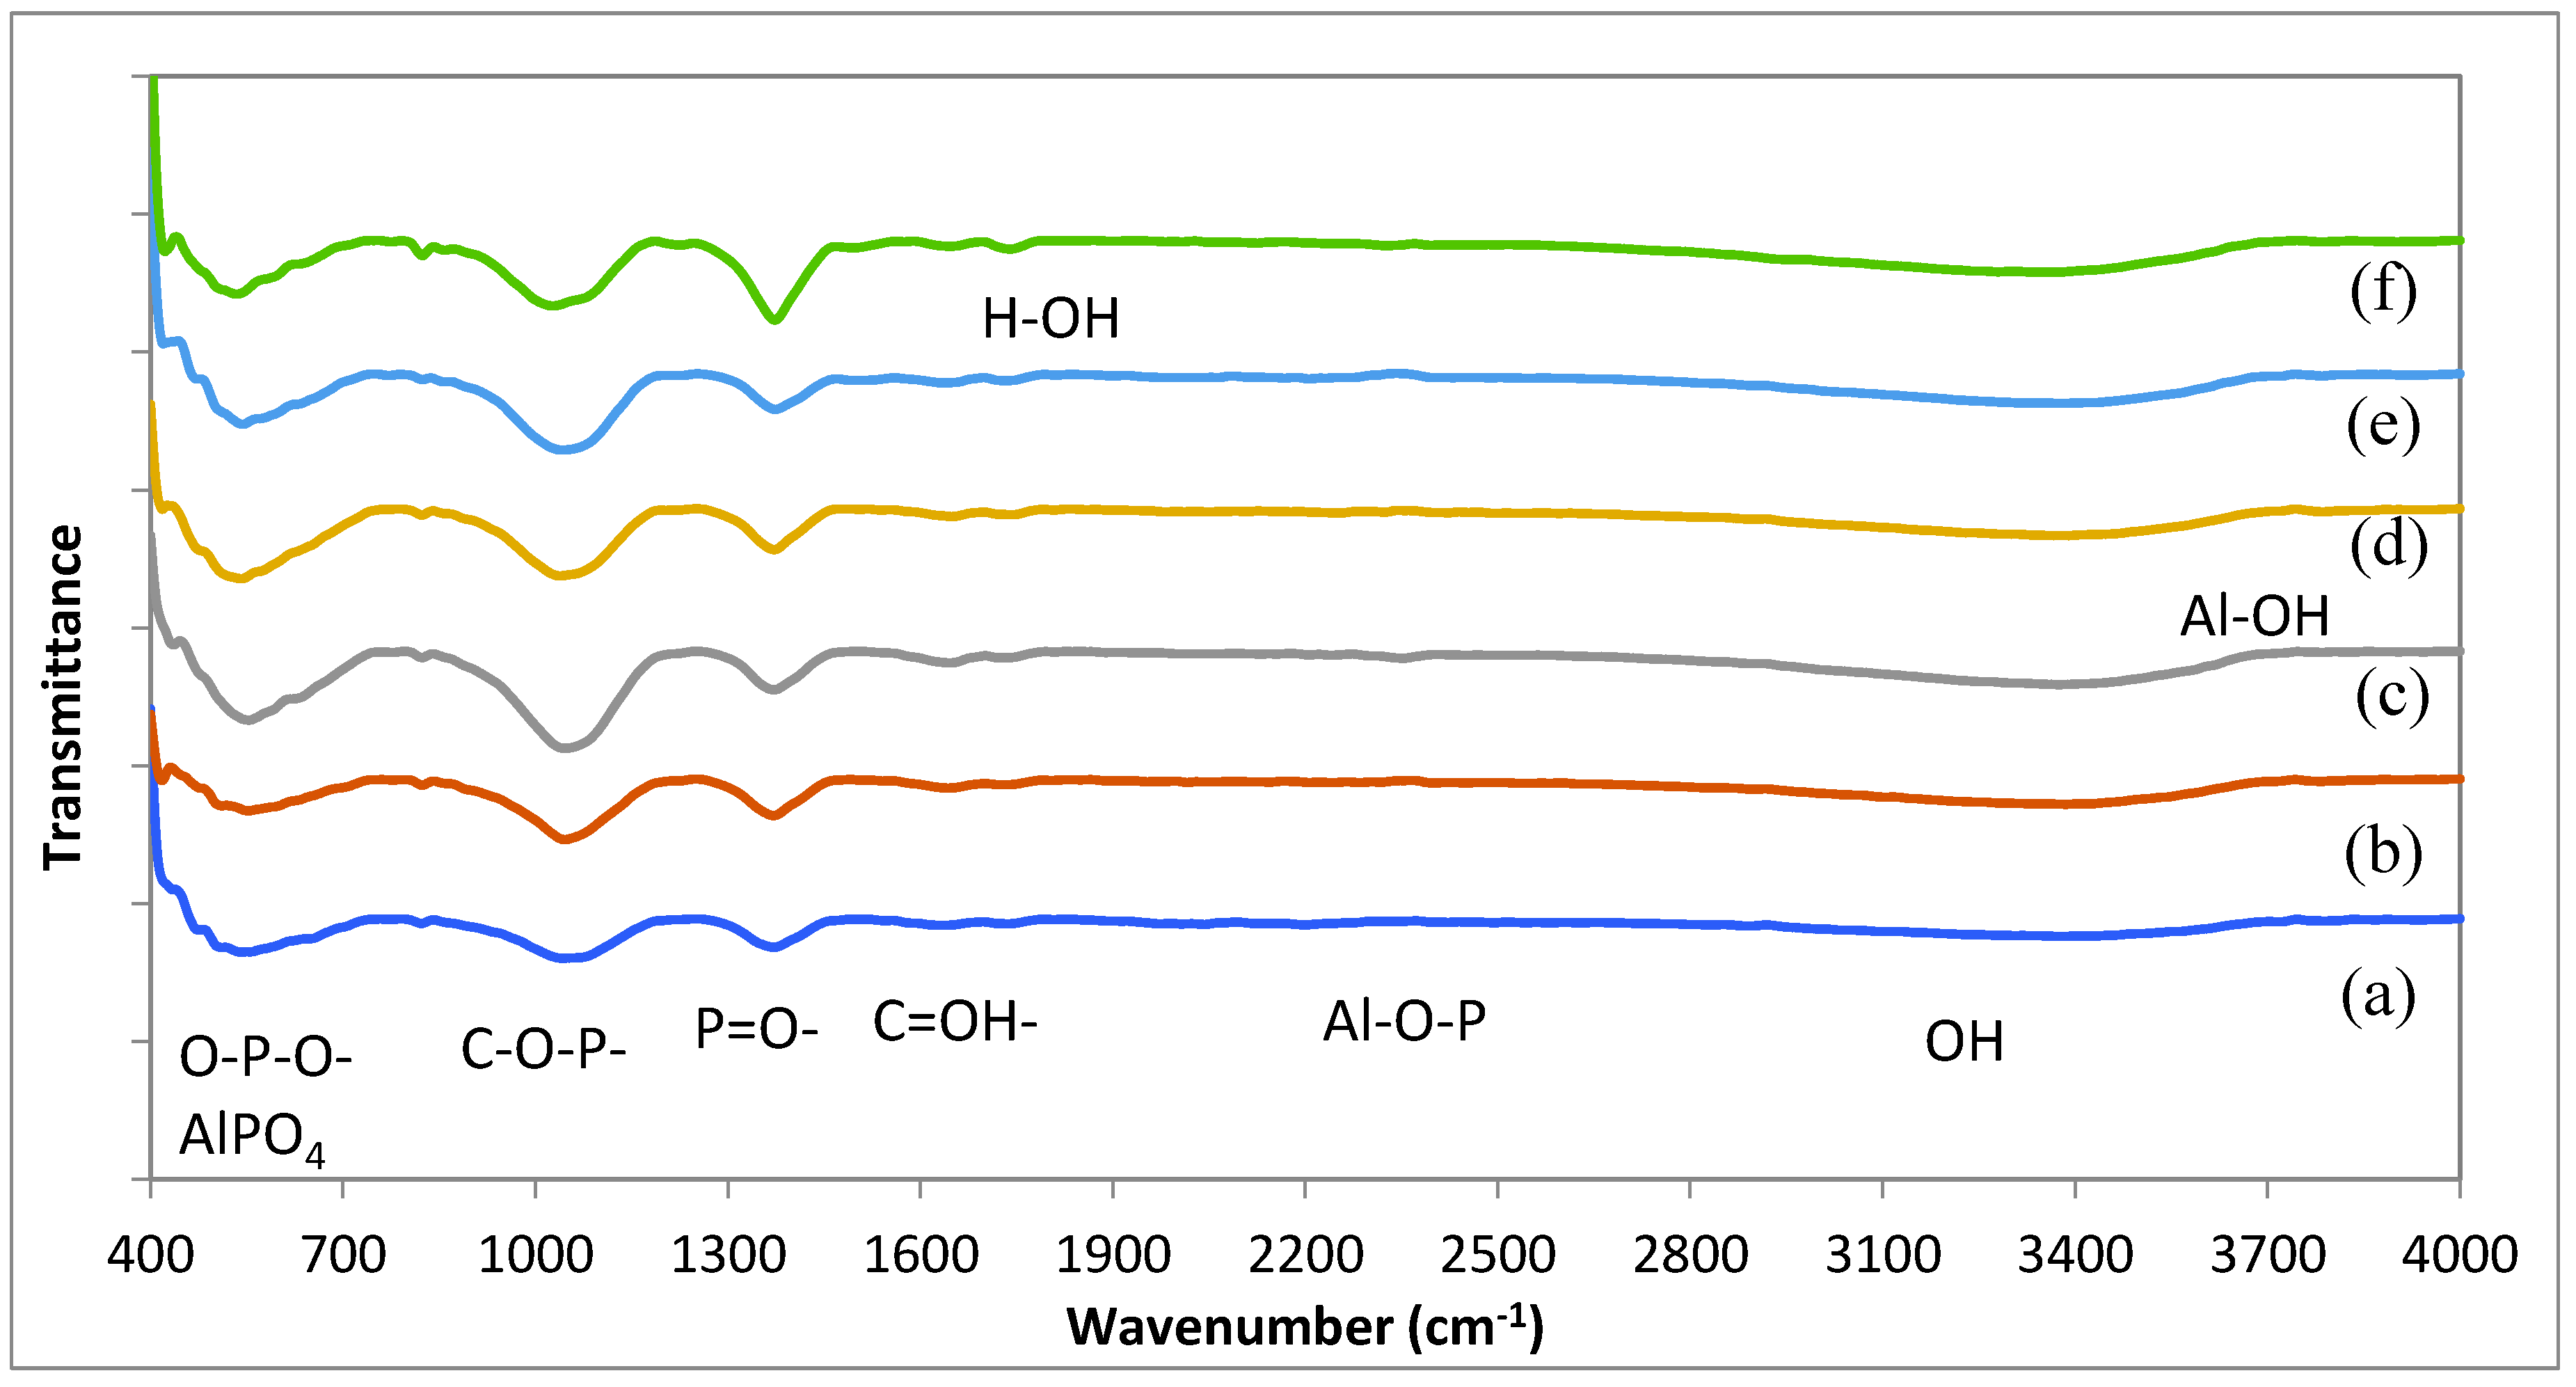
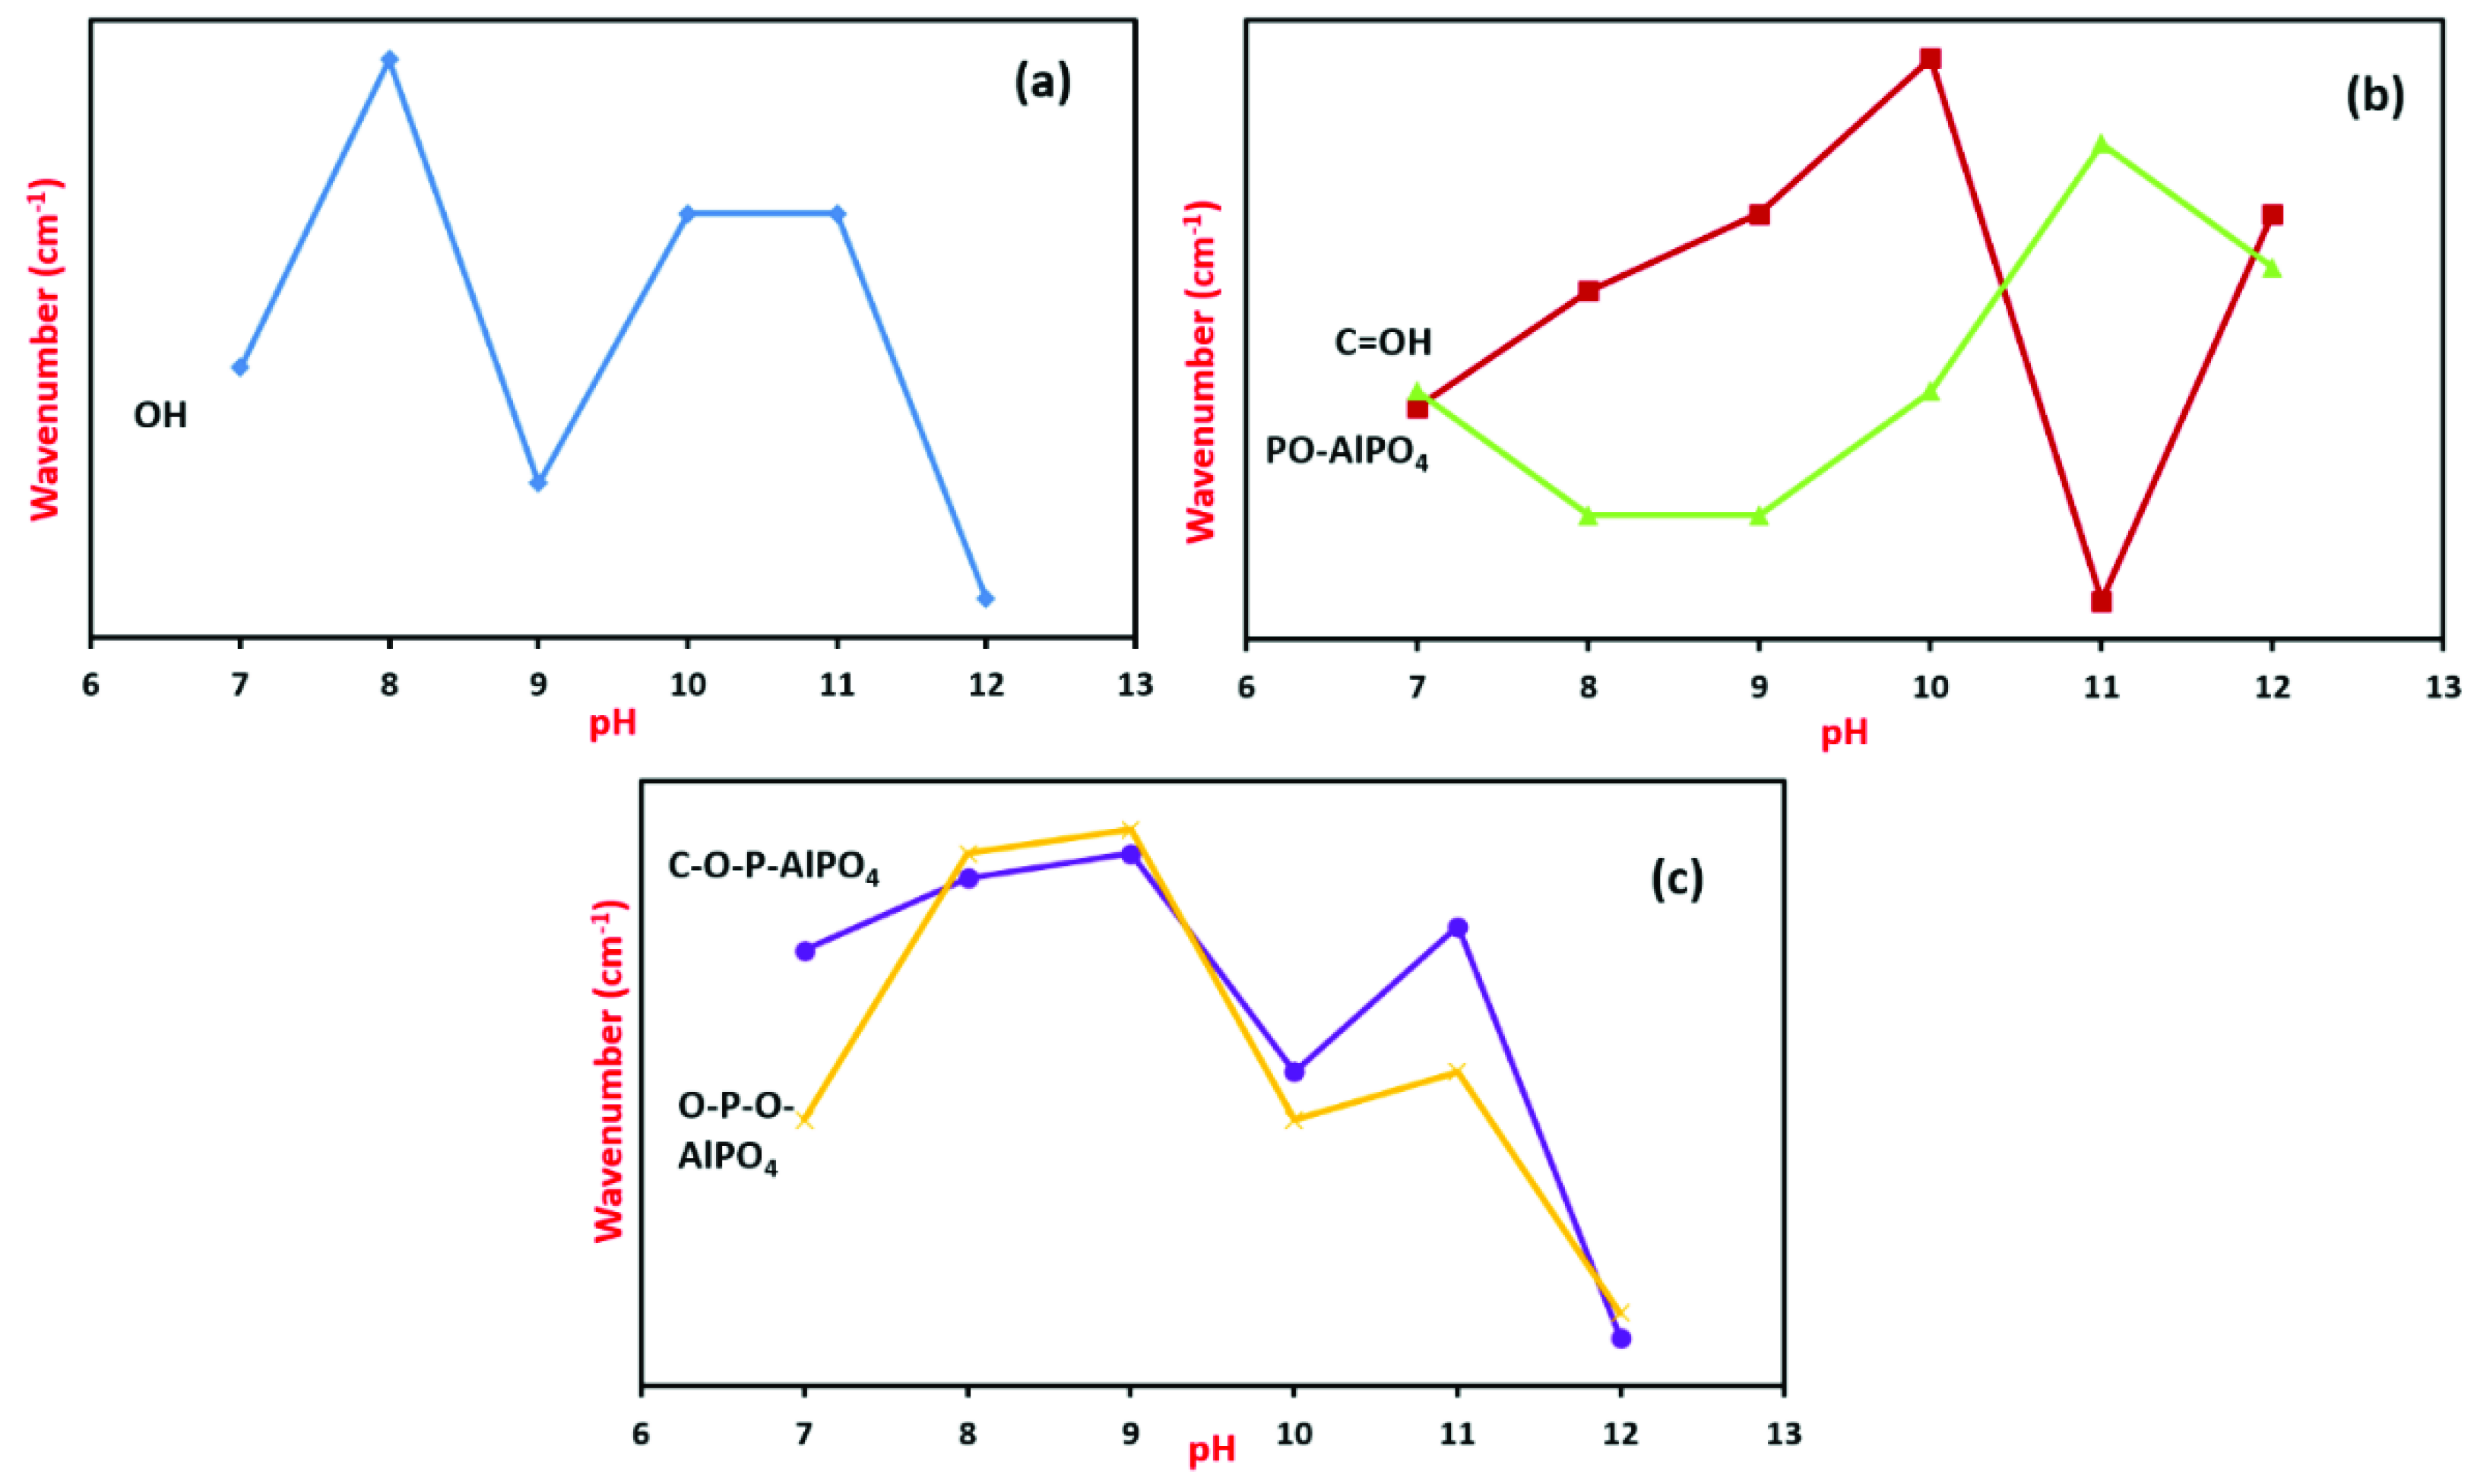
The powder XRD analysis of various PPVA-AlPO4 samples formed from various pH in the range of 7–12 are shown in Figure 3. Here, the patterns are shifted towards the lower diffraction angle for the samples with pH 7–9, and towards the higher angle for the samples of pH 10–12. Moreover, the intensity of peaks decreases with an increase of pH from 7 to 8, followed by a slight increase for pH from 9 to 10, and subsequent decreases for pH 10–12. Compared to the other samples, the sample of pH 12 is showing some broad peaks, and the peak at 2θ of 70° is disappeared. A literature study indicates the generation of highly crystalline phosphates when high acidic conditions are maintained during the synthesis of AlPO4 nanoparticles [16]. However, the PPVA-AlPO4 composites XRD pattern provides support for the good crystallinity of samples even in the alkaline region (pH 10–12). When the solution pH is in the lower alkaline region of pH 7–9, the available H+ ions help for the development of microstructures and nucleation of PPVA-AlPO4 composite. Here, although the number of OH ions is less, the available ions contribute to the overall progress of the reaction. On the other hand, the availability of excessive OH ions in the higher alkaline conditions of pH 10–12 significantly influences particle nucleation and aggregation. The variation of pH has a direct effect on the number of H+ or OH ions to be released in the solution, wherein the strong alkaline environment contains the OH ions to be dominant. The pH variation is responsible for the induction of hydrolysis and condensation, which has a direct effect on the reaction kinetics, and thereby the promotion of the production and transport of H+ and OH. Therefore, pH is a very important factor in controlling the crystallization rate and associated size distribution of crystallites or particles. Moreover, it has been observed that the presence of a very high amount of OH ions, in general, reduces the precipitate yield, and to avoid that higher levels of P and Al are used [17]. This is in good agreement with the results obtained for the sample formed with pH 10 which has a stable particle size of PPVA-AlPO4 composite.
Figure 4 shows the comparison of crystallite sizes of all the samples calculated using the Scherer equation, and it can be observed that the samples of pH 7, 8, and 10 have a narrow particle size distribution. A further increase of the pH value exhibits variable crystallite sizes, but their crystallinity phases and amorphous nature remain the same. Such an observation can be linked to the phosphate particle growth and is based on the aggregation of globular primary nanoparticles, whereby the solution pH is determined by the number of available ions and this effects on the composition and crystallite size [16].
Further, all the PPVA-AlPO4 composites formed by maintaining the solution pH range of 7–12 are investigated to be crystalline, and within those the one formed at pH 10 forms crystallites of homogeneous size distribution due to the occurrence of maximum PPVA-AlPO4 bonding, which is supported by the thermal analysis too. Based on the intensity of XRD peaks and full width at half maximum (FWHM), the pH of precipitation influences the particle size due to the changes in Al−OH to the Al−PO4 ratio. Table 3 shows the details of XRD data for 2θ value, d-spacing, and FWHM for PPVA-AlPO4 nanocomposite samples at different pH values.

3.3. FTIR Analysis

Figure 5 shows the comparison of FTIR spectra for the samples prepared with different precipitation pH (7–12), where the sample at pH 10 has the Al–OH characteristic stretching vibration band around 3786 cm−1. Other samples prepared at the pH of 7, 9, and 11 show the Al−O−P peak at 2202, 2253, and 2206 cm−1, respectively and the bending vibration of the H−O−H plane water molecules are observed at the lower wavenumber of 1730 and 1740 cm−1. Here, all samples are found to maintain the bands of OH (at 3371–3385 cm−1), C−OH, and a mixture of H−O−H (at 1640–1649 cm−1), P−O−AlPO4 (at 1371–1374 cm−1), C−O−P−AlPO4 (at 1027–1047 cm−1), HP−O−AlPO4 (at 822–824 cm−1), and O−P−O−AlPO4 (at 533–553 cm−1). The comparison of these band positions for the samples has provided information about the pH influence on the composite formation, i.e., we observed a shift to the band positions of −OH, C−OH, P−O−AlPO4, C−O−P-AlPO4, and O−P−O−AlPO4. With the pH increase from weak to strong alkaline, these vibrations are shifted to the lower wavenumber position. For the increase of pH from 7 to 9, a shift in the band position occurs to the higher wavenumber side, the sample of pH at 10 has a shift to the higher wavenumber side, the sample of pH 11 also shifts to the higher wavenumber side, and finally there is a shift back to the lower wavenumber for the pH at 12 sample (Figure 5a,c). Moreover, there is shifting of the C−OH band to the higher wavenumber upon the increase of pH from 7 to 10 and the pH 11 and 12 samples present intense PO-AlPO4 bands which can be linked to the hydrogen bonding in water, i.e., decreased at pH 11 but increased at pH 12 because of the breaking of Al−O−P bond and crystal structure.
From the analysis, until the pH 10, the shift of bands to the higher wavenumber side is due to the increase of protonation and the associated increase in the interaction between the polymer and aluminum. The FTIR analysis of PO4, HPO42−, H2PO42−, and H3PO4 containing samples in their normal vibrational spectral mode indicates a decrease of force for the P−O and P−OH bonds with a decrease in the protonation degree. This shift of higher energy for the P−OH band is in accordance with the pH increase, while the pH decrease causes an increase in the phosphate character that shifts to the lower energy (higher wavenumber) side [16]. Additionally, to break and reform the bonds of Al−O−P, the O in OH ion was induced to produce a variation in the wavenumber. A similar trend was observed during the XRD crystallite size analysis too, where the H+ and OH ions cause a variation in the Al−O−P and Al−OH bond, affecting the bond length and coordination number in the PPVA-AlPO4 composite. The development of crystal from particle agglomeration at pH 7–9 was observed due to the influence of H+ ions, and at pH 10 an increase in the number of OH ions significantly influences the crystal structure and the formation size of particles. Thus, it breaks the agglomerated particles into small ones, whereby we observed the development of crystals for the second time when the pH changed from 10 to 11, and a further increase of OH ions in the system is obstructing the particle development due to the complete vanishing of Al−OH bond and crystal structure. A summary of FTIR peaks for the PPVA-AlPO4 composite according to pH is presented in Table 4.
Figure 6 depicts the pH effect in the five FTIR bands selected from the nanocomposite samples. The corresponding bands are OH (3371–3385 cm−1), C=OH (1640–1649 cm−1) and PO−AlPO4 (1371–1374 cm−1) and (c) C−O−P−AlPO4 (1027–1047 cm−1) and O−P−O−AlPO4 (533–553 cm−1). As the pH of the solution increases from weak to strong alkaline, the bands shift to lower wavenumbers. For pH 7–9, the bands are shifted to a higher wavenumber, while for pH 10, the bands are shifted to a lower wavenumber. The bands are shifted to higher wavenumber at pH 11 and shifted back to lower wavenumber at pH 12, as shown in Figure 6a,c. Meanwhile, Figure 6b shows that the C=OH band is shifted to a higher wavenumber from pH 7 to pH 10, and pH 11 in the PO−AlPO4 band is related to the water and H bond. The water decreased at pH 11 but increased at pH 12 due to the breaking of the Al−O−P bond and crystal structure. The PO−AlPO4 band also displays a maximum intensity at pH 12.

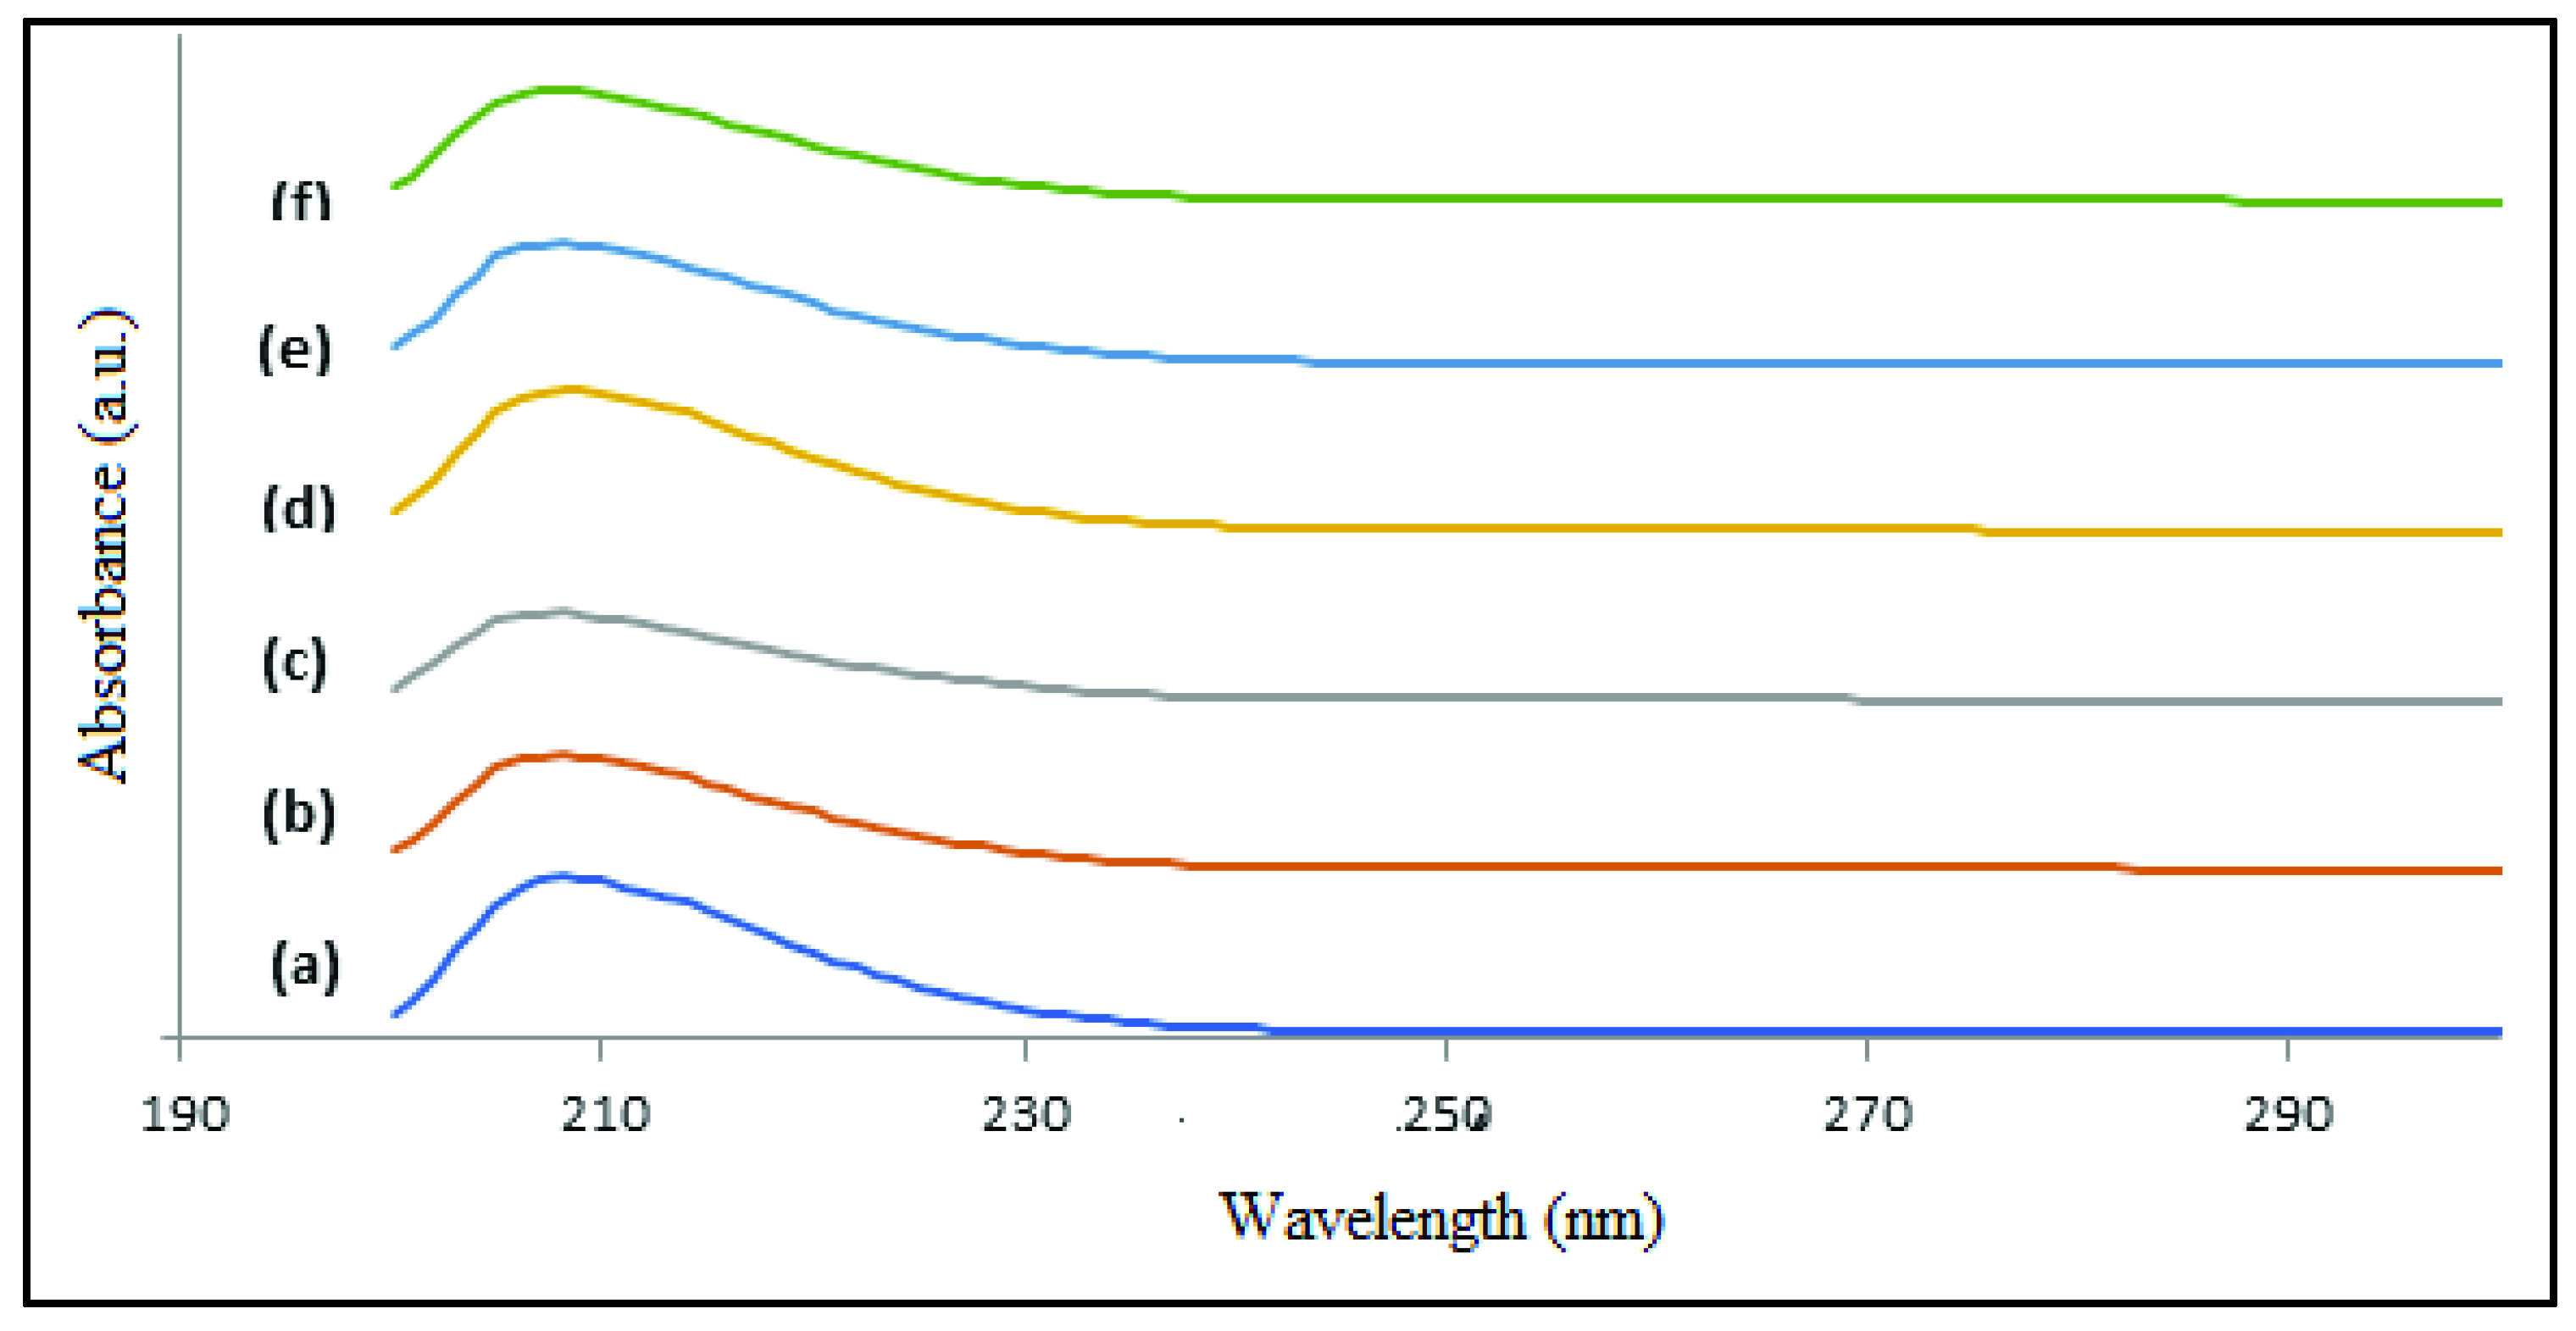
3.4. UV-Vis Analysis
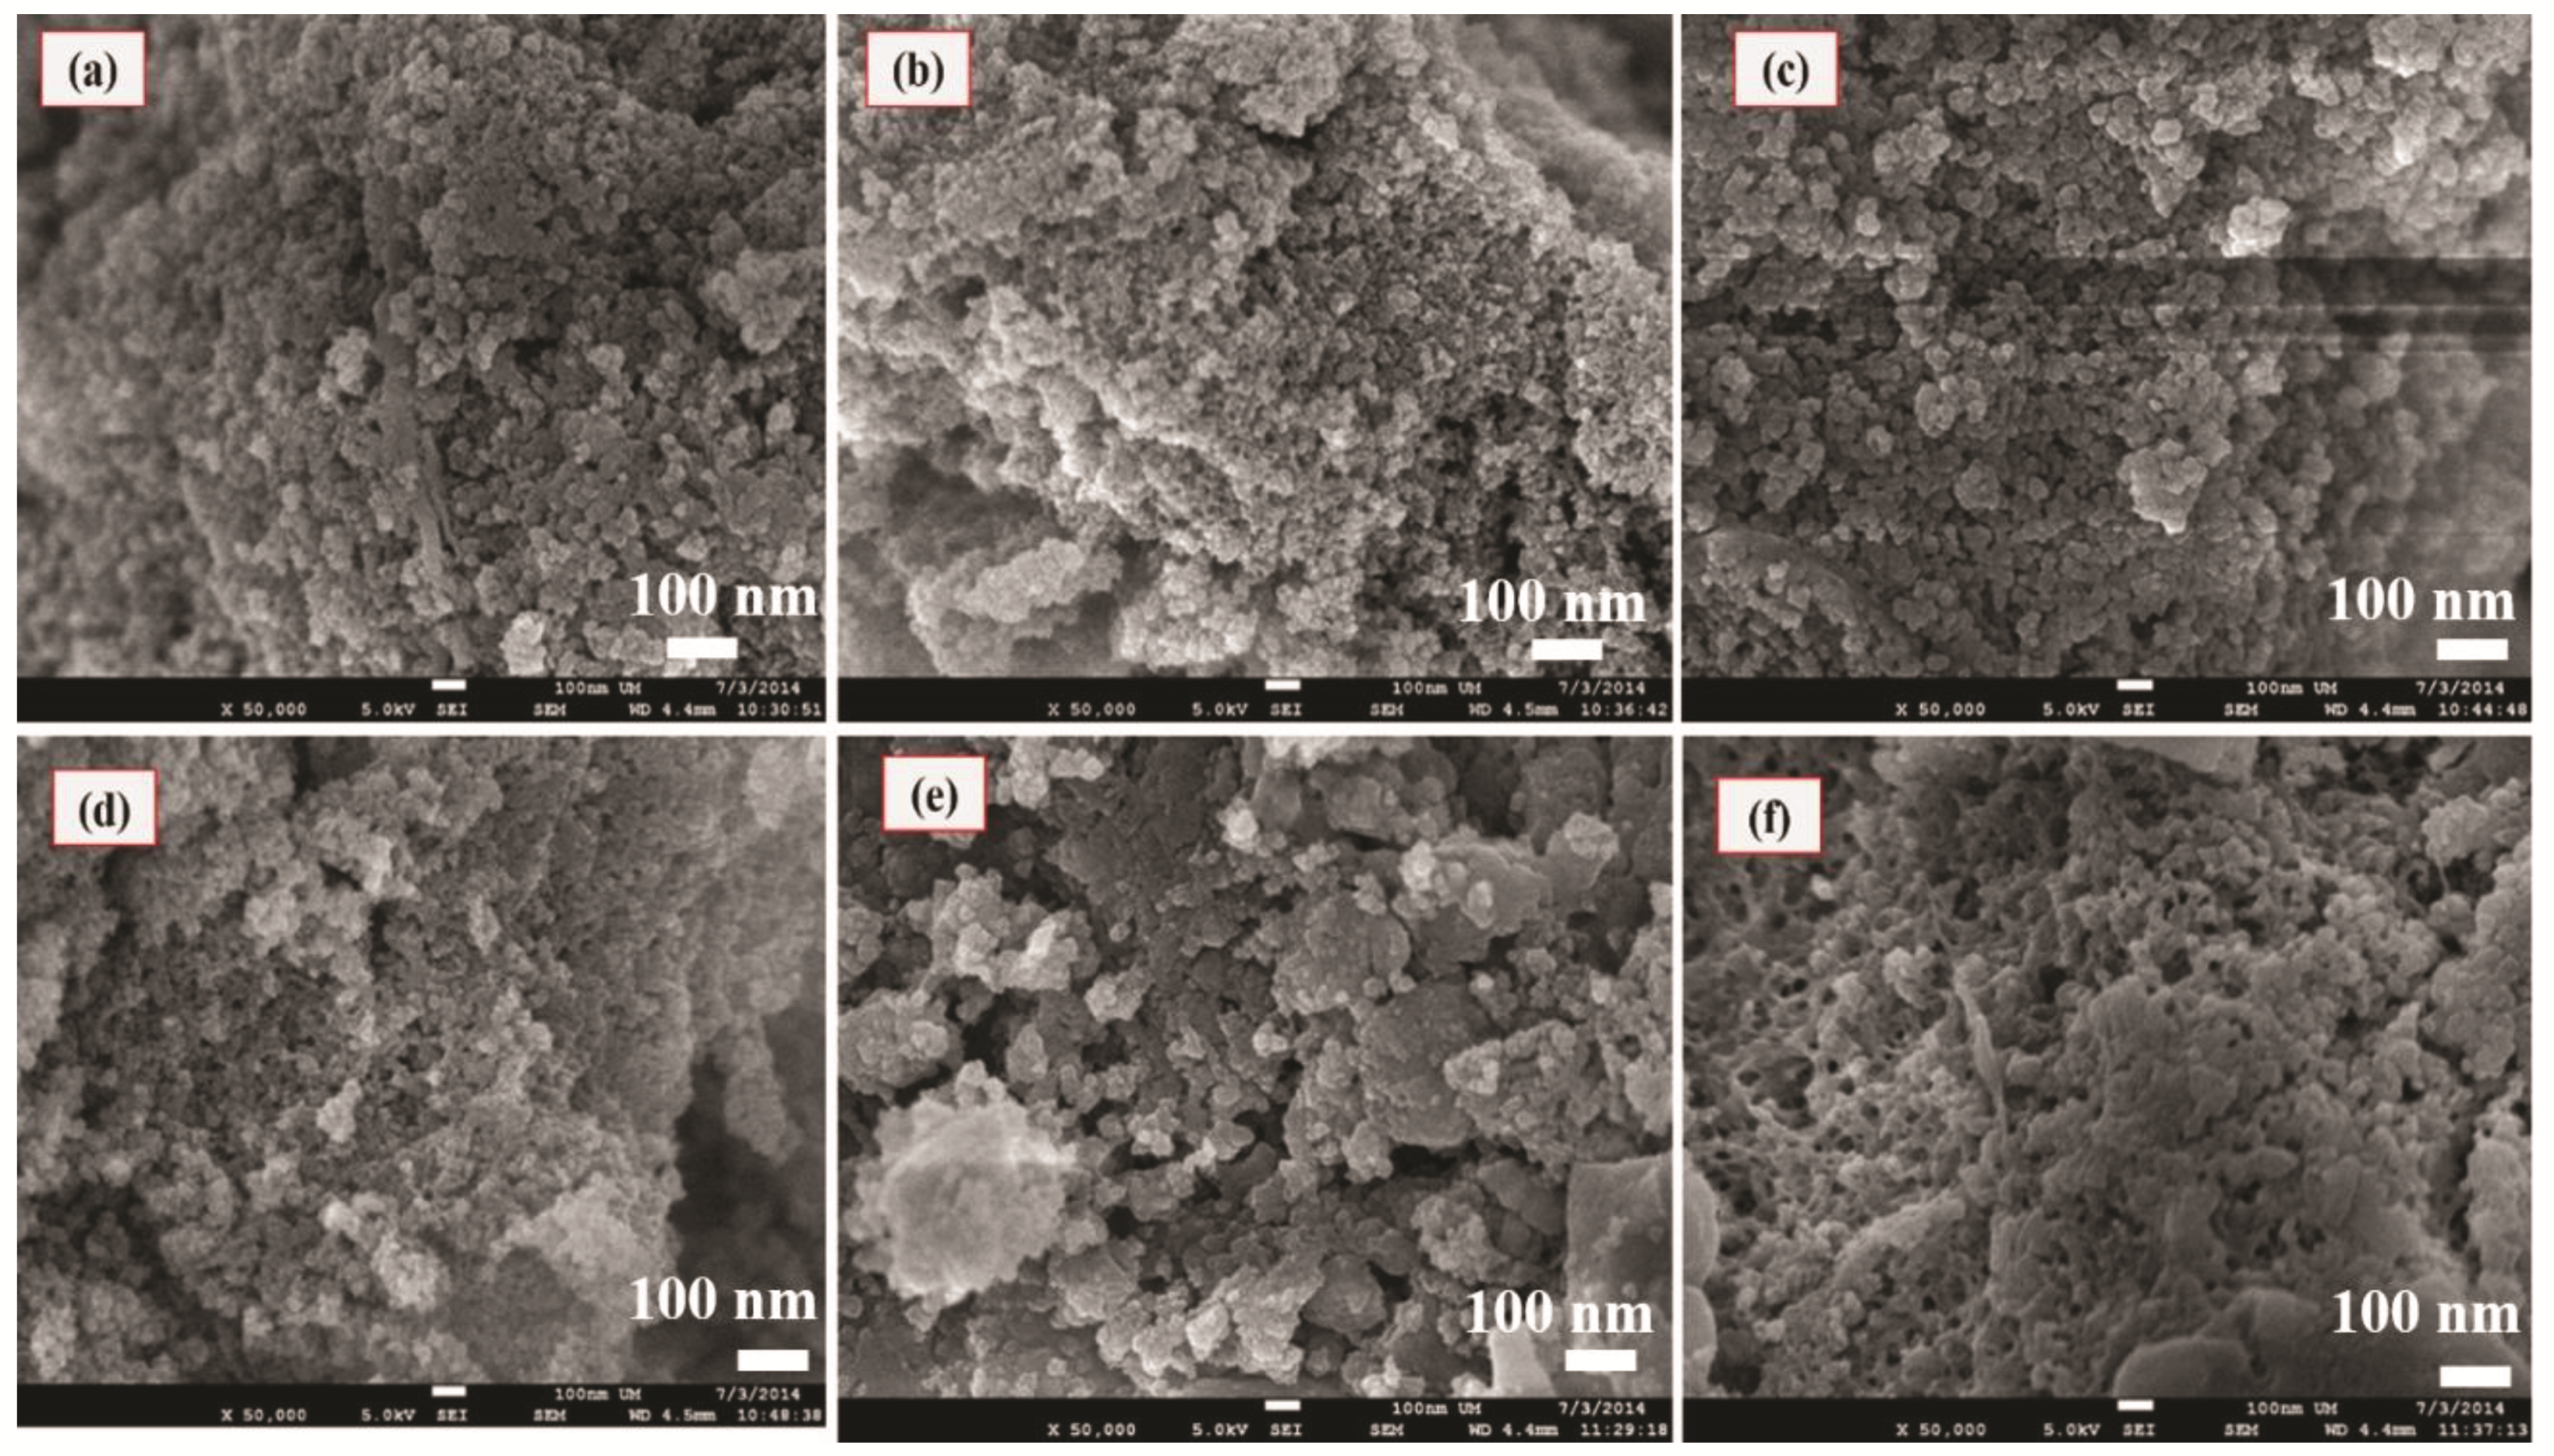
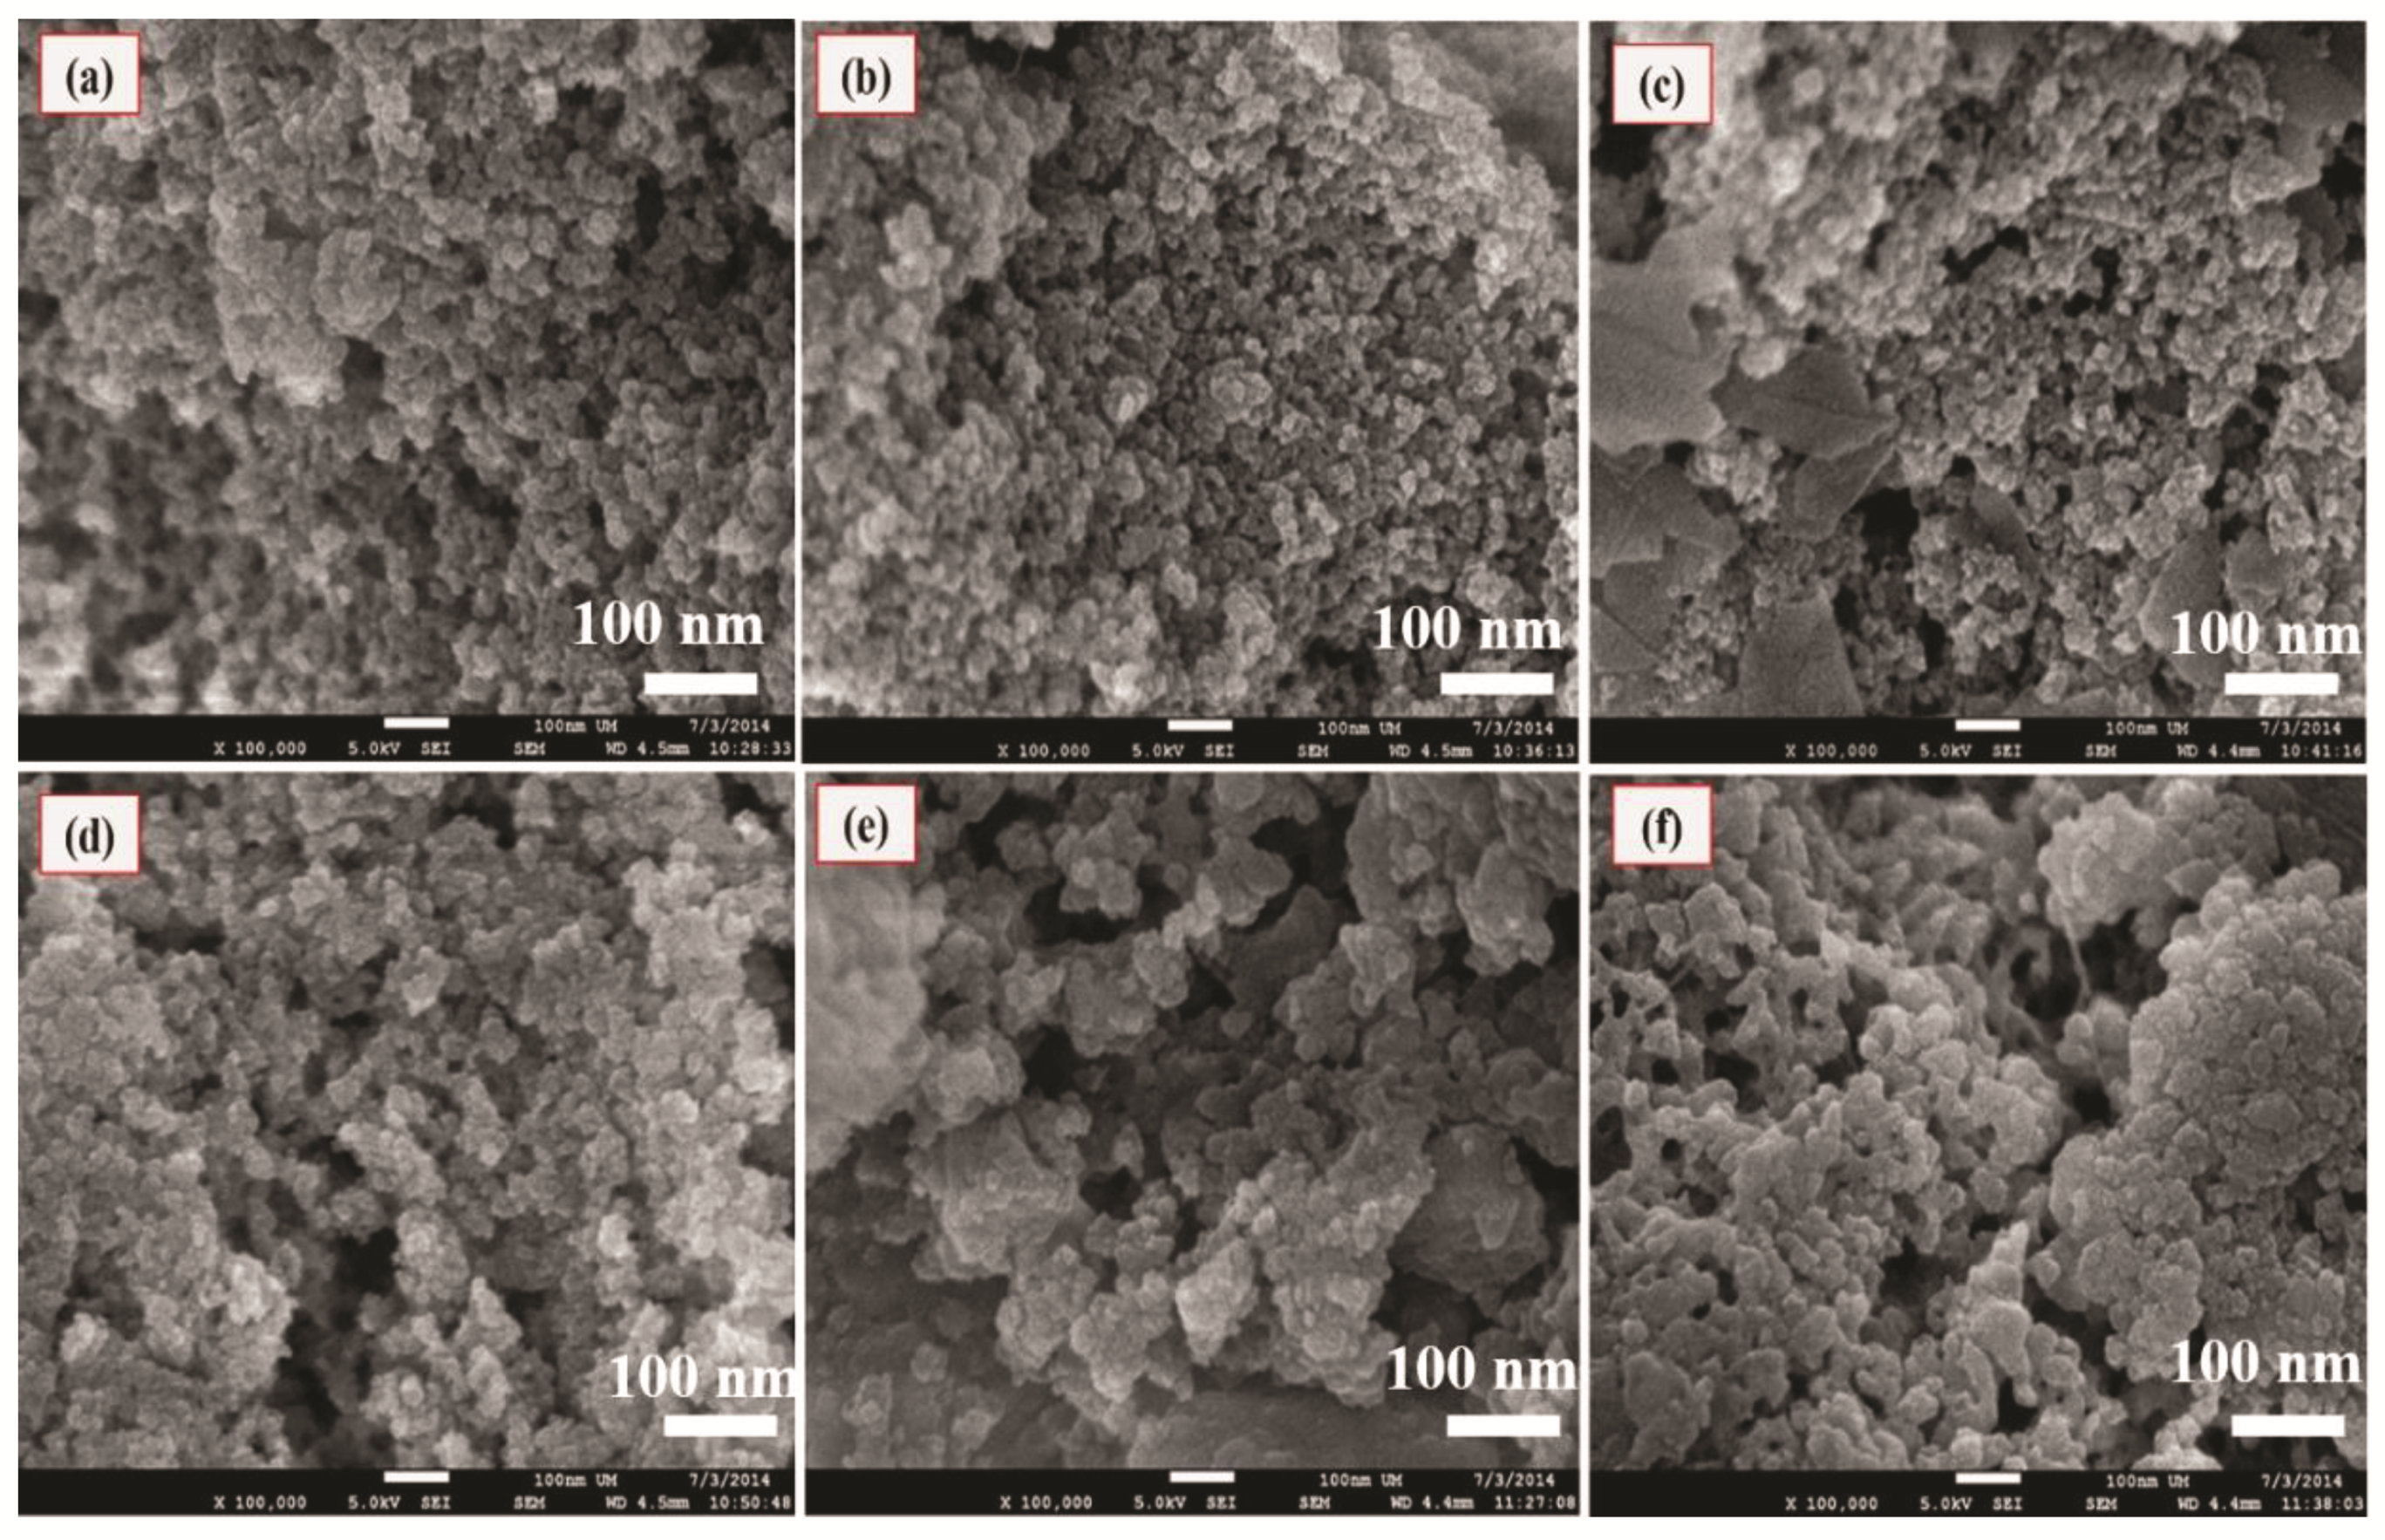
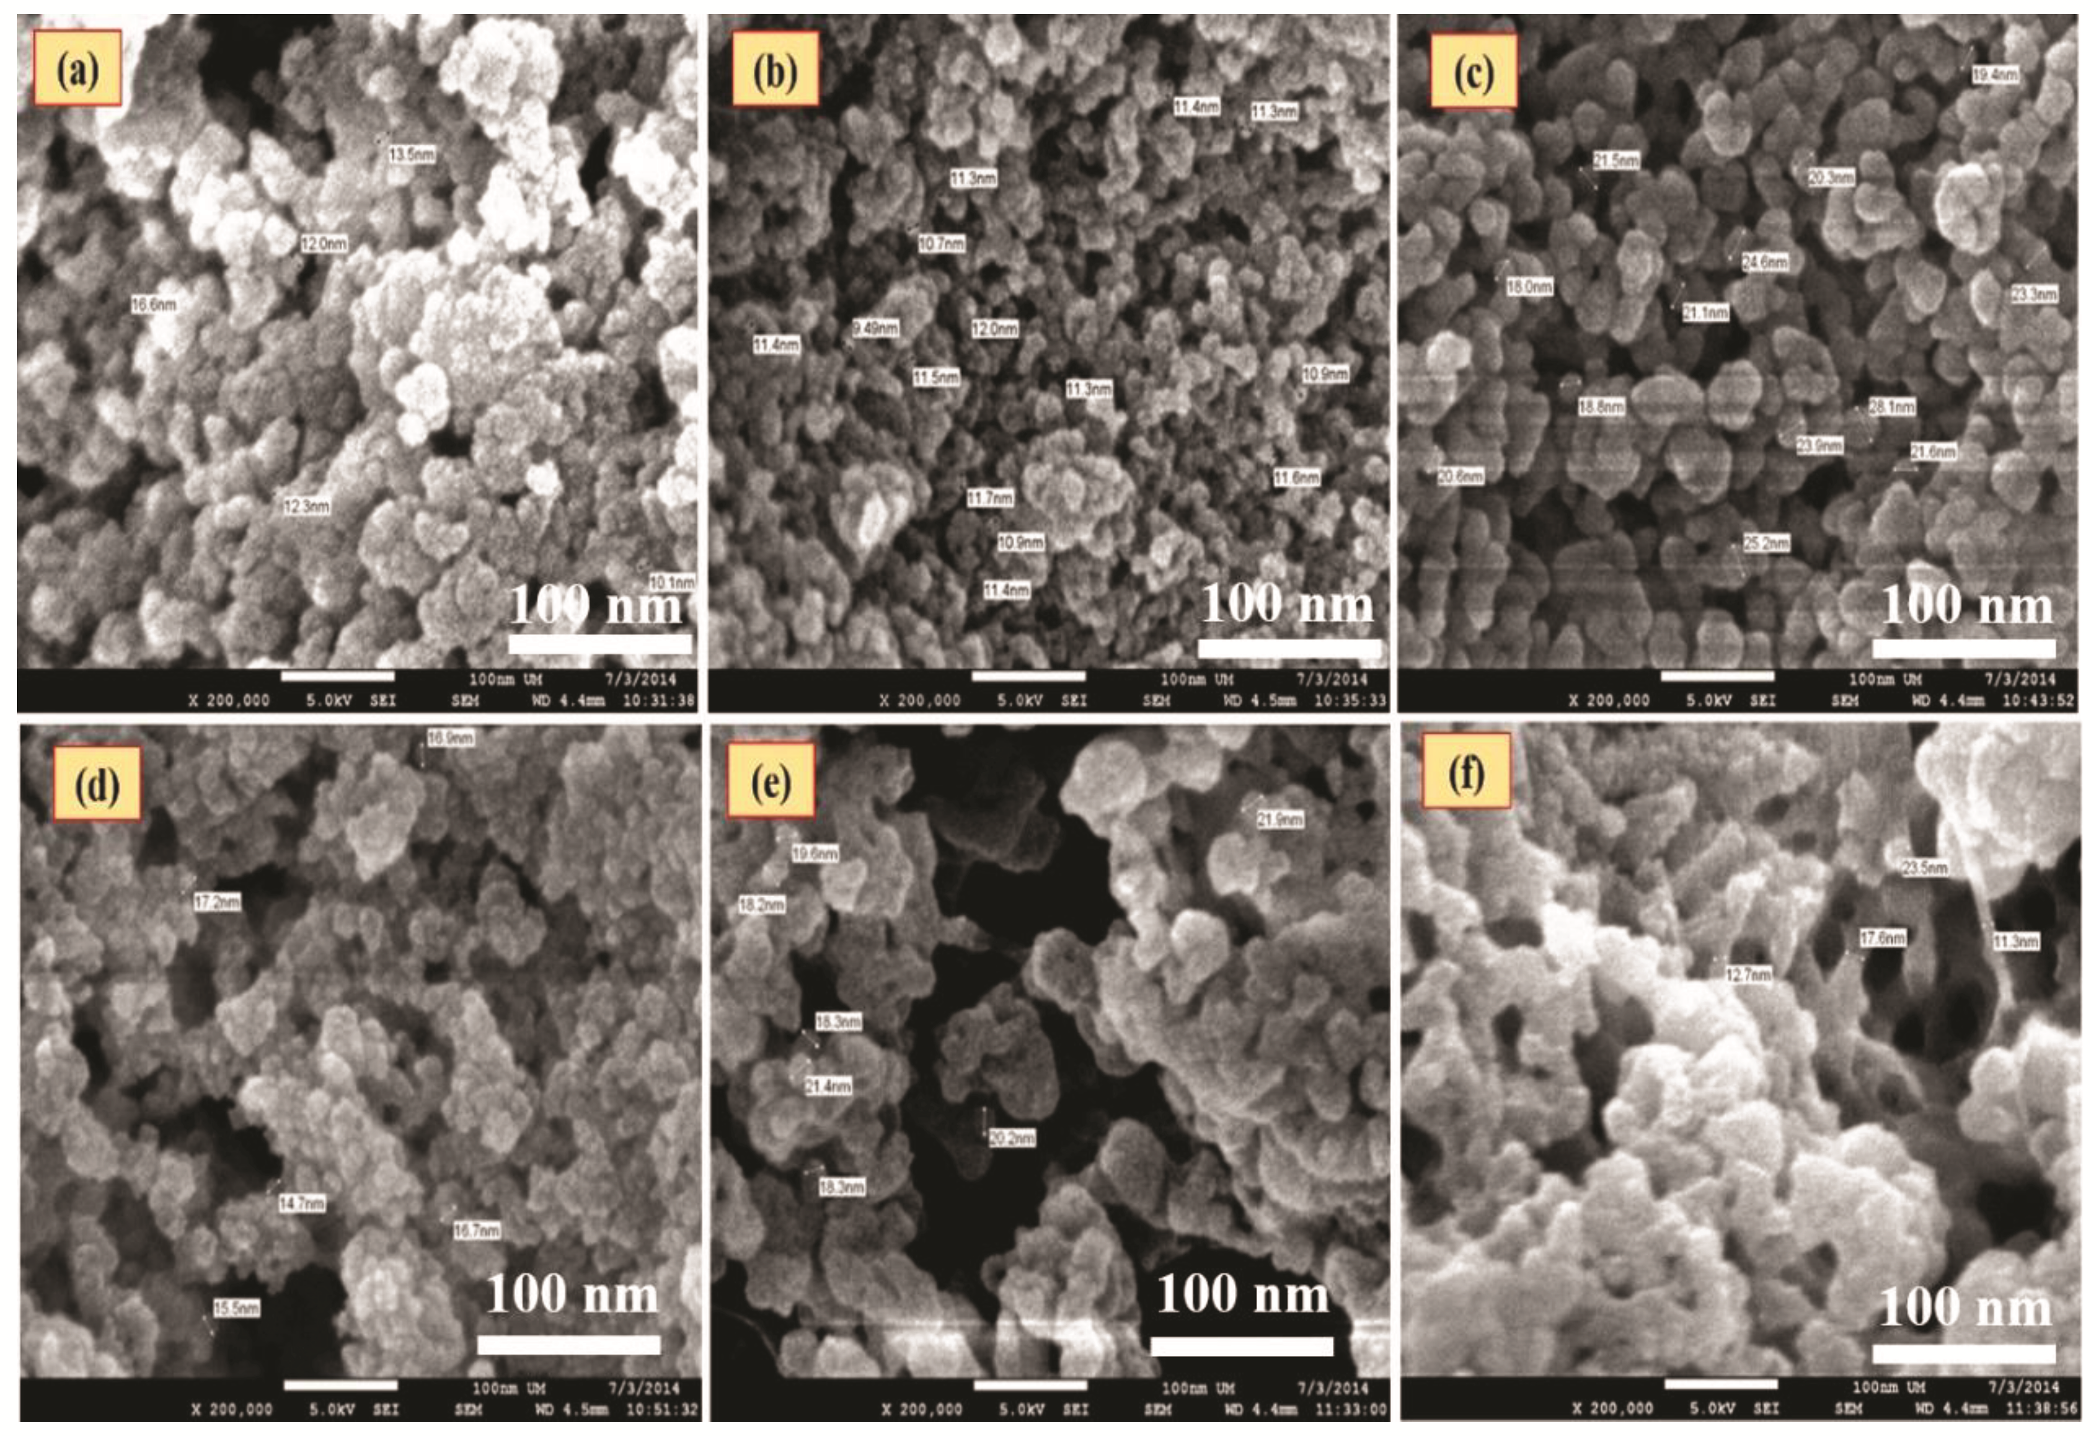
The comparison of UV-Vis spectroscopic analysis of PPVA-AlPO4 composite samples formed from various pH (7–12) is shown in Figure 7, where the spectra indicate the broad peak at 208 nm for all the samples with no peak shifting. We also observed sinusoidal behavior with a decrease of peak intensity from pH 7 to 9, a spike up at pH 10, and again a decrease with further pH increase. In general, the observation of changes in wavelength position of absorption peak can be linked to the presence of bonding and its type in a molecule. However, the intensity of peaks may be correlated to the development of microstructure and its nature where the mixing of immiscible layers and the particle size decreases with that of an increased pH and are due to the aggregation of globular primary nanoparticles from the reaction of H+ and OH ions. The higher alkaline conditions contain a greater number of OH ions in solution, which support the formation of particles with variable size and shape. The sample formed at pH 10 contains the Al-OH bonded with that of Al-PO4 and this influences the extent of the amorphous and crystalline phase of the composite. Moreover, the observation of maximum peak intensity for the sample of pH 10 indicates the homogeneous AlPO4 nanoparticulate system and this is due to the occurrence of maximum bonding between Al and PO4. The particles aggregated at pH 11 and 12 transformed into smaller particles and completely vanished at pH 13 as the solution became clear. As clearly shown, the formation of AlPO4 is affected by the pH and concentration of the mixture during synthesis. From the UV-Vis spectroscopic analysis, it is indicated that the formation of AlPO4 is strongly influenced by the solution pH and the concentration of reactants applied during the synthesis process.

3.5. FESEM Analysis

The FESEM images (at 50 k magnification) of PPVA-AlPO4 composites formed at different pH values are compared and shown in Figure 8, Figure 9 and Figure 10, where the samples formed at pH 8 and 10 are found to contain the nanoparticles in homogeneous phases. For the samples at pH 7 and 10, spherical particles of a small phase layer can be found and for the pH 11 sample, larger-sized particles are observed and are without any shape. Similarly, the pH 12 sample also displays the formation the particles without any geometry and is due to the loosing of the spherical particle shape after the agglomeration. Further, the availability of an excessive number of OH ions in the system facilitates the particles melting away from the reaction and generating de-shaped particles. Further, the FESEM micrographs recorded at higher magnifications of 100 k and 200 k are shown in Figure 9 and Figure 10 (respectively), also indicating the formation of spherical shape particles having an average particle size of <20 nm. The particles have started to agglomerate at the solution pH of 9, generating a layered structure, and the additional increase of pH to 10 has prevent the layers from producing homogeneously distributed spherical particles. This indicates the occurrence of a critical supersaturation stage at pH 10 and in general this occurs through the homogeneous precipitation of nucleation and by the involvement of respective constituents.
Our investigation of the pH effect on PPVA-AlPO4 nanocomposites indicated significant behavioral changes during the crystal formation and their disappearance, i.e., at pH 7–9 (weakly alkaline), particle aggregation was observed, and this is influenced by the H+ ions. We observed that at pH 8 and the increased pH of 10 (moderate alkaline), the OH anions cause the critical supersaturation stage to generate the spherical shape nanoparticles having a homogeneous distribution. With an additional increase of pH (above 10), was particle shape varied and became large due to the agglomeration. The pH at 11 sample was found to contain a mixture having irregular and spherical shape particles, and at pH 12 sample was observed with melted nanoparticles transforming into nanotubes. With a further increase of pH to 13, the reaction for the formation of nanoparticles could not occur due to the complete dissolving of the reactants, and the observation of such behavior is in accordance with the results reported by Yang and Kau (2005) [17].
As shown in Figure 6, the increase of solution pH causes the PPVA-AlPO4 composite to be distributed in two-particle size trends, i.e., the particle size decreased from pH 7 to 8, suddenly increased at pH 9, and decreased again at pH 10 and other higher pH (11 and 12). The formation of homogeneously distributed spherical particles was observed at pH 8 and 10 and this is in good agreement with the crystal size analysis recorded from the XRD patterns (Figure 3). However, the samples prepared at pH 7, 9, 11, and 12 generates nanoparticles with a wide range of sizes that are also non-homogeneously distributed particles (Figure 4). This could be due to the existence of heterogeneous phases of laminar layers, various geometrical shape, and melting behavior. Thus, from the overall analysis, it can be concluded that the pH of the precipitation process significantly influences the particle size and shape of the PPVA-AlPO4 nanocomposite. These results are consistent with the study by Kawamura et al. (2007), who reported that the solution pH and reaction temperature strongly influence the morphology of aluminum phosphate crystals [18]. Similar to the strong crystalline properties of PPVA-AlPO4 nanocomposites under alkaline conditions, Jiang et al. (2013) also indicated the increase of crystallinity with the decrease of pH [19], and the reduction of particle size with pH increase was reported by Palacios et al. (2013) [16].
In this study, the PPVA-AlPO4 nanocomposite was successfully synthesized at lower temperature conditions and by using PPVA as a capping agent to cleave the bonding between the nitrates and further accelerate the dissociation of Al3+ ions from AlNO3 salt. At a neutral pH of 7, the slow release of Al3+ ions from the AlNO3 salt produces spherical shape nanoparticles, and with an increase of pH (above 7), a significant change to the particle size and phase morphology was observed. Hence, the PPVA-AlPO4 nanocomposite samples consist of spherical particles with laminar layers. The observed changes to the particle size, layer phase, and associated morphology of PPVA-AlPO4 nanocomposite (Figure 5, Figure 6 and Figure 7) are discussed considering the formation of AlPO4 which can directly influence the concentration building unit (Al−OH and Al−PO4) in the reaction mixture [20]. In addition, the influence of pH on the ionization of phosphoric acid to dihydrogen phosphate, hydrogen phosphate, and conjugate base PO43− is also affected due to the alkaline environment, i.e., phosphoric acid to PO43− is maximized at pH > 7 [17]. The AlPO4 nucleation process is halted when all the available Al3+ and most free OH ions are reacted. However, for the PPVA-AlPO4 nanocomposite, the ideal pH was found to be 10, where spherical shape particles with homogeneous distribution were observed (FESEM). These findings were supported by the thermal and XRD studies with the occurrence of maximum bonding between PPVA and AlPO4. Recently, similar findings have reported similarly shaped structures known as coral reef-like structures with superior corrosion protection properties [7]. Thus, the effect of pH plays an important role in the properties of the PPVA-AlPO4 nanocomposite.

4. Conclusions

In summary, the present study of PPVA-AlPO4 nanocomposite formation over a pH range of 7–12 without heat treatment indicated the generation of maximum weight residue from the sample formed at pH 10 due to the enhanced interaction and bonding. Moreover, the XRD analysis provided information about the crystalline nature of samples and the calculated crystallite size, indicating the development of two different microstructures due to the aggregation and agglomeration of small particles in the alkaline region, i.e., from pH 7 to 9 and 10 to 12. Such a development of microstructures in the PPVA-AlPO4 nanocomposite was affected by the amount of H+ and OH ions varying due to the changes in pH. In addition, the FESEM analysis provided the morphology of the as-prepared samples and indicated the spherical shape (similar to the XRD data) and homogenous distribution of particles for the sample prepared at pH 10. The influence of pH by means of the shifting of C-O-P-Al and O-P-O-Al bands to the higher and lower wavenumber side was recorded with FTIR spectra in the two pH regions of 7–9 and 10–12. This can be linked to the effects of H+ and OH ions. The optical properties of the formed nanocomposites studied by UV-Vis spectroscopy show no shifting of the 208 nm peak, but the peak intensity has similar effects, as observed by the XRD and FTIR analyses. Thus, from the cumulative analysis, it can be concluded that the pH of precipitation affected the reaction between PPVA and AlNO3 salt, and thereby allowed to observe the PPVA-AlPO4 nanocomposite with varied morphology and particle sizes due to the influence of H+ and OH ions fluctuated by the pH change.

Author Contributions

A.M.S.: Conceptualization, methodology, and Original draft preparation; M.S.K.: Formal analysis, Visualization, and Investigation; N.A.H.: Investigation, Data curation, and Visualization; I.A.B.: Funding acquisition; N.G.: Formal analysis, Data curation, Visualization, and Validation; S.S.: Data curation, Validation, and writing—Reviewing and Editing; S.K.: Funding acquisition; T.M.Y.K.: Funding acquisition; M.R.J.: Supervision, Formal analysis, Conceptualization, methodology, and Original draft preparation. All authors have read and agreed to the published version of the manuscript.

Funding

This work was financially supported by UM PPP Grant (PS115-2010B & PV129/2012A), UM High Impact Research Grant (UM. C/625/1/HIR-Eng-12). Deanship of Scientific Research at King Khalid University, grant number R.G.P. 1/101/42.

Institutional Review Board Statement

Not applicable.

Informed Consent Statement

Not applicable.

Data Availability Statement

All data generated or analysed during this study are included in this published article.

Acknowledgments

The authors extend their appreciation to the Deanship of Scientific Research at King Khalid University for funding this work through the research groups program under grant number R.G.P. 1/101/42. The authors acknowledge the Malaysian Institute of Marine Engineering Technology and University of Malaya.

Conflicts of Interest

The authors declare no conflict of interest with this work.

References

  1. Shen, J.; Zhang, P.; Song, L.; Li, J.; Ji, B.; Li, J.; Chen, L. Polyethylene glycol supported by phosphorylated polyvinyl alcohol/graphene aerogel as a high thermal stability phase change material. Compos. Part B Eng. 2019, 179. [Google Scholar] [CrossRef]
  2. Sayyedan, F.S.; Enayati, M.H. On structure and oxidation behaviour of non-stoichiometric amorphous aluminium phosphate coating. Surf. Eng. 2019, 35, 670–676. [Google Scholar] [CrossRef]
  3. Li, Y.; Chen, G.; Zhu, S.; Li, H.; Ma, Z.; Liu, Y.; Liu, L. Preparation of an aluminium phosphate binder and its influence on the bonding strength of coating. Bull. Mater. Sci. 2019, 42, 1–8. [Google Scholar] [CrossRef] [Green Version]
  4. Khadom, A.A.; Farhan, S.N. Corrosion inhibition of steel in phosphoric acid. Corros. Rev. 2018, 36, 267–280. [Google Scholar] [CrossRef]
  5. Stöckel, S.; Ebert, S.; Böttcher, M.; Seifert, A.; Wamser, T.; Krenkel, W.; Schulze, S.; Hietschold, M.; Gnaegi, H.; Goedel, W.A. Coating of alumina fibres with aluminium phosphate by a continuous chemical vapour deposition process. Chem. Vap. Depos. 2014, 20, 388–398. [Google Scholar] [CrossRef]
  6. Saat, A.M.; Johan, M.R. The surface structure and thermal properties of novel polymer composite films based on partially phosphorylated poly (vinyl alcohol) with aluminum phosphate. Sci. World J. 2014, 2014, 1–7. [Google Scholar] [CrossRef] [PubMed] [Green Version]
  7. Kaseem, M.; Hussain, T.; Baek, S.H.; Ko, Y.G. Formation of stable coral reef-like structures via self-assembly of functionalized polyvinyl alcohol for superior corrosion performance of AZ31 Mg alloy. Mater. Des. 2020, 193, 108823. [Google Scholar] [CrossRef]
  8. Aslam, M.; Kalyar, M.A.; Raza, Z.A. Polyvinyl alcohol: A review of research status and use of polyvinyl alcohol based nanocomposites. Polym. Eng. Sci. 2018, 58, 2119–2132. [Google Scholar] [CrossRef]
  9. Sanchez, C.; Rozes, L.; Ribot, F.; Laberty-Robert, C.; Grosso, D.; Sassoye, C.; Boissiere, C.; Nicole, L. Chimie douce: A land of opportunities for the designed construction of functional inorganic and hybrid organic-inorganic nanomaterials. Comptes Rendus Chim. 2010, 13, 3–39. [Google Scholar] [CrossRef] [Green Version]
  10. Lv, Z.; Liu, H.; Zhang, X.; Wen, R.; He, C.; Yin, Z.; Liu, Y.-G.; Fang, M.; Wu, X.; Min, X. Growth mechanism and synchronous synthesis of 1D β-sialon nanostructures and β-sialon-Si3N4 composite powders by a process of reduction nitridation. Mater. Res. Express 2019, 6, 065054. [Google Scholar] [CrossRef]
  11. Son, H.-W.; Berthebaud, D.; Yubuta, K.; Yoshikawa, A.; Shishido, T.; Suzuta, K.; Mori, T. New synthesis route for complex borides; rapid synthesis of thermoelectric yttrium aluminoboride via liquid-phase assisted reactive spark plasma sintering. Sci. Rep. 2020, 10, 8914. [Google Scholar] [CrossRef] [PubMed]
  12. Saat, A.M.; Johan, M.D. Enhanced thermal and structural properties of partially phosphorylated polyvinyl alcohol—Aluminum phosphate (PPVA-AlPO4) nanocomposites with aluminium nitrate source. AIP Conf. Proc. 2017, 1901, 130011. [Google Scholar]
  13. Chen, D.; He, L.; Shang, S. Study on aluminum phosphate binder and related Al2O3-SiC ceramic coating. Mater. Sci. Eng. A 2003, 384, 29–35. [Google Scholar] [CrossRef]
  14. Mekky, W.; Nicholson, P.S. Nano-aluminum-phosphate via a polymerized organic–inorganic complex route. J. Mater. Process. Technol. 2007, 190, 393–396. [Google Scholar] [CrossRef]
  15. Burrell, L.; Johnston, C.; Schulze, D.; Klein, J.; White, J.L.; Hem, S.L. Aluminium phosphate adjuvants prepared by precipitation at constant pH. Part II: Physicochemical properties. Vaccine 2001, 19, 282–287. [Google Scholar] [CrossRef]
  16. Palacios, E.; Leret, P.; María, J.; Fernández, J.F.; Antonio, H.; Rodríguez, M.A. Influence of the pH and ageing time on the acid aluminum phosphate synthesized by precipitation. CrystEngComm 2013, 15, 3359–3365. [Google Scholar] [CrossRef]
  17. Kandori, K.; Ikeguchi, N.; Yasukawa, A.; Ishikawa, T. Control of size and adsorptive properties of spherical aluminum phosphate particles. J. Colloid Interface Sci. 1996, 430, 425–430. [Google Scholar] [CrossRef]
  18. Kawamura, K.; Shibuya, K.; Okuwaki, A. Morphology of aluminum phosphate by the Al-EDTA mediated particle formation in aqueous solutions at high temperatures. Mater. Res. Bull. 2007, 42, 256–264. [Google Scholar] [CrossRef]
  19. Jiang, S.; Zhou, K.; Shi, Y.; Hong, N.; Lo, S.; Hu, Y.; Gui, Z. 2D Lamellar Aluminophosphate Nanolayers for Enhancing Flame Retardancy and Mechanical Properties of Polymers. Ind. Eng. Chem. Res. 2013, 52, 16766–16773. [Google Scholar] [CrossRef]
  20. Ganschow, M.; Schulz-Ekloff, G.; Wark, M.; Wendschuh-Josties, M.; Wöhrle, D. Microwave-assisted preparation of uniform pure and dye-loaded AlPO4-5 crystals with different morphologies for use as microlaser systems. J. Mater. Chem. 2001, 11, 1823–1827. [Google Scholar] [CrossRef]
Figure 1. Flowchart of synthesis and characterization of PPVA-AlPO4 nanocomposites.
Coatings 11 01105 g001
Figure 2. Thermal analysis curves (a) TGA and (b) SDTA PPVA-AlPO4 nanocomposites samples with different pH.
Coatings 11 01105 g002
Figure 3. XRD patterns for PPVA-AlPO4 nanocomposite samples at different pH values (a) pH 7; (b) pH 8; (c) pH 9; (d) pH 10; (e) pH 11; (f) pH 12.
Coatings 11 01105 g003
Figure 4. Crystallite size distribution for PPVA-AlPO4 nanocomposites at different pH values (7–12).
Coatings 11 01105 g004
Figure 5. FTIR spectra for as prepared PPVA-AlPO4 nanocomposite samples at different pH values (a) 7; (b) 8; (c) 9; (d) 10; (e) 11; (f) 12.
Coatings 11 01105 g005
Figure 6. Selective FTIR bands of PPVA-AlPO4 nanocomposite samples prepared at pH 7, 8, 9, 10, 11 and 12. (a) OH; (b) C=OH & PO−AlPO4; (c) C−O−P−AlPO4 & O−P−O−AlPO4.
Coatings 11 01105 g006
Figure 7. UV-vis spectra for PPVA-AlPO4 nanocomposite samples at different pH values (a) 7; (b) 8; (c) 9; (d) 10; (e) 11; (f) 12.
Coatings 11 01105 g007
Figure 8. FESEM micrographs of PPVA-AlPO4 nanocomposite samples formed from different pH of (a) 7; (b) 8; (c) 9; (d) 10; (e) 11; and (f) 12 at 50 k magnification.
Coatings 11 01105 g008
Figure 9. FESEM micrographs of PPVA-AlPO4 nanocomposite samples formed from different pH of (a) 7; (b) 8; (c) 9; (d) 10; (e) 11, and (f) 12 at 100 k magnification.
Coatings 11 01105 g009
Figure 10. FESEM micrographs of PPVA-AlPO4 nanocomposite samples formed from different pH of (a) 7; (b) 8; (c) 9; (d) 10; (e) 11 and (f) 12 at 200 k magnification.
Coatings 11 01105 g010
Table 1. Visual observation of as prepared and heat-treated samples at 120 °C for various pH values.
SamplespH < 1
(Initial)
KOH Volume (mL)pH (Intermediate)Appearance
As preparedpH 7Colourless solution126.507.13White solution
pH 8Colourless solution1298.16White solution
pH 9Colourless solution131.209.22White solution
pH 10Colourless solution132.9010.17White solution
pH 11Colourless solution13511.18White solution
pH 12Colourless solution139.9012White solution
pH 13Colourless solution>15013Colourless solution
Table 2. Thermal properties of SDTA and TGA for PPVA-AlPO4 nanocomposite for various pH.
Thermal PropertiespH 7pH 8pH 9pH 10pH 11pH 12
SDTAT (°C)T (°C)T (°C)T (°C)T (°C)T (°C)
130–250(broad endothermic peak)30–250(broad endothermic peak)30–250(broad endothermic peak)30–250(broad endothermic peak)30–250(broad endothermic peak)30–250(broad endothermic peak)
2250 weak broad (endo)250 weak broad (endo)250 weak broad (endo)285 intense (endo)285 intense (endo)280 intense (endo)
3Broad less intense exothermic peak at 400–460Broad less intense exothermic peak at 400–460Broad less intense exothermic peak at 400–460Broad less intense exothermic peak at 400–460 (455)Broad less intense exothermic peak at 400–460410 small exothermic peak
4680670670680680770(exo)
TGAT (°C)Weight Residue (%)T (°C)Weight Residue (%)T (°C)Weight Residue (%)T (°C)Weight Residue (%)T (°C)Weight Residue (%)T (°C)Weight Residue (%)
1st stage0–260280–260370–260380–280210–260250–26027
2nd stage260–45011260–45010260–45011280–4809260–4808260–4809
3rd stage450–7008450–7009450–7008480–72011480–7209480–76012
Final Weight residue700–100053700–100056700–100057720–100059720–100058760–100052
Table 3. XRD data for 2θ value, d-spacing, and FWHM for PPVA-AlPO4 nanocomposite samples at different pH values (7–12).
Thermal PropertiespH 7pH 8pH 9pH 10pH 11pH 12
SDTAT (°C)T (°C)T (°C)T (°C)T (°C)T (°C)
130–250(broad endothermic peak)30–250(broad endothermic peak)30–250(broad endothermic peak)30–250(broad endothermic peak)30–250(broad endothermic peak)30–250(broad endothermic peak)
2250 weak broad (endo)250 weak broad (endo)250 weak broad (endo)285 intense (endo)285 intense (endo)280 intense (endo)
3Broad less intense exothermic peak at 400–460Broad less intense exothermic peak at 400–460Broad less intense exothermic peak at 400–460Broad less intense exothermic peak at 400–460 (455)Broad less intense exothermic peak at 400–460410 small exothermic peak
4680670670680680770(exo)
TGAT (°C)Weight Residue (%)T (°C)Weight Residue (%)T (°C)Weight Residue (%)T (°C)Weight Residue (%)T (°C)Weight Residue (%)T (°C)Weight Residue (%)
1st stage0–260280–260370–260380–280210–260250–26027
2nd stage260–45011260–45010260–45011280–4809260–4808260–4809
3rd stage450–7008450–7009450–7008480–72011480–7209480–76012
Final Weight residue700–100053700–100056700–100057720–100059720–100058760–100052
Table 4. Interpretation of PPVA-AlPO4 nanocomposite FTIR spectra at various pH values (7, 8, 9, 10, 11, and 12).
Band Assignment and Wavenumber
(cm−1)
SampleAl−OHOHAl−O–PH−O−HC−OH@ H−O−HP−O−AlPO4C−O−P−AlPO4HP−O−AlPO4O−P−O−AlPO4O−P−O−AlPO4
As preparedpH 7 33772202 164013721043822541
pH 8 3385 164313711046823552418
pH 9 33742253 164513711047823553435
pH 1037863381 164913721038823541419
pH 11 338122061730163513741044 543420
pH 12 3371 1740164513731027824533422
Publisher’s Note: MDPI stays neutral with regard to jurisdictional claims in published maps and institutional affiliations.

