
Plantar Pressure and Contact Area Measurement of Foot Abnormalities in Stroke Rehabilitation


 , ,
, ,
Abstract
:1. Introduction
2. Materials and Methods
2.1. Study Design
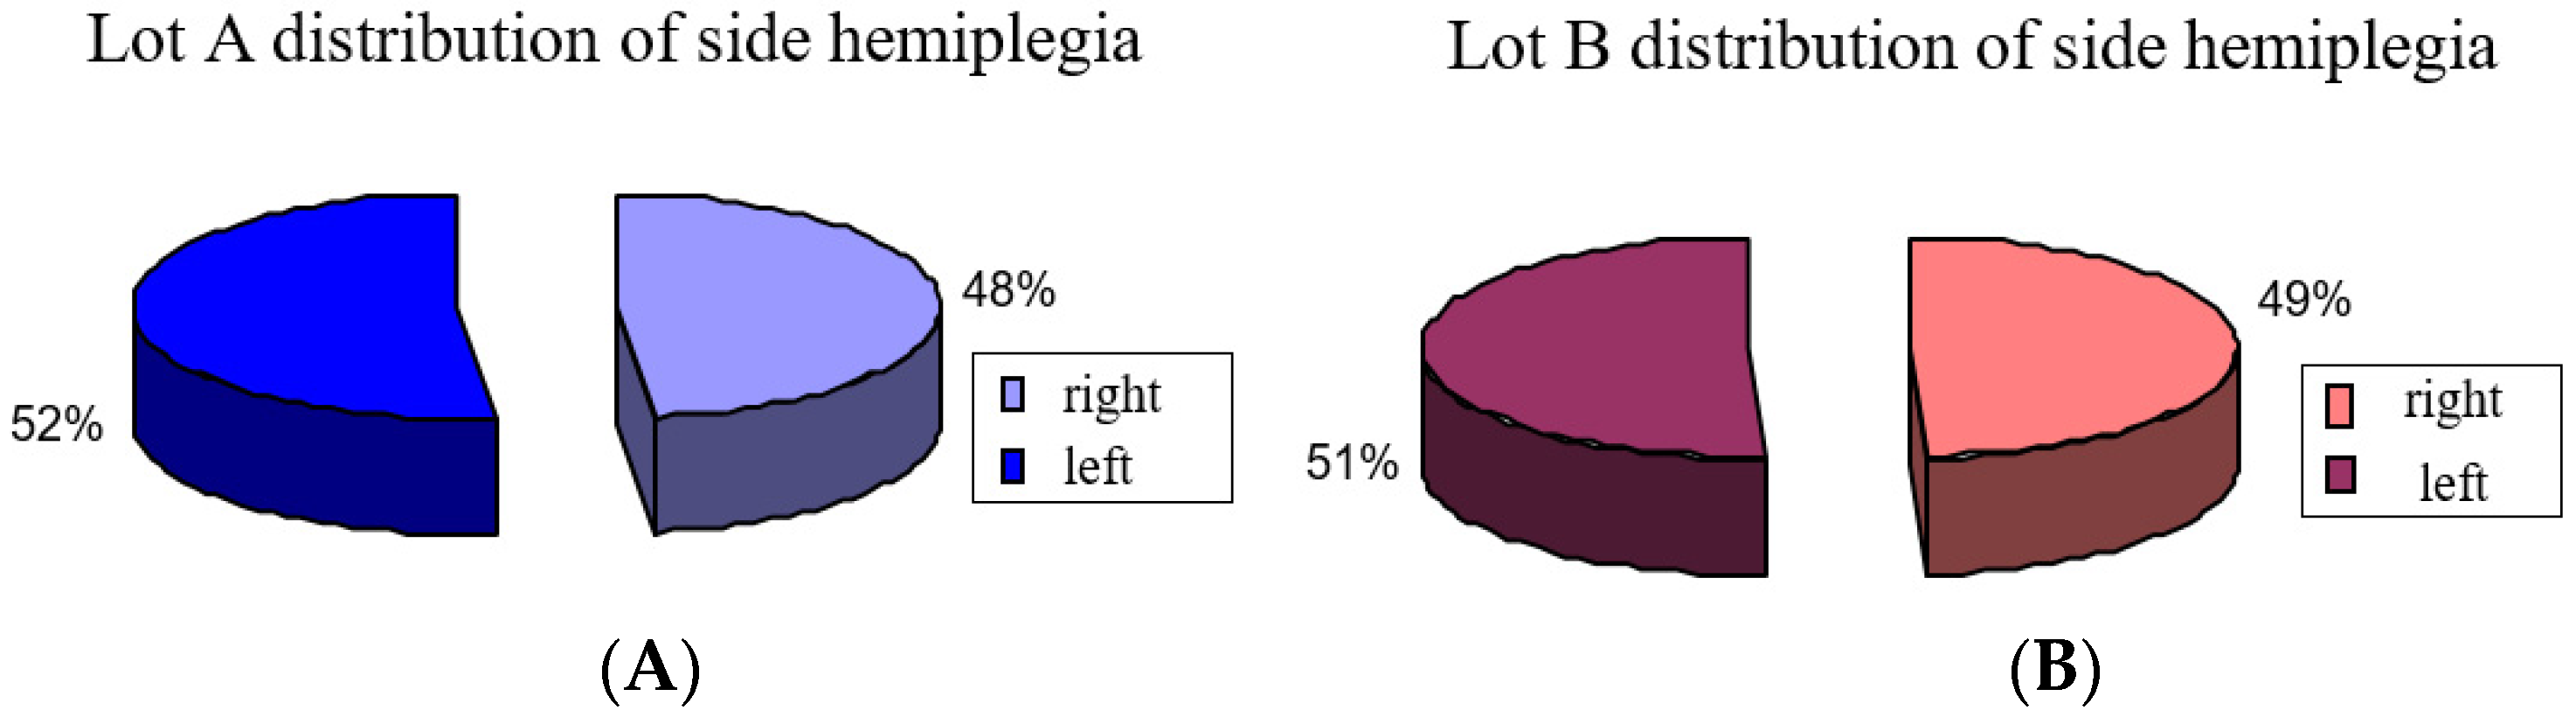
2.1.1. Subjects
- 0 is severe impairment;
- 1 is moderate impairment;
- 2 is mild impairment;
- 3 is normal locomotion.
- 1.
- Inclusion criteria:
- (1)
- Iskemic stroke;
- (2)
- Stability of neurologic lesion and vital function;
- (3)
- Minimum of 2 disability levels—the levels of disabilities take in consideration gait disorders and dificulties in transfer from sitting position to standing position;
- (4)
- Retaining of cognitive functions and communication skills for good cooperation with the physical therapist and active participation;
- (5)
- Tolerance to effort;
- (6)
- First presentation in rehabilitation unit;
- (7)
- Independent gait without assistive device.
- 2.
- Exclusion criteria
- (1)
- Haemoragic stroke;
- (2)
- Multiple stroke;
- (3)
- Other neurologic diseases that affect muscle mass;
- (4)
- Other diseases such as hepatitis and renal failure;
- (5)
- Lack of family agreement.
2.1.2. Evaluation Methods
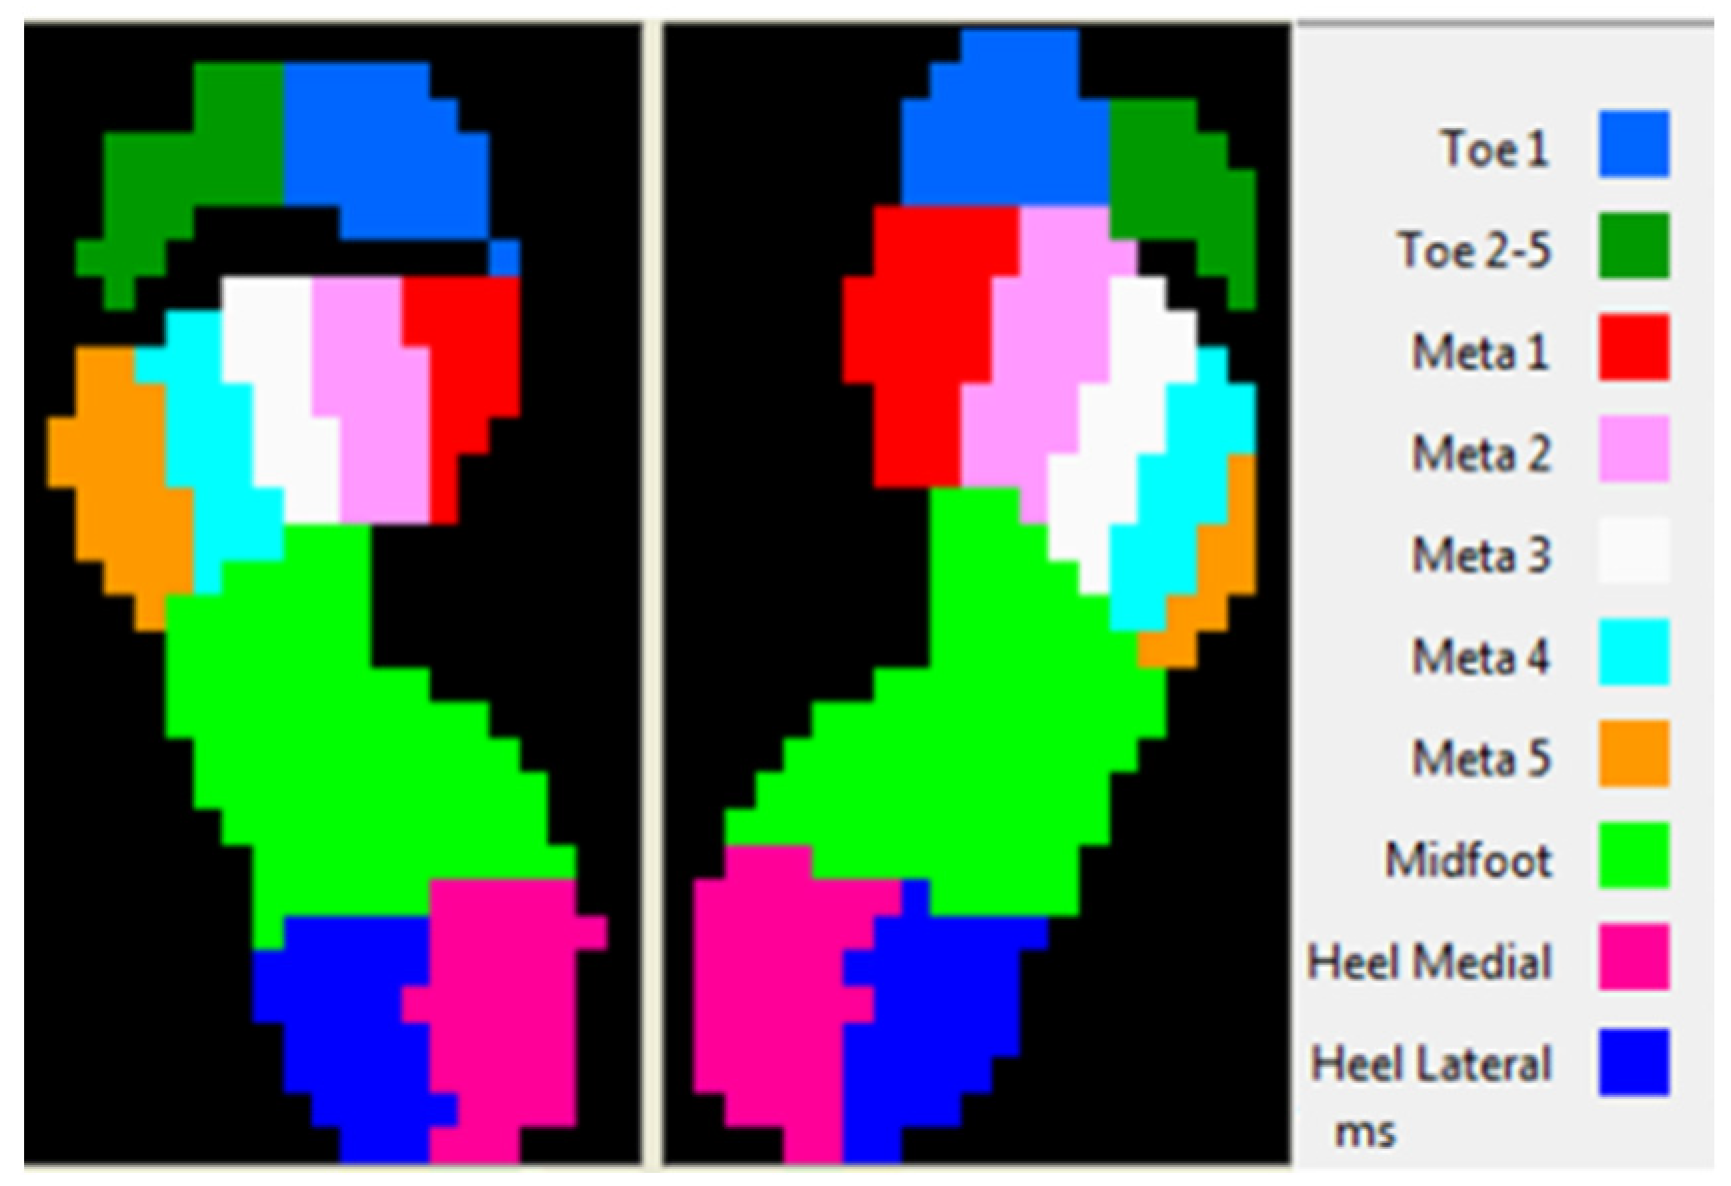
2.1.3. Biomechanical Evaluation
2.1.4. Biomechanical Parameters
- Maximal pressure for plantar regions: Pmax [N/cm2];
- Contact area, represents the area of contact for each plantar region: CA [cm2];
- Pressure distribution during gait;
- Center of pressure: COP.
- Common pattern of the heel contact;
- Constant speed.
- Lateral heel (HL);
- Medial heel (HM);
- Midfoot (MF);
- Toe 1;
- Toe 5.
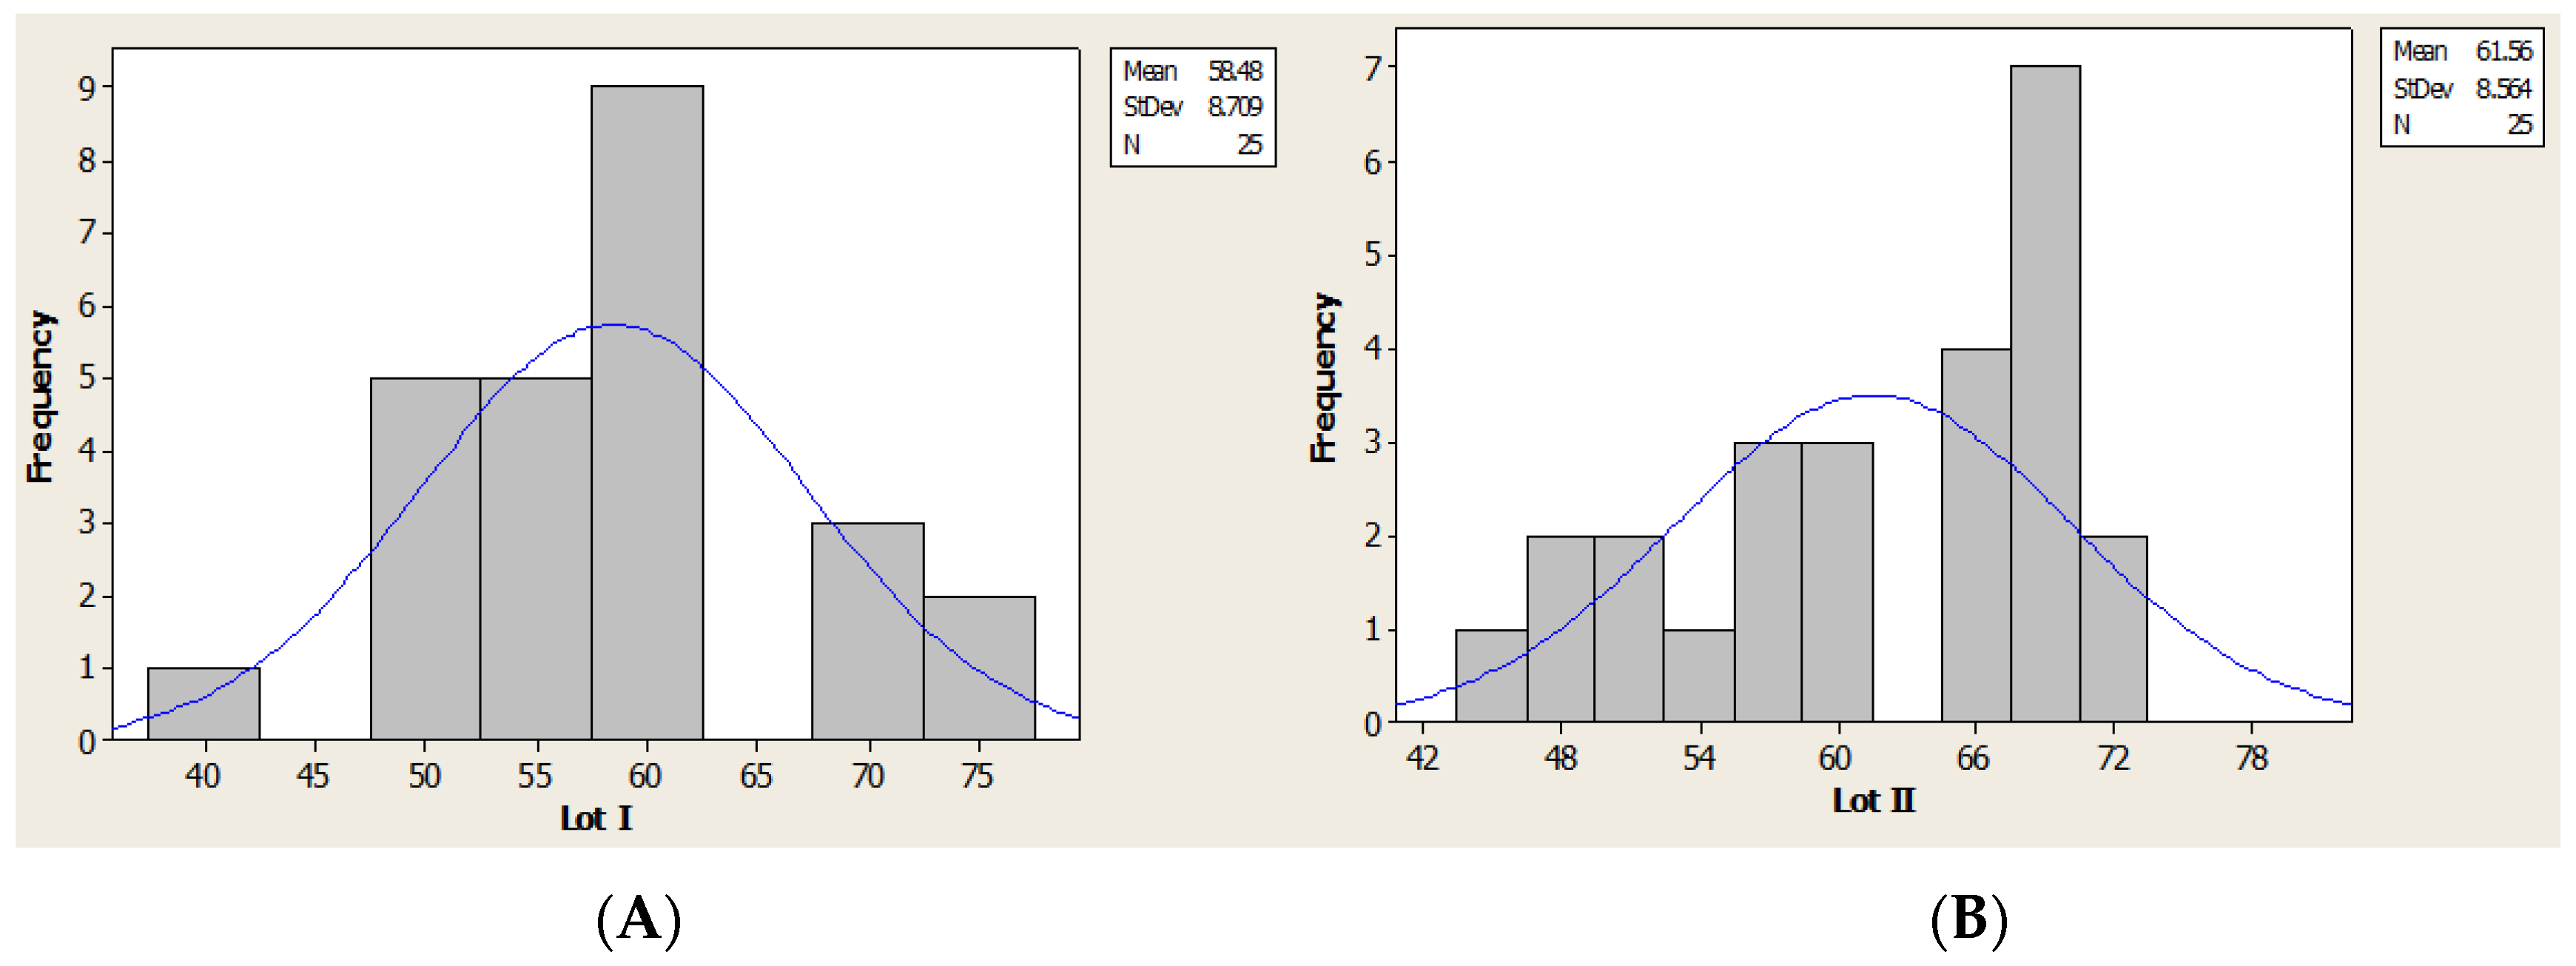
2.2. Statistic Method
3. Results
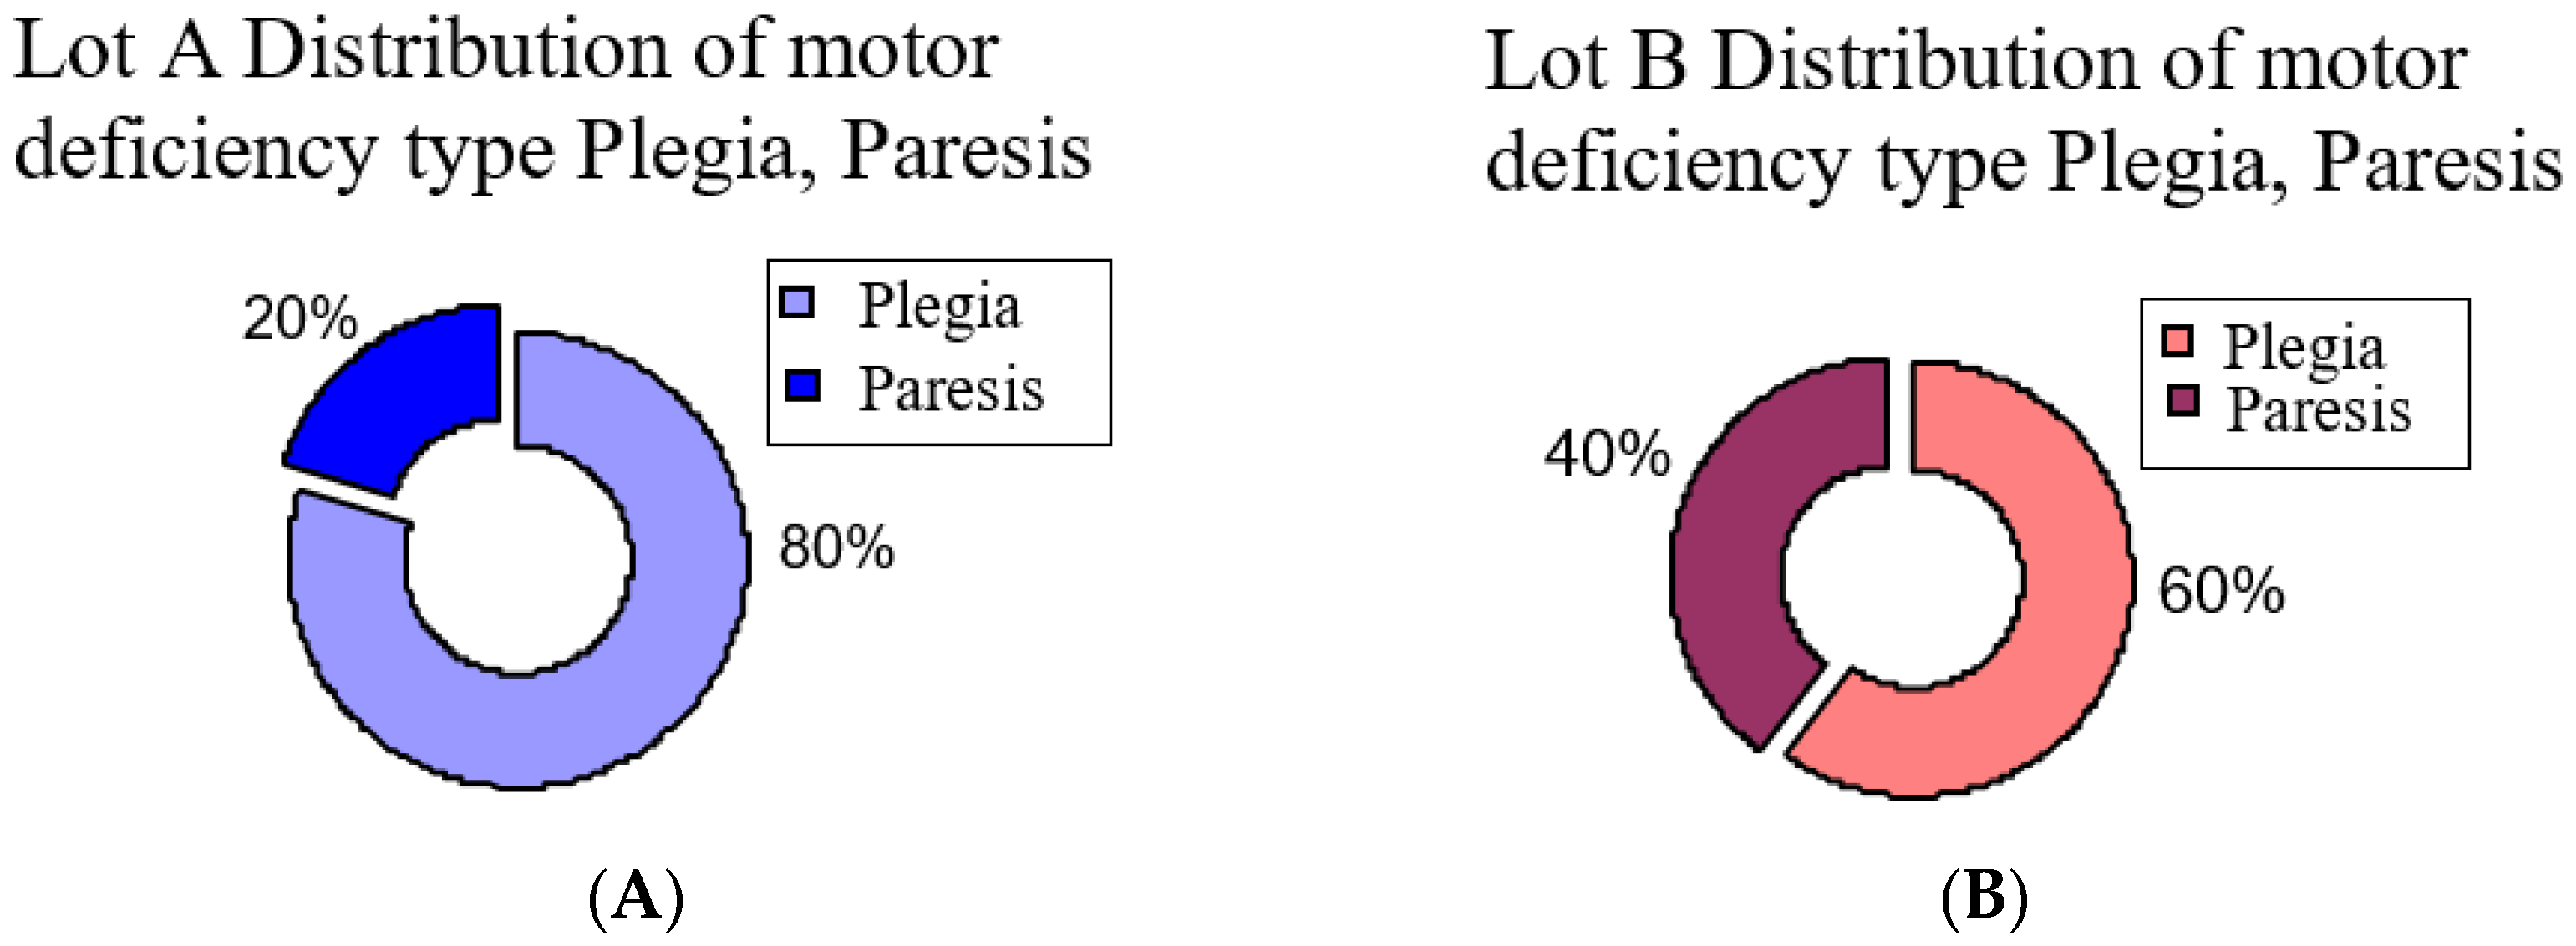
3.1. Statistic Analysis of the Patient Lots
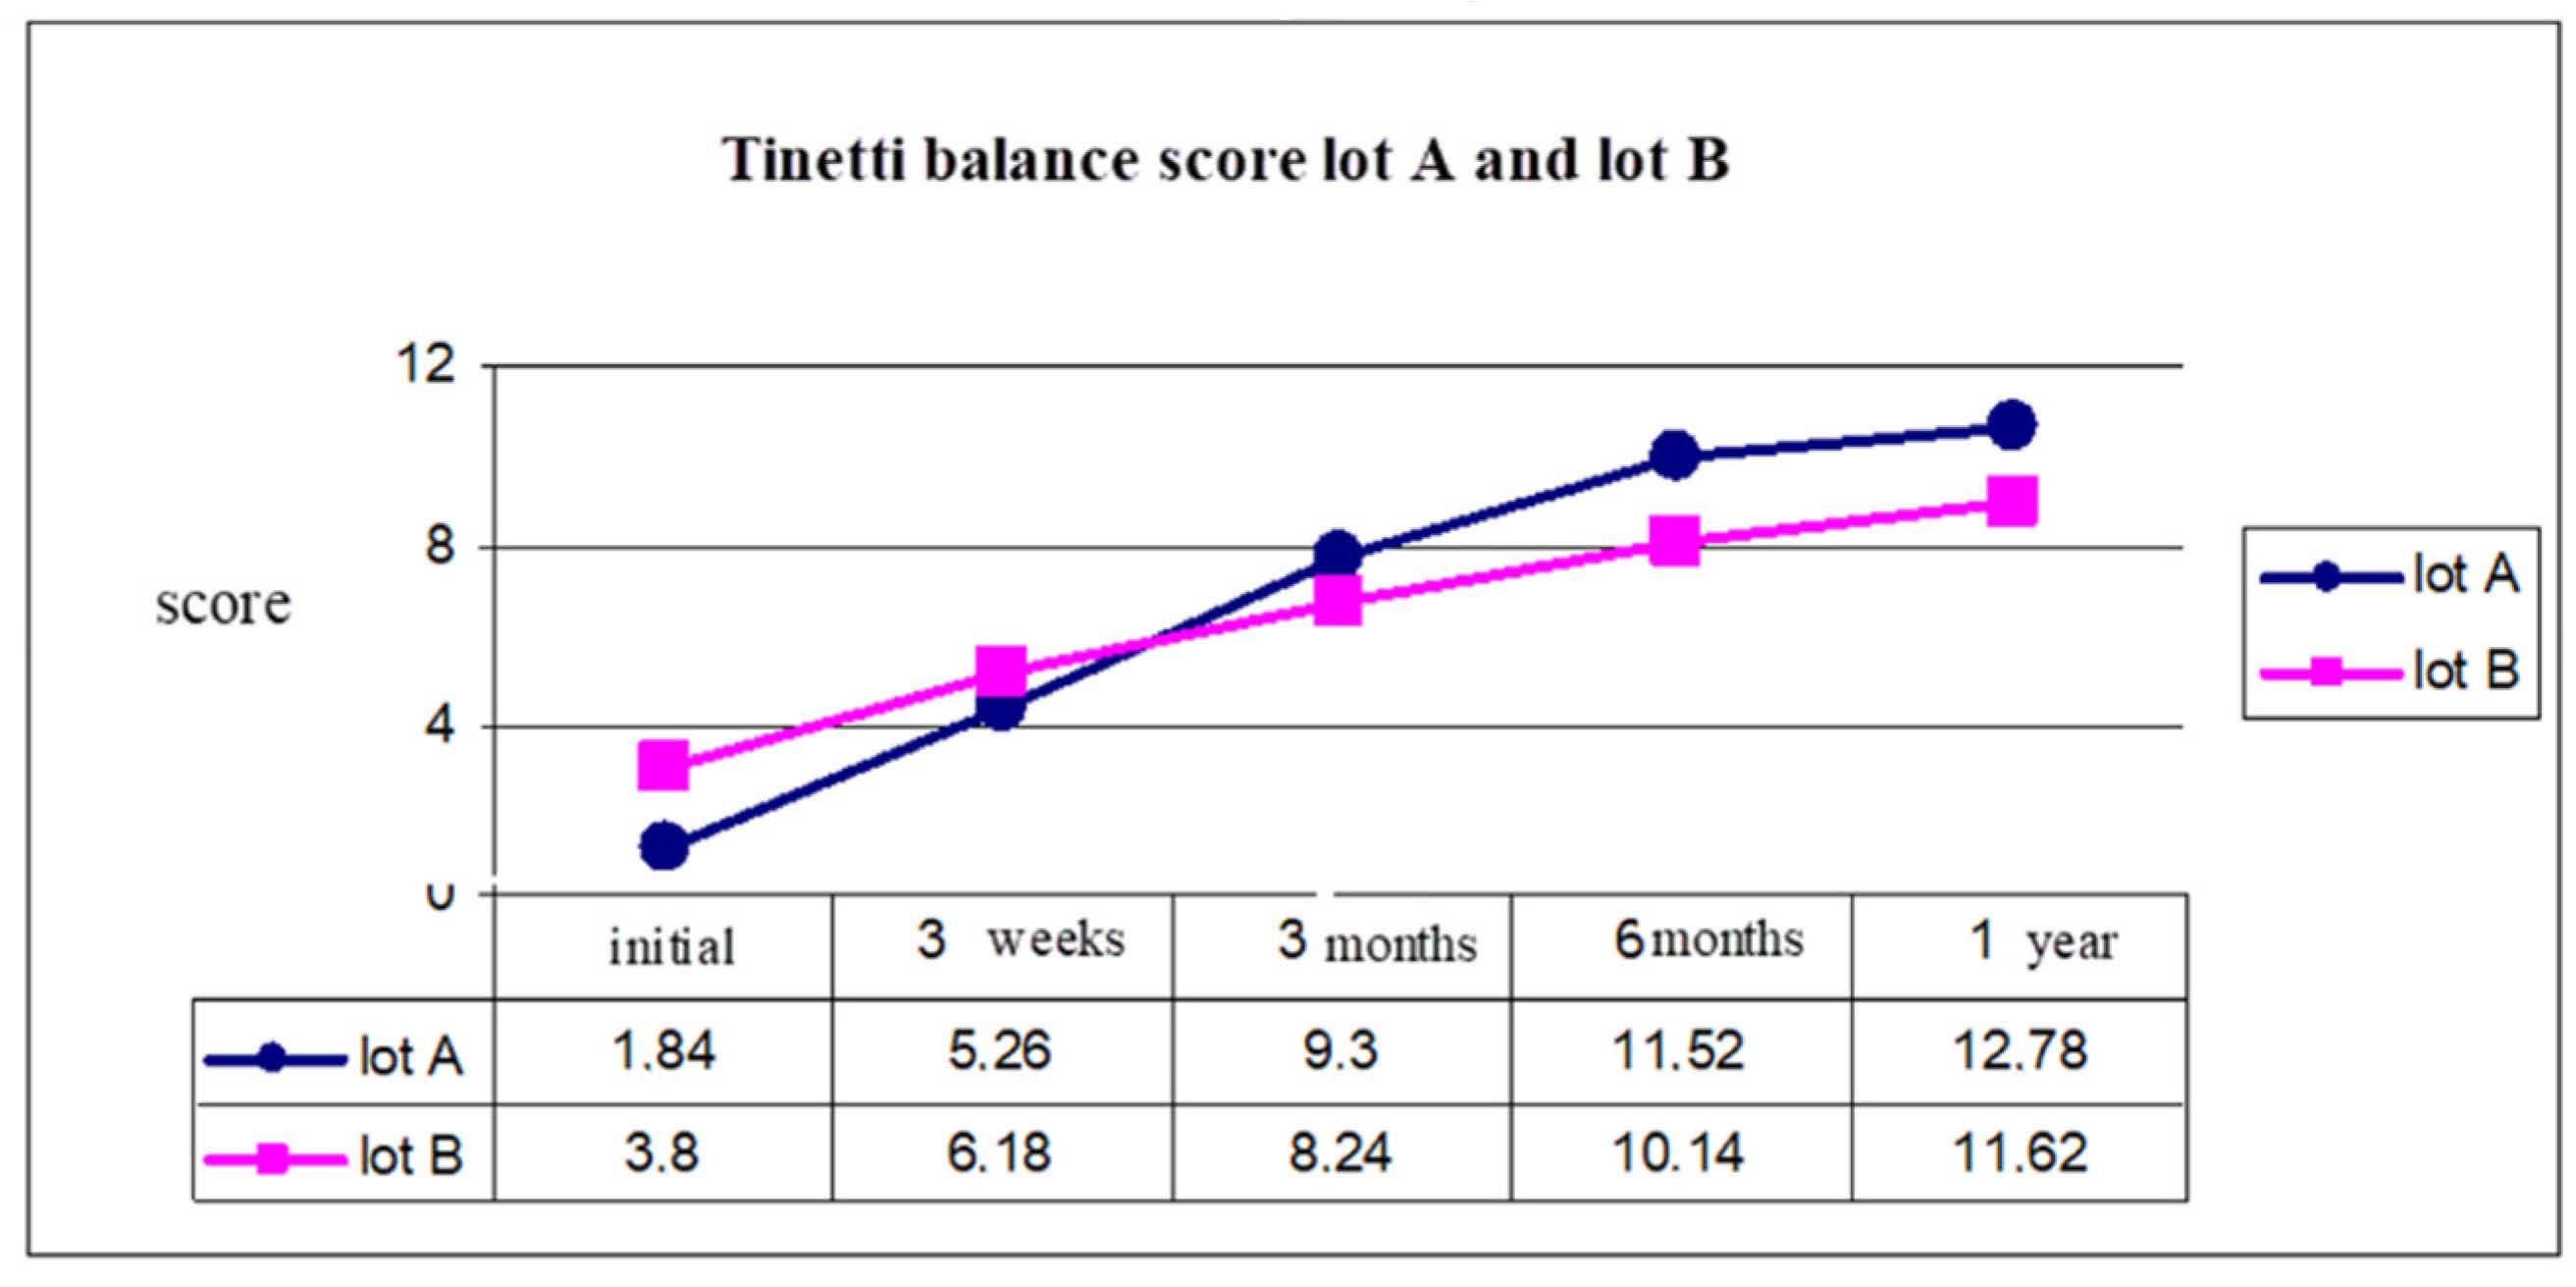
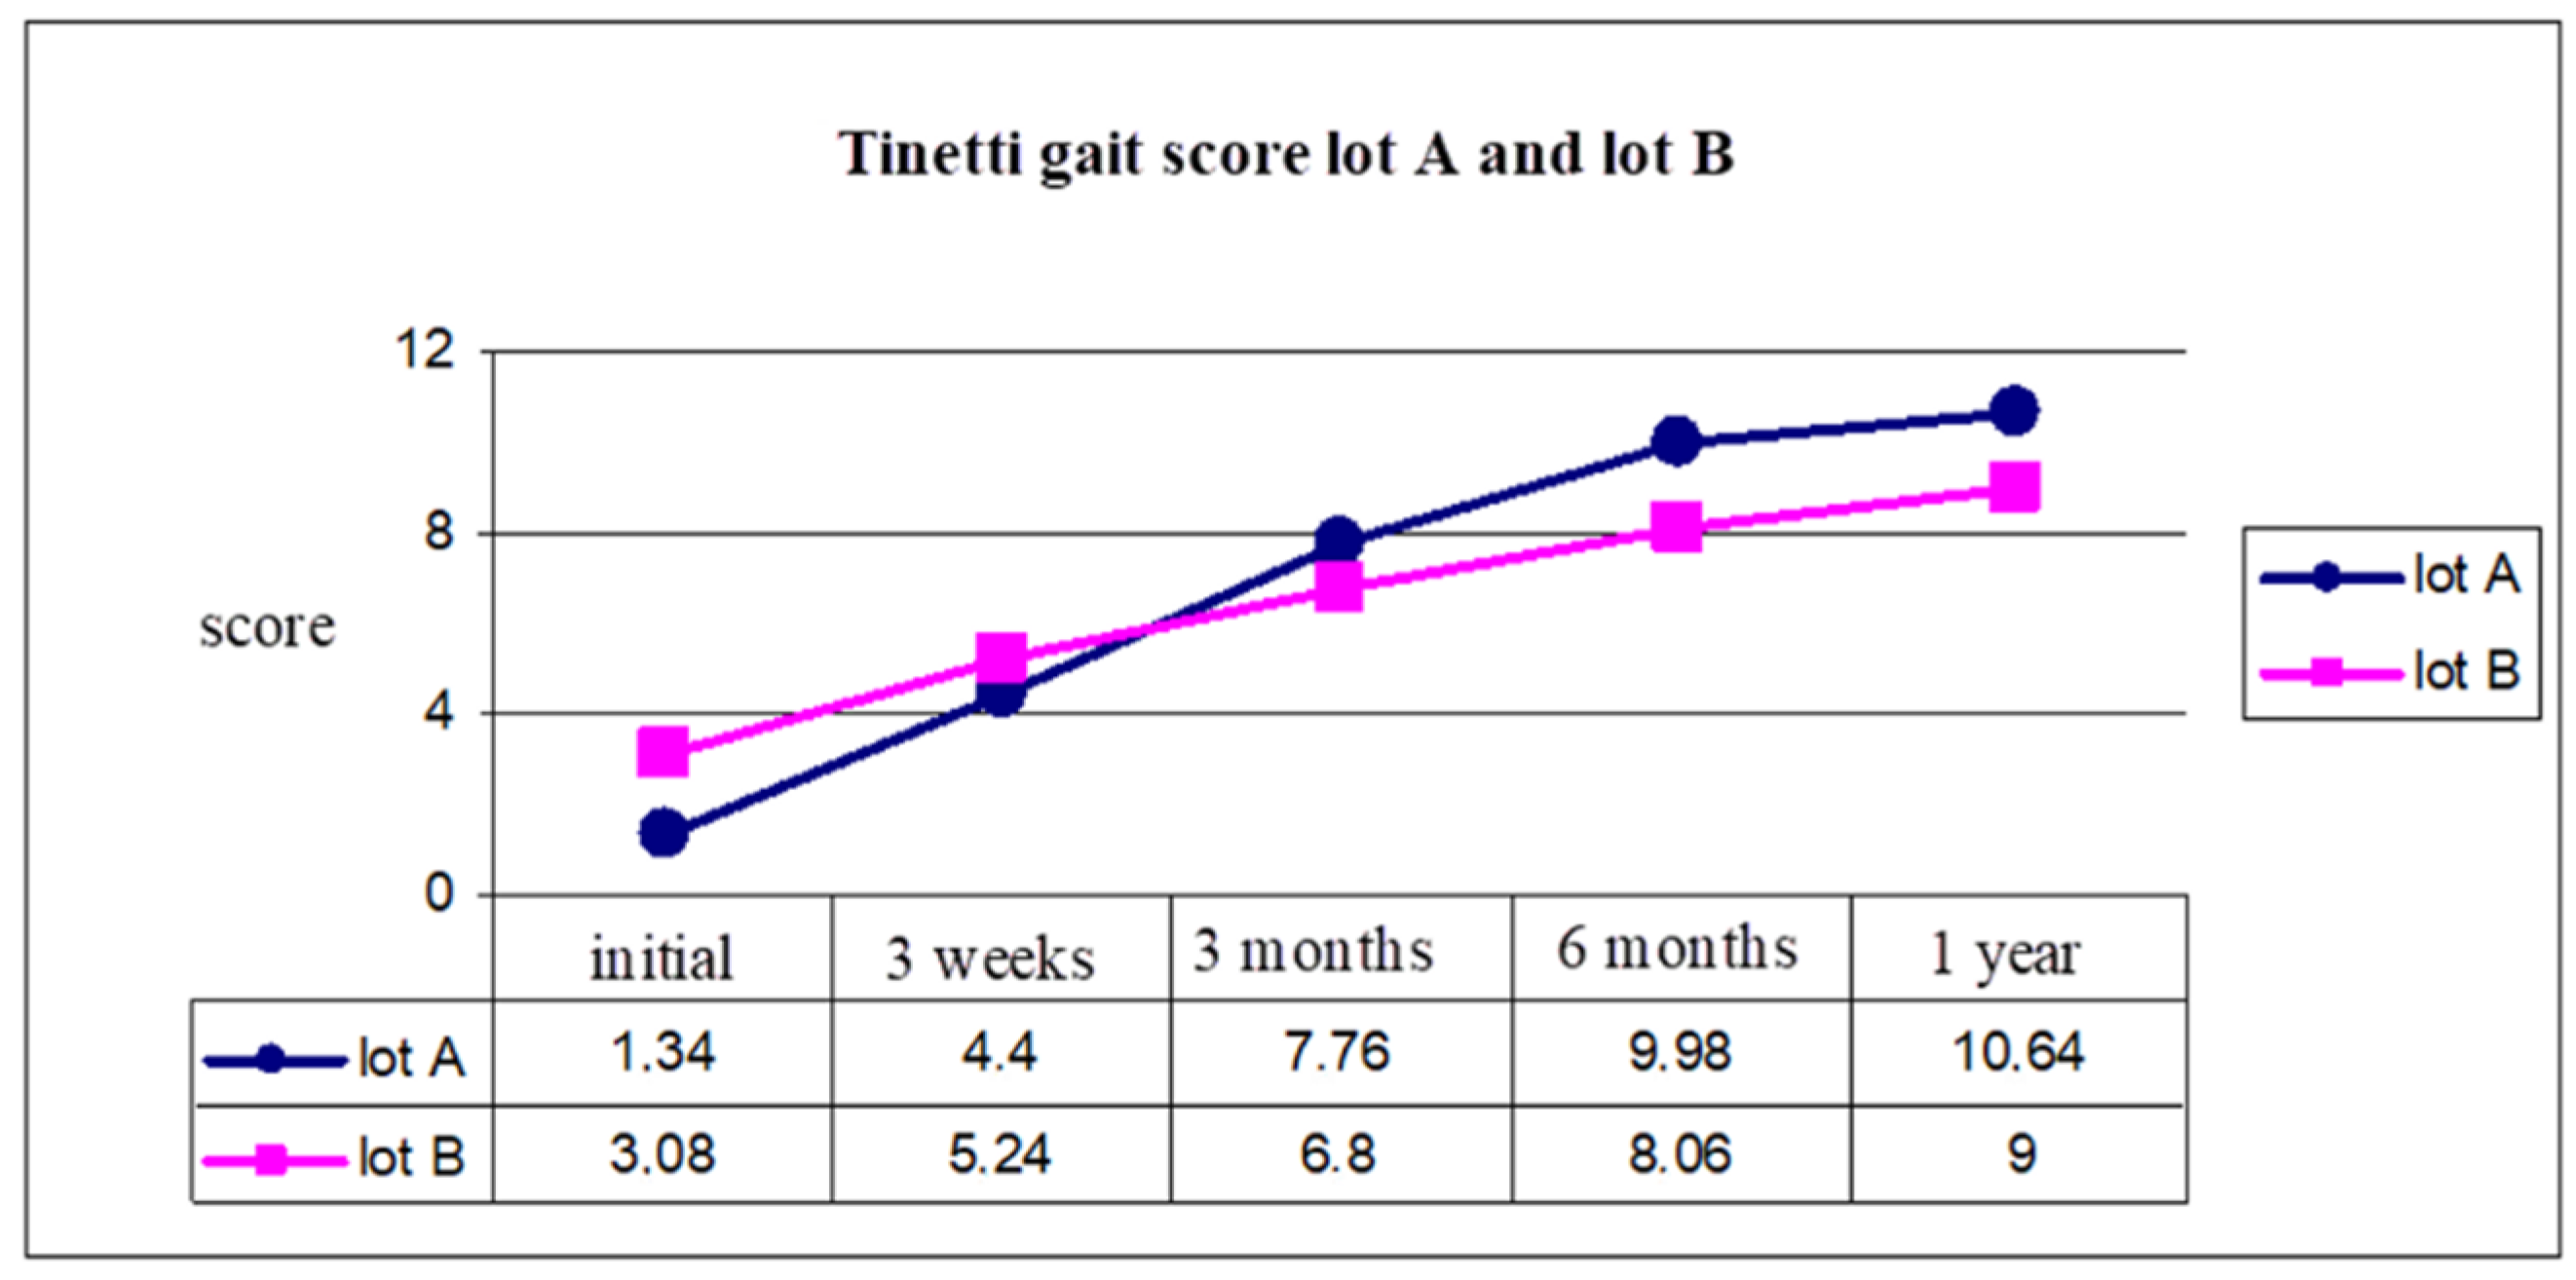
Clinical and Functional Results
3.2. Results of Biomechanic Assessment
3.2.1. Distribution of COP in Orthostatic Position
3.2.2. Statistic Analysis of Biomechanical Parameters
3.2.3. Lateral Heel Region
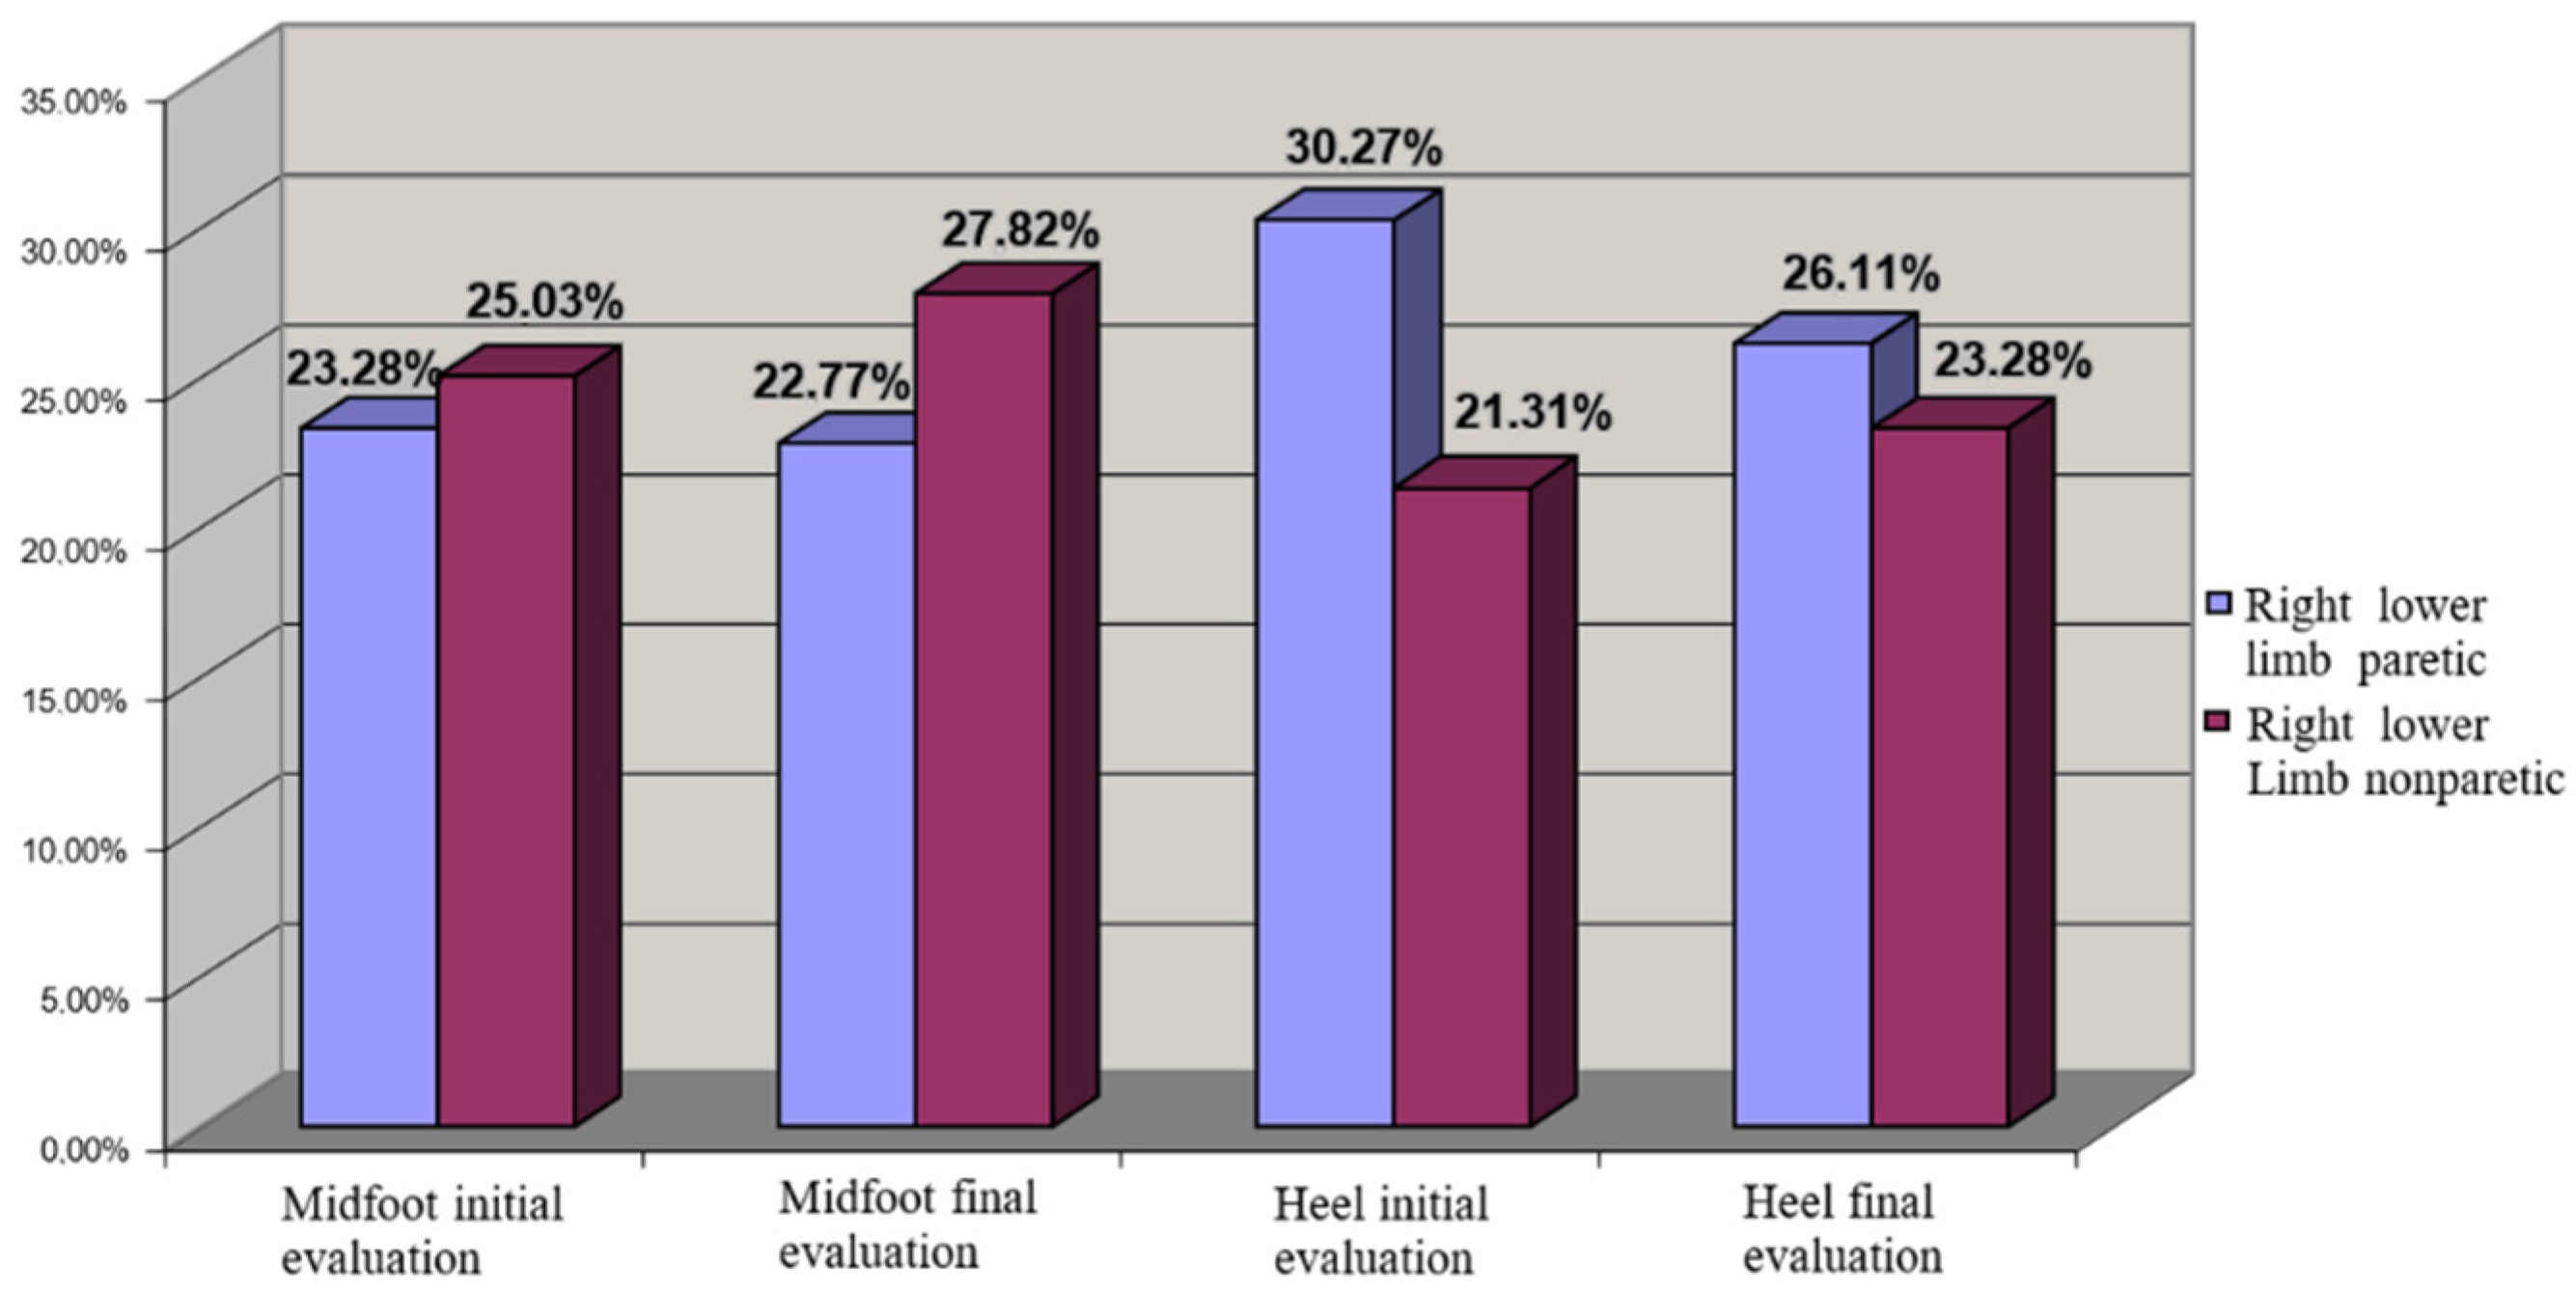
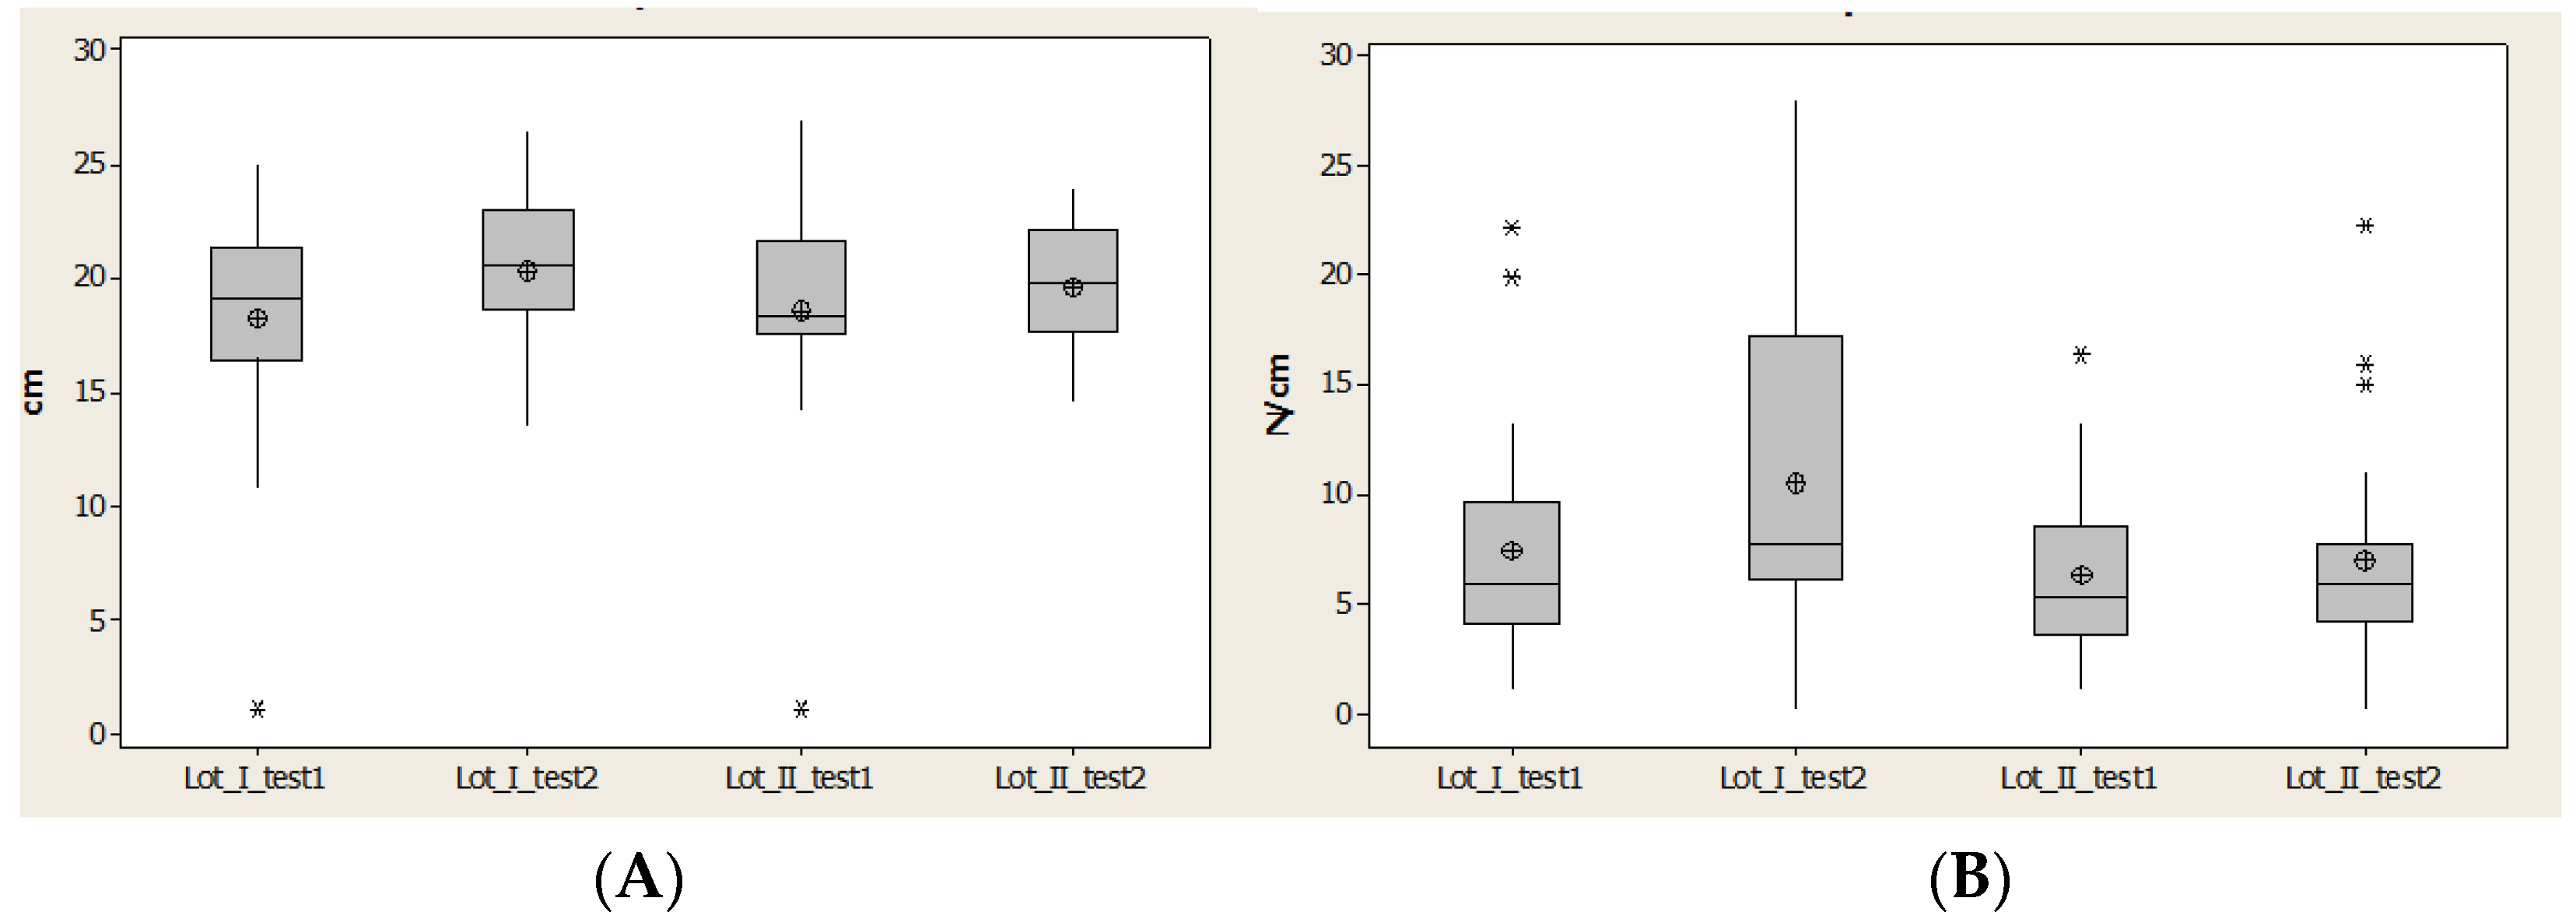
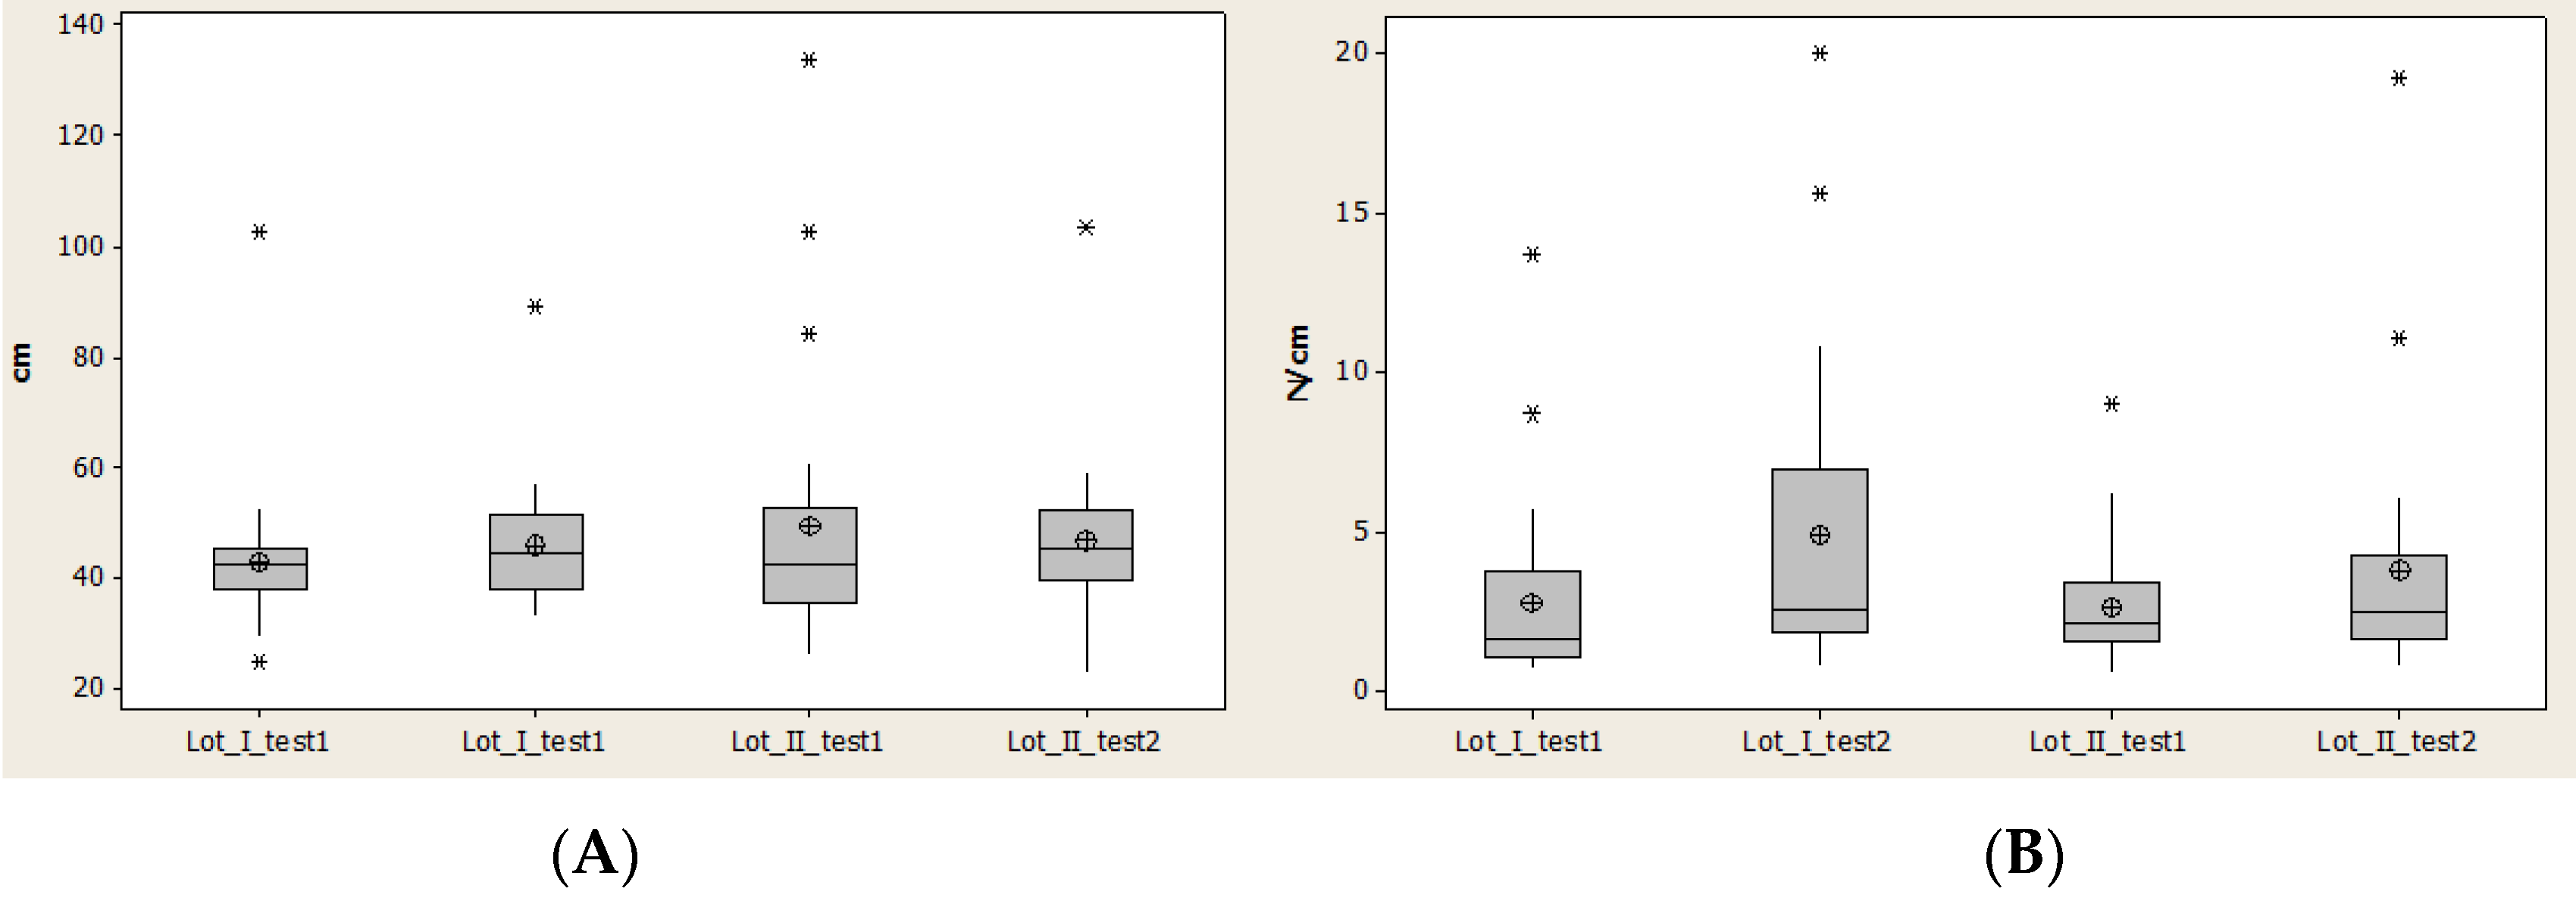
3.3. Midfoot Region
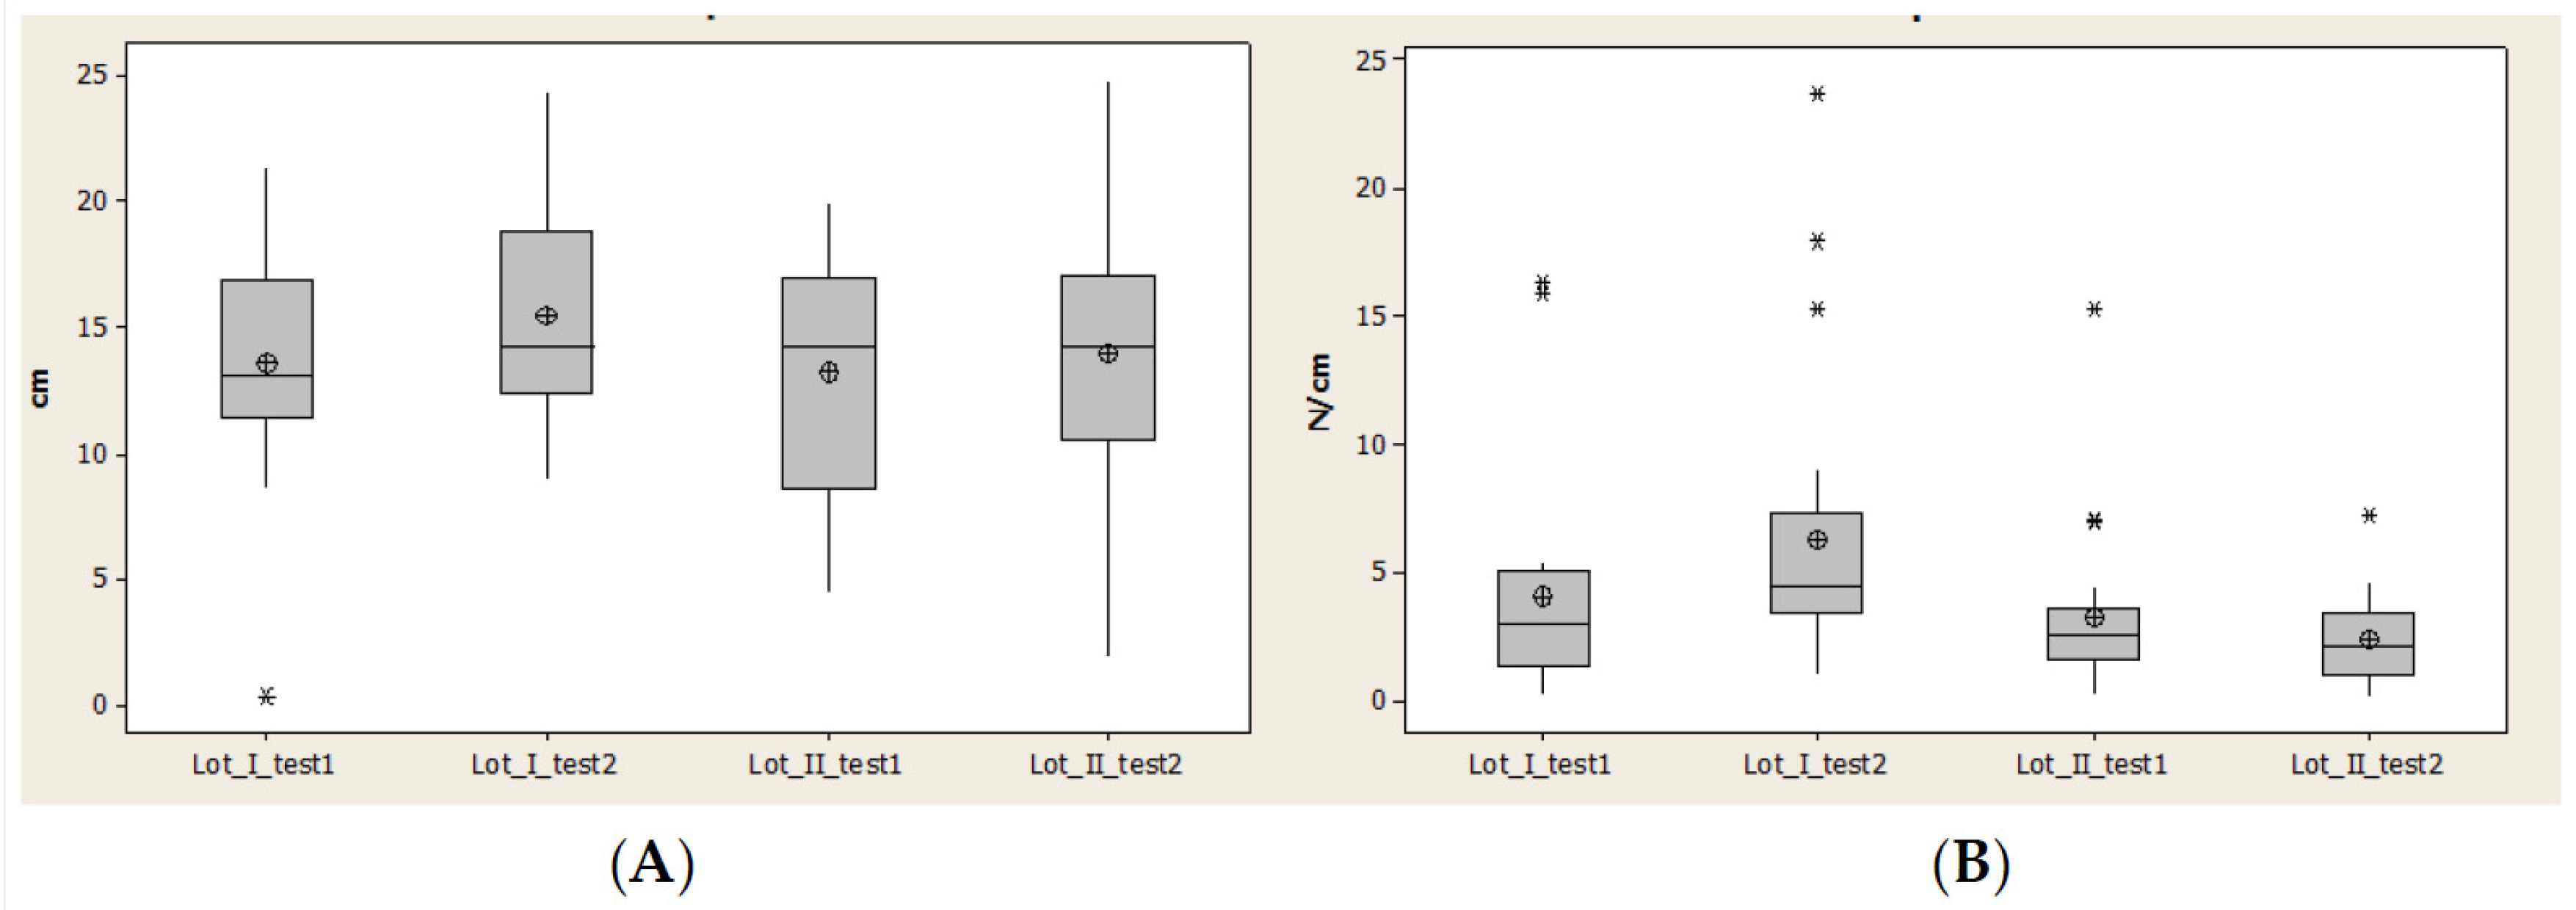
3.4. Region Meta 1
3.5. Region Meta 5
4. Discussion
- Lateral heel: significant increase of CA.
- Medial heel: in lot I was significant increase of CA and for lot II a decrease.
- Midfoot: greater increase of the CA for lot I than lot II, which means significant motor deficiency in lot II, due to spasticity of triceps sural.
- Metatarsian I (Meta I): for lot I all parameters had an significant increase, which means a good evolution and a good response of this region under the rehabilitation program, due to a physiological position of the foot and reduction of the inversion and plantar flexion. For lot II we observed a decrease of the parameters (CA and Pmax).
- Metatarsian V (Meta V): increased in all parameters and this is corellated with the evolution of Meta I. This suggests that the longitudinal axis of the foot had a physiological loading for lot I, but at the same time for lot II we observed a decrease of CA and Pmax.
5. Conclusions
Author Contributions
Funding
Institutional Review Board Statement
Informed Consent Statement
Acknowledgments
Conflicts of Interest
References
- Ramsay, J.W.; Barrance, P.J.; Buchanan, T.S.; Higginson, J.S. Paretic muscle atrophy and non-contractile tissue content in individual muscles of the post-stroke lower extremity. J. Biomech. 2011, 44, 2741–2746. [Google Scholar] [CrossRef] [Green Version]
- Prado-Medeiros, C.L.; Silva, M.P.; Lessi, G.C. Muscle atrophy and functional deficits of knee extensors and flexors in people with chronic stroke. Phys. Ther. 2012, 92, 429–439. [Google Scholar] [CrossRef]
- Batchelor, F.A.; Mackintosh, S.F.; Said, C.M.; Hill, K.D. Falls after stroke. Int. J. Stroke 2012, 7, 482–485. [Google Scholar] [CrossRef]
- Mackintosh, S.F.; Goldie, P.; Hill, K. Falls incidence and factors associated with falling in older, community—Dwelling, chronic stroke survivors (>1 year after stroke) and matched controls. Aging Clin. Exp. Res. 2005, 17, 74–81. [Google Scholar] [CrossRef]
- Criciotoiu, A.O.; Stanca, D.I.; Bondari, S.; Malin, R.D.; Ciolofan, M.S.; Schenker, M. Correlation between the Age, Motor Subtypes and the Necessity of Advanced Therapy in Parkinson Disease. Rev. Chim. 2019, 70, 2128–2131. [Google Scholar] [CrossRef]
- Pinter, M.M.; Brainin, M. Rehabilitation after stroke in older people. Maturitas 2012, 71, 104–108. [Google Scholar] [CrossRef]
- Weerdesteyn, V.; De Niet, M.; van Duijnhoven, H.J.; Geurts, A.C. Falls in individuals with stroke. J. Rehabil. Res. Dev. 2008, 45, 1195–1198. [Google Scholar] [CrossRef]
- Caliskan Uckun, A.; Celik, C.; Ucan, H.; Ordu Gokkaya, N.K. Comparison of effects of lower extremity orthoses on energy expenditure in patients with cerebral palsy. Dev. Neurorehabilit. 2014, 179, 388–392. [Google Scholar] [CrossRef]
- Richards, A.; Morcos, S.; Rethlefsen, S.; Ryan, D. The use of TheraTogs versus twister cables in the treatment of in-toeing during gait in a child with spina bifida. Pediatric Phys. Ther. 2012, 24, 321–326. [Google Scholar] [CrossRef]
- Becerro-de-Bengoa-Vallejo, R.; Losa-Iglesias, M.E.; Rodriguez-Sanz, D. Static and dynamic plantar pressures in children with and without sever disease: A case-control study. Phys. Ther. 2014, 94, 818–826. [Google Scholar] [CrossRef] [Green Version]
- Winter, D.A. Human balance and posture control during standing and walking. Gait Posture 1995, 3, 193–214. [Google Scholar] [CrossRef]
- Fuller, E.A. Center of pressure and its theoretical relationship to foot pathology. J. Am. Podiatr. Med. Assoc. 1999, 89, 278–291. [Google Scholar] [CrossRef] [PubMed]
- Criciotoiu, A.O.; Stanca, D.I.; Glavan, D.G.; Bondari, S.; Malin, R.D.; Ciolofan, M.S. The Relations between Non-motor Symptoms and Motor Symptoms in Parkinson Disease. Rev. Chim. 2019, 70, 2652–2655. [Google Scholar] [CrossRef]
- Tavares, J.M.R.S.; Oliveira, F.P.M. Novel framework for registration of pedobarographic image data. Med. Biol. Eng. Comput. 2014, 9, 313–323. [Google Scholar]
- Keijsers, N.L.W.; Stolwijk, N.M.; Pataky, T.C. Linear dependence of peak, mean, and pressure—Time integral values in plantar pressure images. Gait Posture 2010, 31, 140–142. [Google Scholar] [CrossRef]
- Low, D.C.; Dixon, S.J. Footscan pressure insoles: Accuracy and reliability of force and pressure measurements in running. Gait Posture 2010, 32, 664–666. [Google Scholar] [CrossRef] [PubMed]
- Libardoni dos Santos, J.O.; Manfio, E.F.; Carpes, F.P.; Bezerra, E.S.; Palhano, R.; Avila, A.O.V. Change of Pronation Angle of the Subtalar Joint has Inluence on Plantar Pressure Distribution. Rev. Bras. Cineantropometria Desempenho Hum. 2017, 19, 316–322. [Google Scholar]
- Ivey, F.M.; Ryan, A.S.; Hafer-Macko, C.E.; Garrity, B.M.; Sorkin, J.D.; Goldberg, A.P.; Macko, R.F. High prevalence of abnormal glucose metabolism and poor sensitivity of fasting plasma glucose in the chronic phase of stroke. Cerebrovasc. Dis. 2006, 22, 368–371. [Google Scholar] [CrossRef]
- Tarnopolsky, M.A. Body-weight-support treadmill training improves blood glucose regulation in persons with incomplete spinal cord injury. J. Appl. Physiol. 2004, 97, 716–724. [Google Scholar]
- Chen, C.; Patten, C.; Kothari, D.H. Gait differences between individuals with post-stroke hemiparesis and non-disabled controls at matched speeds. Gait Posture 2005, 22, 51–56. [Google Scholar] [CrossRef]
- Panizzolo, F.; Lee, S.; Miyatake, T.; Rossi, D.M.; Siviy, C.; Speeckaert, J. Lower limb biomechanical analysis during an unanticipated step on a bump reveals specific adaptations of walking on uneven terrains. J. Exp. Biol. 2017, 220, 4169–4176. [Google Scholar] [CrossRef] [PubMed] [Green Version]
- Formisano, R.; Pantano, P.; Buzzi, M.G.; Vinicola, V.; Penta, F.; Barbanti, P.; Lenzi, G.L. Late motor recovery is influenced by muscle tone changes after stroke. Arch. Phys. Med. Rehabil. 2005, 86, 308–311. [Google Scholar] [CrossRef]
- Hsiao, H.Y.; Gray, V.L.; Borrelli, J. Biomechanical control of paretic lower limb during imposed weight transfer in individuals post-stroke. J. Neuroeng. Rehabil. 2020, 17, 140. [Google Scholar] [CrossRef]
- Frenkel-Toledo, S.; Ofir-Geva, S.; Mansano, L.; Granot, O.; Soroker, N. Stroke Lesion Impact on Lower Limb Function. Front. Hum. Neurosci. 2021, 15, 27. [Google Scholar] [CrossRef] [PubMed]
- Gray, C.K.; Culham, E. Sit-to-Stand in People with Stroke: Effect of Lower Limb Constraint-Induced Movement Strategies. Stroke Res. Treat. 2014, 2014, 683681. [Google Scholar] [CrossRef] [PubMed] [Green Version]
- Bernhardt, J. Very early mobilization following acute stroke: Controversies, the unknowns, and a way forward. Ann. Indian Acad. Neurol. 2008, 11, 88–98. [Google Scholar]
- Diserens, K.; Patrik, M.; Julien, B. Early mobilization after stroke. Cerebrovasc. Dis. 2006, 22, 2–3. [Google Scholar] [CrossRef]


| Lot | Test | F | p | Statistic Significance |
|---|---|---|---|---|
| group A | 1 | 1016.95 | <0.001 | Yes |
| 2 | 986.08 | <0.001 | Yes | |
| group B | 1 | 660.45 | <0.001 | Yes |
| 2 | 518.69 | <0.001 | Yes |
| Test | Test 1 Initial Test | Test 2 3 Weeks | Test 3 3 Months | Test 4 6 Months | Test 5 1 Year | Statistic Significance | |||||
|---|---|---|---|---|---|---|---|---|---|---|---|
| t | p | t | p | t | p | t | p | t | p | ||
| 1 | −5 | <0.001 | −1.91 * | 0.325 * | 2.32 *** | 0.022 *** | 3.11 | 0.002 | 3.36 | 0.001 | Yes |
| 2 | −5.53 | <0.001 | −2.46 ** | 0.016 ** | 2.81 | 0.006 | 5.45 | <0.001 | 7.08 | <0.001 | Yes |
| Lateral Heel | ||||
|---|---|---|---|---|
| T | Lot | Statistic Parameter | Contact Area (cm2) | Pmax (N/mm2) |
| T1 6 months | Lot I | average | 15.95 | 6.80 |
| dev.std. | 4.2508 | 5.4714 | ||
| Lot II | average | 17.49 | 6.24 | |
| dev.std. | 9.9963 | 3.8978 | ||
| Lot I/II | p | 0.4874 | 0.6895 | |
| T2 1 year | Lot I | average | 17.90 | 10.56 |
| dev.std. | 3.1388 | 7.3425 | ||
| Lot II | average | 17.97 | 7.99 | |
| dev.std. | 9.3480 | 5.0262 | ||
| Lot I/II | p | 0.9727 | 0.1563 | |
| Medial Heel | ||||
|---|---|---|---|---|
| T | Lot | Statistic Parameter | Contact Area (cm2) | Pmax (N/mm2) |
| T1 6 months | Lot I | average | 18.31 | 7.48 |
| dev.std. | 5.1069 | 5.3245 | ||
| Lot II | average | 18.60 | 6.43 | |
| dev.std. | 4.7670 | 3.8229 | ||
| Lot I/II | p | 0.8454 | 0.4422 | |
| T2 1 year | Lot I | average | 20.40 | 10.56 |
| dev.std. | 3.2666 | 7.3128 | ||
| Lot II | average | 19.67 | 7.05 | |
| dev.std. | 2.6819 | 4.9113 | ||
| Lot I/II | p | 0.3967 | 0.0540 | |
| Midfoot | ||||
|---|---|---|---|---|
| T | Lot | Statistic Parameter | Contact Area (cm2) | Pmax (N/mm2) |
| T1 6 months | Lot I | average | 43.10 | 2.83 |
| dev.std. | 14.1564 | 3.0215 | ||
| Lot II | average | 49.45 | 2.68 | |
| dev.std. | 24.3512 | 1.9230 | ||
| Lot I/II | p | 0.2691 | 0.8472 | |
| T2 1 year | Lot I | average | 45.85 | 4.88 |
| dev.std. | 11.2718 | 4.8778 | ||
| Lot II | average | 46.79 | 3.83 | |
| dev.std. | 14.0538 | 3.9213 | ||
| Lot I/II | p | 0.7953 | 0.4067 | |
| Meta 1 | ||||
|---|---|---|---|---|
| T | Lot | Statistic Parameter | Contact Area (cm2) | Pmax (N/mm2) |
| T1 6 months | Lot I | average | 13.64 | 4.10 |
| dev.std. | 4.5151 | 4.4424 | ||
| Lot II | average | 13.24 | 3.28 | |
| dev.std. | 4.7089 | 3.1724 | ||
| Lot I/II | p | 0.7756 | 0.4984 | |
| T2 1 year | Lot I | average | 15.52 | 6.30 |
| dev.std. | 4.3067 | 5.5708 | ||
| Lot II | media | 13.97 | 2.39 | |
| dev.std. | 5.0318 | 1.6515 | ||
| Lot I/II | p | 0.2630 | 0.0033 * | |
| Meta 5 | ||||
|---|---|---|---|---|
| T | Lot | Statistic Parameter | Contact Area (cm2) | Pmax (N/mm2) |
| T1 6 months | Lot I | average | 10.80 | 3.79 |
| dev.std. | 3.8836 | 3.7366 | ||
| Lot II | average | 10.64 | 4.13 | |
| dev.std. | 3.5676 | 4.5148 | ||
| Lot I/II | p | 0.8902 | 0.7889 | |
| T2 1 year | Lot I | average | 13.31 | 6.63 |
| dev.std. | 2.1230 | 7.1486 | ||
| Lot II | average | 11.93 | 6.78 | |
| dev.std. | 3.2544 | 7.7071 | ||
| Lot I/II | p | 0.0984 | 0.9456 | |
| Values p Kruskal–Wallis Test Test 1/Test 2 | |||
|---|---|---|---|
| Plantar Region | Lot | Contact Area | Pmax |
| Lateral heel | Lot I | 0.107 | 0.014 |
| Lot II | 0.834 | 0.441 | |
| Medial heel | Lot I | 0.066 | 0.066 |
| Lot II | 0.386 | 0.845 | |
| Midfoot | Lot I | 0.187 | 0.02 |
| Lot II | 0.522 | 0.337 | |
| Meta 1 | Lot I | 0.209 | 0.046 |
| Lot II | 0.718 | 0.483 | |
| Meta 5 | Lot I | 0.013 | 0.027 |
| Lot II | 0.208 | 0.153 | |
Publisher’s Note: MDPI stays neutral with regard to jurisdictional claims in published maps and institutional affiliations. |
© 2021 by the authors. Licensee MDPI, Basel, Switzerland. This article is an open access article distributed under the terms and conditions of the Creative Commons Attribution (CC BY) license (https://creativecommons.org/licenses/by/4.0/).
Share and Cite
Rusu, L.; Paun, E.; Marin, M.I.; Hemanth, J.; Rusu, M.R.; Calina, M.L.; Bacanoiu, M.V.; Danoiu, M.; Danciulescu, D. Plantar Pressure and Contact Area Measurement of Foot Abnormalities in Stroke Rehabilitation. Brain Sci. 2021, 11, 1213. https://doi.org/10.3390/brainsci11091213
Rusu L, Paun E, Marin MI, Hemanth J, Rusu MR, Calina ML, Bacanoiu MV, Danoiu M, Danciulescu D. Plantar Pressure and Contact Area Measurement of Foot Abnormalities in Stroke Rehabilitation. Brain Sciences. 2021; 11(9):1213. https://doi.org/10.3390/brainsci11091213
Chicago/Turabian StyleRusu, Ligia, Elvira Paun, Mihnea Ion Marin, Jude Hemanth, Mihai Robert Rusu, Mirela Lucia Calina, Manuela Violeta Bacanoiu, Mircea Danoiu, and Daniel Danciulescu. 2021. "Plantar Pressure and Contact Area Measurement of Foot Abnormalities in Stroke Rehabilitation" Brain Sciences 11, no. 9: 1213. https://doi.org/10.3390/brainsci11091213